Embed Size (px)
Citation preview
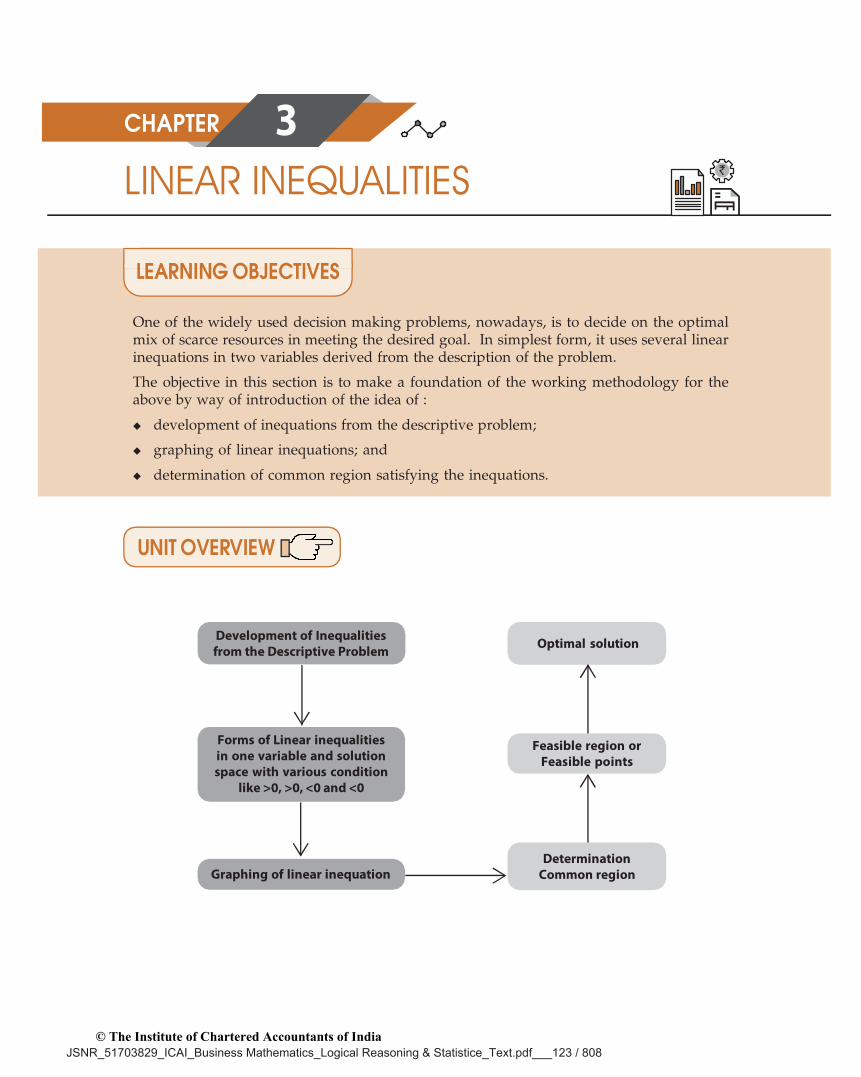
UNIT OVERVIEW
LINEAR INEQUALITIES3CHAPTER
Development of Inequalitiesfrom the Descriptive Problem
Forms of Linear inequalitiesin one variable and solutionspace with various condition
like >0, >0, <0 and <0
Graphing of linear inequationDetermination
Common region
Optimal solution
LEARNING OBJECTIVES
One of the widely used decision making problems, nowadays, is to decide on the optimalmix of scarce resources in meeting the desired goal. In simplest form, it uses several linearinequations in two variables derived from the description of the problem.
The objective in this section is to make a foundation of the working methodology for theabove by way of introduction of the idea of :
development of inequations from the descriptive problem;
graphing of linear inequations; and
determination of common region satisfying the inequations.
Feasible region orFeasible points
JSNR_51703829_ICAI_Business Mathematics_Logical Reasoning & Statistice_Text.pdf___123 / 808© The Institute of Chartered Accountants of India
BUSINESS MATHEMATICS3.2
3.1 INEQUALITIESInequalities are statements where two quantities are unequal but a relationship exists betweenthem. These type of inequalities occur in business whenever there is a limit on supply, demand,sales etc. For example, if a producer requires a certain type of raw material for his factory andthere is an upper limit in the availability of that raw material, then any decision which he takesabout production should involve this constraint also. We will see in this chapter more aboutsuch situations.
3.2LINEAR INEQUALITIES IN ONE VARIABLE AND THESOLUTION SPACEAny linear function that involves an inequality sign is a linear inequality. It may be of onevariable, or, of more than one variable. Simple example of linear inequalities are those of onevariable only; viz., x > 0, x < 0 etc.
x 0
– 3 – 2 – 1 0 1 2 3
x > 0
– 3 – 2 – 1 0 1 2 3
x > O x > Ox > Oy > O
x > Oy > O
y y y y
xxxx
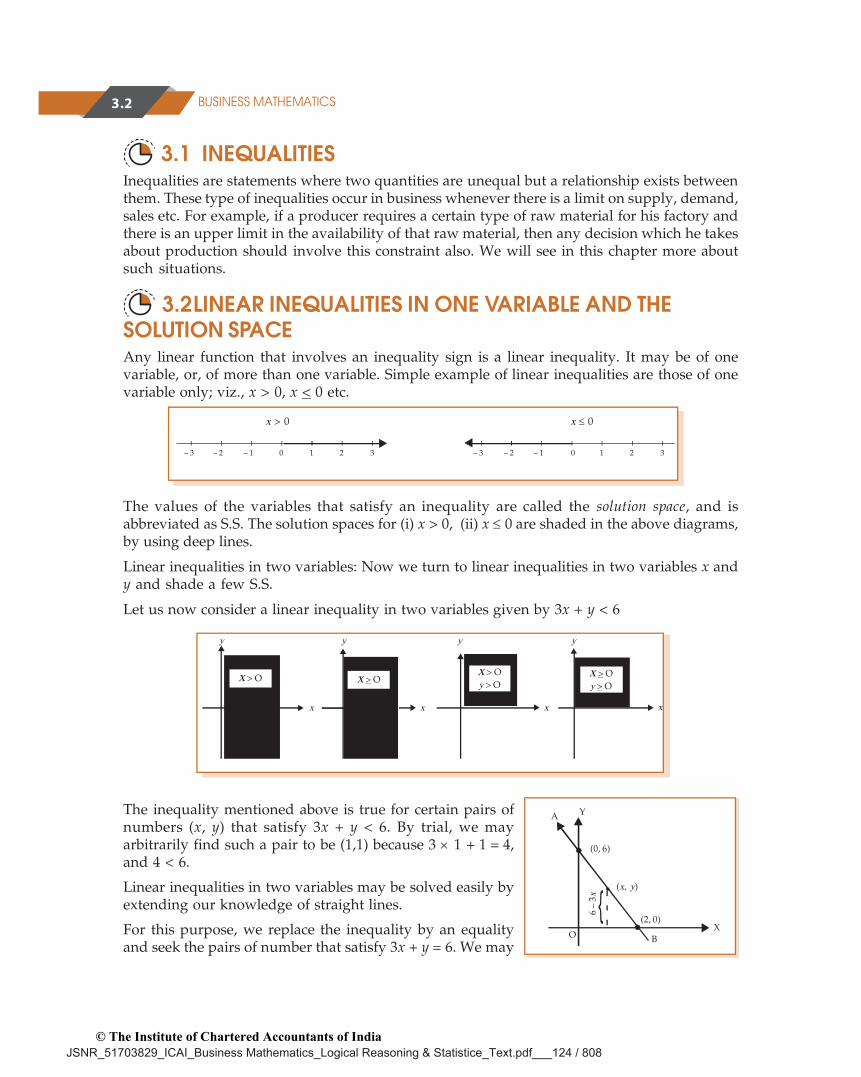
The inequality mentioned above is true for certain pairs ofnumbers (x, y) that satisfy 3x + y < 6. By trial, we mayarbitrarily find such a pair to be (1,1) because 3 1 + 1 = 4,and 4 < 6.
Linear inequalities in two variables may be solved easily byextending our knowledge of straight lines.
For this purpose, we replace the inequality by an equalityand seek the pairs of number that satisfy 3x + y = 6. We may
The values of the variables that satisfy an inequality are called the solution space, and isabbreviated as S.S. The solution spaces for (i) x > 0, (ii) x 0 are shaded in the above diagrams,by using deep lines.
Linear inequalities in two variables: Now we turn to linear inequalities in two variables x andy and shade a few S.S.
Let us now consider a linear inequality in two variables given by 3x + y < 6
YA
O BX
(2, 0)
(x, y)
(0, 6)
6 –
3x {
JSNR_51703829_ICAI_Business Mathematics_Logical Reasoning & Statistice_Text.pdf___124 / 808© The Institute of Chartered Accountants of India
3.3LINEAR INEQUALITIES
write 3x + y = 6 as y = 6 – 3x, and draw the graph of this linear function.
Let x = 0 so that y = 6. Let y = 0, so that x = 2.
Any pair of numbers (x, y) that satisfies the equation y = 6 – 3x falls on the line AB.
Note: The pair of inequalities x 0, y 0 play an important role in linear programming problems.
Therefore, if y is to be less than 6 – 3x for the same value of x, it must assume a value that is lessthan the ordinate of length 6 – 3x.
All such points (x, y) for which the ordinate is less than 6 – 3x lie below the line AB.
The region where these points fall is indicated by anarrow and is shaded too in the adjoining diagram. Nowwe consider two inequalities 3x + y 6 and x – y –2 being satisfied simultaneously by x and y. The pairsof numbers (x, y) that satisfy both the inequalities maybe found by drawing the graphs of the two lines y = 6– 3x and y = 2 + x, and determining the region whereboth the inequalities hold. It is convenient to expresseach equality with y on the left-side and the remainingterms in the right side. The first inequality 3x + y 6 isequivalent to y 6 – 3x and it requires the value of yfor each x to be less than or equal to that of and on 6 –3x. The inequality is therefore satisfied by all pointslying below the line y = 6 – 3x. The region where thesepoints fall has been shaded in the adjoining diagram.
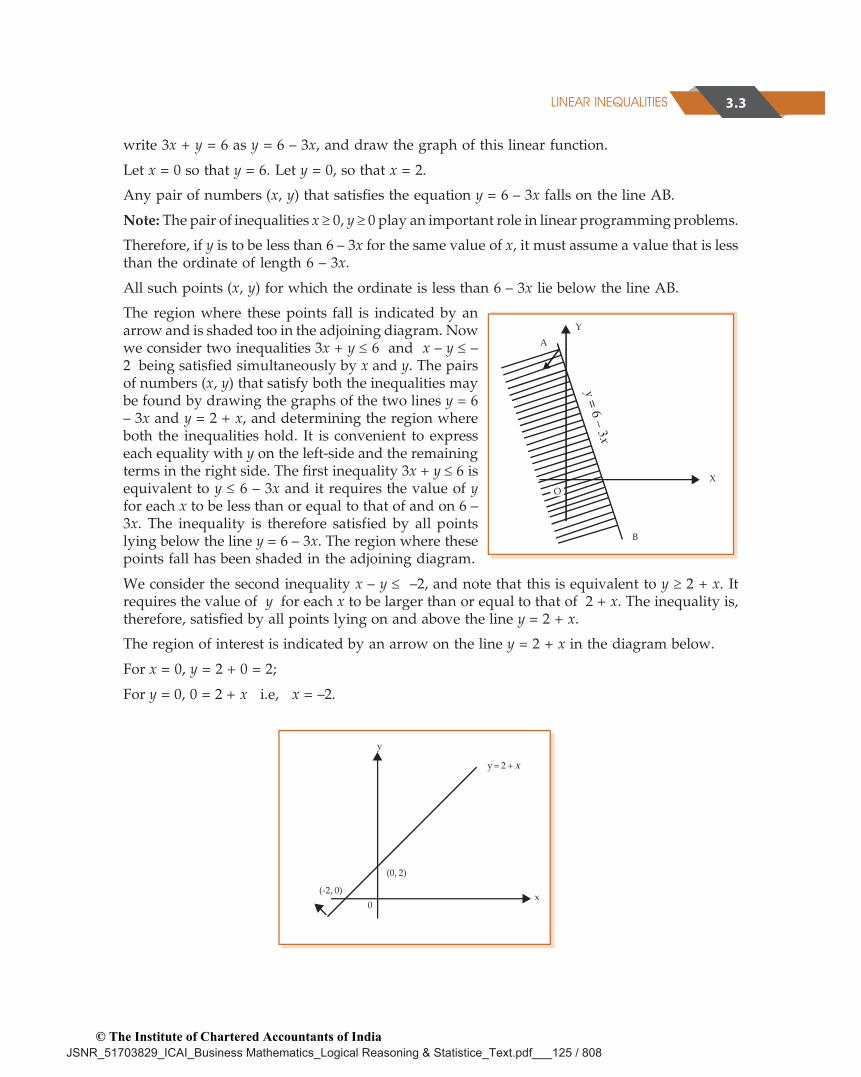
We consider the second inequality x – y –2, and note that this is equivalent to y 2 + x. Itrequires the value of y for each x to be larger than or equal to that of 2 + x. The inequality is,therefore, satisfied by all points lying on and above the line y = 2 + x.
The region of interest is indicated by an arrow on the line y = 2 + x in the diagram below.
For x = 0, y = 2 + 0 = 2;
For y = 0, 0 = 2 + x i.e, x = –2.
Y
X
B
A
y = 6 – 3x
O
y = 2 + x
x0
(-2, 0)
(0, 2)
y
JSNR_51703829_ICAI_Business Mathematics_Logical Reasoning & Statistice_Text.pdf___125 / 808© The Institute of Chartered Accountants of India
BUSINESS MATHEMATICS3.4
By superimposing the above two graphs we determine the common region ACD in which thepairs (x, y) satisfy both inequalities.
Y
XO
A
y = 2 + x
C
Dy = 6 – 3x
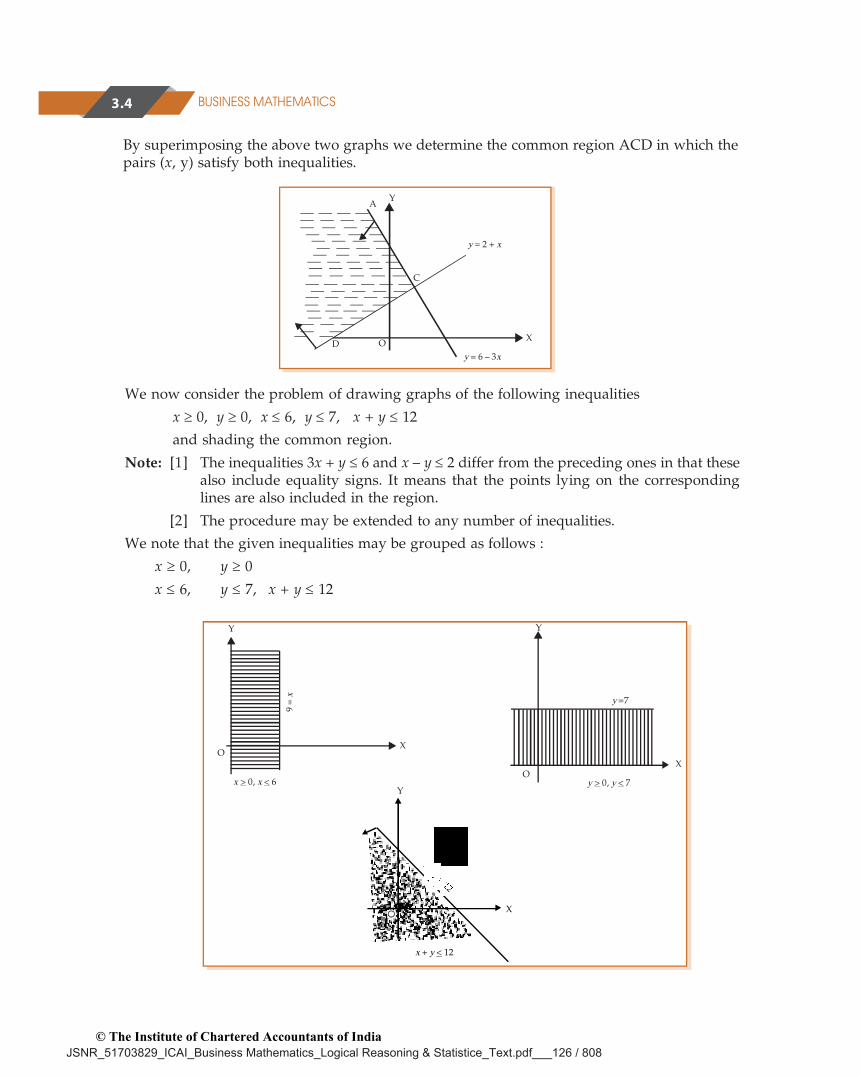
We now consider the problem of drawing graphs of the following inequalities
x 0, y 0, x 6, y 7, x + y 12
and shading the common region.
Note: [1] The inequalities 3x + y 6 and x – y 2 differ from the preceding ones in that thesealso include equality signs. It means that the points lying on the correspondinglines are also included in the region.
[2] The procedure may be extended to any number of inequalities.
We note that the given inequalities may be grouped as follows :
x 0, y 0
x 6, y 7, x + y 12
Y
XO
y > 0, y < 7
y =7
x > 0, x < 6
X
Y
9 =
x
O
x + y < 12
Y
X
JSNR_51703829_ICAI_Business Mathematics_Logical Reasoning & Statistice_Text.pdf___126 / 808© The Institute of Chartered Accountants of India
3.5LINEAR INEQUALITIES
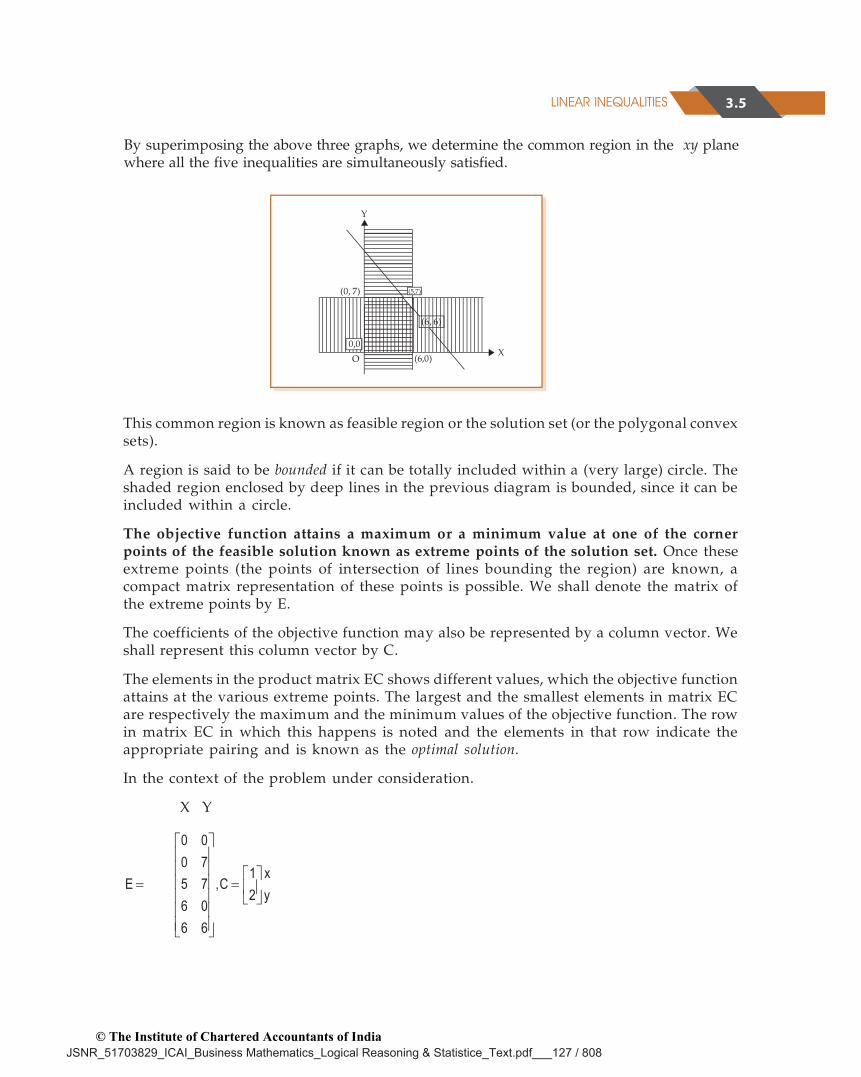
By superimposing the above three graphs, we determine the common region in the xy planewhere all the five inequalities are simultaneously satisfied.
OX
(0, 7)
Y
(5,7)
(6,0)
(6, 6)
0,0
This common region is known as feasible region or the solution set (or the polygonal convexsets).
A region is said to be bounded if it can be totally included within a (very large) circle. Theshaded region enclosed by deep lines in the previous diagram is bounded, since it can beincluded within a circle.
The objective function attains a maximum or a minimum value at one of the cornerpoints of the feasible solution known as extreme points of the solution set. Once theseextreme points (the points of intersection of lines bounding the region) are known, acompact matrix representation of these points is possible. We shall denote the matrix ofthe extreme points by E.
The coefficients of the objective function may also be represented by a column vector. Weshall represent this column vector by C.
The elements in the product matrix EC shows different values, which the objective functionattains at the various extreme points. The largest and the smallest elements in matrix ECare respectively the maximum and the minimum values of the objective function. The rowin matrix EC in which this happens is noted and the elements in that row indicate theappropriate pairing and is known as the optimal solution.
In the context of the problem under consideration.
X Y
0 00 7
1 xE ,C5 7
2 y6 06 6
JSNR_51703829_ICAI_Business Mathematics_Logical Reasoning & Statistice_Text.pdf___127 / 808© The Institute of Chartered Accountants of India
BUSINESS MATHEMATICS3.6
0 0 0 1 0 2 00 7 0 1 7 2 14
1EC 5 7 5 1 7 2 19
26 0 6 1 0 2 66 6 6 1 6 2 18
The given objective function viz. Z = x + 2y is maximum at the points (5, 7) present in thethird row of the matrix E. Thus the optimal solution is x = 5, y = 7, and the maximumvalue of the objective function is 19.
We now list the steps to be followed under graphical solution to a linear programming problem.
Step 1 Determine the region that satisfies the set of given inequalities.
Step 2 Ensure that the region is bounded*. If the region is not bounded, either there areadditional hidden conditions which can be used to bound the region or there is nosolution to the problem.
Step 3 Construct the matrix E of the extreme points, and the column vector C of theobjective function.
Step 4 Find the matrix product EC. For maximization, determine the row in EC wherethe largest element appears; while for minimization, determine the row in ECwhere the smallest element appears.
Step 5 The objective function is optimized corresponding to the same row elements ofthe extreme point matrix E.
Note: If the slope of the objective function be same as that of one side of feasible region,there are multiple solutions to the problem. However, the optimized value of theobjective function remains the same.
Example:
A manufacturer produces two products A and B, and has his machines in operation for 24 hoursa day. Production of A requires 2 hours of processing in machine M1 and 6 hours in machine M2.Production of B requires 6 hours of processing in machine M1 and 2 hours in machine M2. Themanufacturer earns a profit of ` 5 on each unit of A and ` 2 on each unit of B. How many unitsof each product should be produced in a day in order to achieve maximum profit?
Solution:
Let x1 be the number of units of type A product to be produced, and x2 is that of type Bproduct to be produced. The formulation of the L.P.P. in this case is as below:
Maximize Z = 5x1 + 2x2
* It is inconceivable for a practical problem to have an unbounded solution.
JSNR_51703829_ICAI_Business Mathematics_Logical Reasoning & Statistice_Text.pdf___128 / 808© The Institute of Chartered Accountants of India
3.7LINEAR INEQUALITIES
subject to the constraints.
2x1 + 6x2< 24
6x1 + 2x2< 24
x1 > 0, x2 > 0
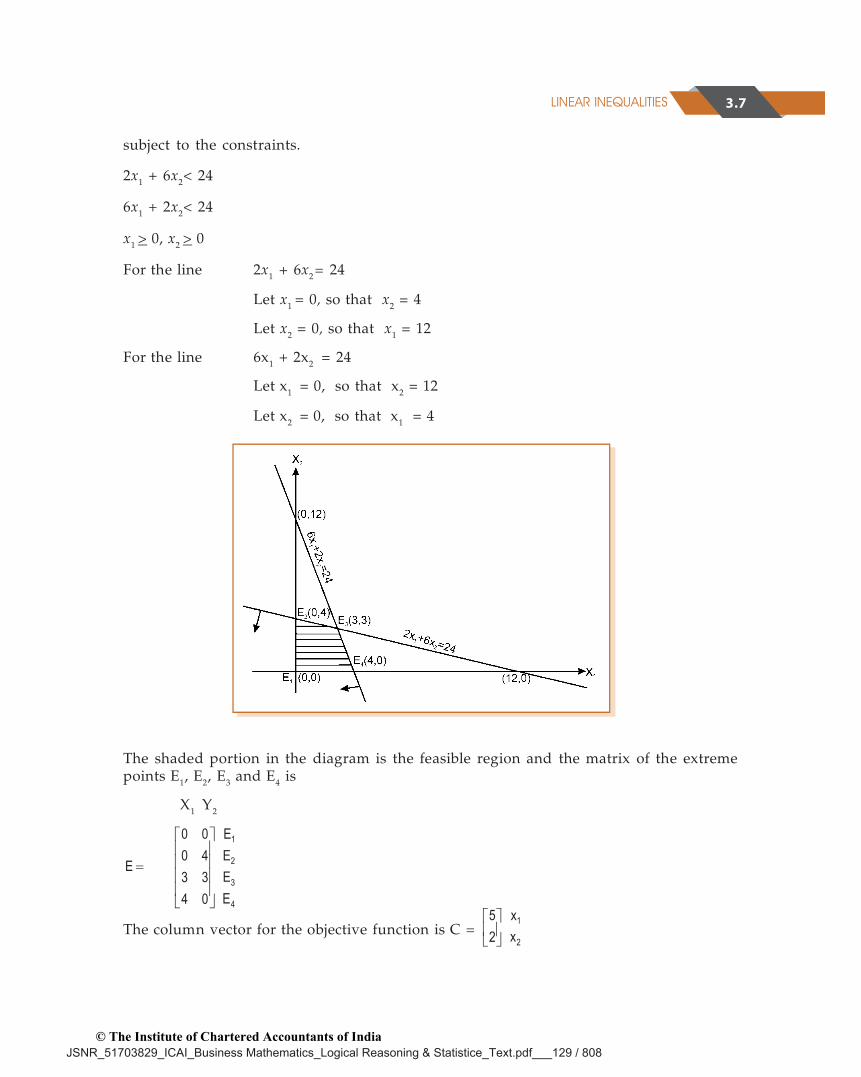
For the line 2x1 + 6x2= 24
Let x1 = 0, so that x2 = 4
Let x2 = 0, so that x1 = 12
For the line 6x1 + 2x2 = 24
Let x1 = 0, so that x2 = 12
Let x2 = 0, so that x1 = 4
The shaded portion in the diagram is the feasible region and the matrix of the extremepoints E1, E2, E3 and E4 is
X1 Y2
1
2
3
4
E0 0E0 4
EE3 3E4 0
The column vector for the objective function is C = 1
2
x5x2
JSNR_51703829_ICAI_Business Mathematics_Logical Reasoning & Statistice_Text.pdf___129 / 808© The Institute of Chartered Accountants of India
BUSINESS MATHEMATICS3.8
The column vector the values of the objective function is given by
1
2
3
4
E0 0 0 5 0 2 0E0 4 5 0 5 4 2 8
ECE3 3 2 3 5 3 2 21E4 0 4 5 0 2 20
Since 21 is the largest element in matrix EC, therefore the maximum value is reached atthe extreme point E3 whose coordinates are (3,3).
Thus, to achieve maximum profit the manufacturer should produce 3 units each of boththe products A and B.
Summary of Graphical Method
It involves:
(i) Formulating the linear programming problem, i.e. expressing the objective functionand constraints in the standardised format.
(ii) Plotting the capacity constraints on the graph paper. For this purpose normally twoterminal points are required. This is done by presuming simultaneously that one ofthe constraints is zero. When constraints concerns only one factor, then line will haveonly one origin point and it will run parallel to the other axis.
(iii) Identifying feasible region and coordinates of corner points. Mostly it is done bybreading the graph, but a point can be identified by solving simultaneous equationrelating to two lines which intersect to form a point on graph.
(iv) Testing the corner point which gives maximum profit. For this purpose the coordinatesrelating to the corner point should put in objectives function and the optimal pointshould be ascertained.
(v) For decision – making purpose, sometimes, it is required to know whether optimalpoint leaves some resources unutilized. For this purpose value of coordinates at theoptimal point should be put with constraint to find out which constraints are notfully utilized.
Example: A company produces two products A and B, each of which requires processing intwo machines. The first machine can be used at most for 60 hours, the second machine can beused at most for 40 hours. The product A requires 2 hours on machine one and one hour onmachine two. The product B requires one hour on machine one and two hours on machinetwo. Express above situation using linear inequalities.
Solution: Let the company produce, x number of product A and y number of product B. Aseach of product A requires 2 hours in machine one and one hour in machine two, x number ofproduct A requires 2x hours in machine one and x hours in machine two. Similarly, y number
JSNR_51703829_ICAI_Business Mathematics_Logical Reasoning & Statistice_Text.pdf___130 / 808© The Institute of Chartered Accountants of India
3.9LINEAR INEQUALITIES
of product B requires y hours in machine one and 2y hours in machine two. But machine onecan be used for 60 hours and machine two for 40 hours. Hence 2x + y cannot exceed 60 andx + 2y cannot exceed 40. In other words,
2x + y 60 and x + 2y 40.
Thus, the conditions can be expressed using linear inequalities.
Example: A fertilizer company produces two types of fertilizers called grade I and grade II.Each of these types is processed through two critical chemical plant units. Plant A has maximumof 120 hours available in a week and plant B has maximum of 180 hours available in a week.Manufacturing one bag of grade I fertilizer requires 6 hours in plant A and 4 hours in plant B.Manufacturing one bag of grade II fertilizer requires 3 hours in plant A and 10 hours in plantB. Express this using linear inequalities.
Solution: Let us denote by x1, the number of bags of fertilizers of grade I and by x2, the numberof bags of fertilizers of grade II produced in a week. We are given that grade I fertilizer requires6 hours in plant A and grade II fertilizer requires 3 hours in plant A and plant A has maximumof 120 hours available in a week. Thus 6x1 + 3x2 120.
Similarly grade I fertilizer requires 4 hours in plant B and grade II fertilizer requires 10 hours inPlant B and Plant B has maximum of 180 hours available in a week. Hence, we get the inequality4x1 + 10x2 180.
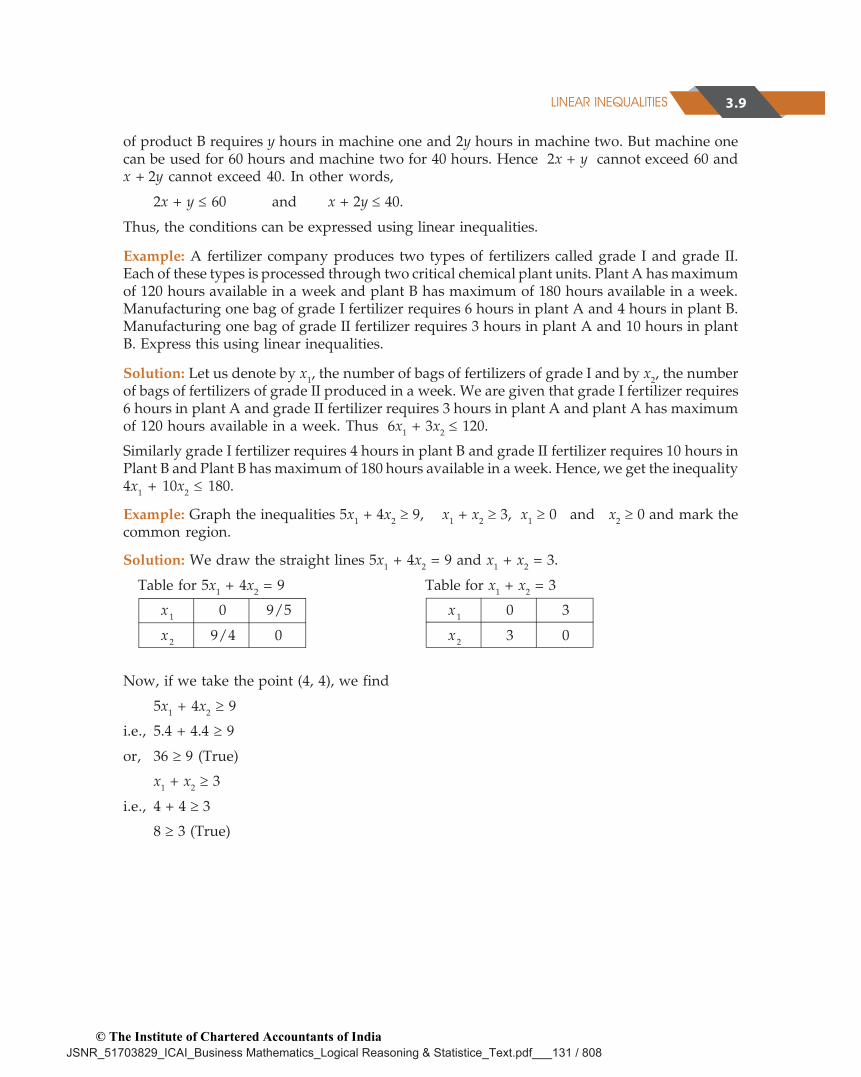
Example: Graph the inequalities 5x1 + 4x2 9, x1 + x2 3, x1 0 and x20 and mark thecommon region.
Solution: We draw the straight lines 5x1 + 4x2 = 9 and x1 + x2 = 3.
Table for 5x1 + 4x2 = 9 Table for x1 + x2 = 3
x1 0 9/5 x1 0 3
x2 9/4 0 x2 3 0
Now, if we take the point (4, 4), we find
5x1 + 4x2 9
i.e., 5.4 + 4.4 9
or, 36 9 (True)
x1 + x2 3
i.e., 4 + 4 3
8 3 (True)
JSNR_51703829_ICAI_Business Mathematics_Logical Reasoning & Statistice_Text.pdf___131 / 808© The Institute of Chartered Accountants of India
BUSINESS MATHEMATICS3.10
Hence (4, 4) is in the region which satisfies theinequalities.
We mark the region being satisfied by theinequalities and note that the cross-hatchedregion is satisfied by all the inequalities.
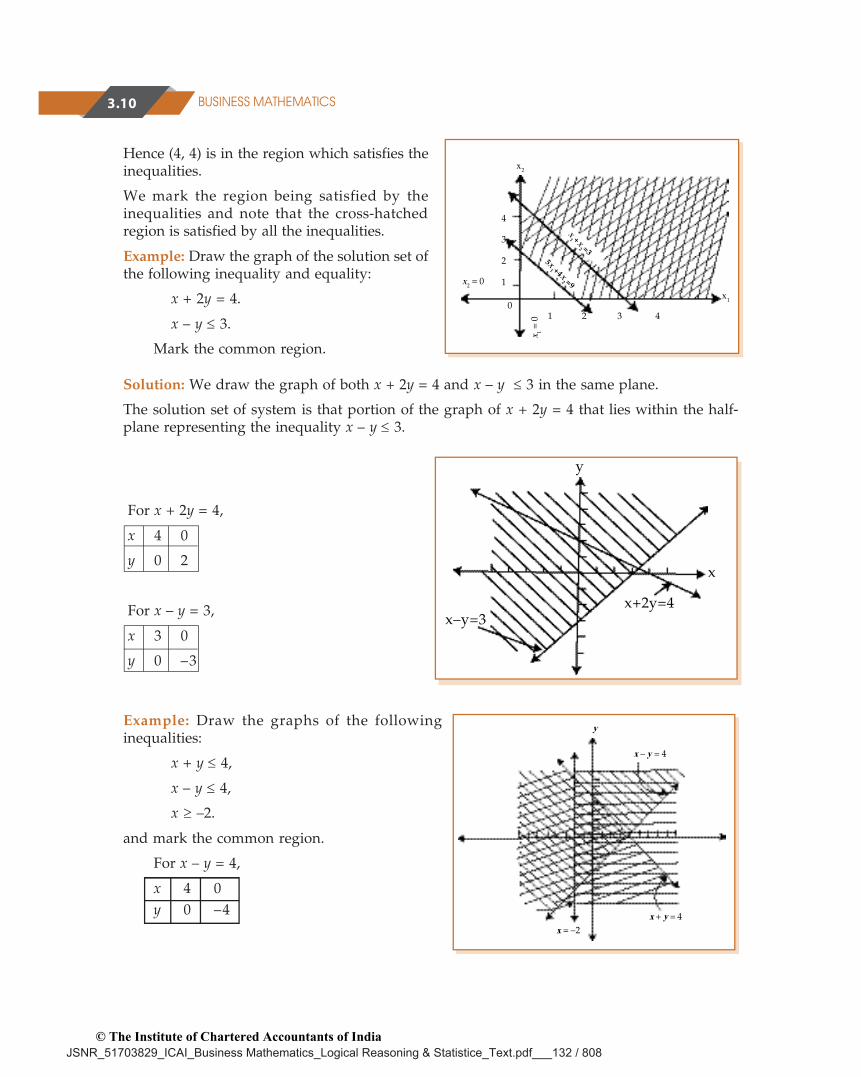
Example: Draw the graph of the solution set ofthe following inequality and equality:
x + 2y = 4.
x – y 3.
Mark the common region.
Solution: We draw the graph of both x + 2y = 4 and x – y 3 in the same plane.
The solution set of system is that portion of the graph of x + 2y = 4 that lies within the half-plane representing the inequality x – y 3.
x2 = 0
x1 +x
2 =35x
1 +4x2 =9
x2
4
3
2
1
x 1 = 0 1 2 3 4
x10
y
x
x–y=3x+2y=4
For x + 2y = 4,
x 4 0
y 0 2
For x – y = 3,
x 3 0
y 0 –3
Example: Draw the graphs of the followinginequalities:
x + y 4,
x – y 4,
x –2.
and mark the common region.
For x – y = 4,
x 4 0y 0 –4
x
y
x + y = 4x = –2
x – y = 4
JSNR_51703829_ICAI_Business Mathematics_Logical Reasoning & Statistice_Text.pdf___132 / 808© The Institute of Chartered Accountants of India
3.11LINEAR INEQUALITIES
x 400 0y 0 250
x 200 0y 0 350
For x + y = 4,
x 0 4y 4 0
The common region is the one represented by overlapping of the shadings.
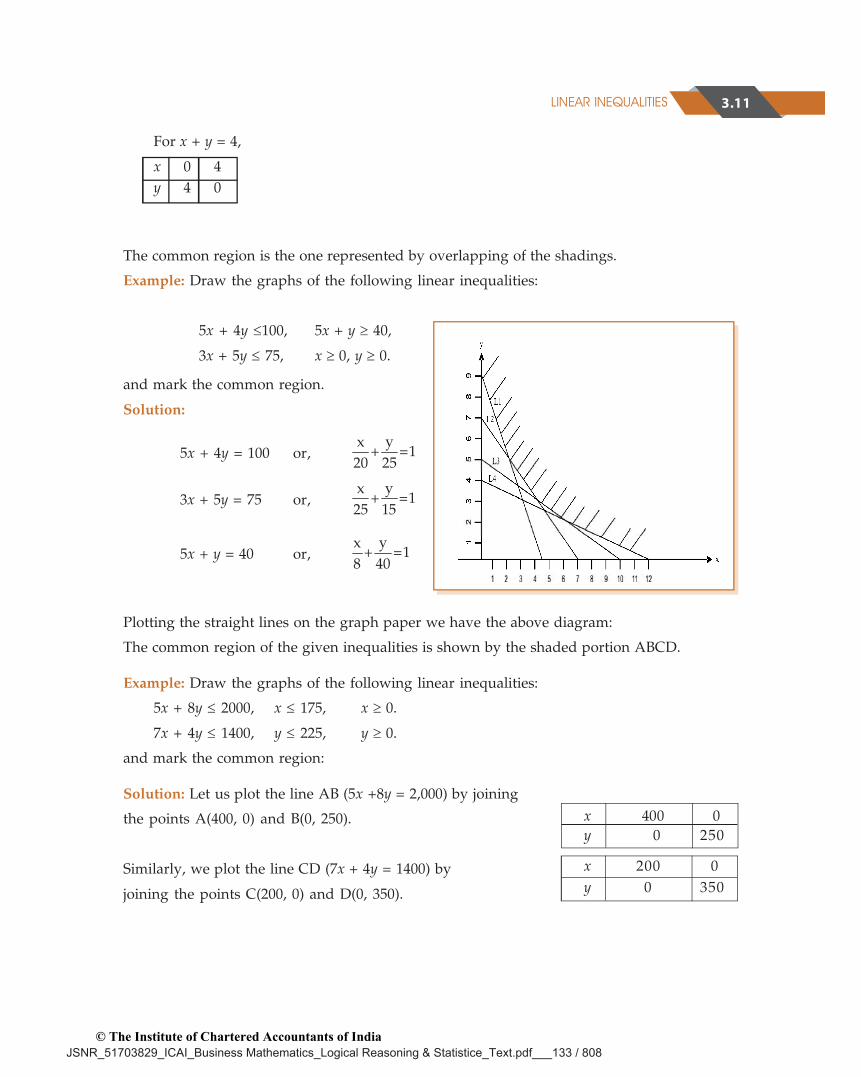
Example: Draw the graphs of the following linear inequalities:
5x + 4y 100, 5x + y 40,
3x + 5y 75, x 0, y 0.
and mark the common region.
Solution:
5x + 4y = 100 or,yx
+ =120 25
3x + 5y = 75 or,yx
+ =125 15
5x + y = 40 or,yx
+ =18 40
Plotting the straight lines on the graph paper we have the above diagram:
The common region of the given inequalities is shown by the shaded portion ABCD.
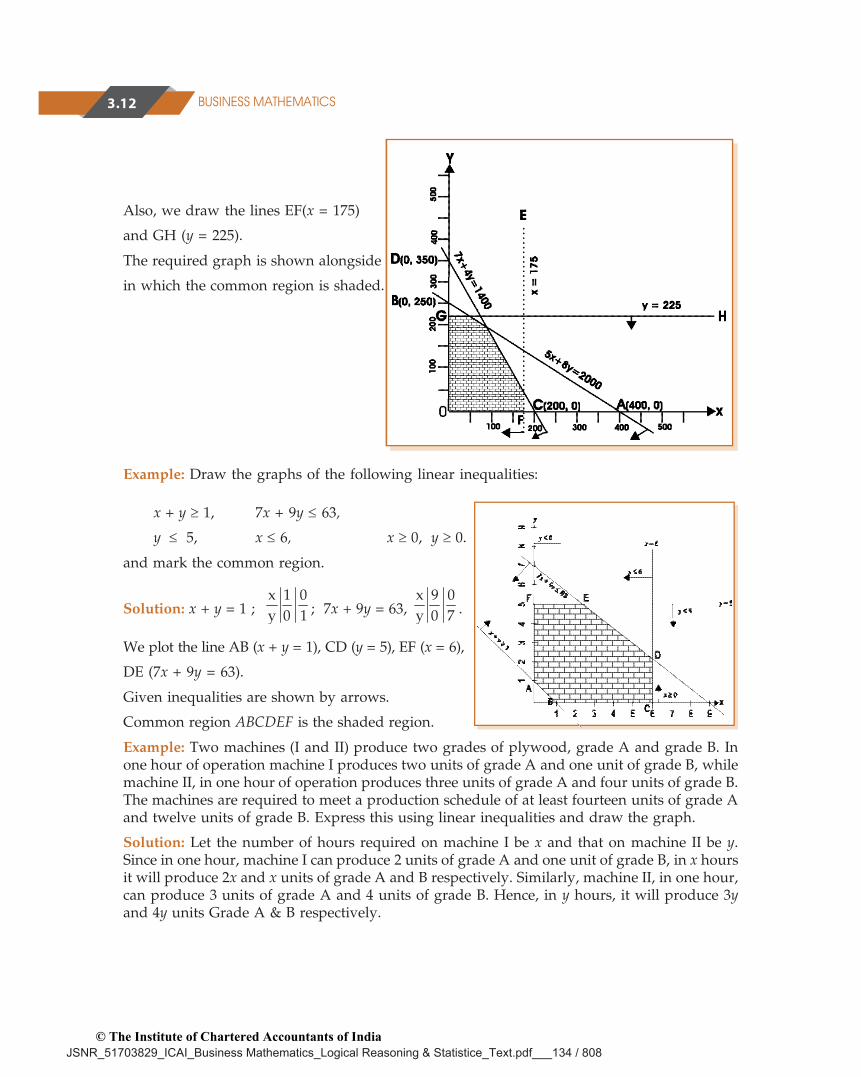
Example: Draw the graphs of the following linear inequalities:
5x + 8y 2000, x 175, x0.
7x + 4y 1400, y 225, y 0.
and mark the common region:
Solution: Let us plot the line AB (5x +8y = 2,000) by joining
the points A(400, 0) and B(0, 250).
Similarly, we plot the line CD (7x + 4y = 1400) by
joining the points C(200, 0) and D(0, 350).
JSNR_51703829_ICAI_Business Mathematics_Logical Reasoning & Statistice_Text.pdf___133 / 808© The Institute of Chartered Accountants of India
BUSINESS MATHEMATICS3.12
Also, we draw the lines EF(x = 175)
and GH (y = 225).
The required graph is shown alongside
in which the common region is shaded.
Example: Draw the graphs of the following linear inequalities:
x + y 1, 7x + 9y 63,
y 5, x 6, x 0, y 0.
and mark the common region.
Solution: x + y = 1 ; x 1 0y 0 1 ; 7x + 9y = 63,
x 9 0y 0 7 .
We plot the line AB (x + y = 1), CD (y = 5), EF (x = 6),
DE (7x + 9y = 63).
Given inequalities are shown by arrows.
Common region ABCDEF is the shaded region.
Example: Two machines (I and II) produce two grades of plywood, grade A and grade B. Inone hour of operation machine I produces two units of grade A and one unit of grade B, whilemachine II, in one hour of operation produces three units of grade A and four units of grade B.The machines are required to meet a production schedule of at least fourteen units of grade Aand twelve units of grade B. Express this using linear inequalities and draw the graph.
Solution: Let the number of hours required on machine I be x and that on machine II be y.Since in one hour, machine I can produce 2 units of grade A and one unit of grade B, in x hoursit will produce 2x and x units of grade A and B respectively. Similarly, machine II, in one hour,can produce 3 units of grade A and 4 units of grade B. Hence, in y hours, it will produce 3yand 4y units Grade A & B respectively.
JSNR_51703829_ICAI_Business Mathematics_Logical Reasoning & Statistice_Text.pdf___134 / 808© The Institute of Chartered Accountants of India
3.13LINEAR INEQUALITIES
x+4y
2x+3y
4.66
y
0
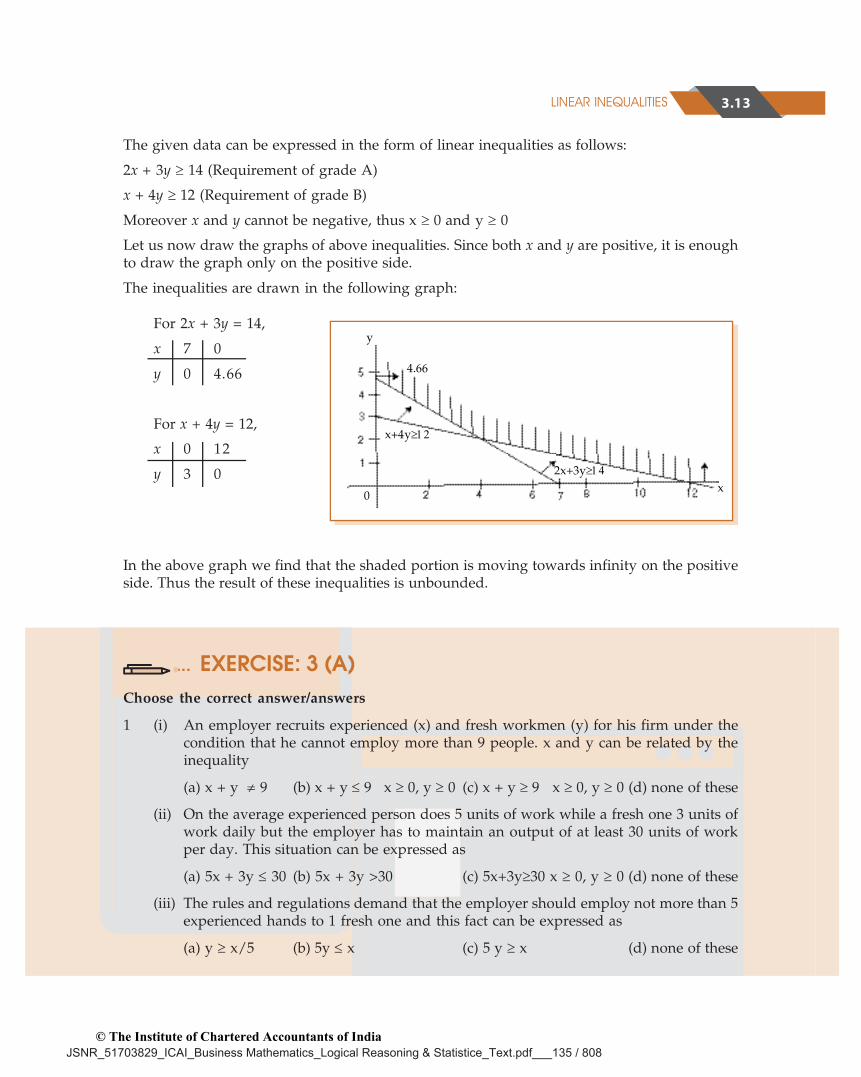
The given data can be expressed in the form of linear inequalities as follows:
2x + 3y 14 (Requirement of grade A)
x + 4y 12 (Requirement of grade B)
Moreover x and y cannot be negative, thus x 0 and y 0
Let us now draw the graphs of above inequalities. Since both x and y are positive, it is enoughto draw the graph only on the positive side.
The inequalities are drawn in the following graph:
For 2x + 3y = 14,
x 7 0
y 0 4.66
For x + 4y = 12,
x 0 12
y 3 0
In the above graph we find that the shaded portion is moving towards infinity on the positiveside. Thus the result of these inequalities is unbounded.
EXERCISE: 3 (A)Choose the correct answer/answers
1 (i) An employer recruits experienced (x) and fresh workmen (y) for his firm under thecondition that he cannot employ more than 9 people. x and y can be related by theinequality
(a) x + y 9 (b) x + y 9 x 0, y 0 (c) x + y 9 x 0, y 0 (d) none of these
(ii) On the average experienced person does 5 units of work while a fresh one 3 units ofwork daily but the employer has to maintain an output of at least 30 units of workper day. This situation can be expressed as
(a) 5x + 3y 30 (b) 5x + 3y >30 (c) 5x+3y30 x 0, y 0 (d) none of these
(iii) The rules and regulations demand that the employer should employ not more than 5experienced hands to 1 fresh one and this fact can be expressed as
(a) y x/5 (b) 5y x (c) 5 y x (d) none of these
x
JSNR_51703829_ICAI_Business Mathematics_Logical Reasoning & Statistice_Text.pdf___135 / 808© The Institute of Chartered Accountants of India
BUSINESS MATHEMATICS3.14
(iv) The union however forbids him to employ less than 2 experienced person to eachfresh person. This situation can be expressed as
(a) x y/2 (b) y x/2 (c) y x /2 (d) x 2y
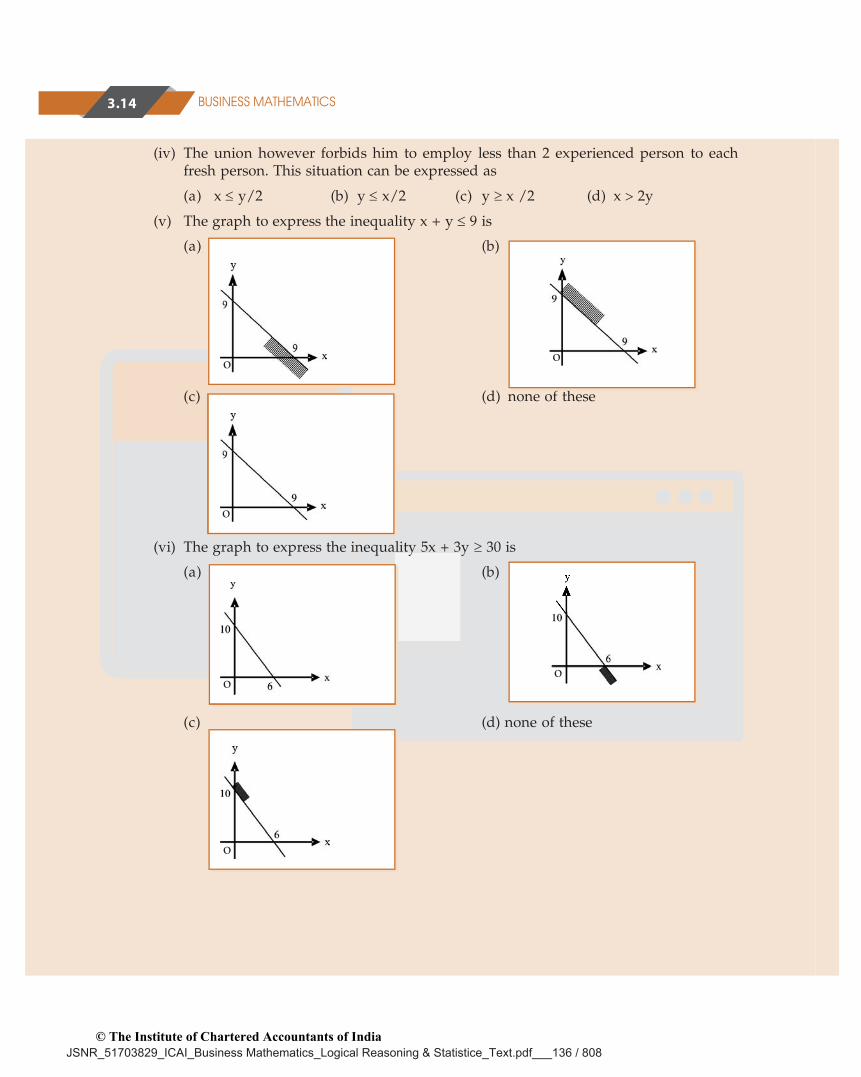
(v) The graph to express the inequality x + y 9 is
(a) (b)
(c) (d) none of these
(vi) The graph to express the inequality 5x + 3y 30 is
(a) (b)
(c) (d) none of these
o
o
o
o
o
o
JSNR_51703829_ICAI_Business Mathematics_Logical Reasoning & Statistice_Text.pdf___136 / 808© The Institute of Chartered Accountants of India
3.15LINEAR INEQUALITIES
o
o o
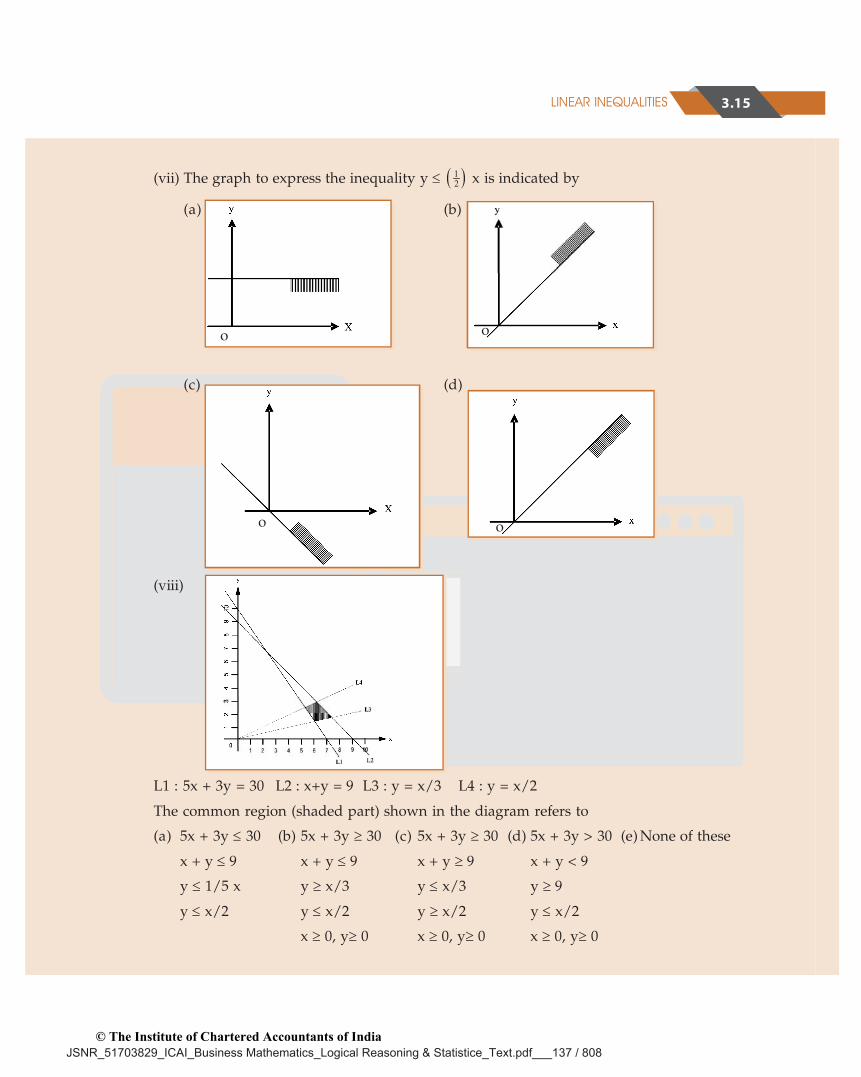
(vii) The graph to express the inequality y 12 x is indicated by
(a) (b)
(c) (d)
(viii)
L1 : 5x + 3y = 30 L2 : x+y = 9 L3 : y = x/3 L4 : y = x/2
The common region (shaded part) shown in the diagram refers to
(a) 5x + 3y 30 (b) 5x + 3y 30 (c) 5x + 3y 30 (d) 5x + 3y > 30 (e) None of these
x + y 9 x + y 9 x + y 9 x + y < 9
y 1/5 x y x/3 y x/3 y 9
y x/2 y x/2 y x/2 y x/2
x 0, y 0 x 0, y 0 x 0, y 0
o
JSNR_51703829_ICAI_Business Mathematics_Logical Reasoning & Statistice_Text.pdf___137 / 808© The Institute of Chartered Accountants of India
BUSINESS MATHEMATICS3.16
2. A dietitian wishes to mix together two kinds of food so that the vitamin content of themixture is at least 9 units of vitamin A, 7 units of vitamin B, 10 units of vitamin C and 12units of vitamin D. The vitamin content per Kg. of each food is shown below:
A B C D
Food I : 2 1 1 2
Food II: 1 1 2 3
Assuming x units of food I is to be mixed with y units of food II the situation can beexpressed as
(a) 2x + y 9 (b) 2x + y 30 (c) 2x + y 9 (d) 2x + y 9
x + y 7 x + y 7 x + y 7 x + y 7
x + 2y 10 x + 2y 10 x + y 10 x +2 y 10
2x +3 y 12 x + 3y 12 x + 3y 12 2x +3 y 12
x > 0, y > 0 x 0, y 0,
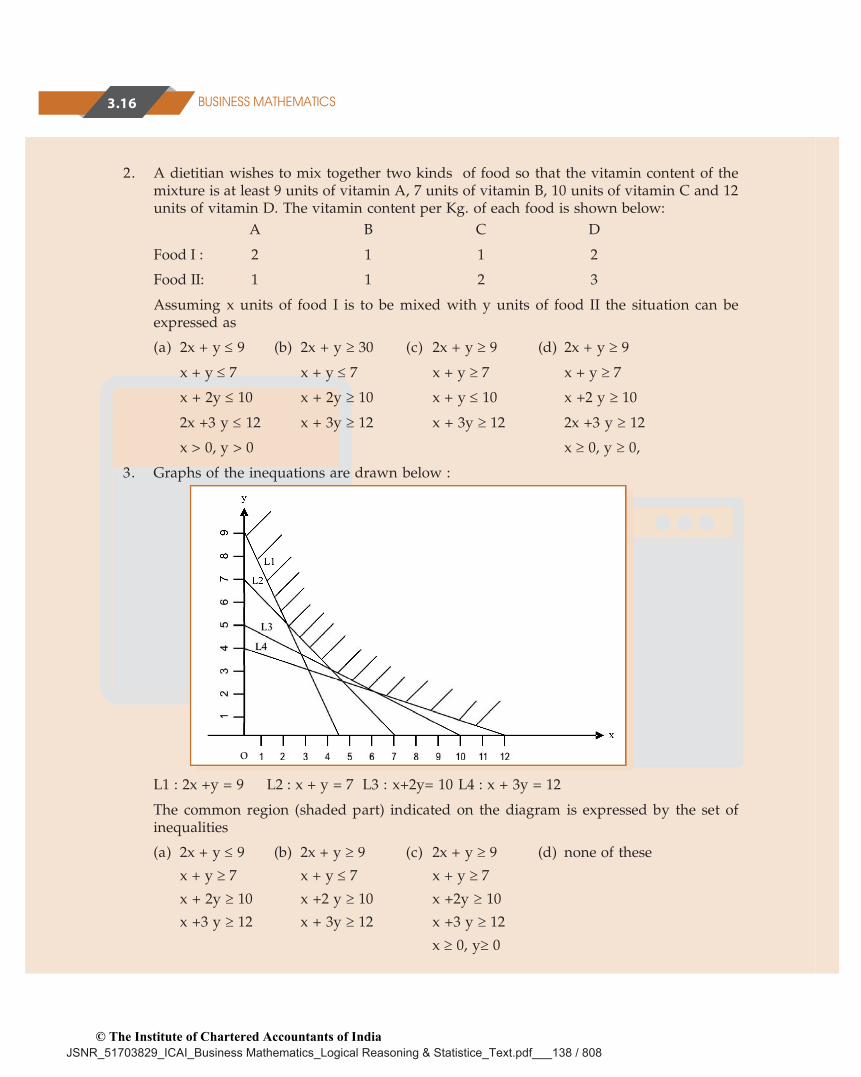
3. Graphs of the inequations are drawn below :
L1 : 2x +y = 9 L2 : x + y = 7 L3 : x+2y= 10 L4 : x + 3y = 12
The common region (shaded part) indicated on the diagram is expressed by the set ofinequalities
(a) 2x + y 9 (b) 2x + y 9 (c) 2x + y 9 (d) none of these
x + y 7 x + y 7 x + y 7
x + 2y 10 x +2 y 10 x +2y 10
x +3 y 12 x + 3y 12 x +3 y 12
x 0, y 0
o
JSNR_51703829_ICAI_Business Mathematics_Logical Reasoning & Statistice_Text.pdf___138 / 808© The Institute of Chartered Accountants of India
3.17LINEAR INEQUALITIES
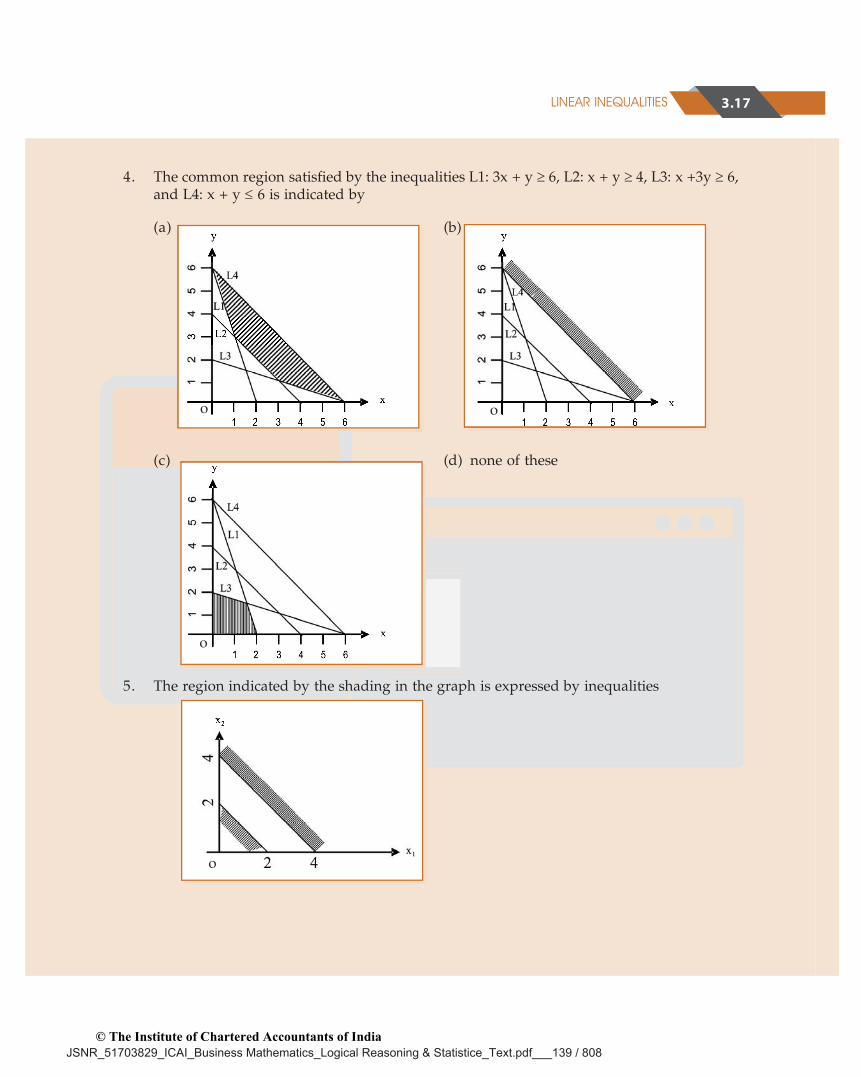
4. The common region satisfied by the inequalities L1: 3x + y 6, L2: x + y 4, L3: x +3y 6,and L4: x + y 6 is indicated by
(a) (b)
(c) (d) none of these
5. The region indicated by the shading in the graph is expressed by inequalities
o o
o
o
JSNR_51703829_ICAI_Business Mathematics_Logical Reasoning & Statistice_Text.pdf___139 / 808© The Institute of Chartered Accountants of India
BUSINESS MATHEMATICS3.18
(a) x1 + x2 2 (b) x1 + x2 2 (c) x1 + x2 2 (d) x1 + x2 2
2x1 + 2x2 8 x2 x1 + x2 4 2x1 + 2x2 8 2x1 + 2x2 > 8
x1 0 , x2 0,
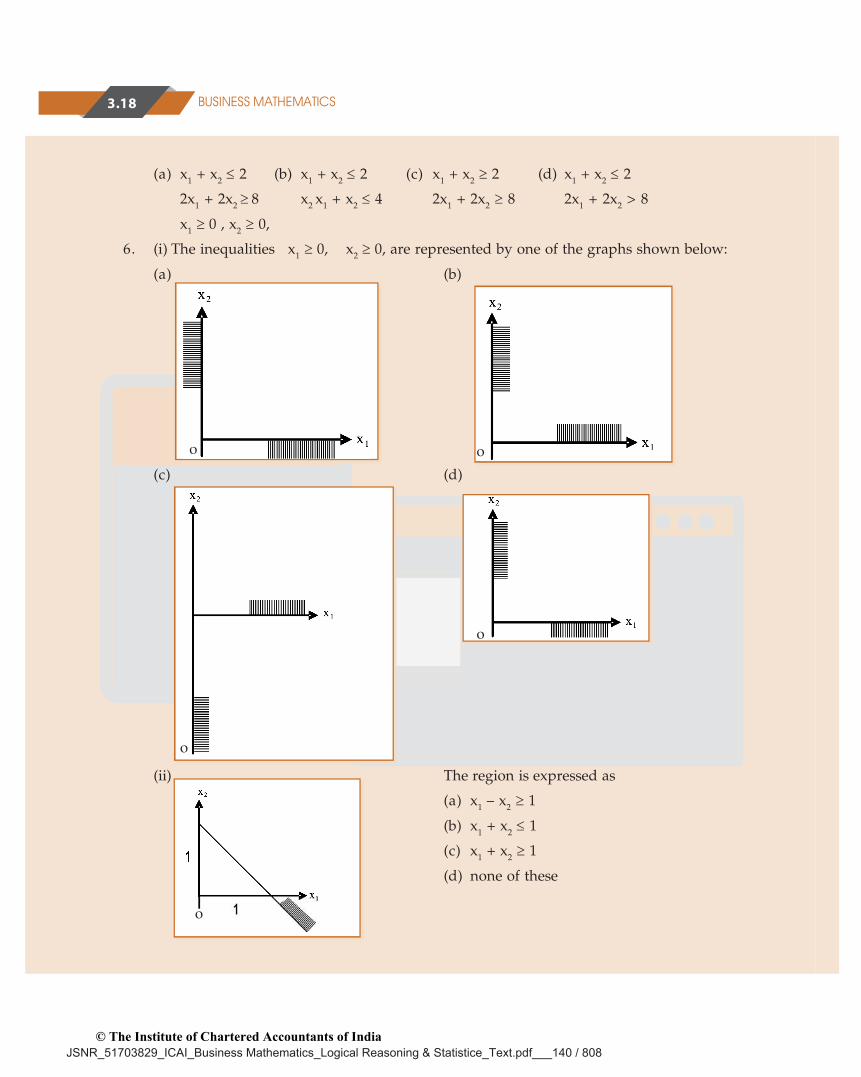
6. (i) The inequalities x1 0, x2 0, are represented by one of the graphs shown below:
(a) (b)
(c) (d)
(ii) The region is expressed as
(a) x1 – x2 1
(b) x1 + x2 1
(c) x1 + x2 1
(d) none of these
o o
o
o
o
JSNR_51703829_ICAI_Business Mathematics_Logical Reasoning & Statistice_Text.pdf___140 / 808© The Institute of Chartered Accountants of India
3.19LINEAR INEQUALITIES
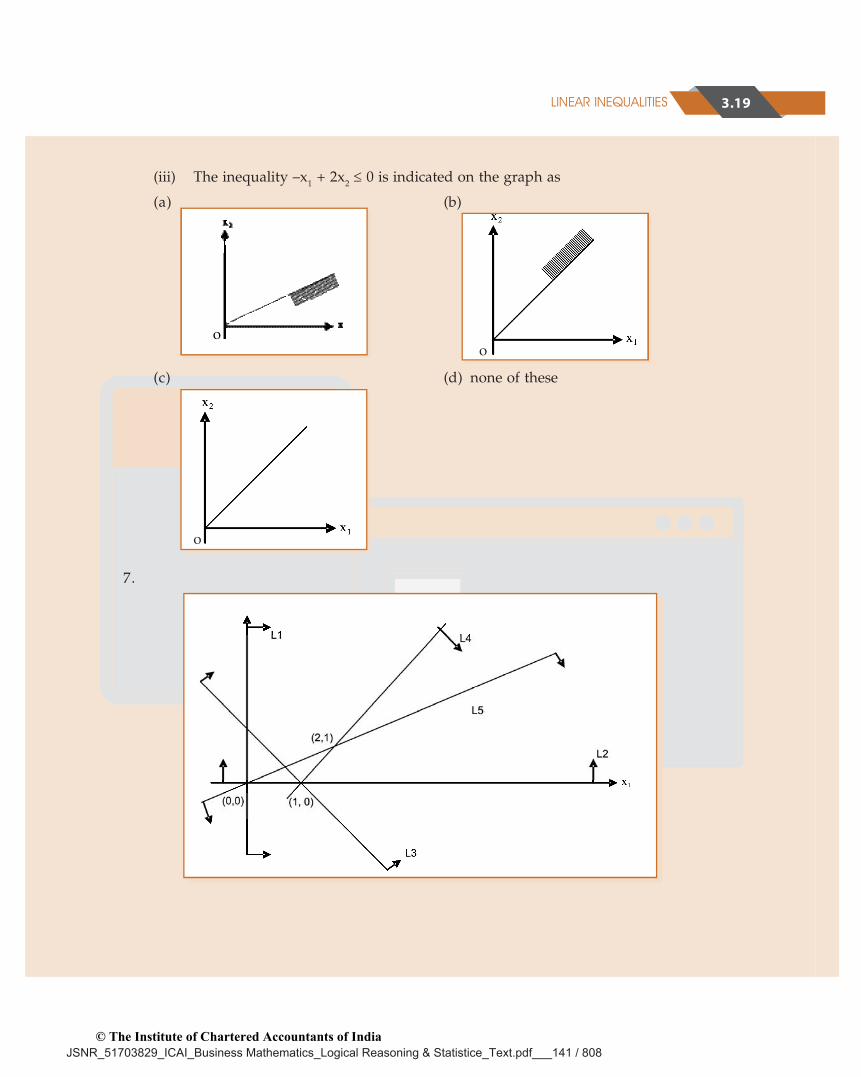
(iii) The inequality –x1 + 2x2 0 is indicated on the graph as
(a) (b)
(c) (d) none of these
7.
o
o
o
JSNR_51703829_ICAI_Business Mathematics_Logical Reasoning & Statistice_Text.pdf___141 / 808© The Institute of Chartered Accountants of India
BUSINESS MATHEMATICS3.20
The common region indicated on the graph is expressed by the set of five inequalities
(a) L1 : x1 0 (b) L1 : x1 0 (c) L1 : x1 0 (d) None of these
L2 : x2 0 L2 : x2 0 L2 : x2 0
L3 : x1 + x2 1 L3 : x1+x2 1 L3 : x1+ x2 1
L4 : x1 – x2 1 L4 : x1–x2 1 L4 : x1–x2 1
L5 : –x1 + 2x2 0 L5 :– x1+2x2 0 L5 :– x1+2x2 0
8. A firm makes two types of products : Type A and Type B. The profit on product A is Nu.20 each and that on product B is Nu. 30 each. Both types are processed on three machinesM1, M2 and M3. The time required in hours by each product and total time available inhours per week on each machine are as follows:
Machine Product A Product B Available Time
M1 3 3 36
M2 5 2 50
M3 2 6 60
The constraints can be formulated taking x1 = number of units A and x2 = number of unitof B as
(a) x1 + x2 12 (b) 3x1 + 3x2 36 (c) 3x1 + 3x2 36 (d) none of these
5x1 + 2x2 50 5x1 + 2x2 50 5x1 + 2x2 50
2x1 + 6x2 60 2x1 + 6x2 60 2x1 + 6x2 60
x1 0, x2 0 x1 0, x2 0
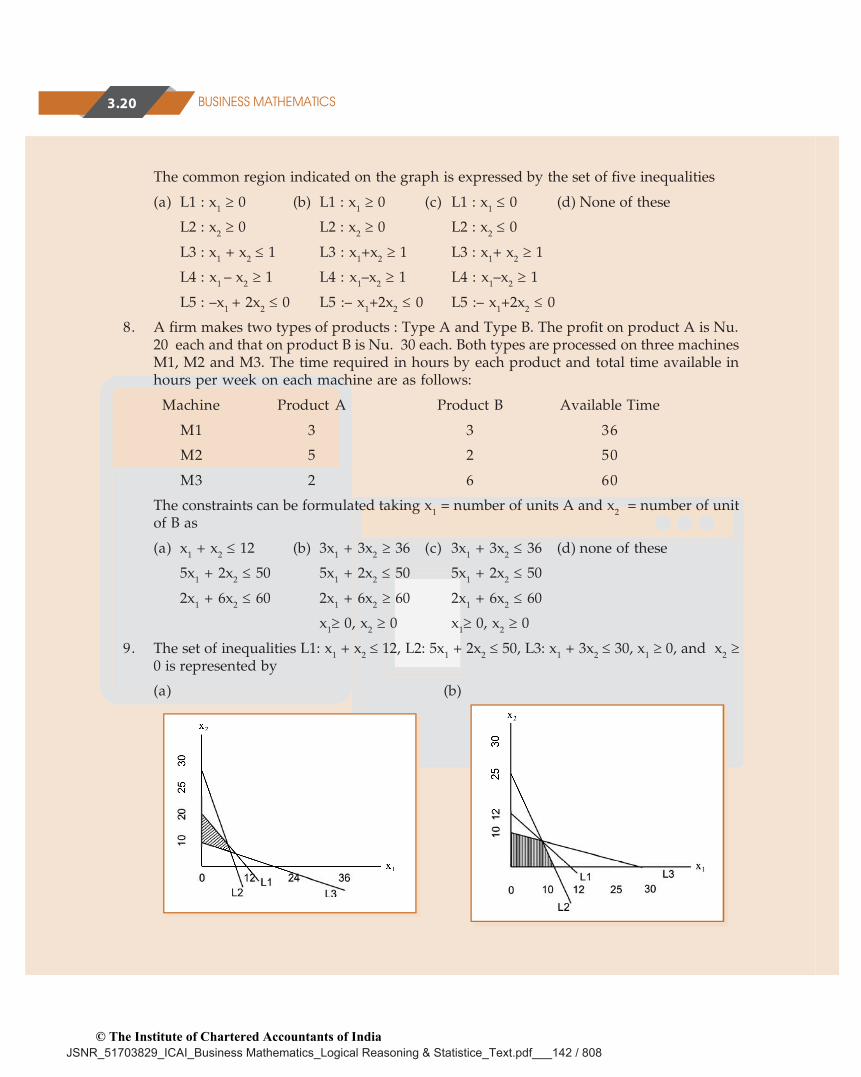
9. The set of inequalities L1: x1 + x2 12, L2: 5x1 + 2x2 50, L3: x1 + 3x2 30, x1 0, and x2 0 is represented by
(a) (b)
JSNR_51703829_ICAI_Business Mathematics_Logical Reasoning & Statistice_Text.pdf___142 / 808© The Institute of Chartered Accountants of India
3.21LINEAR INEQUALITIES
(c) (d) none of these
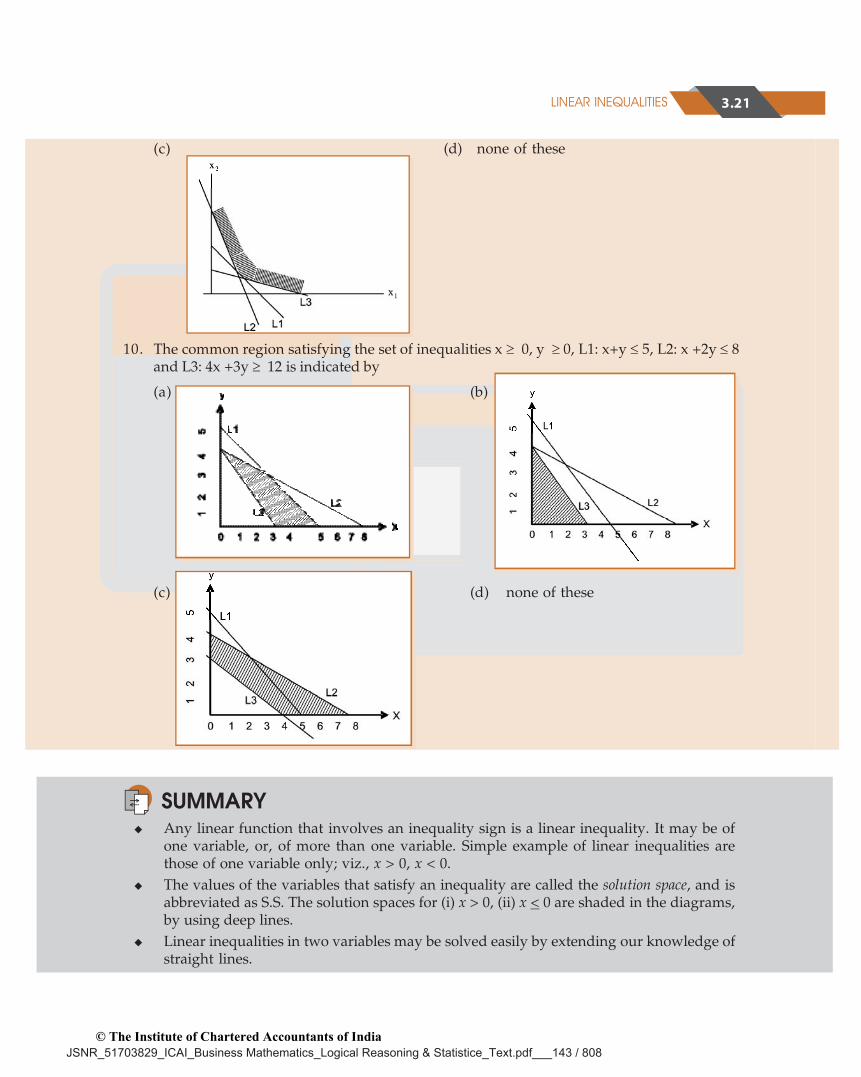
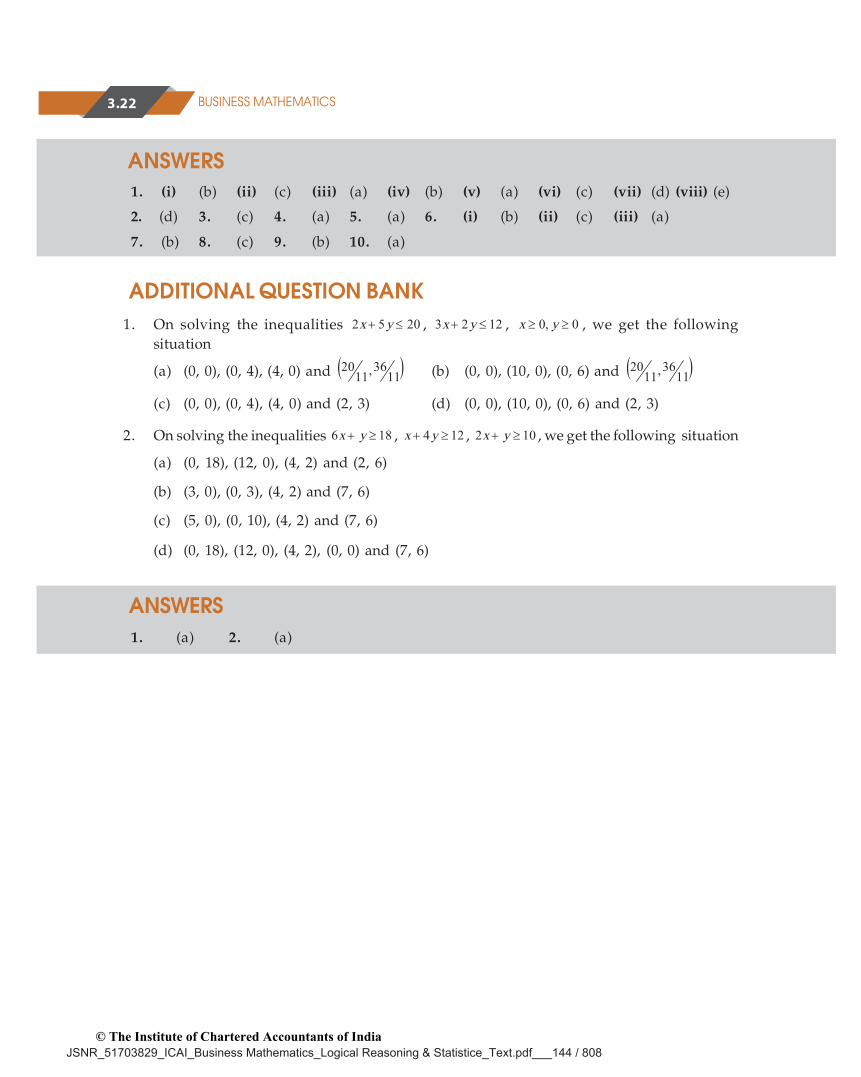
10. The common region satisfying the set of inequalities x 0, y 0, L1: x+y 5, L2: x +2y 8and L3: 4x +3y 12 is indicated by
(a) (b)
(c) (d) none of these
SUMMARY Any linear function that involves an inequality sign is a linear inequality. It may be of
one variable, or, of more than one variable. Simple example of linear inequalities arethose of one variable only; viz., x > 0, x < 0.
The values of the variables that satisfy an inequality are called the solution space, and isabbreviated as S.S. The solution spaces for (i) x > 0, (ii) x < 0 are shaded in the diagrams,by using deep lines.
Linear inequalities in two variables may be solved easily by extending our knowledge ofstraight lines.
JSNR_51703829_ICAI_Business Mathematics_Logical Reasoning & Statistice_Text.pdf___143 / 808© The Institute of Chartered Accountants of India
BUSINESS MATHEMATICS3.22
ANSWERS1. (i) (b) (ii) (c) (iii) (a) (iv) (b) (v) (a) (vi) (c) (vii) (d) (viii) (e)
2. (d) 3. (c) 4. (a) 5. (a) 6. (i) (b) (ii) (c) (iii) (a)
7. (b) 8. (c) 9. (b) 10. (a)
ADDITIONAL QUESTION BANK1. On solving the inequalities 2052 yx , 1223 yx , 0,0 yx , we get the following
situation
(a) (0, 0), (0, 4), (4, 0) and 1136,11
20 (b) (0, 0), (10, 0), (0, 6) and 1136,11
20
(c) (0, 0), (0, 4), (4, 0) and (2, 3) (d) (0, 0), (10, 0), (0, 6) and (2, 3)
2. On solving the inequalities 186 yx , 124 yx , 102 yx , we get the following situation
(a) (0, 18), (12, 0), (4, 2) and (2, 6)
(b) (3, 0), (0, 3), (4, 2) and (7, 6)
(c) (5, 0), (0, 10), (4, 2) and (7, 6)
(d) (0, 18), (12, 0), (4, 2), (0, 0) and (7, 6)
ANSWERS1. (a) 2. (a)
JSNR_51703829_ICAI_Business Mathematics_Logical Reasoning & Statistice_Text.pdf___144 / 808© The Institute of Chartered Accountants of India


![ICSE Paper Question (2009) - cdn1.byjus.com · Question 3. (a) Solve inequation and the represent solution number line. Bx 14 -3 + 5 3 + 5 3 + 2:r, where x EE I [3] value of p for](https://img.pdfslide.us/doc/110x75/5c475f0709d3f2134d8b497a/icse-paper-question-2009-cdn1byjuscom-question-3-a-solve-inequation.jpg)