Embed Size (px)
Citation preview
Linear Functions
Solving Linear Equations 1.1Using Data to create Scatterplots
1.2
Solving Linear Equations 1.1
Solving for an unknown variable:5x + 25 = 40
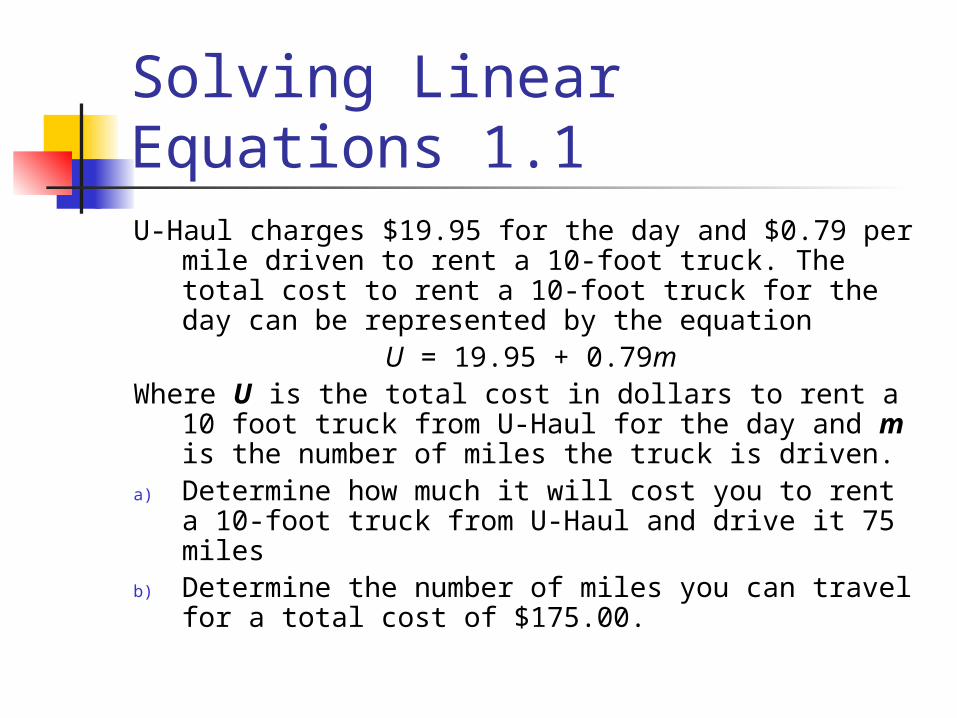
Solving Linear Equations 1.1U-Haul charges $19.95 for the day and $0.79 per
mile driven to rent a 10-foot truck. The total cost to rent a 10-foot truck for the day can be represented by the equation
U = 19.95 + 0.79mWhere U is the total cost in dollars to rent a 10 foot
truck from U-Haul for the day and m is the number of miles the truck is driven.
a) Determine how much it will cost you to rent a 10-foot truck from U-Haul and drive it 75 miles
b) Determine the number of miles you can travel for a total cost of $175.00.
Solving Linear Equations 1.1
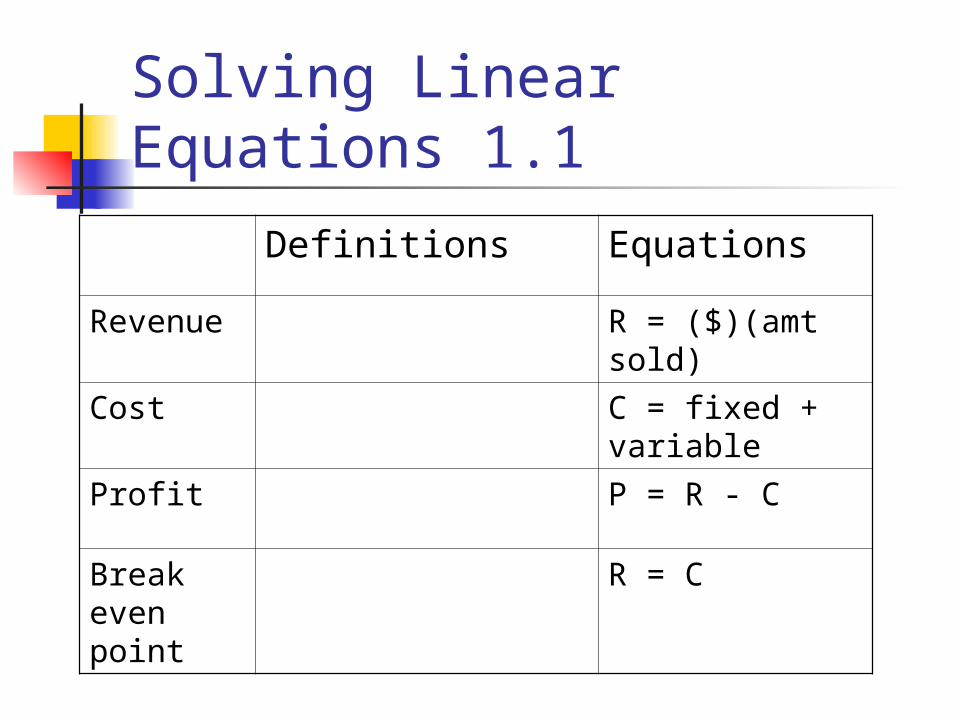
Definitions EquationsRevenue R = ($)(amt
sold)
Cost C = fixed + variable
Profit P = R - C
Break even point
R = C
Revenue cost and profit (1.1)
A local chiropractor has a small office where she cares for patients. She has $8000 in fixed costs each month that cover her rent, basic salaries, equipment, and utilities. For each patient she sees, she has an average additional cost of about $15. The chiropractor charges her patients or their insurance company $80 for a visit.
Chiropractor 1.1a) Write an equation for the total monthly cost
when v patient visits are done in a month.b) What is the total monthly cost if the chiropractor
has 100 patients visit during a month?c) Write an equation for the monthly revenue when
v patients visit a month.d) Write an equation for the monthly profit the
chiropractor makes if she has v patient visits in a month.
e) What is the monthly profit when 150 patients visit in a month?
f) How many patient visits does this chiropractor need to have in a month for her profit to be $5000?
Solving Linear Equations 1.1
Solving equations with fractions2/3 x + 5/6 = 7
a) ¼ x + 3/8 = 2b) 2/5(x + 4) = 7/10 x - 5
Solving Linear Functions (1.1)
Literal equations: rewrite the equation in terms of the desired variable.
Ex: D = rt
Solve: H = 1/3 m2r ; for rSolve d = ax + c ; for x
Using Data to create scatterplots1.2Data We gather data to predict,
understand, and study events or cases.
Government collects population info Effects of caffeine on health and function Grade distribution on schools
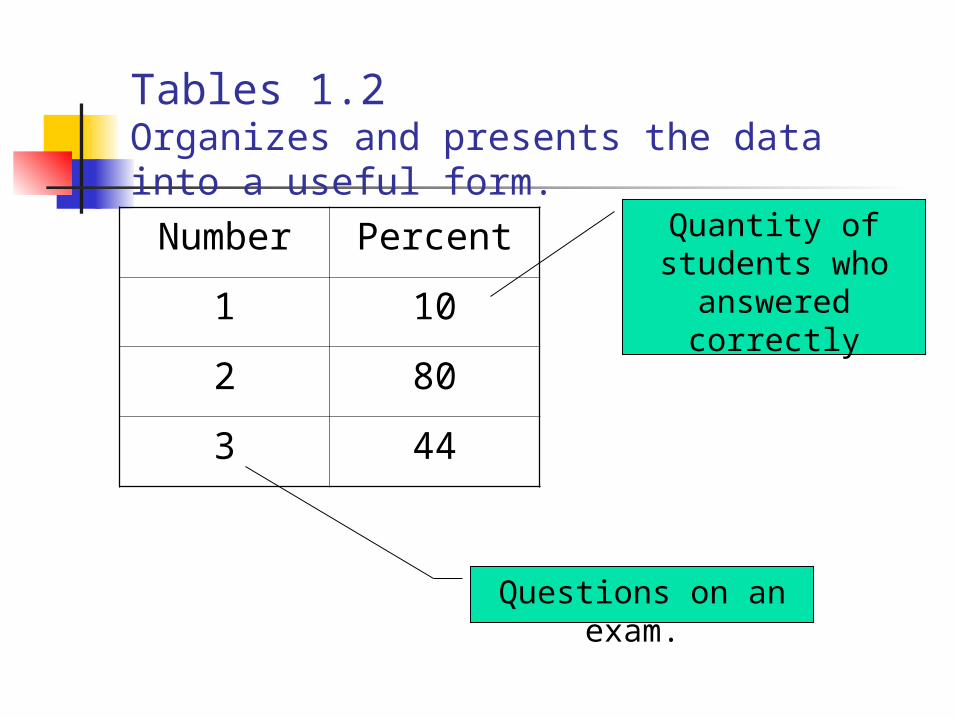
Tables 1.2Organizes and presents the data into a useful form.
Number Percent
1 10
2 80
3 44
Questions on an exam.
Quantity of students who answered
correctly
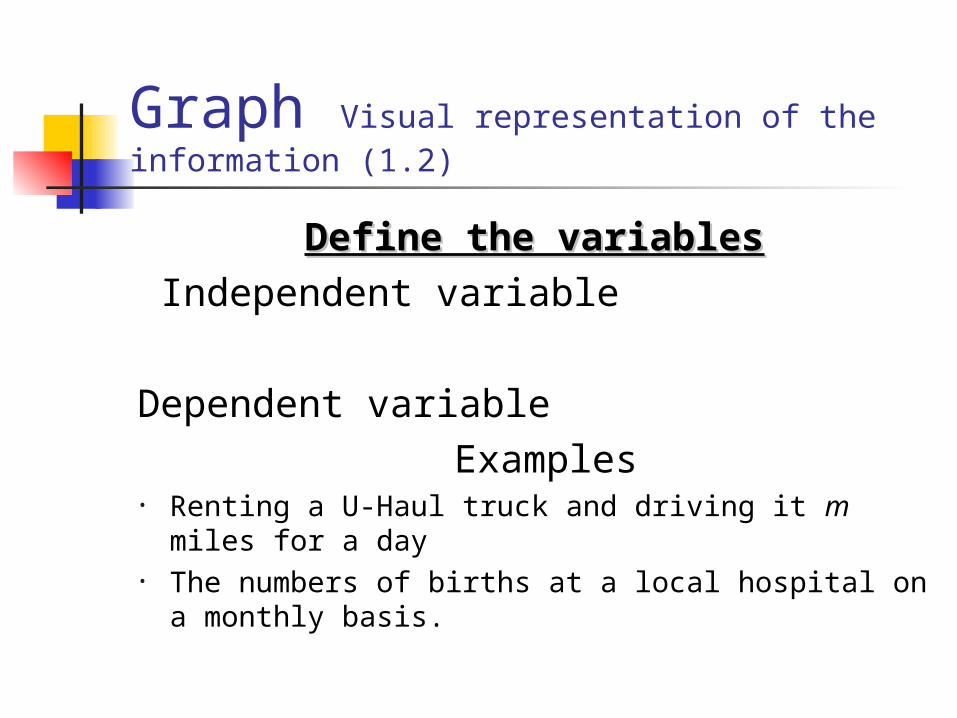
Graph Visual representation of the information (1.2)
Define the variablesDefine the variables Independent variable
Dependent variable Examples
• Renting a U-Haul truck and driving it m miles for a day
• The numbers of births at a local hospital on a monthly basis.
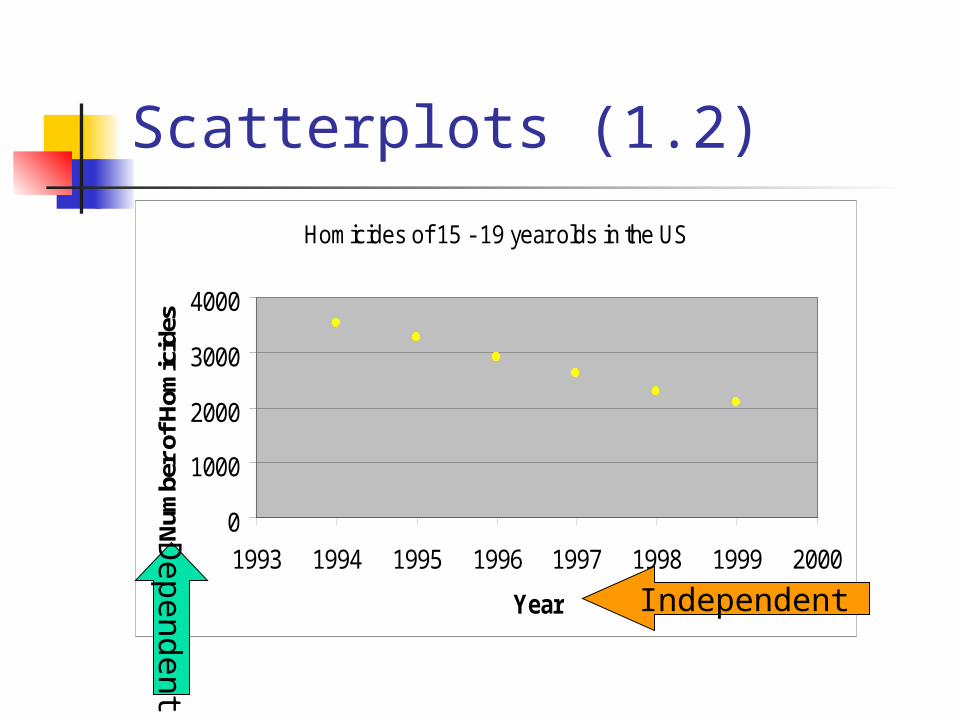
Scatterplots (1.2)
Homicides of 15 - 19 year olds in the US
0
1000
2000
3000
4000
1993 1994 1995 1996 1997 1998 1999 2000
Year
Num
ber
of H
omic
ides
Independent
Dependent
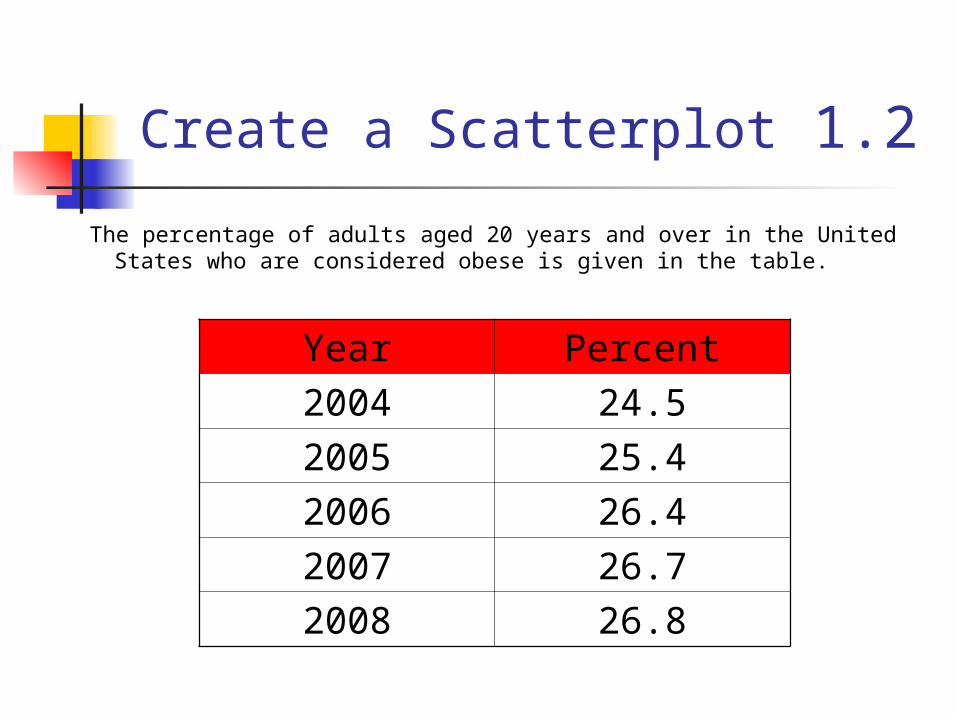
Create a Scatterplot 1.2
The percentage of adults aged 20 years and over in the United States who are considered obese is given in the table.
Year Percent
2004 24.5
2005 25.4
2006 26.4
2007 26.7
2008 26.8
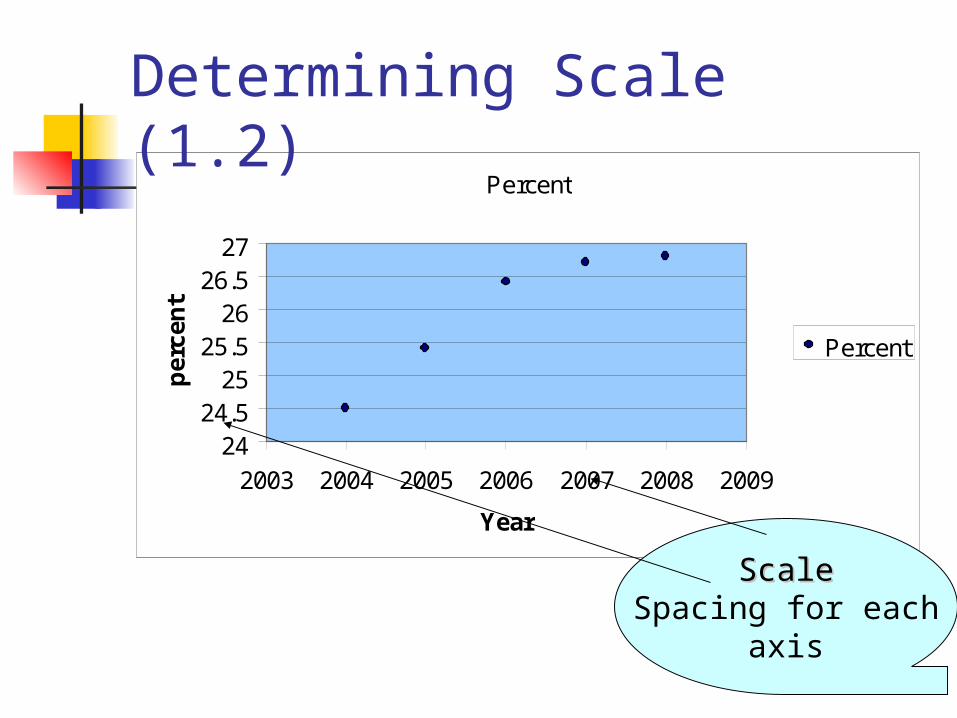
Percent
2424.5
2525.5
2626.5
27
2003 2004 2005 2006 2007 2008 2009
Year
per
cen
t
Percent
ScaleScaleSpacing for each
axis
Determining Scale (1.2)
Redefine the scale (1.2)
Adjust definition of variables and data
o Ex: t = time in years since 2000
Adjustment to the scale makes the graph accurate and not distorted.
o Once the variables are defined stay consistent with the values used for each variable.
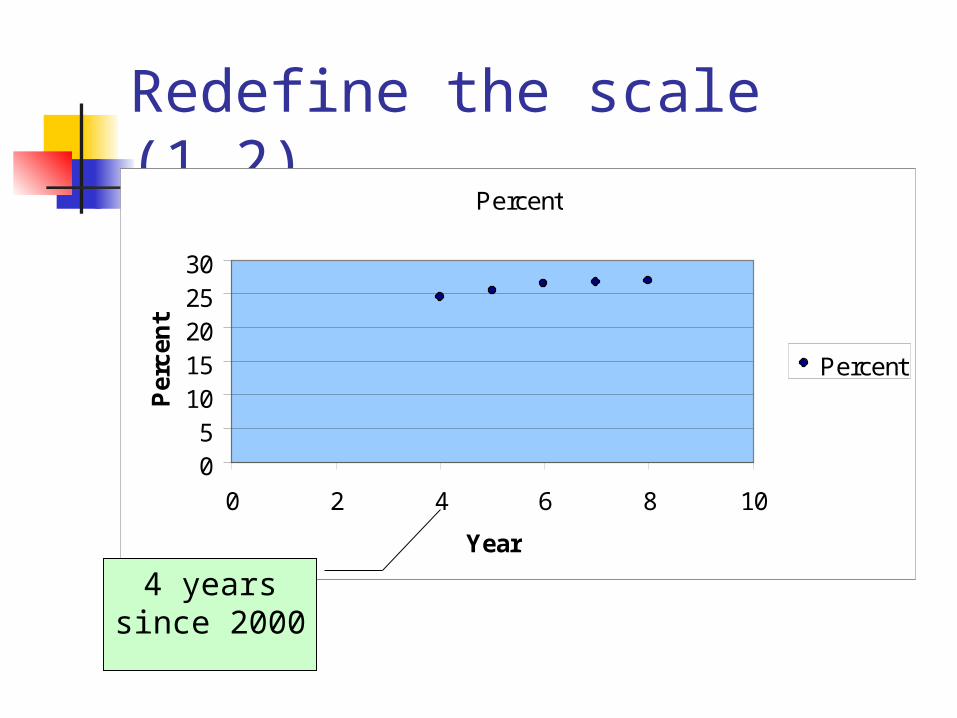
Redefine the scale (1.2)Percent
05
1015202530
0 2 4 6 8 10
Year
Per
cen
t
Percent
4 years since 2000
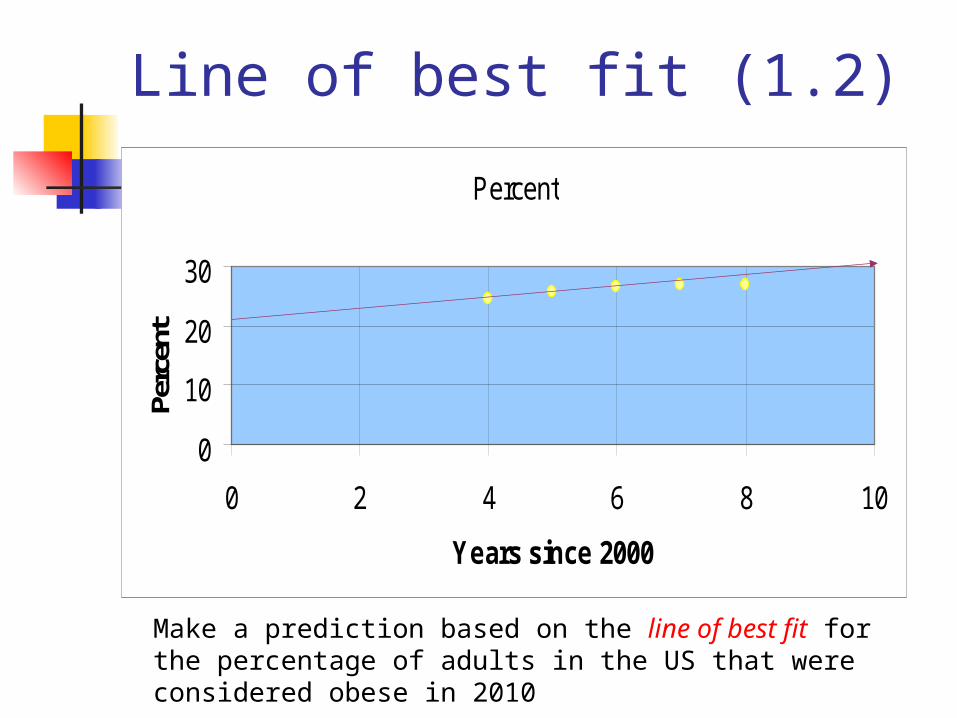
Line of best fit (1.2)Percent
0
10
20
30
0 2 4 6 8 10
Years since 2000
Perc
ent
Make a prediction based on the line of best fit for the percentage of adults in the US that were considered obese in 2010
Intercepts (1.2)
Horizontal intercept (x-intercept)
Vertical intercept (y-intercept)
Domain and Range (1.2)
Domain = set of values for an independent variable that result in a reasonable output values with no model breakdown
What are the x values in the given app problem
Range = set of dependent values resulting from given domain values.
What is the y values in the app problem
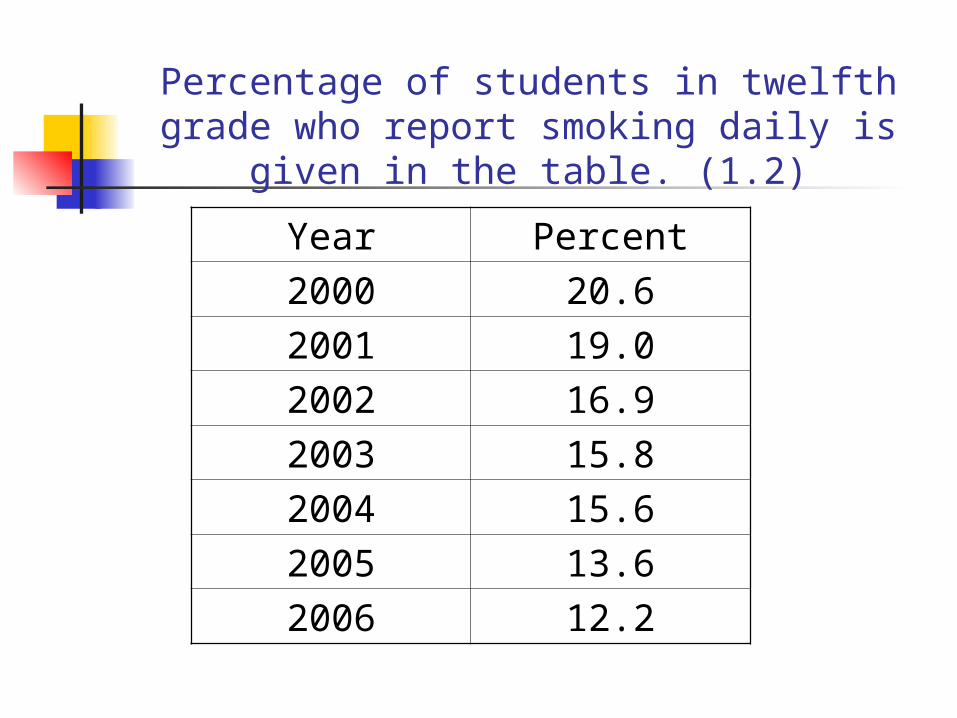
Percentage of students in twelfth grade who report smoking daily is given in the
table. (1.2)
Year Percent
2000 20.6
2001 19.0
2002 16.9
2003 15.8
2004 15.6
2005 13.6
2006 12.2
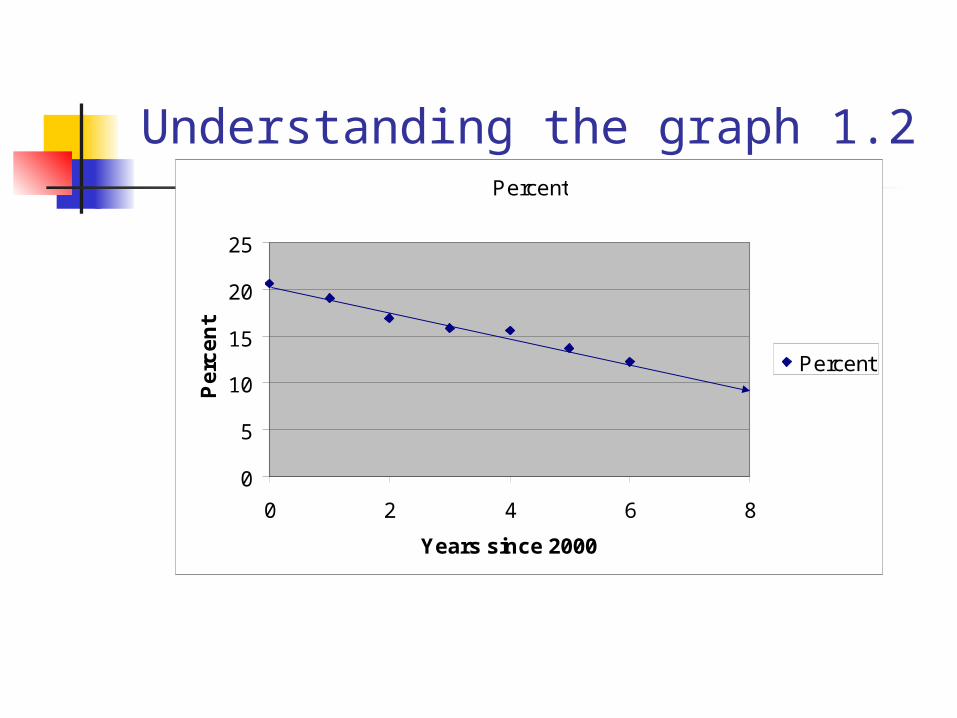
Understanding the graph 1.2Percent
0
5
10
15
20
25
0 2 4 6 8
Years since 2000
Pe
rce
nt
Percent
Fundamentals of Graphing (1.3)
Methods of graphing an equation A table of values (x-y chart)
Slope intercept form (y = mx + b)
x and y intercepts
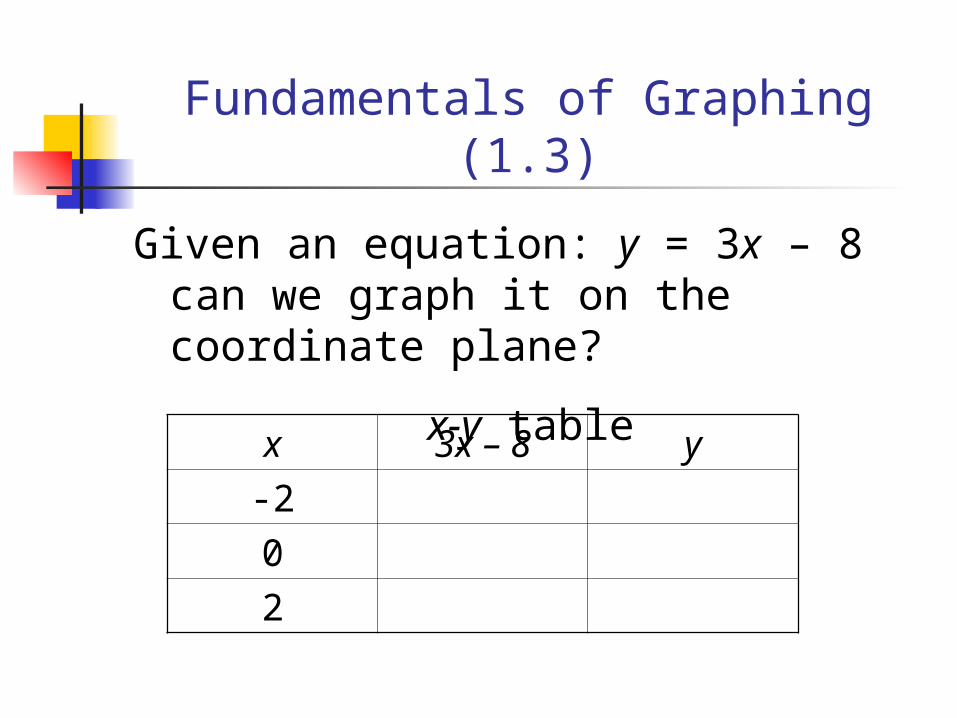
Fundamentals of Graphing (1.3)
Given an equation: y = 3x – 8 can we graph it on the coordinate plane?
x-y tablex 3x – 8 y
-2
0
2
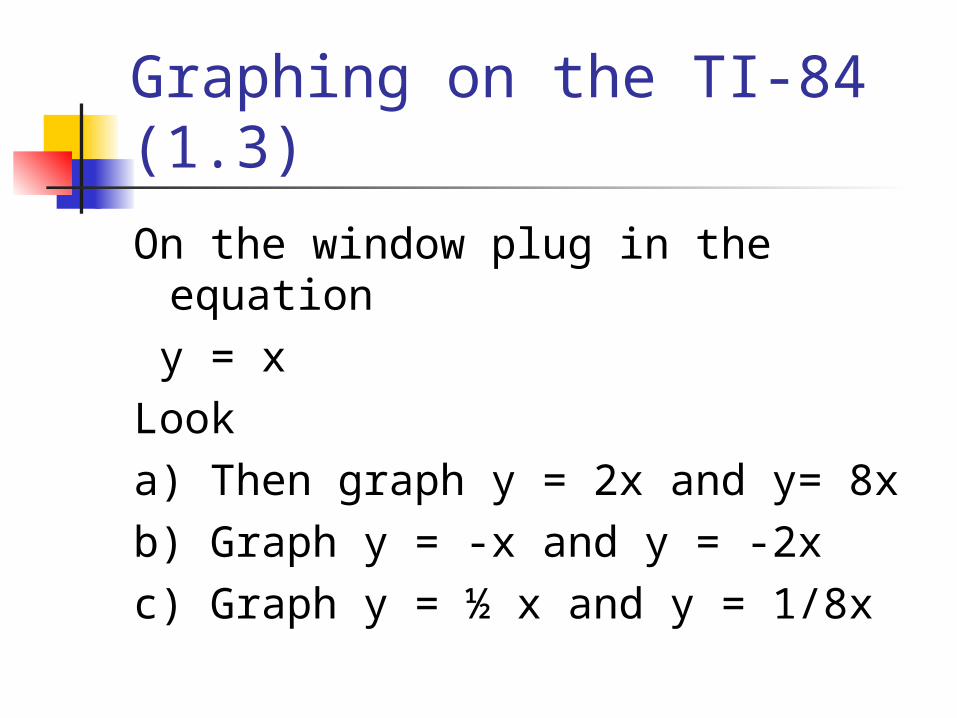
Graphing on the TI-84 (1.3)
On the window plug in the equation y = xLooka) Then graph y = 2x and y= 8xb) Graph y = -x and y = -2xc) Graph y = ½ x and y = 1/8x
Slope intercept form y = mx + b (1.3)
What value represents slope?
What value represents y-intercept?
How can we utilize the info to graph the line?
Slope (1.3)
Rise Run
Rate of change of the lineHow much the output variable
changes for a unit change in the input variable.
Graphing: what is slope in a word problem? (1.3)
Given an equation C = 38m + 150 where C represents the cost in dollars for pest management for a pest control company when m months of service is provided.
Slope (1.3)
Example: Let C = 4.5p + 1200 be the total cost in dollars to produce p pizzas a day at a local pizzeria.
Example 2: Let D = 0.28t + 5.95 be the percentage of adults aged 18 years old and over in the United states that have been diagnosed with diabetes, t years since 2000.
What does the slope mean?
Intercepts (1.4)
Intercepts are points where the line crosses the x-axis and the y-axis.
ExampleIn the U-Haul rental the vertical
intercept (0, 19.95) If rented the truck but did not drive
the truck it would cost $19.95 for the day.
Understanding intercepts in application problem (1.4)
The number of students who are enrolled in math classes at a local college can be represented by
E = -17w +600 Where E represents the math class
enrollment at the college w weeks after the start of the fall semester.
Practice (1.4)
Find the vertical and horizontal intercepts and explain their meaning in the given situation.
Let D = 0.28t + 5.95 be the percentage of adults aged 18 years old and over in the United states that have been diagnosed with diabetes, t years since 2000.
Forms of a line (1.4)
a) Slope-intercept form y = mx +b
b) Standard/General formAx + By = C
i) A is nonnegativeii) A, B, and C are integers
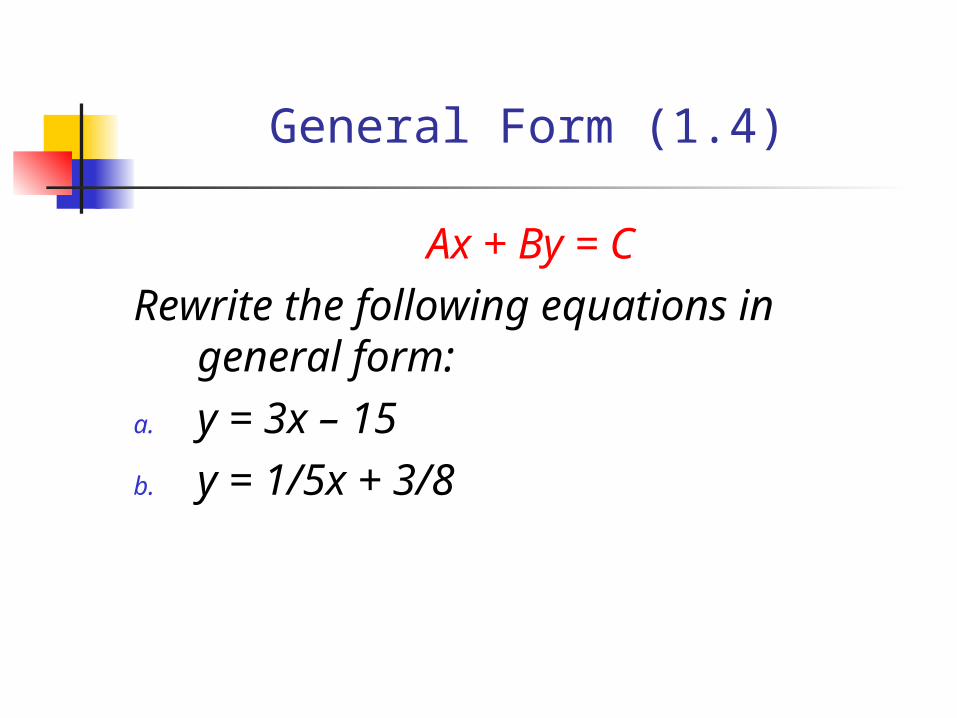
General Form (1.4)
Ax + By = CRewrite the following equations in
general form:a. y = 3x – 15b. y = 1/5x + 3/8
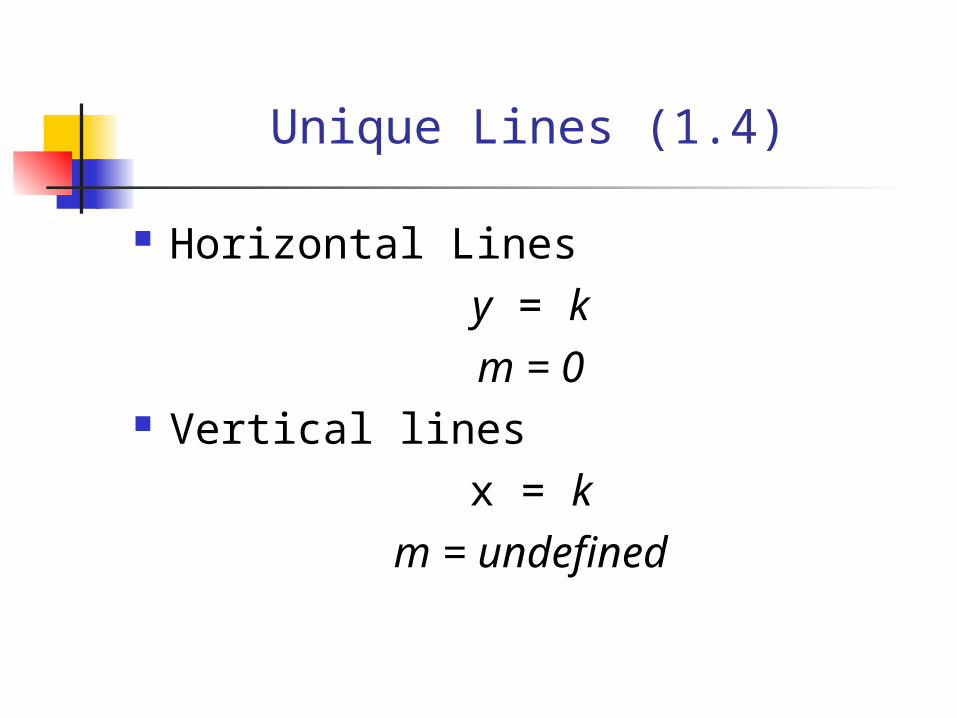
Unique Lines (1.4)
Horizontal Linesy = km = 0
Vertical linesx = k
m = undefined
Sketch the graph of the following lines
x = -4
y = - 1.5
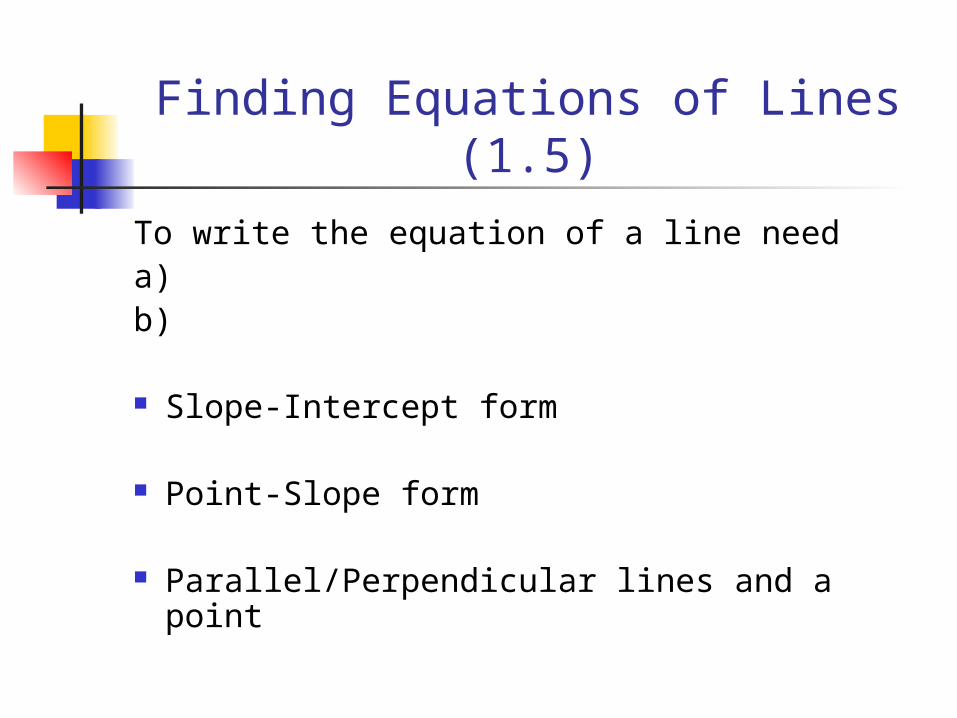
Finding Equations of Lines (1.5)
To write the equation of a line needa)b)
Slope-Intercept form
Point-Slope form
Parallel/Perpendicular lines and a point
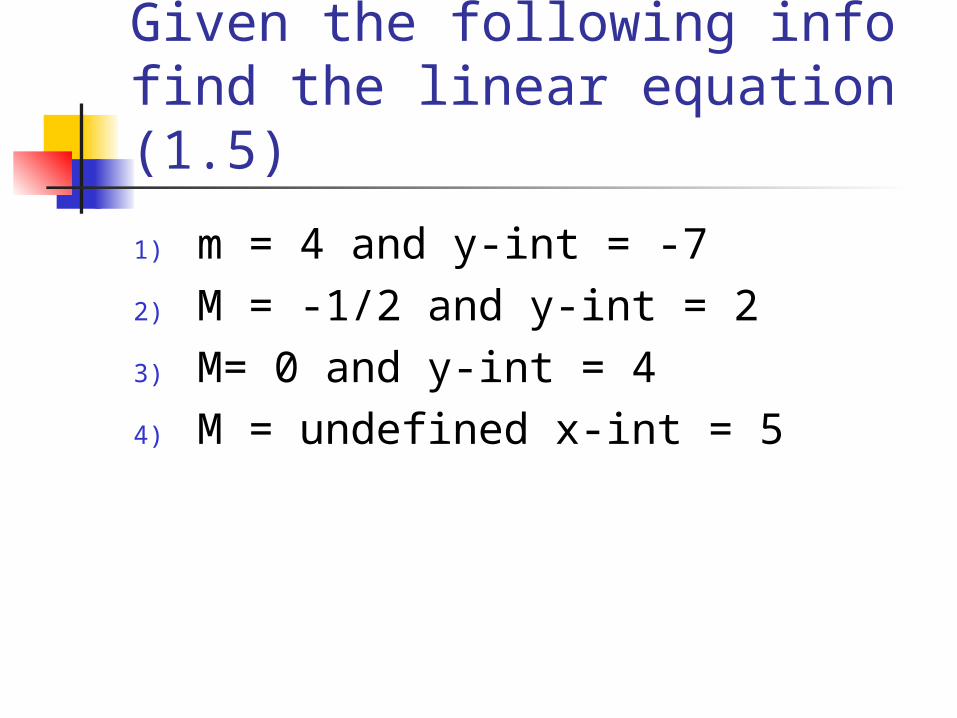
Given the following info find the linear equation (1.5)
1) m = 4 and y-int = -72) M = -1/2 and y-int = 23) M= 0 and y-int = 44) M = undefined x-int = 5
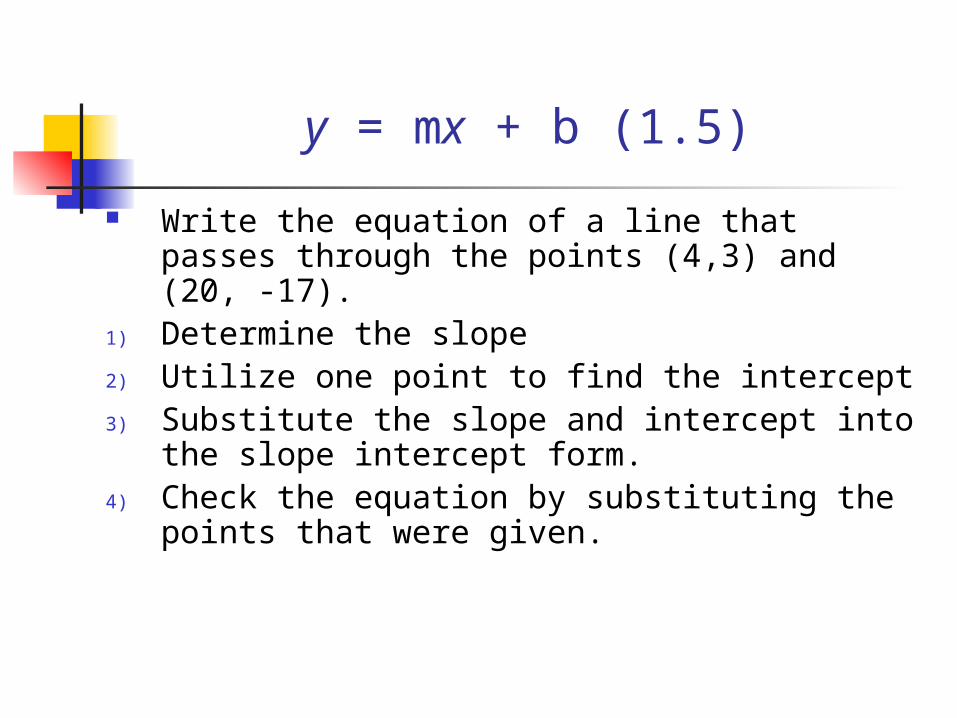
y = mx + b (1.5)
Write the equation of a line that passes through the points (4,3) and (20, -17).
1) Determine the slope2) Utilize one point to find the intercept3) Substitute the slope and intercept into
the slope intercept form.4) Check the equation by substituting the
points that were given.
Straight line depreciation (1.5)
A business purchased a production machine in 2005 for $185,000. For tax purposes, the value of the machine in 2011 was $129,500. If the business is using straight line depreciation, write the equation of the line that gives the value of the machine based on the age of the machine in years.
AIDs cases for adolescents (1.5)
According to www.childtrendsdatabank.org the number of newly diagnosed AIDS cases for adolescents 13-19 years old in the United States was 310 in 2000 and 458 in 2003. Assume that the number of cases is growing at a constant rate, and write an equation to represent this situation.
Point-Slope form (1.5)
(y – y1) = m(x – x1)
Write the equation of the line that passes through the points (6,-13) and (18,-31)
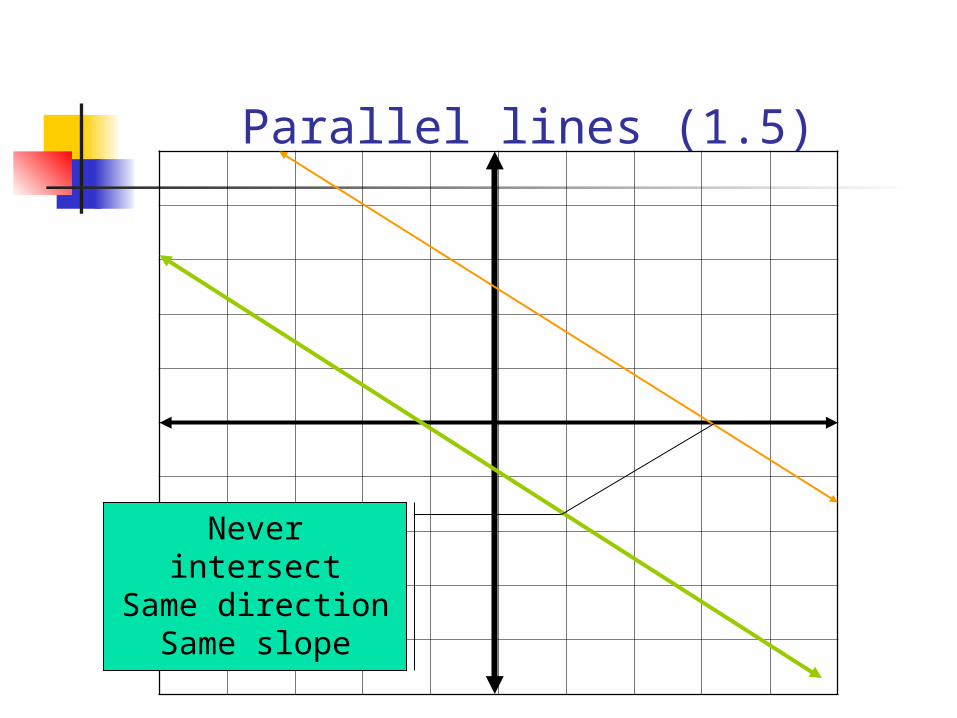
Parallel lines (1.5)
Never intersectSame direction
Same slope
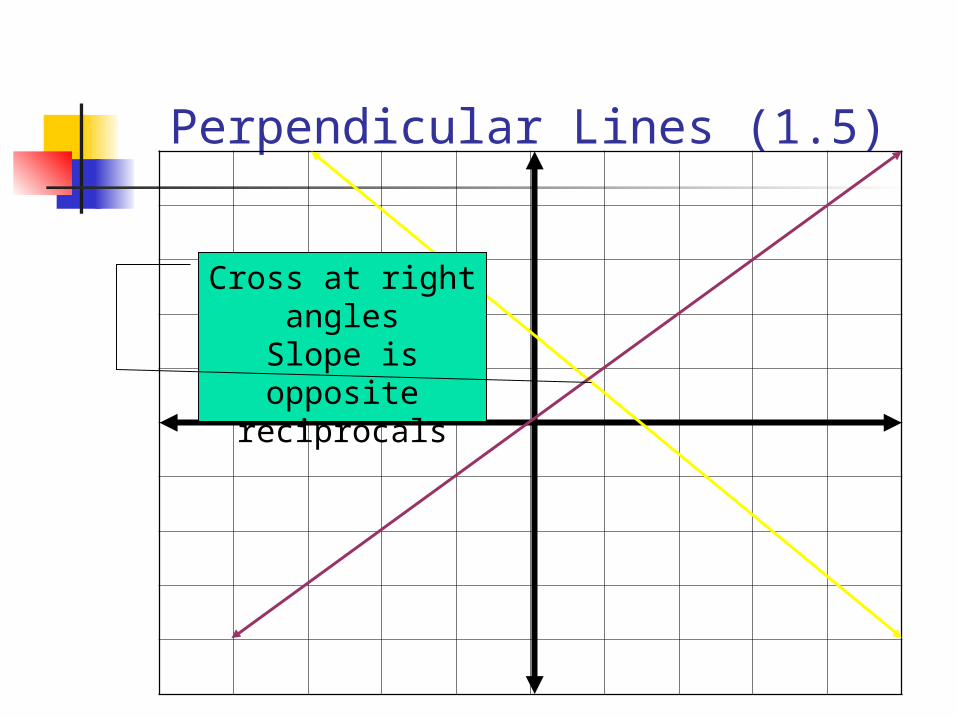
Perpendicular Lines (1.5)
Cross at right anglesSlope is opposite
reciprocals
Line Equation (1.5)
Write the equation of the line that goes through the point (-12,8) and is perpendicular to the line y = 4x –23
Write the equation of the line that goes through the point (8,11) and is parallel to the line 5x – 2y = 30