Embed Size (px)
Citation preview

Linear Fluctuations &
the Power Spectrumcontinued
31
timation method in its entirety, but it should be equallyvalid.
7.3. Comparison to other results
Figure 35 compares our results from Table 3 (modelingapproach) with other measurements from galaxy surveys,but must be interpreted with care. The UZC points maycontain excess large-scale power due to selection functioneffects (Padmanabhan et al. 2000; THX02), and the an-gular SDSS points measured from the early data releasesample are difficult to interpret because of their extremelybroad window functions. Only the SDSS, APM and angu-lar SDSS points can be interpreted as measuring the large-scale matter power spectrum with constant bias, since theothers have not been corrected for the red-tilting effectof luminosity-dependent bias. The Percival et al. (2001)2dFGRS analysis unfortunately cannot be directly plottedin the figure because of its complicated window functions.
Figure 36 is the same as Figure 35, but restricted to acomparison of decorrelated power spectra, those for SDSS,2dFGRS and PSCz. Because the power spectra are decor-related, it is fair to do “chi-by-eye” when examining thisFigure. The similarity in the bumps and wiggles between
Fig. 35.— Comparison with other galaxy power spectrum measure-ments. Numerous caveats must be borne in mind when interpretingthis figure. Our SDSS power spectrum measurements are those fromFigure 22, corrected for the red-tilting effect of luminosity dependentbias. The purely angular analyses of the APM survey (Efstathiou& Moody 2001) and the SDSS (the points are from Tegmark et al.2002 for galaxies in the magnitude range 21 < r∗ < 22 — see alsoDodelson et al. 2002) should also be free of this effect, but rep-resent different mixtures of luminosities. The 2dFGRS points arefrom the analysis of HTX02, and like the PSCz points (HTP00) andthe UZC points (THX02) have not been corrected for this effect,whereas the Percival et al. 2dFGRS analysis should be unafflictedby such red-tilting. The influential PD94 points (Table 1 from Pea-cock & Dodds 1994), summarizing the state-of-the-art a decade ago,are shown assuming IRAS bias of unity and the then fashionabledensity parameter Ωm = 1.
Fig. 36.— Same as Figure 35, but restricted to a comparisonof decorrelated power spectra, those for SDSS, 2dFGRS and PSCz.The similarity in the bumps and wiggles between the three powerspectra is intriguing.
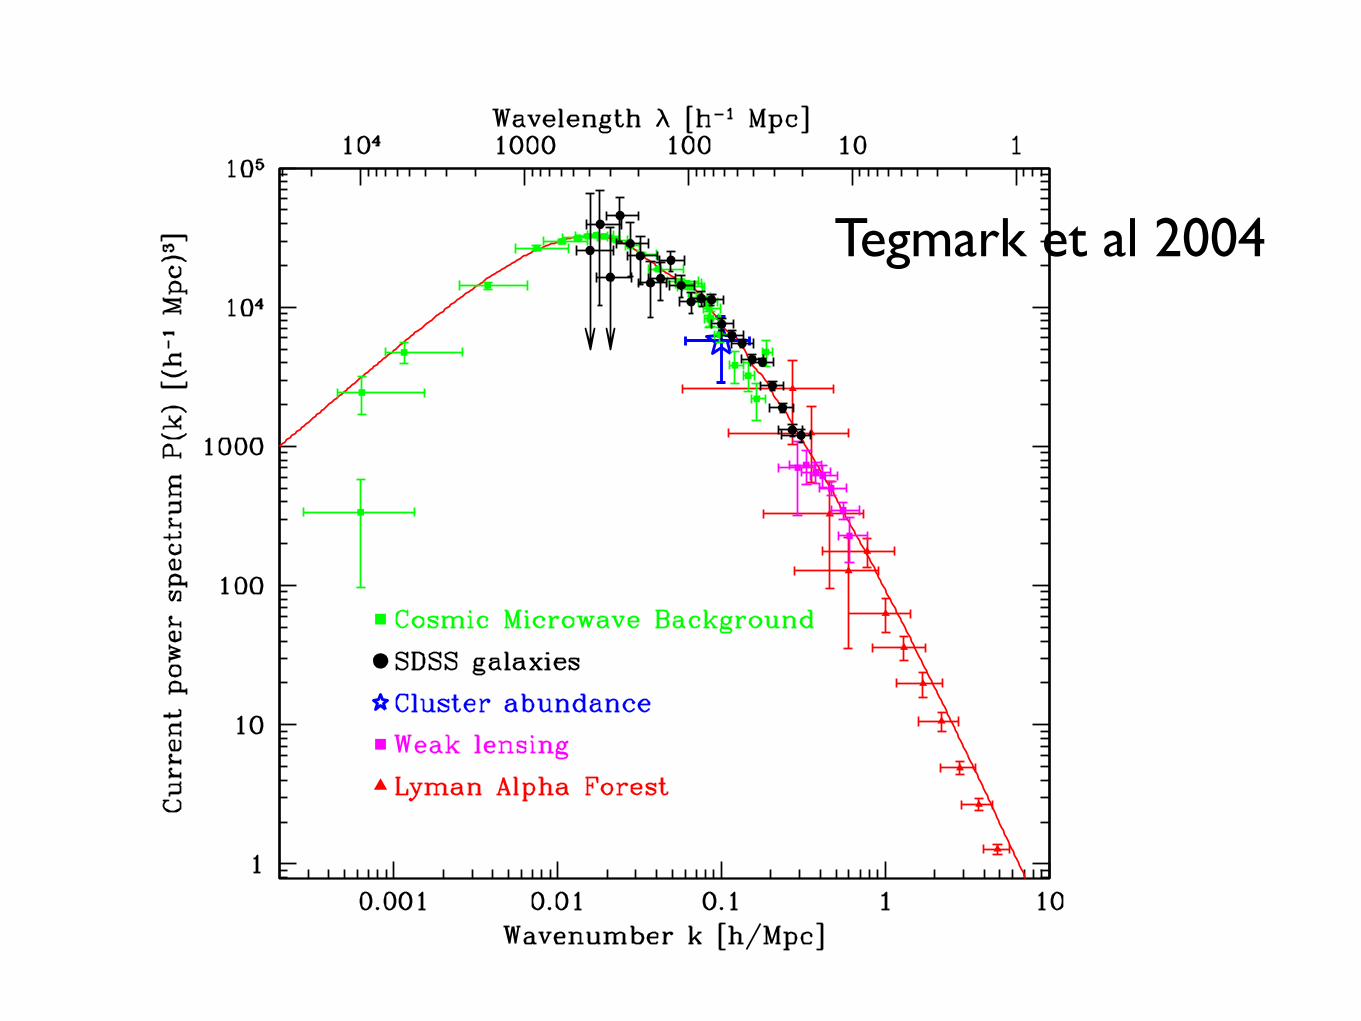
Fig. 37.— Comparison of our results with other P (k) constraints.The location of CMB, cluster, lensing and Lyα forest points in thisplane depends on the cosmic matter budget (and, for the CMB,on the reionization optical depth τ), so requiring consistency withSDSS constrains these cosmological parameters without assumptionsabout the primordial power spectrum. This figure is for the case of a“vanilla” flat scalar scale-invariant model with Ωm = 0.28, h = 0.72and Ωb/Ωm = 0.16, τ = 0.17 (Spergel et al. 2003; Verde et al. 2003,Tegmark et al. 2003b), assuming b∗ = 0.92 for the SDSS galaxies.
Tegmark et al 2004
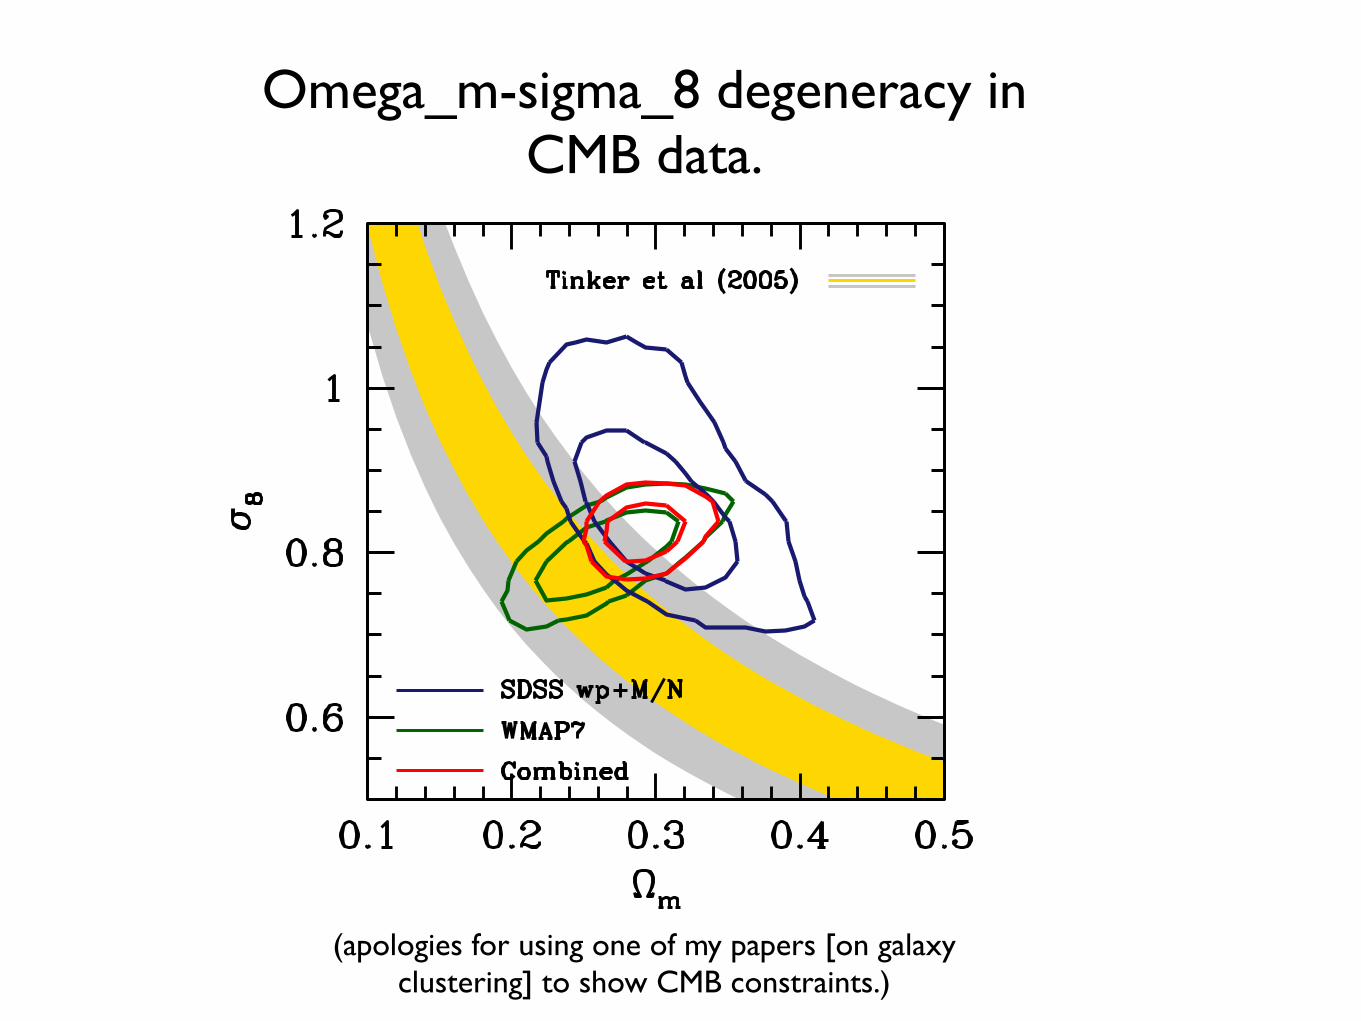
Omega_m-sigma_8 degeneracy in CMB data.
(apologies for using one of my papers [on galaxy clustering] to show CMB constraints.)

John Peacock: astro-ph/0309240
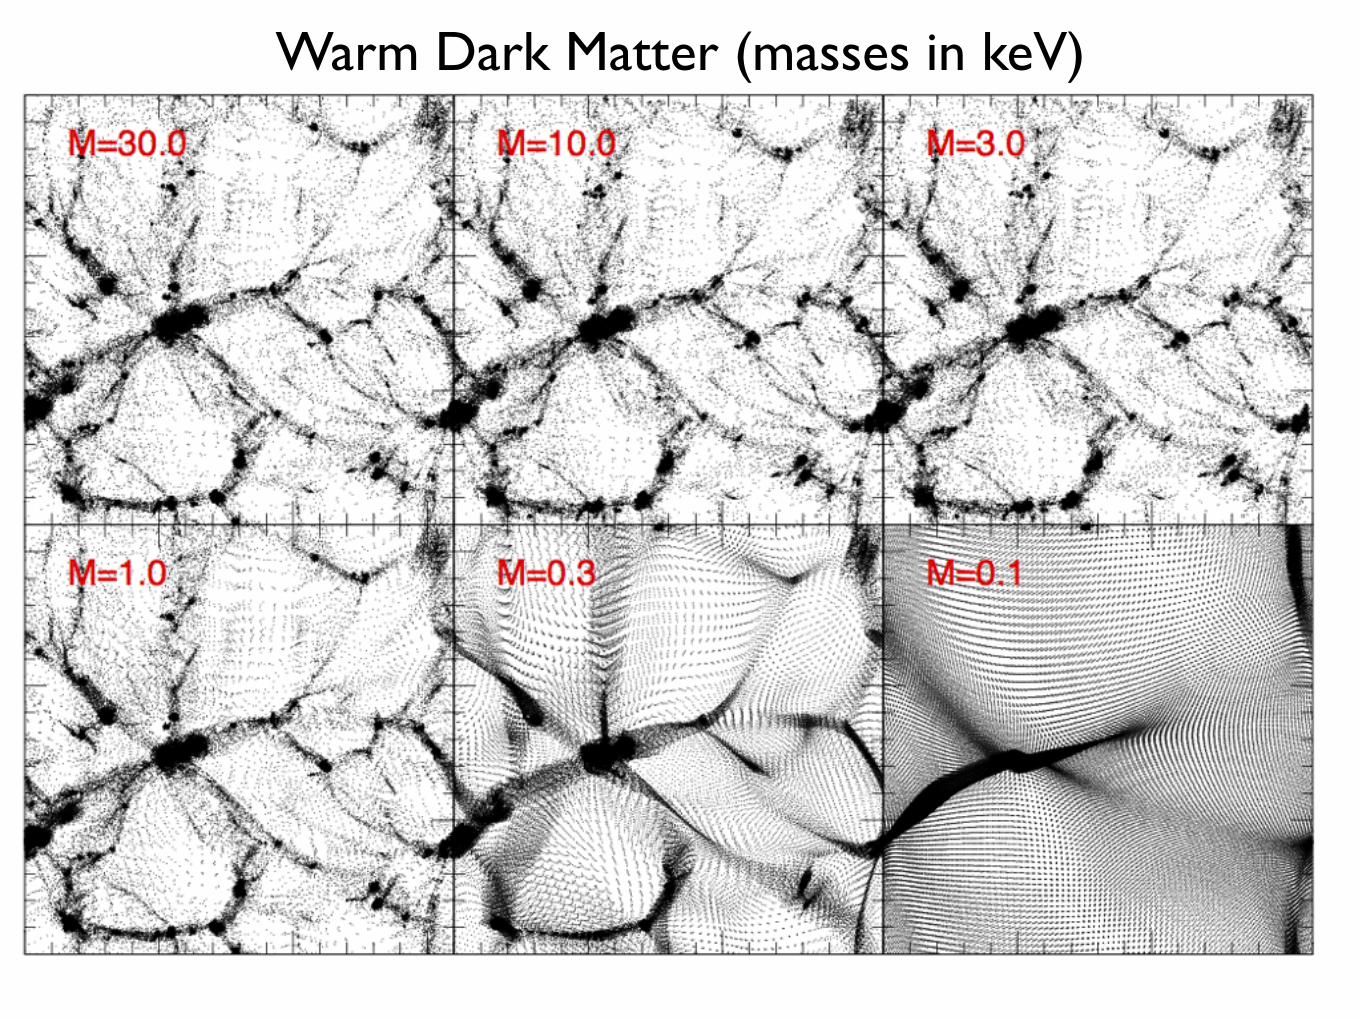
Warm Dark Matter (masses in keV)
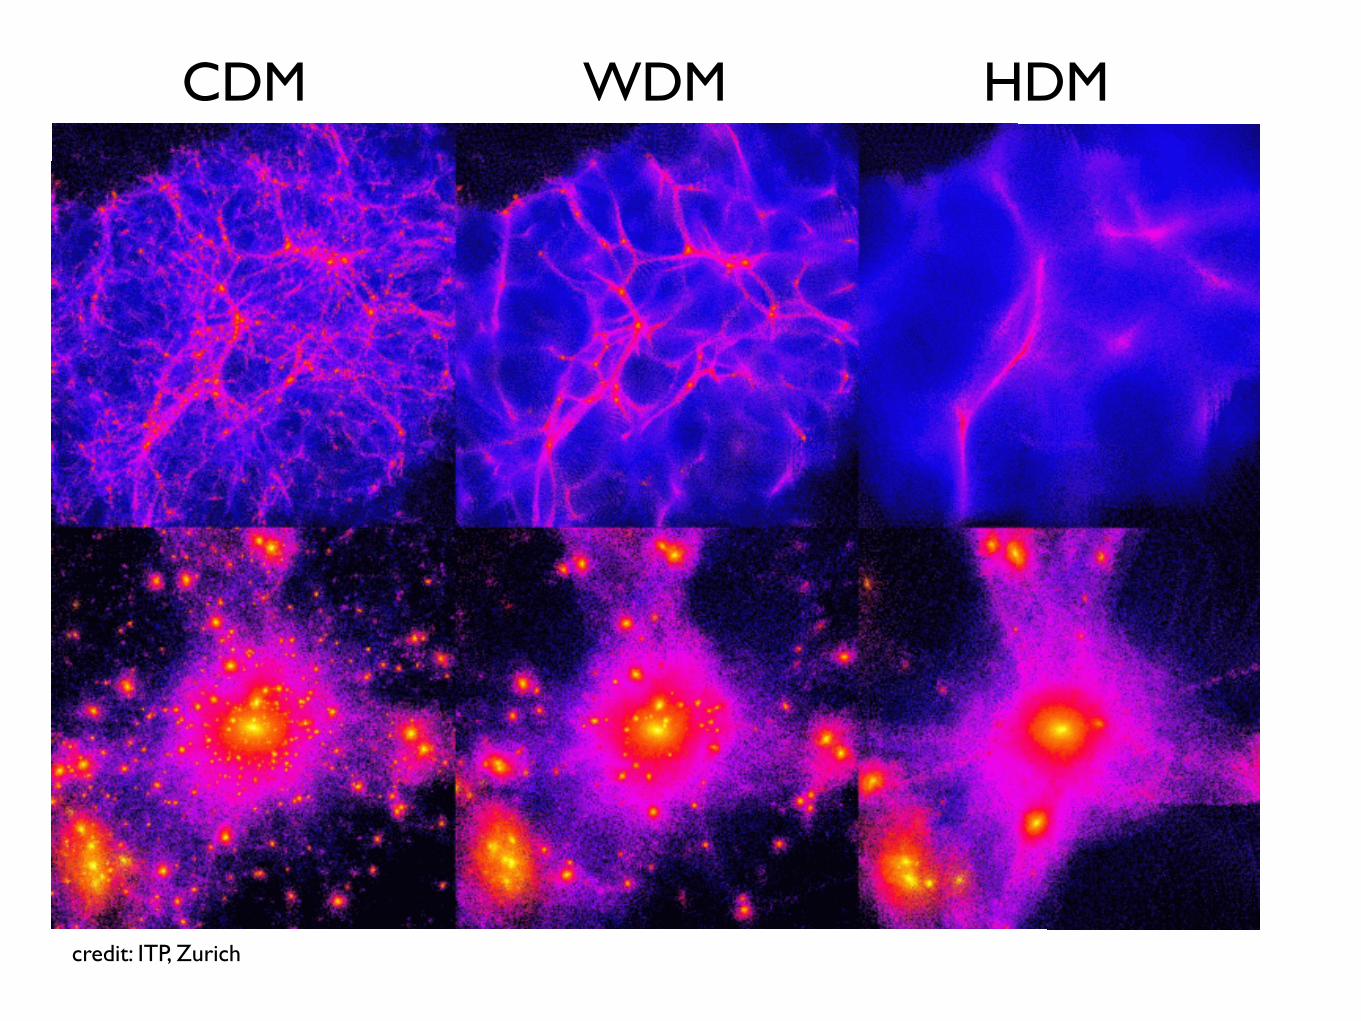
credit: ITP, Zurich
CDM WDM HDM
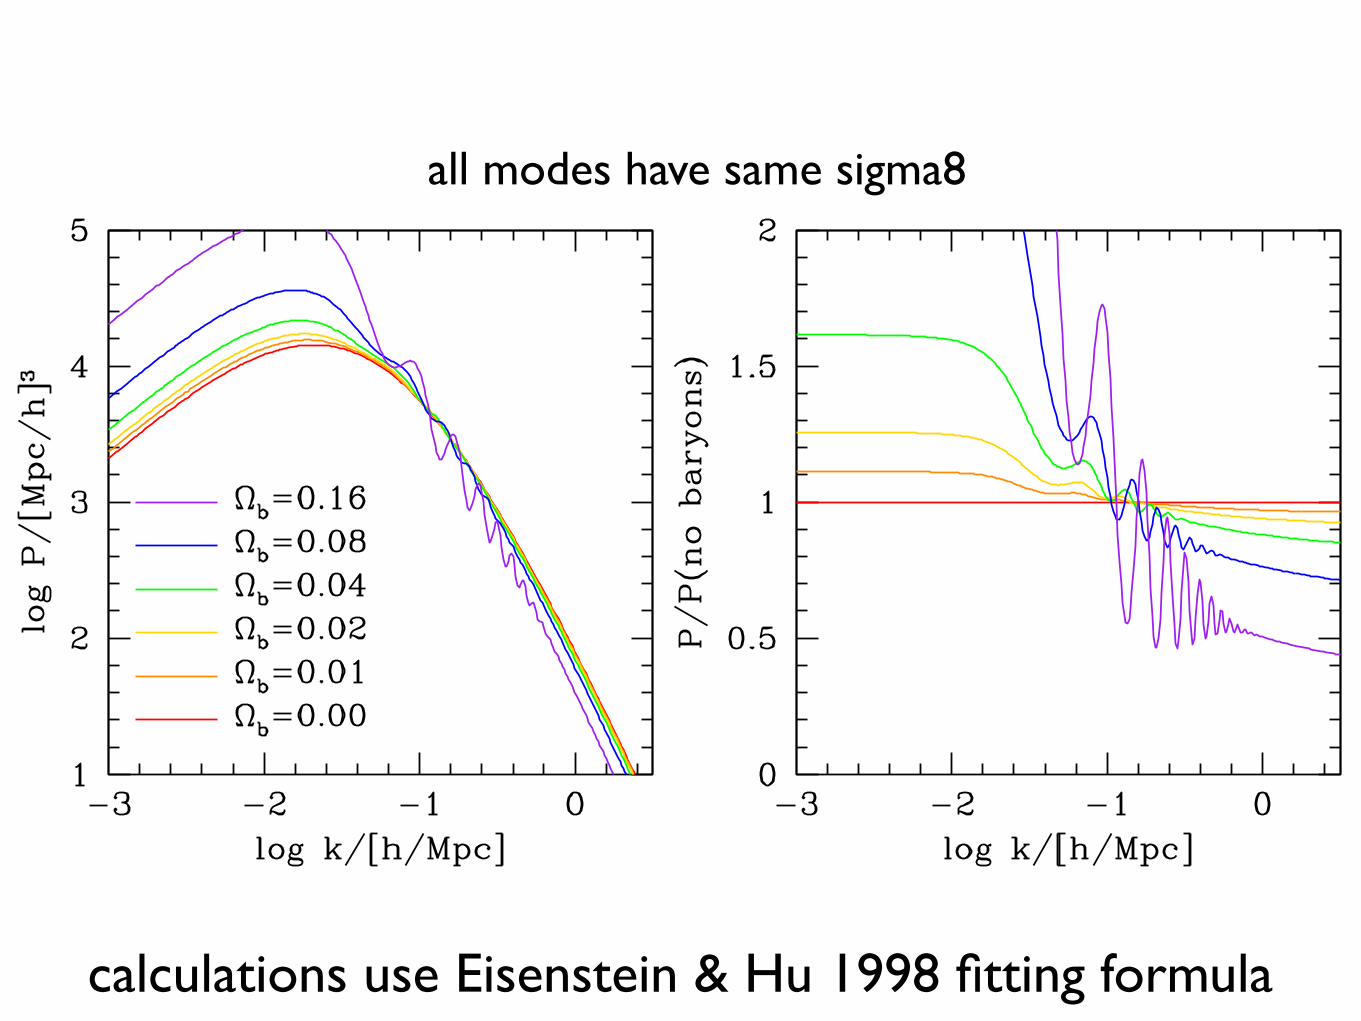
all modes have same sigma8
calculations use Eisenstein & Hu 1998 fitting formula
BAO in SDSS-III BOSS galaxies 39
variations in the power observed in the different data sets, but theshapes of each are clearly consistent, suggesting that we should ex-pect to recover consistent results for the BAO scale. Measurementsof the clustering in the LOWZ sample are presented in Tojeiro et al.(2014).
The power is observed to increase with each data release,and similar behaviour is observed in the correlation function fors < 70 h−1 Mpc. The difference in clustering amplitude can be ex-plained by the tiling of the survey. In order to obtain the most com-plete sample, dense regions are observed using overlapping plates.Thus, as the survey progresses, a larger percentage of observationsusing overlapping plates are completed and the mean density of thesurvey increases. This increase in density occurs almost exclusivelyby adding overdense regions and thus increases the clustering am-plitude. The measured increase in clustering amplitude is roughlythe square of increase in density (4 per cent between DR9 andDR11, and 2 per cent between DR10 and DR11). As the surveynears completion, the issue naturally becomes less important. ForDR11, it represents, at worst, a 1 per cent underestimate of the biasof the CMASS galaxies. Consistent trends are found in the LOWZsample (Tojeiro et al. 2014).
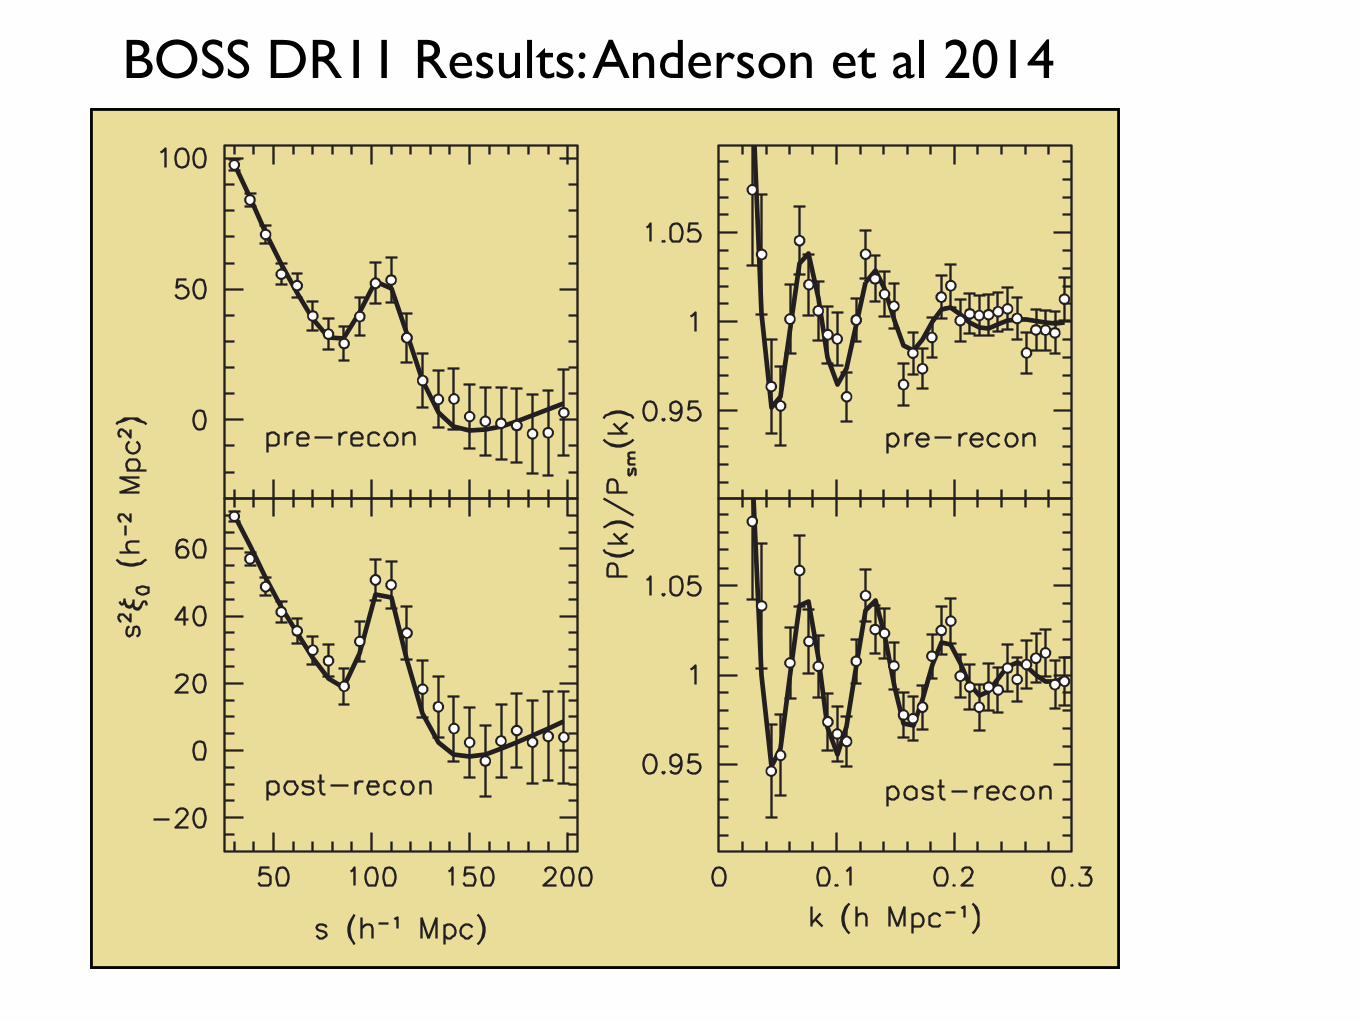
Fig. 11 displays the best-fitting BAO model (solid curves) com-pared to the data for ξ (s) (left-hand panels) and P(k) (right-handpanels) for DR11 only. The pre-reconstruction measurements aredisplayed in the top panels, and the post-reconstruction ones inthe bottom panels. The measurements are presented for our fidu-cial binning width and centring, and show a clear BAO feature in
both P(k) and ξ (s), with the best-fitting models providing a goodfit. The effect of reconstruction is clear for both the correlationfunction and power spectrum, with the BAO signature becomingmore pronounced relative to the smooth shape of the measure-ments. Indeed, all of the BAO measurements, listed in Table 7, haveimproved post-reconstruction, in contrast to our DR9 results (An-derson et al. 2012). This behaviour is expected given the results ofSection 4.2, which showed that, given the precision afforded by theDR11 volume coverage, reconstruction improved the results fromall of our mock catalogues. Reconstruction is particularly strikingin the power spectrum plot, showing a clear third peak in the post-reconstruction P(k).
6.2 DR11 acoustic-scale measurements
Our BAO measurements are listed in Table 7. The mocks for DR10and DR11 show significant improvement with reconstruction inmost realizations, and we therefore adopt the reconstruction resultsas our default measurements. Our consensus value for the CMASSBAO measurement, α = 1.0144 ± 0.0089, is determined from acombination of P(k) and ξ (s) measurements, and in what follows, wedescribe the process of obtaining this value, and tests that validateit.
Post-reconstruction, the significance of the BAO detection inboth the correlation function and the power spectrum are greaterthan 7σ for the reconstructed DR11 CMASS BAO measurements.The significance of detection is shown in Fig. 12, where we also
Figure 11. DR11 CMASS clustering measurements (black circles) with ξ (s) shown in the left-hand panels and P(k) in the right-hand panels. The top panelsshow the measurements prior to reconstruction and the bottom panels show the measurements after reconstruction. The solid lines show the best-fitting BAOmodel in each case. One can see that reconstruction has sharpened the acoustic feature considerably for both ξ (s) and P(k).
MNRAS 441, 24–62 (2014)
at New
York U
niversity on January 25, 2015http://m
nras.oxfordjournals.org/D
ownloaded from
BOSS DR11 Results: Anderson et al 2014