Embed Size (px)
Citation preview
International Journal of Science and Research (IJSR) ISSN (Online): 2319-7064
Impact Factor (2012): 3.358
Volume 3 Issue 9, September 2014 www.ijsr.net
Licensed Under Creative Commons Attribution CC BY
Lineament Extraction using Landsat 8 (OLI) in Gedo, Somalia
Umikaltuma Ibrahim1, Felix Mutua2
1Jomo Kenyatta University of Agriculture & Technology, Department of Geomatic Eng. & Geospatial Information Systems,
P.O. Box 62000, Nairobi, Kenya
2 Jomo Kenyatta University of Agriculture & Technology, Department of Geomatic Eng. & Geospatial Information Systems, P.O. Box 62000, Nairobi, Kenya
Abstract: Lineaments are linear features which provide information about the underlying geological structure. Their analysis are widely considered in the location or siting of suitable groundwater exploration sites since the water will tend to flow along the fracture zones. The paper’s major objective was to extract the lineaments in Gedo Region in southern Somalia, with a view of using the analysis for groundwater exploration in the future to mitigate the frequent droughts in the area. The analysis was carried out using Band 7 of Landsat 8 (OLI), which was automatically processed using the Lineament Extraction (LINE) module of PCI Geomatica to extract the lineaments in the region. These were then verified using sobel filtered images in the four cardinal directions and manually digitized lineaments from a geological map partly covering the region and false colour composites of the study area. The results showed that the automatic extraction of lineaments using LINE can yield tangible results using optical imagery. However, the lineaments still require verification through comparison with known lineaments. Directional filtering of Band 7 of Landsat 8 proved to be useful in visual identification and verification of lineaments. Keywords: Remote Sensing, Lineaments, Landsat 8 (OLI), LINE.
1. Introduction Lineaments are linear features evident at land surface that are an expression of the underlying geological structure. It is a mappable linear or curvilinear feature of a surface whose parts align in a straight or slightly curving relationship which may be caused by an existing fault or other line weakness. The surface features making up a lineament may be geomorphological, i.e. caused by relief or tonal, i.e. caused by contrast differences [1]. Analyses of lineaments in an area are a widely used method for ground water exploration since water naturally tends to be found near fracture zones [2]. The detection of lineaments from satellite imagery has been carried out successfully using a number of techniques including; applying sobel and gradient filters, principal component analyses. [3] applied gradient filtering and principal component analyses on band 7 of Landsat. They first applied gradient filters in eight directions then applied principal component analysis on each band created from the filtering. They concluded that principal component analysis using eight different gradient filtered bands was more effective than four major gradient filtered bands and recommended though that the methodology be tried and tested to the other areas for verification. There are two general methods of extracting lineaments from satellite imagery; the first involves manual digitizing of visually identified lineaments after image processing and the second is automated lineament extraction where the satellite image is subjected to automated processing by specifying different parameters such as curve length, linking distance, kernel size. The most popular automated processing tool used over the past few years has been LINE from PCI Geomatica [1].
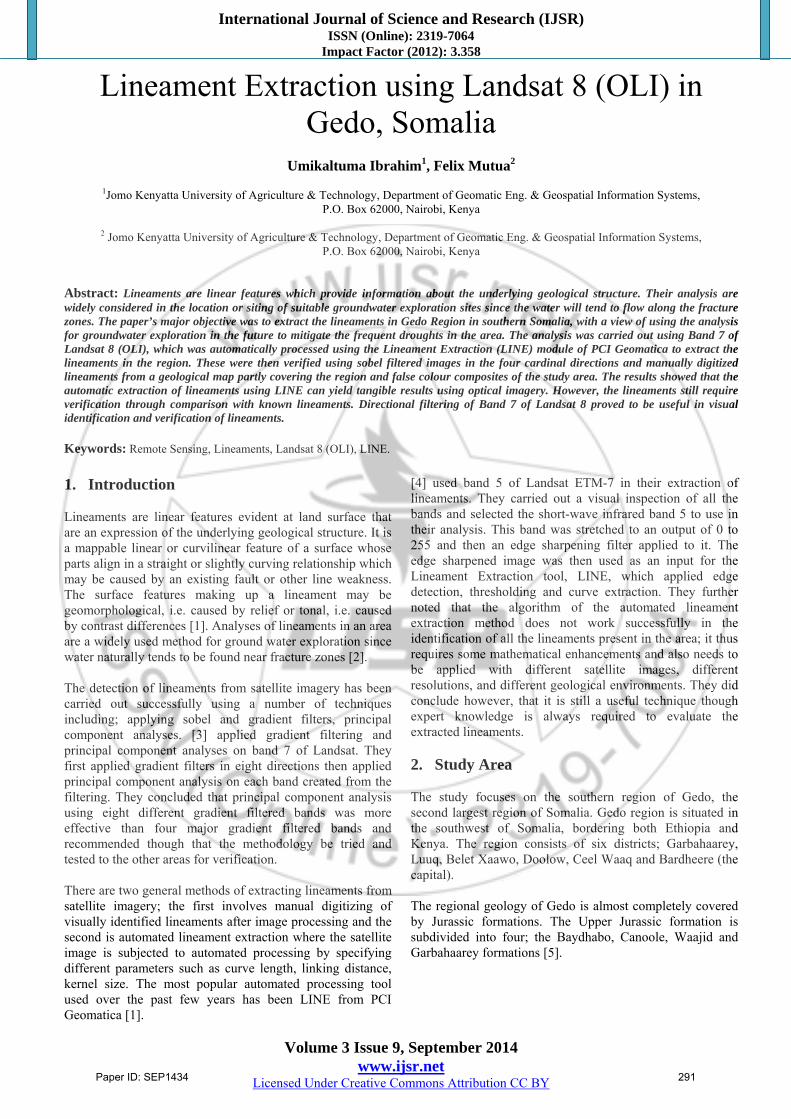
[4] used band 5 of Landsat ETM-7 in their extraction of lineaments. They carried out a visual inspection of all the bands and selected the short-wave infrared band 5 to use in their analysis. This band was stretched to an output of 0 to 255 and then an edge sharpening filter applied to it. The edge sharpened image was then used as an input for the Lineament Extraction tool, LINE, which applied edge detection, thresholding and curve extraction. They further noted that the algorithm of the automated lineament extraction method does not work successfully in the identification of all the lineaments present in the area; it thus requires some mathematical enhancements and also needs to be applied with different satellite images, different resolutions, and different geological environments. They did conclude however, that it is still a useful technique though expert knowledge is always required to evaluate the extracted lineaments. 2. Study Area The study focuses on the southern region of Gedo, the second largest region of Somalia. Gedo region is situated in the southwest of Somalia, bordering both Ethiopia and Kenya. The region consists of six districts; Garbahaarey, Luuq, Belet Xaawo, Doolow, Ceel Waaq and Bardheere (the capital).
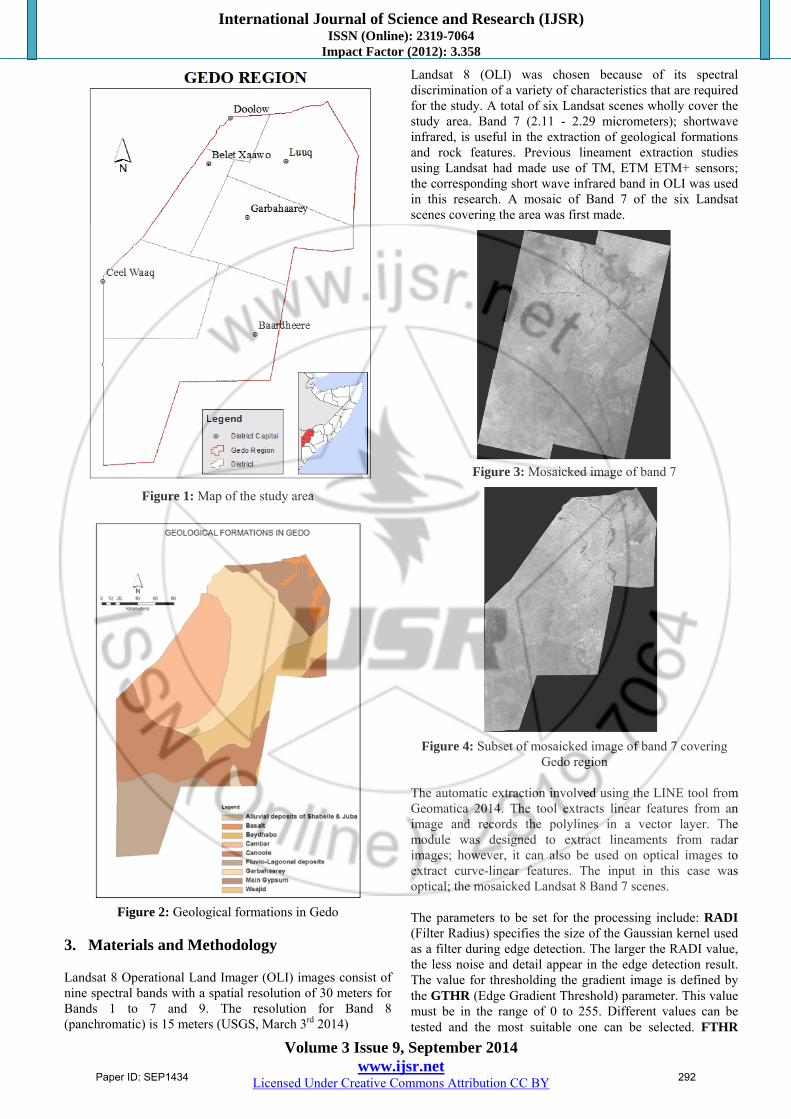
The regional geology of Gedo is almost completely covered by Jurassic formations. The Upper Jurassic formation is subdivided into four; the Baydhabo, Canoole, Waajid and Garbahaarey formations [5].
Paper ID: SEP1434 291
International Journal of Science and Research (IJSR) ISSN (Online): 2319-7064
Impact Factor (2012): 3.358
Volume 3 Issue 9, September 2014 www.ijsr.net
Licensed Under Creative Commons Attribution CC BY
Figure 1: Map of the study area
Figure 2: Geological formations in Gedo
3. Materials and Methodology Landsat 8 Operational Land Imager (OLI) images consist of nine spectral bands with a spatial resolution of 30 meters for Bands 1 to 7 and 9. The resolution for Band 8 (panchromatic) is 15 meters (USGS, March 3rd 2014)
Landsat 8 (OLI) was chosen because of its spectral discrimination of a variety of characteristics that are required for the study. A total of six Landsat scenes wholly cover the study area. Band 7 (2.11 - 2.29 micrometers); shortwave infrared, is useful in the extraction of geological formations and rock features. Previous lineament extraction studies using Landsat had made use of TM, ETM ETM+ sensors; the corresponding short wave infrared band in OLI was used in this research. A mosaic of Band 7 of the six Landsat scenes covering the area was first made.
Figure 3: Mosaicked image of band 7
Figure 4: Subset of mosaicked image of band 7 covering
Gedo region The automatic extraction involved using the LINE tool from Geomatica 2014. The tool extracts linear features from an image and records the polylines in a vector layer. The module was designed to extract lineaments from radar images; however, it can also be used on optical images to extract curve-linear features. The input in this case was optical; the mosaicked Landsat 8 Band 7 scenes. The parameters to be set for the processing include: RADI (Filter Radius) specifies the size of the Gaussian kernel used as a filter during edge detection. The larger the RADI value, the less noise and detail appear in the edge detection result. The value for thresholding the gradient image is defined by the GTHR (Edge Gradient Threshold) parameter. This value must be in the range of 0 to 255. Different values can be tested and the most suitable one can be selected. FTHR
Paper ID: SEP1434 292
International Journal of Science and Research (IJSR) ISSN (Online): 2319-7064
Impact Factor (2012): 3.358
Volume 3 Issue 9, September 2014 www.ijsr.net
Licensed Under Creative Commons Attribution CC BY
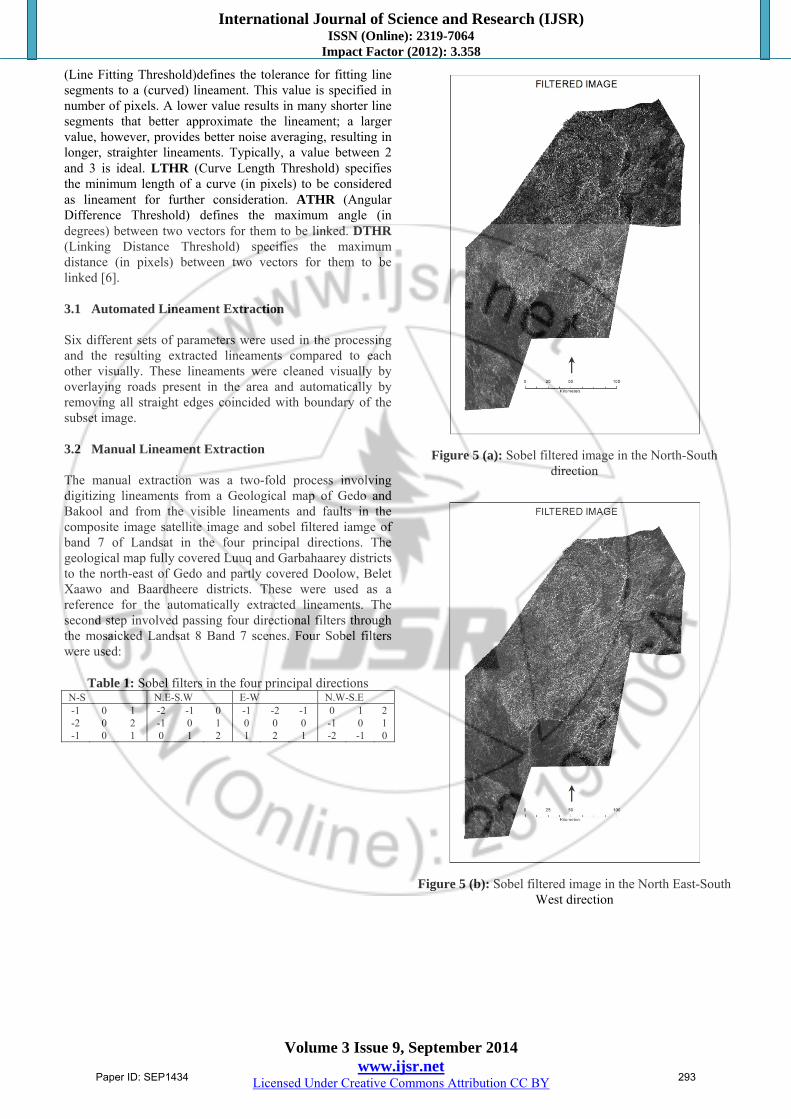
(Line Fitting Threshold)defines the tolerance for fitting line segments to a (curved) lineament. This value is specified in number of pixels. A lower value results in many shorter line segments that better approximate the lineament; a larger value, however, provides better noise averaging, resulting in longer, straighter lineaments. Typically, a value between 2 and 3 is ideal. LTHR (Curve Length Threshold) specifies the minimum length of a curve (in pixels) to be considered as lineament for further consideration. ATHR (Angular Difference Threshold) defines the maximum angle (in degrees) between two vectors for them to be linked. DTHR (Linking Distance Threshold) specifies the maximum distance (in pixels) between two vectors for them to be linked [6]. 3.1 Automated Lineament Extraction Six different sets of parameters were used in the processing and the resulting extracted lineaments compared to each other visually. These lineaments were cleaned visually by overlaying roads present in the area and automatically by removing all straight edges coincided with boundary of the subset image. 3.2 Manual Lineament Extraction The manual extraction was a two-fold process involving digitizing lineaments from a Geological map of Gedo and Bakool and from the visible lineaments and faults in the composite image satellite image and sobel filtered iamge of band 7 of Landsat in the four principal directions. The geological map fully covered Luuq and Garbahaarey districts to the north-east of Gedo and partly covered Doolow, Belet Xaawo and Baardheere districts. These were used as a reference for the automatically extracted lineaments. The second step involved passing four directional filters through the mosaicked Landsat 8 Band 7 scenes. Four Sobel filters were used:
Table 1: Sobel filters in the four principal directions N-S N.E-S.W E-W N.W-S.E -1 0 1 -2 -1 0 -1 -2 -1 0 1 2 -2 0 2 -1 0 1 0 0 0 -1 0 1 -1 0 1 0 1 2 1 2 1 -2 -1 0
Figure 5 (a): Sobel filtered image in the North-South
direction
Figure 5 (b): Sobel filtered image in the North East-South
West direction
Paper ID: SEP1434 293
International Journal of Science and Research (IJSR) ISSN (Online): 2319-7064
Impact Factor (2012): 3.358
Volume 3 Issue 9, September 2014 www.ijsr.net
Licensed Under Creative Commons Attribution CC BY
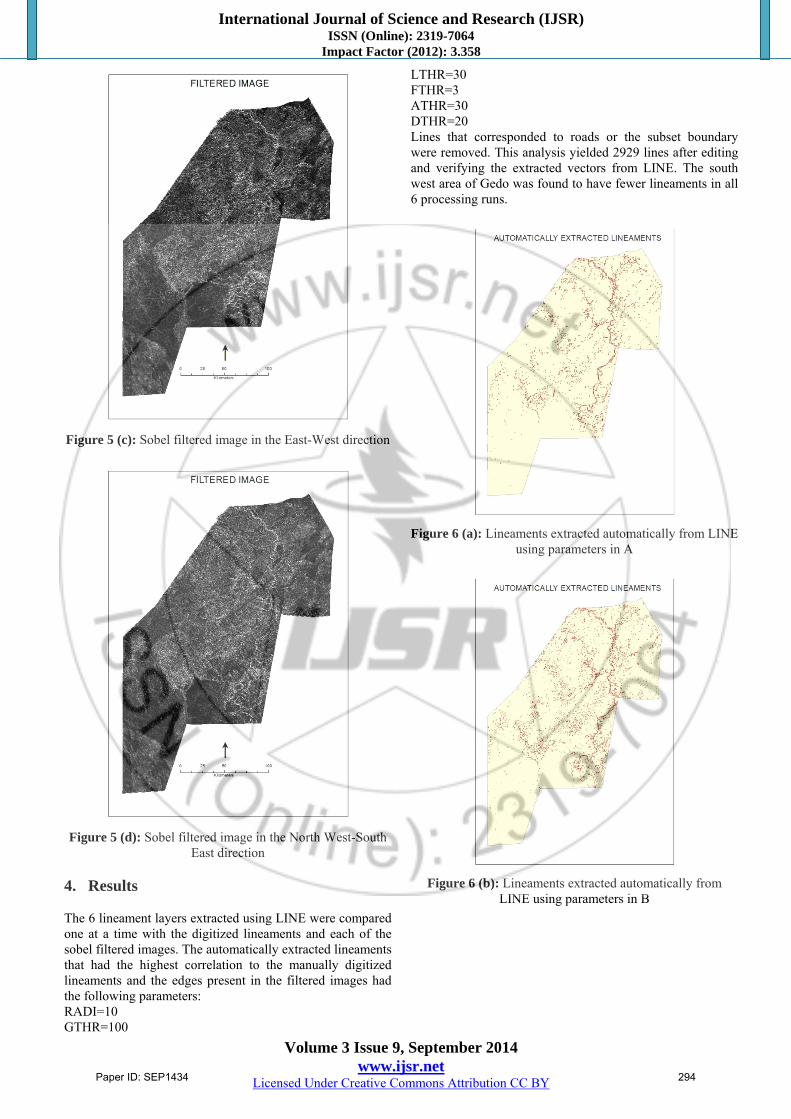
Figure 5 (c): Sobel filtered image in the East-West direction
Figure 5 (d): Sobel filtered image in the North West-South
East direction
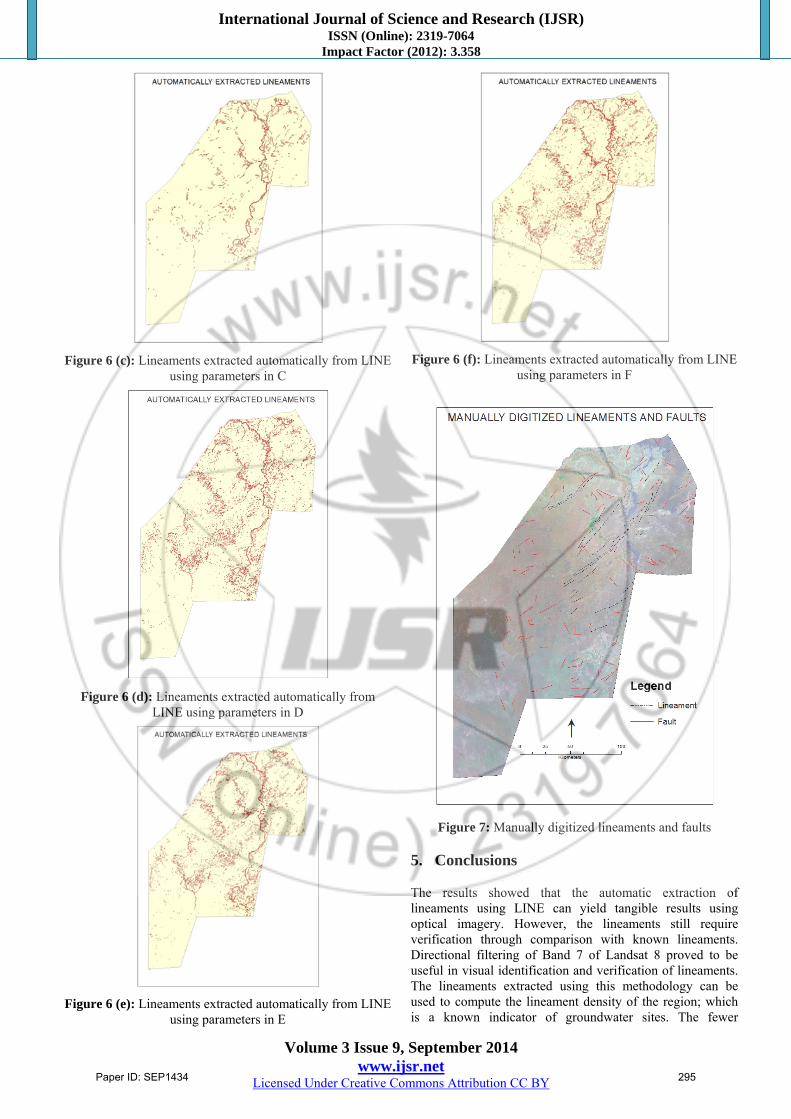
4. Results The 6 lineament layers extracted using LINE were compared one at a time with the digitized lineaments and each of the sobel filtered images. The automatically extracted lineaments that had the highest correlation to the manually digitized lineaments and the edges present in the filtered images had the following parameters: RADI=10 GTHR=100
LTHR=30 FTHR=3 ATHR=30 DTHR=20 Lines that corresponded to roads or the subset boundary were removed. This analysis yielded 2929 lines after editing and verifying the extracted vectors from LINE. The south west area of Gedo was found to have fewer lineaments in all 6 processing runs.
Figure 6 (a): Lineaments extracted automatically from LINE
using parameters in A
Figure 6 (b): Lineaments extracted automatically from
LINE using parameters in B
Paper ID: SEP1434 294
International Journal of Science and Research (IJSR) ISSN (Online): 2319-7064
Impact Factor (2012): 3.358
Volume 3 Issue 9, September 2014 www.ijsr.net
Licensed Under Creative Commons Attribution CC BY
Figure 6 (c): Lineaments extracted automatically from LINE
using parameters in C
Figure 6 (d): Lineaments extracted automatically from
LINE using parameters in D
Figure 6 (e): Lineaments extracted automatically from LINE
using parameters in E
Figure 6 (f): Lineaments extracted automatically from LINE
using parameters in F
Figure 7: Manually digitized lineaments and faults
5. Conclusions The results showed that the automatic extraction of lineaments using LINE can yield tangible results using optical imagery. However, the lineaments still require verification through comparison with known lineaments. Directional filtering of Band 7 of Landsat 8 proved to be useful in visual identification and verification of lineaments. The lineaments extracted using this methodology can be used to compute the lineament density of the region; which is a known indicator of groundwater sites. The fewer
Paper ID: SEP1434 295

International Journal of Science and Research (IJSR) ISSN (Online): 2319-7064
Impact Factor (2012): 3.358
Volume 3 Issue 9, September 2014 www.ijsr.net
Licensed Under Creative Commons Attribution CC BY
lineaments extracted in the south west of Gedo already indicate low groundwater potential in the area. This area, Baardheere, is usually the worst hit by drought. 6. Recommendations This study relied solely on Band 7 of Landsat 8 for the automatic extraction of the lineaments. Although it demonstrated the utility of Landsat in LINE, further research using radar imagery will be required to investigate the existence of lineaments in Baardheere district. The results of this study can be used as the main input in a weighted model to determine the groundwater potential of Gedo region. Lineament density can also be easily computed from the vector lines extracted from LINE. References [1] L. Q. Hung, O. Batelaan & F. De Smedt “Lineament
extraction and analysis, comparison of LANDSAT ETM and ASTER imagery. Case study: Suoimuoi tropical karst catchment, Vietnam,” Remote Sensing for Environmental Monitoring, GIS Applications, and Geology, V (2005)
[2] R. Maliva & T. Missimer, Arid Lands Water Evaluation and Management. New York: Springer, 2012.
[3] C. Ayday & E. Gümüşlüoğlu “Detection and interpretation of geological linear features on the satellite images by using gradient filtering and principal components analysis,” The International Archives of the Photogrammetry, Remote Sensing and Spatial Information Sciences , Vol. XXXVII, pp. 1207-1210, 2008.
[4] A. Abdullah, S. Nassr & A. Ghaleeb “Landsat ETM-7 for Lineament Mapping using Automatic Extraction Technique in the SW part of Taiz area, Yemen,” Global Journal of Human Social Science , 13 (3), 2013
[5] International Committee of the Red Cross “Water Resources Assessment, Water Supply Planning and Rehabilitation Surveys; Hydrogeological & Geophysical Surveys, Gedo Region”, International Committee of the Red Cross, 2002.
[6] PCI Geomatica 2014. (n.d.). Geomatica Help.
Author Profile
Umikaltuma Ibrahim received her BSc in Geomatic Engineering and Geospatial Information Systems from Jomo Kenyatta University of Agriculture and
Technology in 2012 and is currently pursuing her MSc degree in the same university. She has worked in the humanitarian sector in Somalia as a G.I.S specialist from 2012 to date.
Felix Mutua received his BSc. in Geomatic Engineering from Jomo Kenyatta University of Agriculture and Technology, Kenya with honors in 2006. He continued his studies at the same university
where he obtained his MSc. in Environmental Information Systems in 2009. He acquired a Ph.D. in Civil Engineering from The University of Tokyo, Japan in 2013. Felix Mutua’s current interests involve GIS and applications of satellite products in monitoring water resources, land use and land cover as well as applications of
microwave remote sensing for extreme weather and climate change impact assessment.
Paper ID: SEP1434 296


![Pal_et_al[1] SAR FFT Lineament IJRS](https://img.pdfslide.us/doc/110x75/577d205d1a28ab4e1e92a9c1/paletal1-sar-fft-lineament-ijrs.jpg)