Embed Size (px)
Citation preview
1
Line Protection: Redundancy, Reliability, and Affordability
Edmund O. Schweitzer, III, David Whitehead, Héctor J. Altuve Ferrer, Demetrios A. Tziouvaras, David A. Costello, and David Sánchez Escobedo, Schweitzer Engineering Laboratories, Inc.
2350 NE Hopkins Court, Pullman, WA 99163 USA, +1.509.332.1890
Abstract—In this paper, we apply fault tree analysis to compare the dependability and security of line protection schemes with different degrees of redundancy. We also compare the scheme costs. For each scheme, we use a basic protection scheme as the reference. We then evaluate schemes with double redundancy and two-out-of-three voting schemes. We also evaluate the effect of comprehensive commissioning testing, hidden failures, and common-mode failures, as well as using relays from the same or different manufacturers in redundant schemes.
I. INTRODUCTION
It is difficult to imagine any facet of our society that does not depend upon the safe, reliable, and economical supply of electric power. It is not surprising that the National Academy of Engineering ranked electrification as the most significant engineering accomplishment of the past century, noting its impact on quality of life and economic development. The interconnected electric grid is the largest and most complicated machine ever assembled. Our task today is even more challenging—we must reliably meet the ever-increasing demand for electric power with power systems operating near their limits, with new and variable generation sources, and with increased economic, environmental, security, and workforce pressures. At the heart of the electrical grid are protective relays, installed to maximize service continuity and minimize damage to systems, property, and personnel.
The performance goals for protective relays are amazingly high. Within a fraction of a power system cycle, the relay must determine the difference between normal or abnormal-but-tolerable conditions and a fault. Additionally, relays must be sensitive, dependable (trip for all in-zone faults), and secure (restrain for all out-of-zone faults or in the absence of faults).
Paul Anderson states that reliability in protection systems has always been provided by careful design based on the sound judgment of experienced engineers, rather than the use of reliability mathematics or models [1]. The high availability of our power systems is a testament to our good engineering. To continue to improve and objectively compare design alternatives, however, we can employ fault tree analysis [1] [2].
First used by H. A. Watson of Bell Laboratories in 1961 to analyze the Minuteman Launch Control System, fault tree analysis is a reliability-based tool that models systems and determines factors that influence overall system reliability. Fault trees are visual, easy-to-use tools that have been
employed by other reliability-conscious industries, such as the aviation and nuclear power industries.
II. THE GOOD OLD DAYS?
Electromechanical relays were used for decades as the backbone of our protective relay systems. As these devices aged, however, increased maintenance costs, lack of support by manufacturers, and incorrect operation data led many companies to replace them with microprocessor-based relays. One utility reported 30 to 35 percent of their incorrect operations were due to incorrect operation of electromechanical relays. Further, they acknowledged that through normal attrition, the number of technicians with knowledge of the intricate details of the maintenance and troubleshooting of electromechanical relays was dwindling. This led to an aggressive wholesale replacement project of some 1,200 transmission line protection panels [3].
Some will claim that complexity has increased with microprocessor-based relays and cite the increased number of relay settings as proof. Manufacturers must strive to reduce the number of settings and relay complexity and provide better settings and commissioning tools, literature, and training. However, Fig. 1 is a vivid reminder of just how many electromechanical relays and discrete wires and how much panel space and installation and maintenance effort was required in the good old days. These entire relay panels have been replaced with single microprocessor-based relays.
Fig. 1. A typical protection panel with electromechanical relays. Photo courtesy of Rafael Garcia, ONCOR Electric Delivery.
Microprocessor-based relay systems have higher availability, lower maintenance costs, self-testing, and
2
monitoring. They also provide event reporting. The days of listing “root cause unknown” after an incorrect relay operation are gone, thanks to the data-capturing features of modern relays. Event reports allow us to find root cause and improve reliability based on data.
However, microprocessor-based relays and many of our present industry practices have shifted complexity from panel designs and wiring to settings, logic, and communication. Along the way, many of us have eliminated the detailed control schematics of traditional schemes, replacing them with electronic settings files with little or no documentation. Many of us do not use commissioning plans or worksheets. We would do well to remember that regardless of how control logic is implemented, be it dc control wiring, internal relay logic, or IEC 61850, the protection system still needs to be documented, validated, and tested. While our technology platforms have changed, we should invoke fundamental practices that served us so well for years and put to work lessons we have learned, specifically:
• Commit increased effort and resources to training and mentorship.
• Require consultants and testing contractors to provide references and demonstrate experience during the evaluation of bids.
• Validate manufacturer specifications through type testing.
• Use reliability-based mathematical tools and models, such as fault tree analysis, to objectively evaluate designs.
• Require complete documentation of calculations, settings, and schemes, including logic diagrams, expected operation descriptions, and testing results.
• Perform peer review of designs, settings, and testing. • Maintain revision controls and document revision
history. • Develop and test standard schemes in the laboratory. • Move element and scheme testing to earlier in the
project timeline, and perform this work in the laboratory instead of in the field.
• Create and use commissioning and testing checklists. • Define commissioning as a separate project task, and
list it as a line item in requests for proposals. • Evaluate field events, and find root cause—in God we
trust, all others bring data. • Track performance and failures—what gets measured
gets done. • Invest resources and efforts where they make the
greatest positive impact.
III. RELIABILITY CONCEPTS
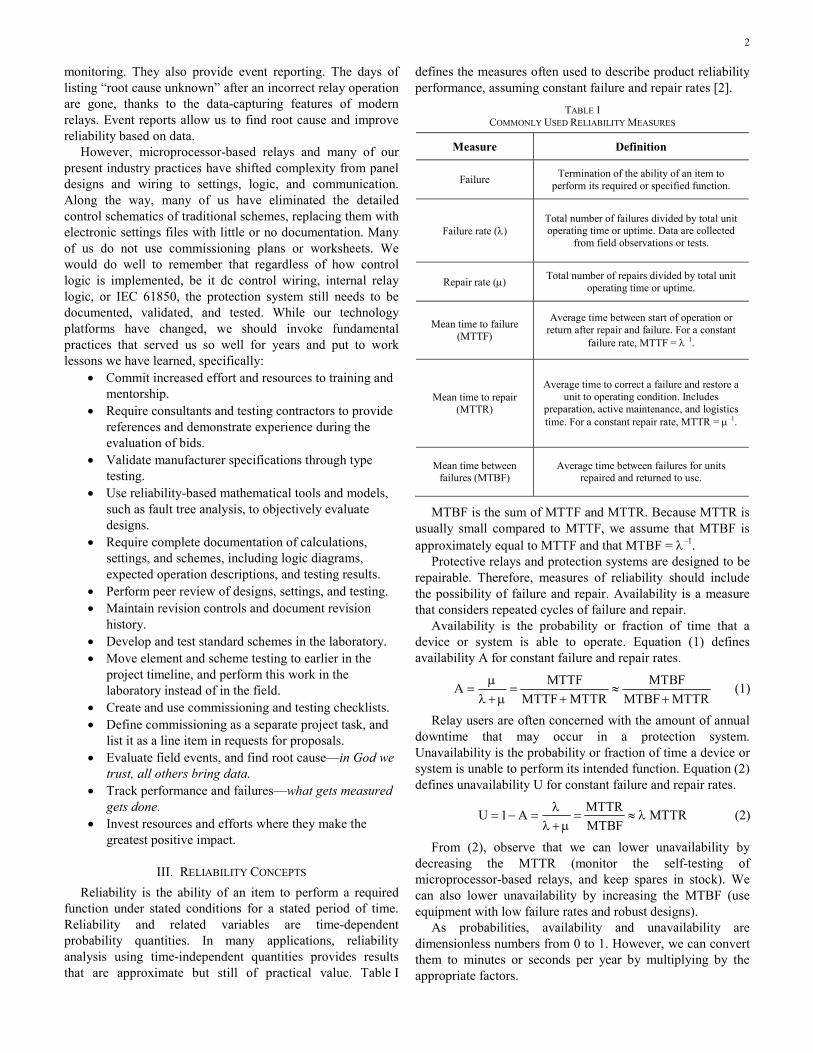
Reliability is the ability of an item to perform a required function under stated conditions for a stated period of time. Reliability and related variables are time-dependent probability quantities. In many applications, reliability analysis using time-independent quantities provides results that are approximate but still of practical value. Table I
defines the measures often used to describe product reliability performance, assuming constant failure and repair rates [2].
TABLE I COMMONLY USED RELIABILITY MEASURES
Measure Definition
Failure Termination of the ability of an item to
perform its required or specified function.
Failure rate (λ) Total number of failures divided by total unit operating time or uptime. Data are collected
from field observations or tests.
Repair rate (μ) Total number of repairs divided by total unit
operating time or uptime.
Mean time to failure (MTTF)
Average time between start of operation or return after repair and failure. For a constant
failure rate, MTTF = λ–1.
Mean time to repair (MTTR)
Average time to correct a failure and restore a unit to operating condition. Includes
preparation, active maintenance, and logistics time. For a constant repair rate, MTTR = μ–1.
Mean time between failures (MTBF)
Average time between failures for units repaired and returned to use.
MTBF is the sum of MTTF and MTTR. Because MTTR is usually small compared to MTTF, we assume that MTBF is approximately equal to MTTF and that MTBF = λ–1.
Protective relays and protection systems are designed to be repairable. Therefore, measures of reliability should include the possibility of failure and repair. Availability is a measure that considers repeated cycles of failure and repair.
Availability is the probability or fraction of time that a device or system is able to operate. Equation (1) defines availability A for constant failure and repair rates.
MTTF MTBF
AMTTF MTTR MTBF MTTR
μ= = ≈λ +μ + +
(1)
Relay users are often concerned with the amount of annual downtime that may occur in a protection system. Unavailability is the probability or fraction of time a device or system is unable to perform its intended function. Equation (2) defines unavailability U for constant failure and repair rates.
MTTR
U 1 A MTTRMTBF
λ= − = = ≈ λ
λ +μ (2)
From (2), observe that we can lower unavailability by decreasing the MTTR (monitor the self-testing of microprocessor-based relays, and keep spares in stock). We can also lower unavailability by increasing the MTBF (use equipment with low failure rates and robust designs).
As probabilities, availability and unavailability are dimensionless numbers from 0 to 1. However, we can convert them to minutes or seconds per year by multiplying by the appropriate factors.
3
Failure rates, MTBF, and MTTR data are required for probability calculations, block diagrams, and fault tree analysis. These data also provide the basis for reliability-centered maintenance and testing intervals, as required by North American Electric Reliability Corporation (NERC) Standard PRC-005-1 [4]. This standard requires protection system owners to have a program that includes maintenance and testing intervals and their basis, a summary of maintenance and testing procedures, and documentation (evidence that tests were completed and the dates on which testing was performed) [5]. These data can be obtained directly from manufacturers, experience, or references such as [6].
IV. COMMON-MODE AND HIDDEN FAILURES
Using 18 months of data that detailed every relay operation on a utility system (over 1,400 operations), one study analyzed every event to root cause [7]. The authors concluded that only one misoperation out of the 79 total was due to what could be considered an unexplained relay failure. A solid-state relay operated incorrectly (unknown cause) for an out-of-section fault on a parallel line. Yet, in post-fault tests, the relay performed as expected. This one security failure out of 79 misoperations does not seem to merit a wholesale change to a two-of-three voting scheme.
On the other hand, the data also show that false trips outnumber failures to trip by a factor of about five to one [7]. This fact typically drives the call for two-of-three voting schemes. However, a fully redundant voting scheme (having three sets of each scheme component) would be very expensive, considering the cost of dc power systems, channels, and instrument transformers. This paper shows that sharing these scheme components affects the voting scheme dependability and security. In addition, voting schemes are more complex than dual-redundant schemes and require redundant relays to have similar sensitivities to ensure the operation of at least two of the three relays.
Many engineers advocate diversity in a relaying system as the intentional application of differences in order to prevent common-mode failures between redundant schemes. A number of measures may be applied to provide diversity, including the use of redundant systems that employ different operating principles (for example, distance/directional Main 1 versus line current differential Main 2). This, of course, can be done with relays from the same or different manufacturers.
Those in the “two-manufacturer” camp will say that an advantage of using two different manufacturers is that component-specific or firmware-related malfunctions in one relay do not prevent the other relay from operating to clear a fault. This assumes the manufacturers do not use any common components. Consider that relay manufacturers often build their products with the same brand of components, including microprocessors, integrated circuits, and power supplies. Using products from different manufacturers does not guarantee independence of common components; careful inspection of designs should replace assumption. In addition, the same manufacturer usually provides similar protection
functions in different relays (different hardware platforms). Some utilities use two different relays from the same manufacturer in redundant systems.
The most frequent common-mode failures result from device settings or system design errors. Errors in the power system parameters or the settings calculations and design errors affecting the protection scheme logic, for example, may cause these types of common-mode failures. Reducing these failures requires careful review of settings and designs rather than using relays from different manufacturers.
Still others maintain there are commercial advantages to using multiple manufacturers, such as having an alternate supplier ready in case one cannot deliver. Although this may well be true, the benefit must be weighed against the cost, performance, support, training, and maintenance impacts of using two different systems. For example, others may feel it is an advantage to use a single manufacturer for simplicity, reduction in training, and ease of engineering and testing.
Reference [8] opines that using one manufacturer alone relaxes the skill set of our industry professionals. Additionally, the authors claim that while manufacturers provide sound designs with reliable components and place emphasis on internal monitoring of microprocessor health and availability, so-called hidden failures occur. The authors define a hidden failure as an undetected failure, a lurking flaw that type, factory, and commissioning tests have not detected.
It is not our intention to dismiss this concern or to minimize the diligence of engineers who consider such probabilities. The beauty of fault tree analysis is that it allows us to consider such events in a qualitative and objective way to determine their actual impact on overall system design and reliability.
We can even propose a known issue (today) that at one time represented a hidden failure. Polypropylene capacitors, used in early microprocessor-based relays built before 1990, started showing signs of drifting in value over time. The capacitor drift could lead to erroneous metering and possible incorrect operation. This problem, which became apparent through diligent root cause analysis in the 1990s, led to design changes across the industry and service bulletins to proactively repair the installed base of affected units. Assume for the moment that the protection system design did not automatically compare the metering data between redundant systems (a great way to validate measurements and detect a failure or drift in one system). Before a customer received a service bulletin, we might consider this a prime example of a hidden failure. We can now analyze the impact of such a hidden failure or common-mode failure (if both relays in a redundant system were of the same design) on security and dependability using fault tree analysis.
V. WHAT DO OTHER INDUSTRIES DO FOR REDUNDANCY?
Many industries requiring high reliability use redundant systems with identical components. The aviation industry is one example. This industry pays considerable attention to reducing human error, which is the probable root cause of 70 to 80 percent of civil and military aviation accidents. While
4
accidents attributable solely to mechanical failures have decreased markedly over the past 40 years, those attributable to human error have declined at a much slower rate. Therefore, analysts try to reduce the occurrence and consequences of human error through root cause analysis, called human factor analysis. In one study, 100 percent of the air crew-related accidents were accounted for using the framework of human factor analysis and classification [9].
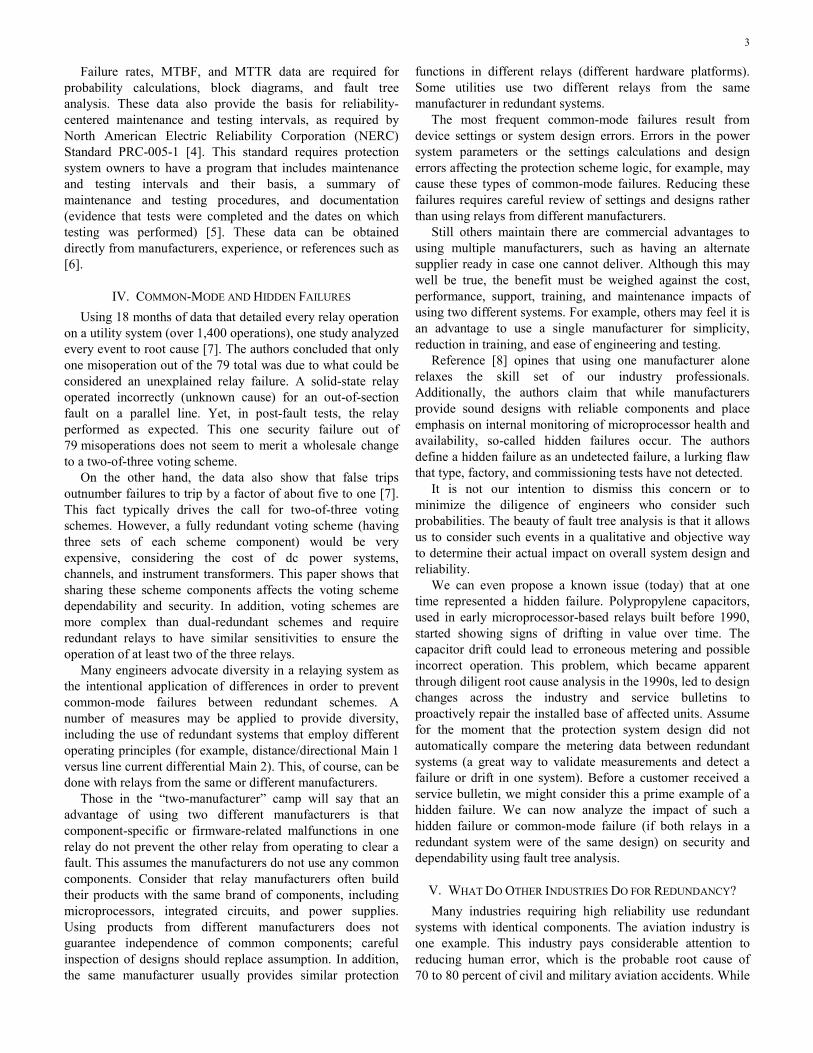
Consider the Cessna Citation X® shown in Fig. 2. Many redundant systems are onboard, each built by the same manufacturer, including two Rolls Royce® jet engines and two Honeywell® flight management systems, as well as radios, air-data computers, autopilot systems, and other systems [2]. The aviation industry uses the same manufacturer for redundant power plants, flight management, navigation, and controls to avoid the complexity of flying an aircraft with different engines or with different control systems in the left and right pilot seats. Aviation design emphasizes proven, highly reliable components and the ability to withstand any single failure. In some cases, designers choose backup systems based on different principles of operation but with similar functions (such as the attitude gyroscope and altimeter on the dashboard).
Fig. 2. Aircraft dual primary systems of one manufacturer: same engines, same radios, same air-data computers, and same flight management systems. Photos courtesy of Cessna Aircraft Company.
VI. PROTECTION REDUNDANCY REQUIREMENTS
The Electric Reliability Council of Texas (ERCOT) is the independent system operator for most of the state of Texas. ERCOT operating guidelines place equal emphasis on ensuring dependability (tripping for an in-zone fault) and security (not tripping unnecessarily for out-of-zone faults) [10]. For transmission lines operating at 100 kV and above, two protective relay systems are required. The guide states that each system shall be independently capable of detecting and isolating faults, while maintaining selectivity. However, complete redundancy is not mandated. In fact, a common practice today in Texas is communications-assisted primary protection with step-distance and directional overcurrent backup protection. The guide states that the use of two identical protective relay systems is not generally recommended because of the risk of simultaneous failure due to design deficiencies or problems. This one guideline has led some Texas utilities to use a primary relay from one manufacturer and a redundant or backup relay from another manufacturer [11]. At the same time, the guide also emphasizes simplicity of design, using relays of proven quality that operate in the shortest time with due regard for
selectivity, dependability, and security and minimize the possibility of incorrect operations due to personnel error. These directives have led many others in Texas to use two relays from one preferred manufacturer [3] [12].
Texas operators are instructed to minimize the possibility of component failure and malfunction due to transients, interfaces, vibration, shock, and temperature—although few, if any, utilities perform their own independent validation of manufacturer specifications. Consider that the North American Northeast Blackout of 2003 was aggravated by improper operator action because of a lack of up-to-date information from the supervisory control and data acquisition (SCADA) system. A remote terminal unit (RTU) had been installed with two redundant power supplies that both failed because of ground potential rise. The equipment was not substation hardened (specified to meet IEEE C37.90 [13] or better). Independent testing (simple High Potential Isolation Testing) had not detected this product weakness. Self-test monitoring did not alert the operator that the RTU was dead. Fail-safe design practices, such as reporting full-scale or zero values for all data fields during loss of communications or for watchdog timer failures, were not in place. Redundant power supplies, installed to improve the availability of the system, did not overcome these larger handicaps [6]. It’s not a hidden failure just because you didn’t check for it.
NERC is presently developing a Protection System Reliability Standard. NERC is certified by the Federal Energy Regulatory Commission (FERC) as the one electric reliability organization that may develop and enforce reliability standards for the bulk transmission system in the United States. FERC was given this jurisdiction through the Energy Policy Act of 2005. The System Protection and Control Subcommittee (SPCS) of the NERC Planning Committee wrote a technical paper that proposes reliability requirements [14]. This document does not mandate complete redundancy but rather states performance requirements. In some cases, existing protection systems will not need to be upgraded or changed. In other situations, if a single component failure prevents the existing protection system from meeting the performance requirements as specified in the NERC planning standards, then modifications would be required. An example given is a generating plant with a critical clearing time of 4 cycles, where a breaker failure following an operation of high-speed protection would result in system instability (a violation of the performance requirements). It would be necessary to add a redundant (series) breaker. The task of evaluating existing protection systems against NERC performance requirements will fall on the utility protection engineer.
These efforts are happening in parallel and in coordination with an IEEE Power System Relaying Committee (PSRC) working group (WG-I19), which has published a technical paper on protection system redundancy [6]. This technical paper was presented as the cover story in the March 2010 issue of PAC World magazine, which devoted the issue to the topic of reliability and redundancy. Editor-in-chief Alex Apostolov reminds us that focusing on the reliability of the
5
protection and control system is important but not sufficient. The entire fault-clearing system must be considered. He closes with a great quote by Edsger Dijkstra: “Simplicity is prerequisite for reliability” [15].
In the end, the ERCOT operating guide is just that; it is a guide rather than a mandate, leaving the individual operator a great amount of freedom in design decisions. Other areas in North America are similarly governed today. However, NERC, IEEE PSRC, and other activities show that our collective attention is focused on improving reliability and that enforceable mandates appear to be in our future.
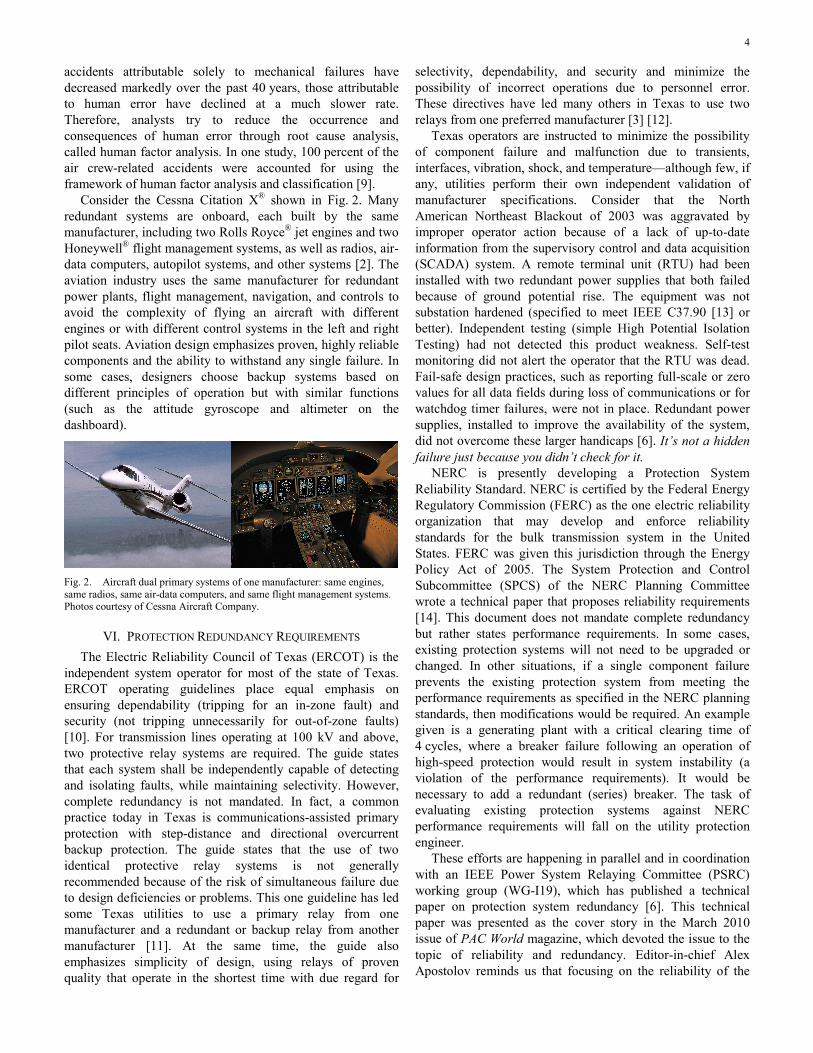
VII. LINE PROTECTION SCHEMES
In this paper, we compare the reliability of three schemes for protecting a transmission line with single breakers at both ends. All schemes use multifunction relays. We start from the basic line protection scheme shown in Fig. 3a. The basic scheme consists of a communications-assisted protection scheme (Relay R1) complemented with a separate distance protection scheme (Relay R2) at each line end. The scheme
includes one set of instrument transformers, one dc power system, and a breaker with a single trip coil at each line end. In this scheme, the Zone 1 elements of the communications-assisted and distance schemes provide redundant protection, independent from the communications channel. The scheme lacks redundancy for faults that fall out of the reach of one of the Zone 1 elements.
Fig. 3b shows the dual-redundant protection scheme, which includes two communications-assisted schemes with separate communications channels, two relays, two sets of instrument transformers, two dc power systems, and a breaker with redundant trip coils at each line end. To create a two-out-of-three voting scheme, we add a third communications-assisted scheme to the Fig. 3b scheme. In this paper, we compare a fully redundant voting scheme, with cases in which two of the three schemes share the dc power system, the communications channel, or the instrument transformers. In redundant schemes, we assume all the redundant components are of similar quality. We assume relays have the same reliability indices, sensitivities, and operation speeds.
Fig. 3. Single and dual-redundant transmission line protection schemes.
6
VIII. FAULT TREE ANALYSIS
Fault tree analysis is a practical tool for determining how component failure contributes to a specific failure event [1] [2]. Engineers can use fault tree analysis to compare the relative reliability of proposed protection schemes.
The failure event of interest is called the top event. A system may have more than one top event that merits investigation. The failure rate for the top event is a combination of the failure rates of the basic events that contribute to the top event. Basic events are individual component failures with identified failure rates. We use AND gates to express a failure caused only when all the lower-level failures occur (product of failure rates). We use OR gates to express failures caused by any lower-level failure (sum of failure rates). We can also use availability, unavailability, or MTBF figures instead of failure rates in fault tree analysis.
The power system performance requirements (for example, preserving transient stability) determine the top event of the fault tree. If, for example, the power system requires high-speed fault clearing to preserve transient stability, the top event should only consider high-speed protection. However, if the power system remains stable after a breaker failure protection operation, the top event should also consider breaker failure protection.
Fault tree analysis helps in analyzing the security or dependability of a protection system. Analyzing the dependability and the security of a protection system requires different fault trees. For constructing each tree, we identify which component failures may cause a failure to trip (a dependability problem) or an undesired trip (a security problem). This analysis leads to different tree topologies and different failure rate (or unavailability) values. For example, nearly any relay failure could cause a failure to trip. However, not all relay failures cause an undesired trip. Hence the relay failure rate or unavailability value to use for dependability analysis is higher than the value to use for security analysis.
In this paper, we use unavailability for dependability fault trees because failures to clear faults depend on component downtime per failure. We use failure rate for security fault trees because undesired trips typically occur at the instant a component fails [16].
We created 44 fault trees (22 for dependability analysis and 22 for security analysis) for the following combination of protection schemes and other factors:
• Basic directional comparison permissive overreaching transfer trip (POTT) scheme with a microwave channel.
• Basic POTT scheme with a fiber-optic channel. • Basic directional comparison blocking (DCB) scheme
with a power line carrier channel. • Dual-redundant POTT scheme with relays from the
same manufacturer. • Dual-redundant POTT scheme with relays from
different manufacturers. • Dual-redundant POTT scheme that experiences
common-mode failures. • Redundant two-out-of-three voting POTT schemes
with four different levels of redundancy. • Redundant two-out-of-three voting POTT scheme that
experiences common-mode failures. For each of these schemes, we created a fault tree that
considers the normal process of commissioning testing of the protection scheme and another fault tree that reflects the effect of comprehensive commissioning testing. Reference [17] describes a process with a checklist for consistent and thorough commissioning tests. Reference [18] reviews best practices and provides a list of lessons learned from commissioning protective relay systems.
The appendix shows the reliability indices (Table IV) that we used in the fault trees and includes an explanation of the method we followed to determine each value.
In this section, we describe several fault trees and summarize the results obtained from all the fault trees in Table II.
7
A. Single Schemes
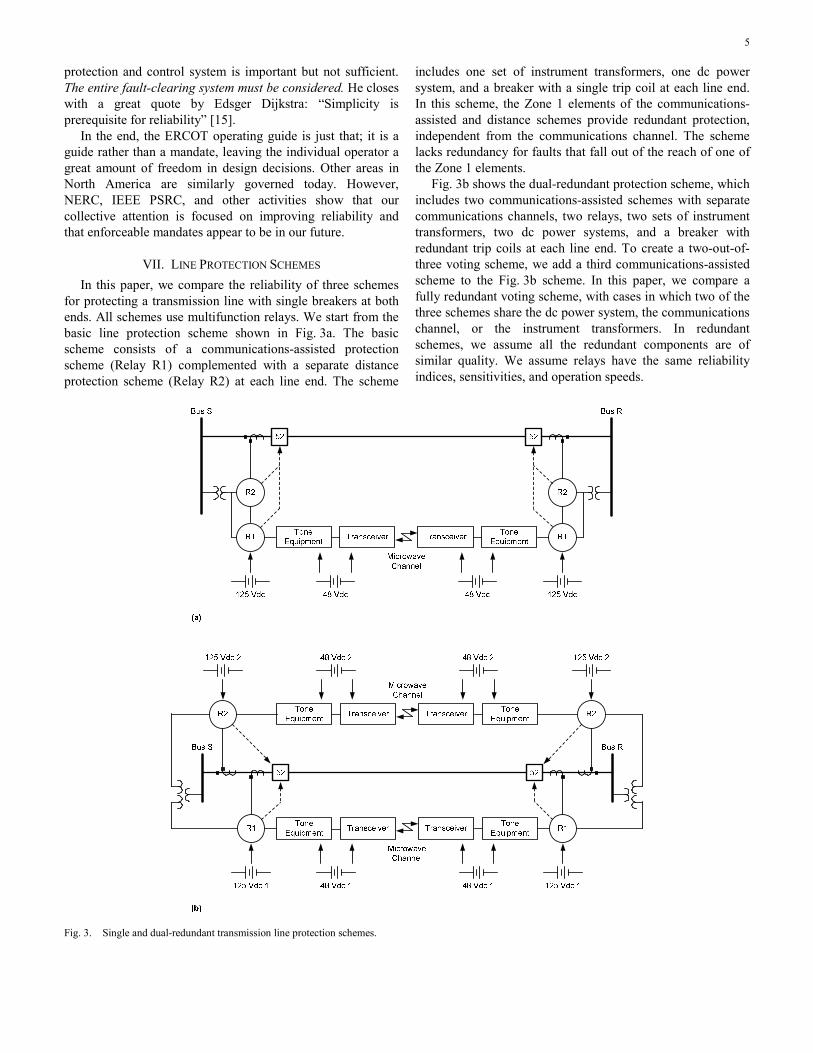
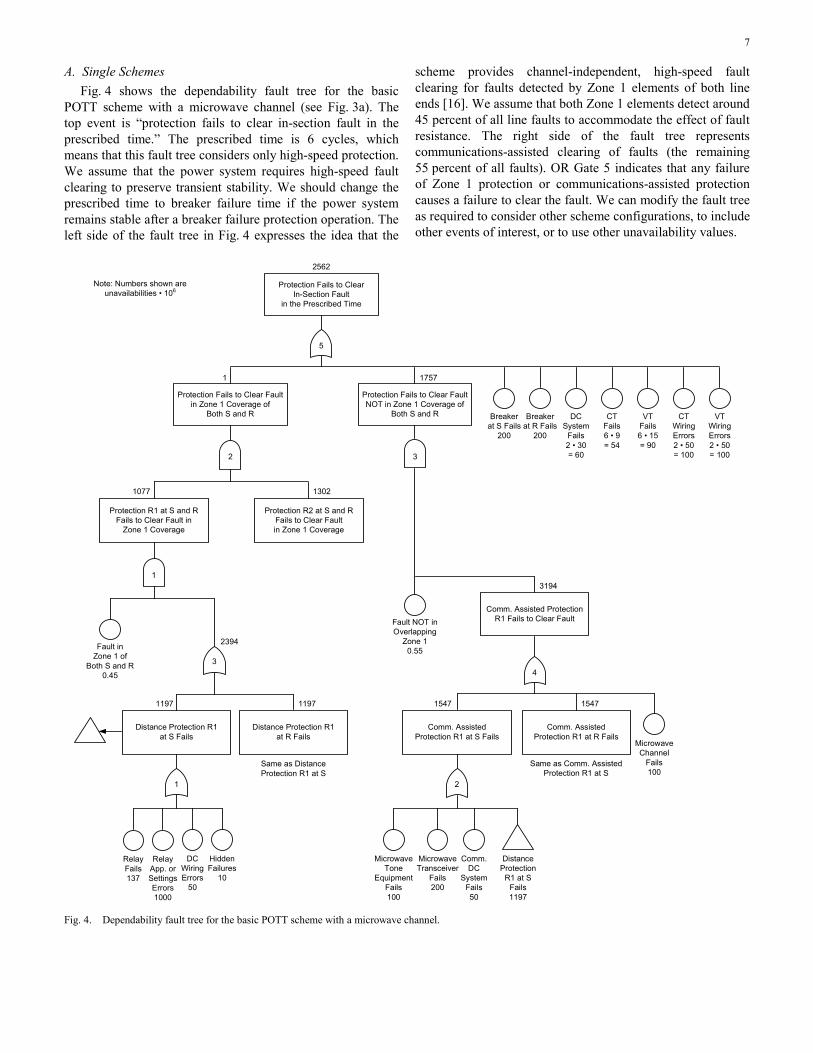
Fig. 4 shows the dependability fault tree for the basic POTT scheme with a microwave channel (see Fig. 3a). The top event is “protection fails to clear in-section fault in the prescribed time.” The prescribed time is 6 cycles, which means that this fault tree considers only high-speed protection. We assume that the power system requires high-speed fault clearing to preserve transient stability. We should change the prescribed time to breaker failure time if the power system remains stable after a breaker failure protection operation. The left side of the fault tree in Fig. 4 expresses the idea that the
scheme provides channel-independent, high-speed fault clearing for faults detected by Zone 1 elements of both line ends [16]. We assume that both Zone 1 elements detect around 45 percent of all line faults to accommodate the effect of fault resistance. The right side of the fault tree represents communications-assisted clearing of faults (the remaining 55 percent of all faults). OR Gate 5 indicates that any failure of Zone 1 protection or communications-assisted protection causes a failure to clear the fault. We can modify the fault tree as required to consider other scheme configurations, to include other events of interest, or to use other unavailability values.
Protection Fails to Clear Faultin Zone 1 Coverage of
Both S and R
1
Distance Protection R1 at S Fails
Protection R1 at S and RFails to Clear Fault in
Zone 1 Coverage
1197 1197
Same as DistanceProtection R1 at S
Distance Protection R1 at R Fails
2394
Protection Fails to Clear FaultNOT in Zone 1 Coverage of
Both S and R
1757
Comm. AssistedProtection R1 at S Fails
Comm. Assisted ProtectionR1 Fails to Clear Fault
1547 1547
Comm.DC
SystemFails50
Microwave Tone
EquipmentFails100
MicrowaveTransceiver
Fails200
Same as Comm. AssistedProtection R1 at S
Comm. AssistedProtection R1 at R Fails
Fault NOT inOverlapping
Zone 10.55
3194
MicrowaveChannel
Fails100
DistanceProtection
R1 at S Fails1197
Protection R2 at S and RFails to Clear Fault in Zone 1 Coverage
1302
Protection Fails to ClearIn-Section Fault
in the Prescribed Time
2562
Note: Numbers shown are unavailabilities • 106
DCWiringErrors
50
RelayApp. orSettings Errors 1000
RelayFails137
HiddenFailures
10
Fault inZone 1 of
Both S and R0.45
1077
Breaker at S Fails
200
Breaker at R Fails
200
DCSystem
Fails2 • 30= 60
CT Fails6 • 9= 54
CTWiringErrors2 • 50= 100
VTWiringErrors2 • 50= 100
VT Fails6 • 15= 90
5
2 3
1
3
4
21
Fig. 4. Dependability fault tree for the basic POTT scheme with a microwave channel.
8
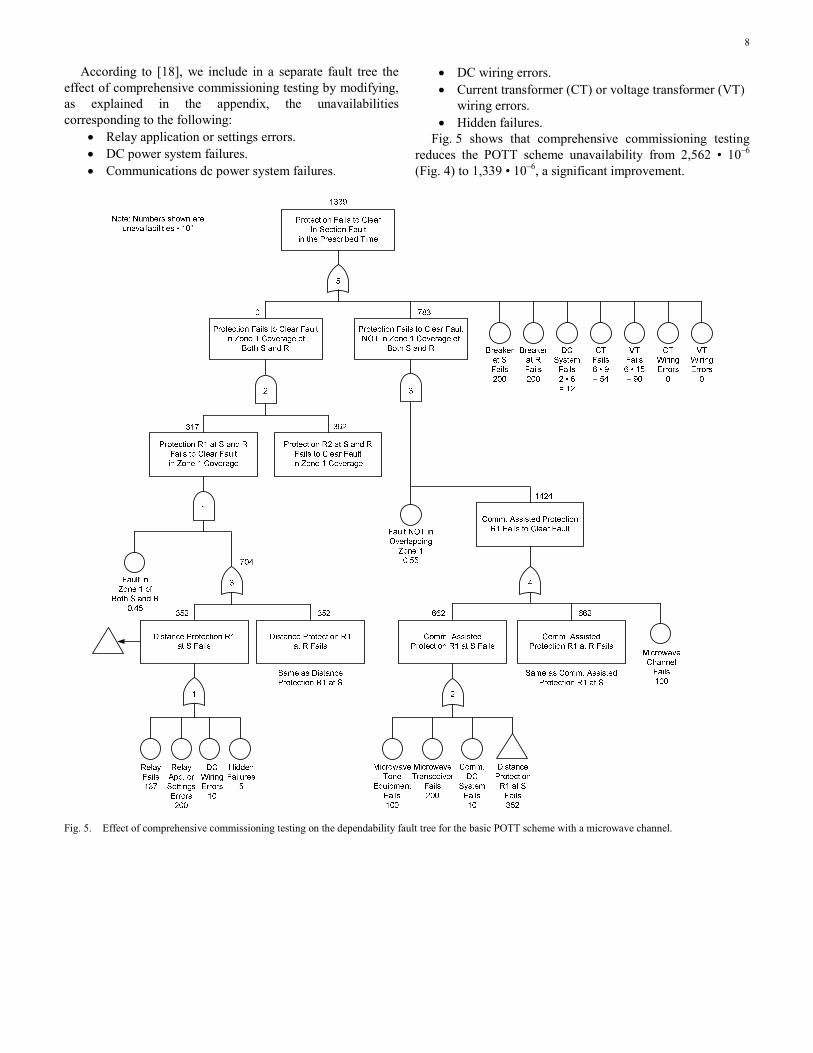
According to [18], we include in a separate fault tree the effect of comprehensive commissioning testing by modifying, as explained in the appendix, the unavailabilities corresponding to the following:
• Relay application or settings errors. • DC power system failures. • Communications dc power system failures.
• DC wiring errors. • Current transformer (CT) or voltage transformer (VT)
wiring errors. • Hidden failures.
Fig. 5 shows that comprehensive commissioning testing reduces the POTT scheme unavailability from 2,562 • 10–6 (Fig. 4) to 1,339 • 10–6, a significant improvement.
Fig. 5. Effect of comprehensive commissioning testing on the dependability fault tree for the basic POTT scheme with a microwave channel.
9
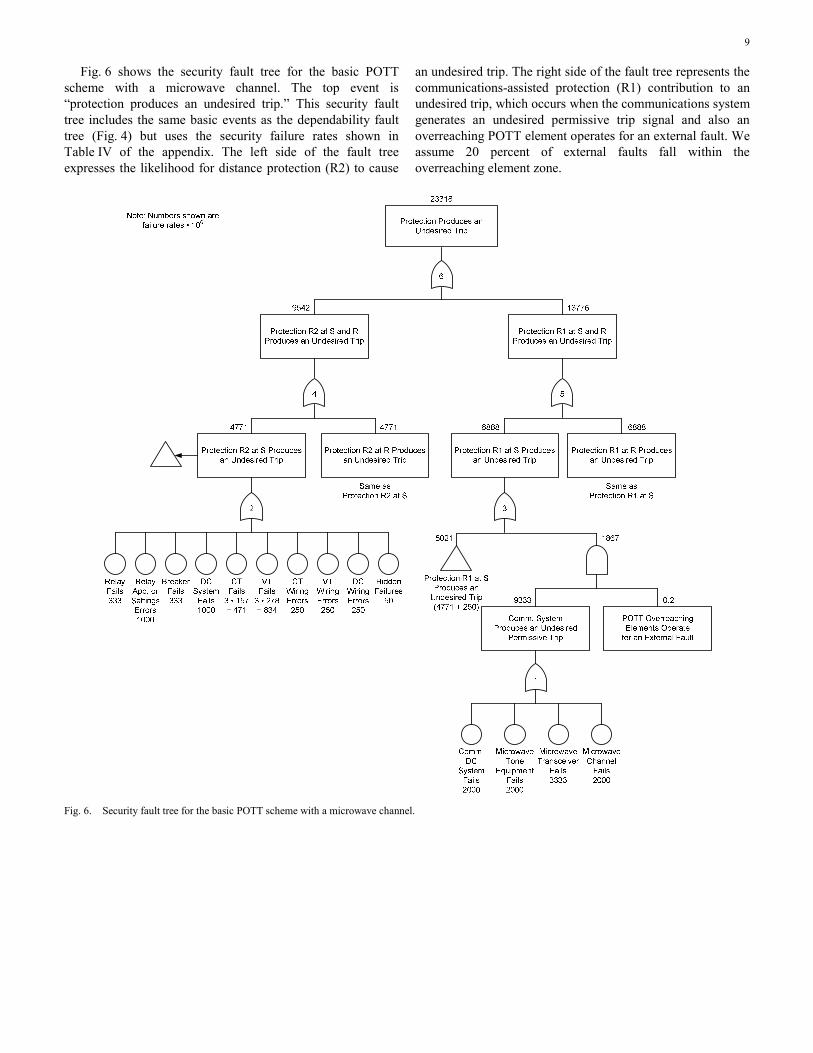
Fig. 6 shows the security fault tree for the basic POTT scheme with a microwave channel. The top event is “protection produces an undesired trip.” This security fault tree includes the same basic events as the dependability fault tree (Fig. 4) but uses the security failure rates shown in Table IV of the appendix. The left side of the fault tree expresses the likelihood for distance protection (R2) to cause
an undesired trip. The right side of the fault tree represents the communications-assisted protection (R1) contribution to an undesired trip, which occurs when the communications system generates an undesired permissive trip signal and also an overreaching POTT element operates for an external fault. We assume 20 percent of external faults fall within the overreaching element zone.
Fig. 6. Security fault tree for the basic POTT scheme with a microwave channel.
10
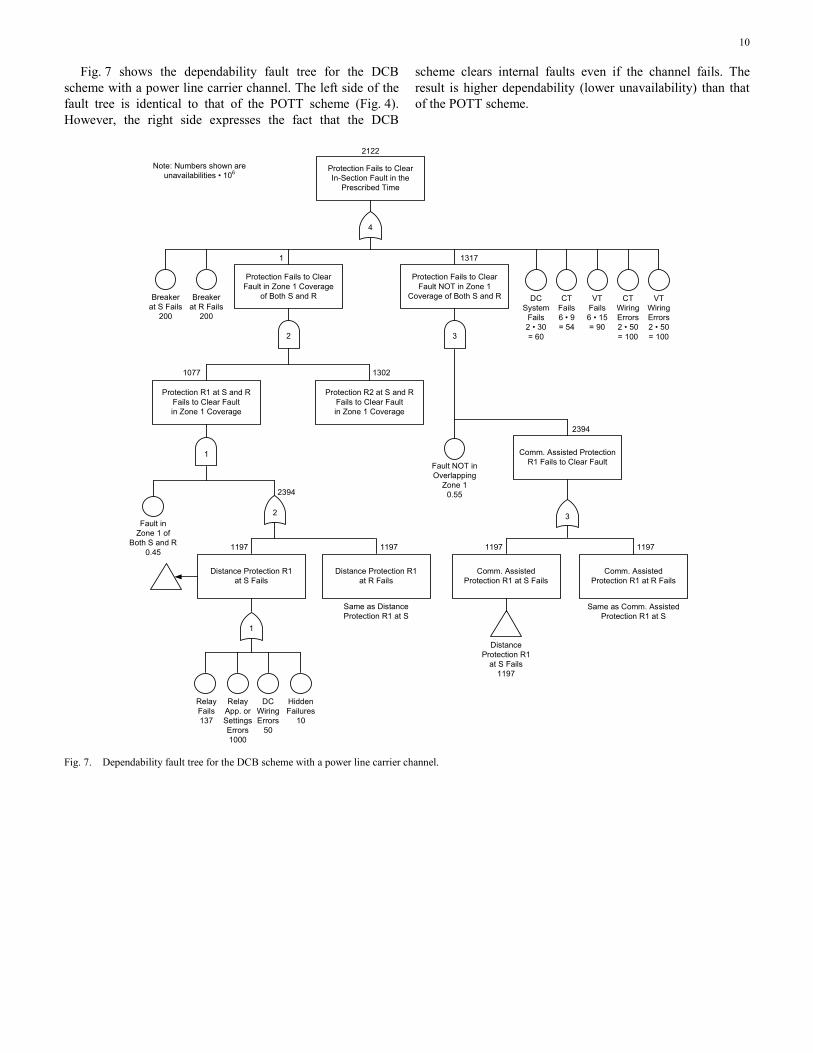
Fig. 7 shows the dependability fault tree for the DCB scheme with a power line carrier channel. The left side of the fault tree is identical to that of the POTT scheme (Fig. 4). However, the right side expresses the fact that the DCB
scheme clears internal faults even if the channel fails. The result is higher dependability (lower unavailability) than that of the POTT scheme.
Protection Fails to Clear Fault in Zone 1 Coverage
of Both S and R
1
Protection R1 at S and RFails to Clear Faultin Zone 1 Coverage
2394
Protection Fails to ClearFault NOT in Zone 1
Coverage of Both S and R
1317
Comm. AssistedProtection R1 at S Fails
Comm. Assisted ProtectionR1 Fails to Clear Fault
1197 1197
Same as Comm. AssistedProtection R1 at S
Comm. AssistedProtection R1 at R Fails
Fault NOT inOverlapping
Zone 10.55
2394
Distance Protection R1
at S Fails1197
Protection R2 at S and RFails to Clear Fault in Zone 1 Coverage
1302
Protection Fails to ClearIn-Section Fault in the
Prescribed Time
2122
1077
Note: Numbers shown are unavailabilities • 106
Distance Protection R1 at S Fails
1197
Same as DistanceProtection R1 at S
Distance Protection R1 at R Fails
1197
DCWiringErrors
50
RelayApp. orSettings Errors1000
RelayFails137
HiddenFailures
10
Fault inZone 1 of
Both S and R0.45
Breaker at S Fails
200
Breaker at R Fails
200
DCSystem
Fails2 • 30= 60
CT Fails6 • 9= 54
CTWiringErrors2 • 50= 100
VTWiringErrors2 • 50= 100
VT Fails6 • 15= 90
4
2 3
1
2 3
1
Fig. 7. Dependability fault tree for the DCB scheme with a power line carrier channel.
11
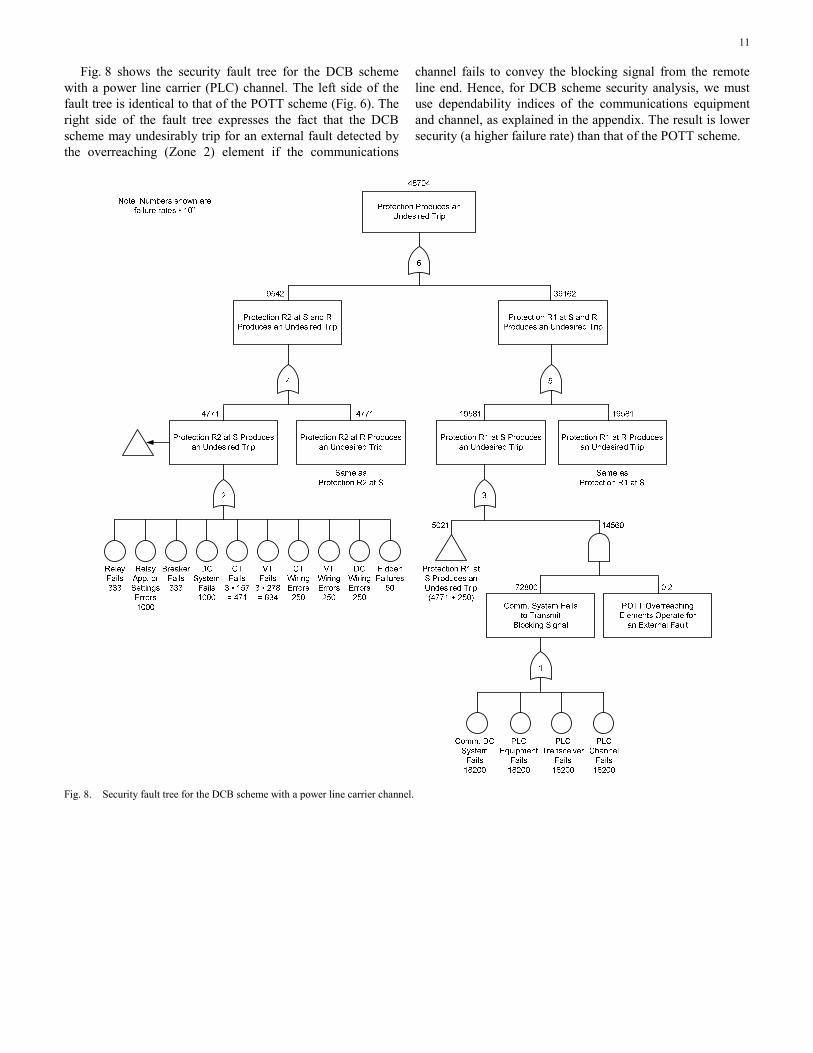
Fig. 8 shows the security fault tree for the DCB scheme with a power line carrier (PLC) channel. The left side of the fault tree is identical to that of the POTT scheme (Fig. 6). The right side of the fault tree expresses the fact that the DCB scheme may undesirably trip for an external fault detected by the overreaching (Zone 2) element if the communications
channel fails to convey the blocking signal from the remote line end. Hence, for DCB scheme security analysis, we must use dependability indices of the communications equipment and channel, as explained in the appendix. The result is lower security (a higher failure rate) than that of the POTT scheme.
Fig. 8. Security fault tree for the DCB scheme with a power line carrier channel.
12
B. Redundant Schemes
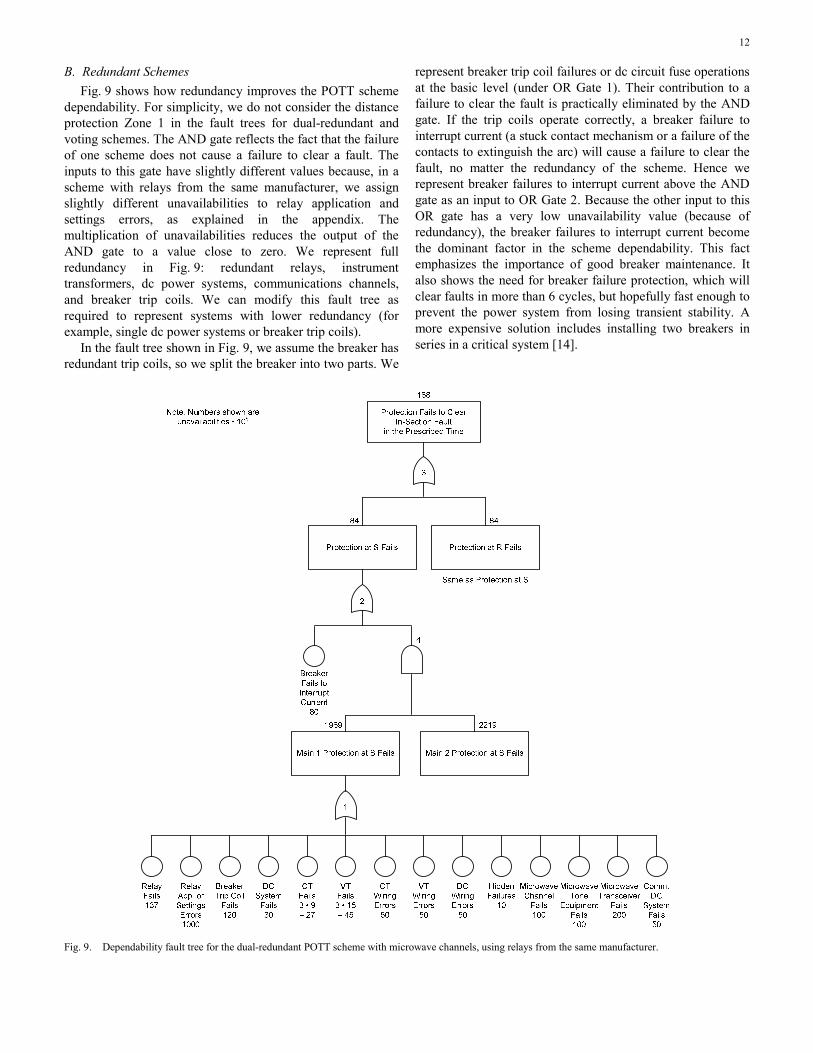
Fig. 9 shows how redundancy improves the POTT scheme dependability. For simplicity, we do not consider the distance protection Zone 1 in the fault trees for dual-redundant and voting schemes. The AND gate reflects the fact that the failure of one scheme does not cause a failure to clear a fault. The inputs to this gate have slightly different values because, in a scheme with relays from the same manufacturer, we assign slightly different unavailabilities to relay application and settings errors, as explained in the appendix. The multiplication of unavailabilities reduces the output of the AND gate to a value close to zero. We represent full redundancy in Fig. 9: redundant relays, instrument transformers, dc power systems, communications channels, and breaker trip coils. We can modify this fault tree as required to represent systems with lower redundancy (for example, single dc power systems or breaker trip coils).
In the fault tree shown in Fig. 9, we assume the breaker has redundant trip coils, so we split the breaker into two parts. We
represent breaker trip coil failures or dc circuit fuse operations at the basic level (under OR Gate 1). Their contribution to a failure to clear the fault is practically eliminated by the AND gate. If the trip coils operate correctly, a breaker failure to interrupt current (a stuck contact mechanism or a failure of the contacts to extinguish the arc) will cause a failure to clear the fault, no matter the redundancy of the scheme. Hence we represent breaker failures to interrupt current above the AND gate as an input to OR Gate 2. Because the other input to this OR gate has a very low unavailability value (because of redundancy), the breaker failures to interrupt current become the dominant factor in the scheme dependability. This fact emphasizes the importance of good breaker maintenance. It also shows the need for breaker failure protection, which will clear faults in more than 6 cycles, but hopefully fast enough to prevent the power system from losing transient stability. A more expensive solution includes installing two breakers in series in a critical system [14].
Fig. 9. Dependability fault tree for the dual-redundant POTT scheme with microwave channels, using relays from the same manufacturer.
13
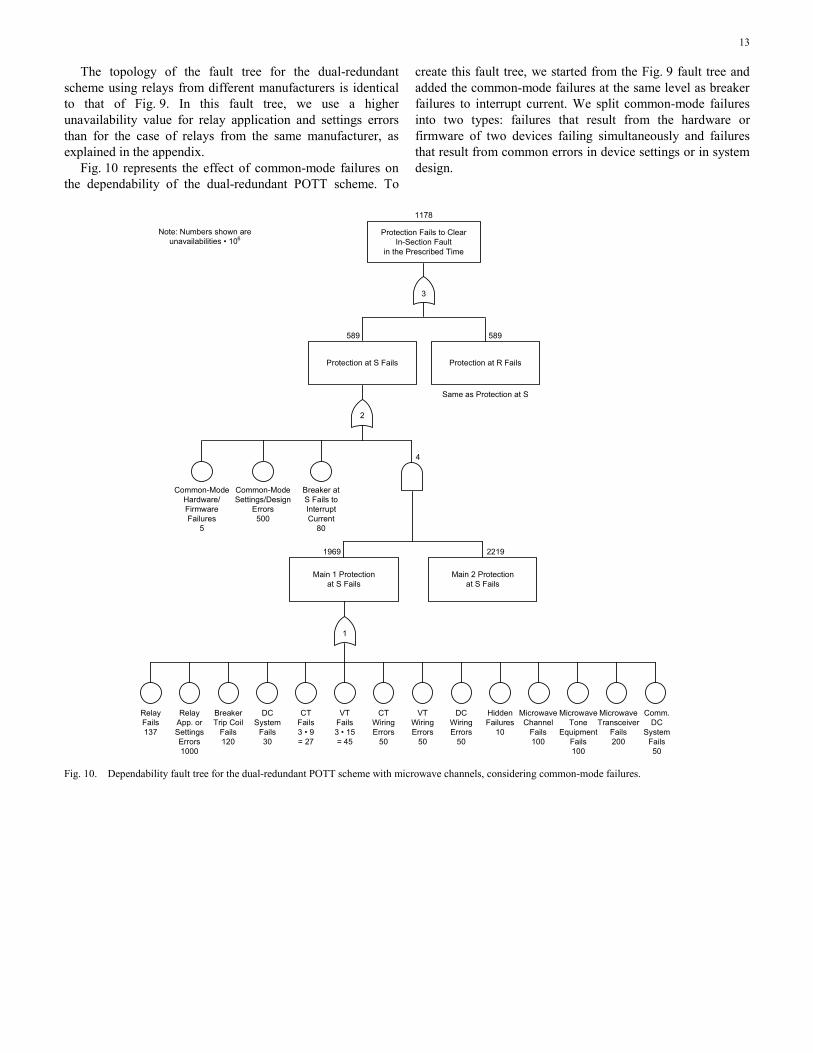
The topology of the fault tree for the dual-redundant scheme using relays from different manufacturers is identical to that of Fig. 9. In this fault tree, we use a higher unavailability value for relay application and settings errors than for the case of relays from the same manufacturer, as explained in the appendix.
Fig. 10 represents the effect of common-mode failures on the dependability of the dual-redundant POTT scheme. To
create this fault tree, we started from the Fig. 9 fault tree and added the common-mode failures at the same level as breaker failures to interrupt current. We split common-mode failures into two types: failures that result from the hardware or firmware of two devices failing simultaneously and failures that result from common errors in device settings or in system design.
Main 1 Protection at S Fails
1969 2219
Main 2 Protection at S Fails
Protection Fails to ClearIn-Section Fault
in the Prescribed Time
1178
Same as Protection at S
Note: Numbers shown are unavailabilities • 106
Protection at S Fails
589
Protection at R Fails
589
Breaker at S Fails to InterruptCurrent
80
Common-Mode Hardware/ Firmware Failures
5
Common-Mode Settings/Design
Errors500
DCSystem
Fails30
DCWiringErrors
50
CT Fails3 • 9= 27
CTWiringErrors
50
RelayApp. orSettings Errors1000
RelayFails137
VTWiringErrors
50
HiddenFailures
10
VT Fails3 • 15= 45
Comm. DC
SystemFails50
MicrowaveTone
EquipmentFails100
MicrowaveTransceiver
Fails200
MicrowaveChannel
Fails100
BreakerTrip Coil
Fails120
1
2
3
4
Fig. 10. Dependability fault tree for the dual-redundant POTT scheme with microwave channels, considering common-mode failures.
14
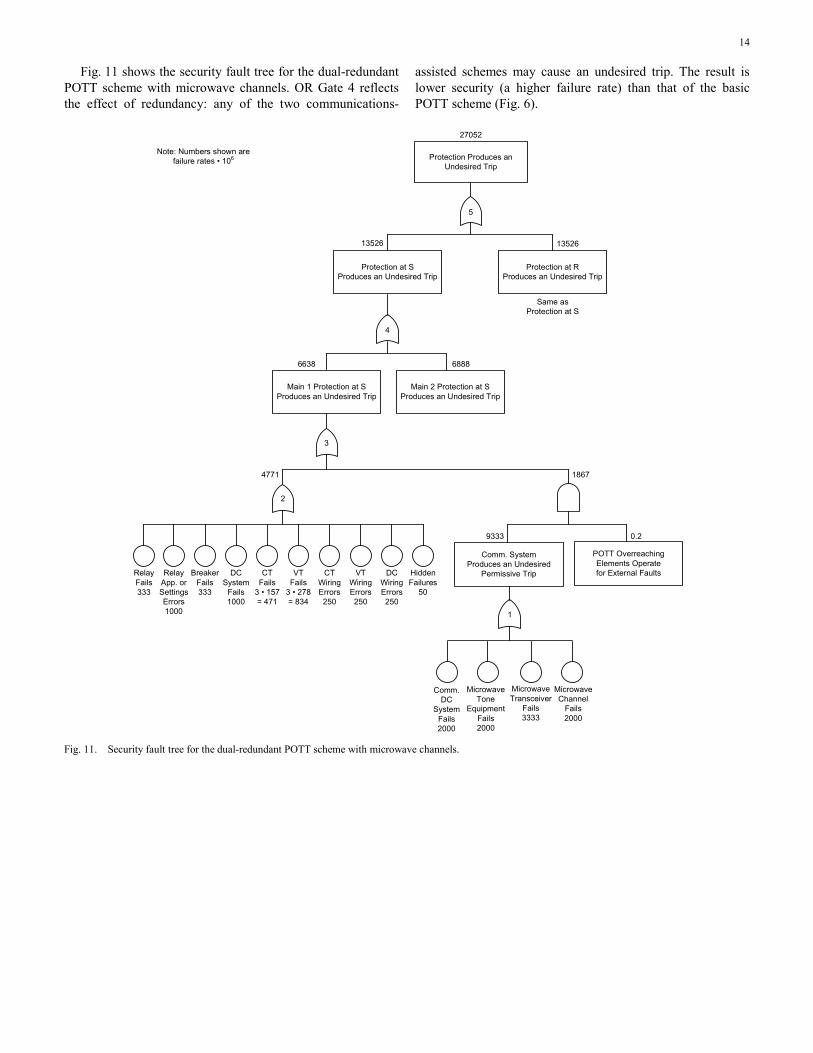
Fig. 11 shows the security fault tree for the dual-redundant POTT scheme with microwave channels. OR Gate 4 reflects the effect of redundancy: any of the two communications-
assisted schemes may cause an undesired trip. The result is lower security (a higher failure rate) than that of the basic POTT scheme (Fig. 6).
Main 1 Protection at S Produces an Undesired Trip
6638 6888
Main 2 Protection at S Produces an Undesired Trip
13526 13526
Protection Produces an Undesired Trip
27052
4771
Protection at SProduces an Undesired Trip
Protection at RProduces an Undesired Trip
Same asProtection at S
POTT Overreaching Elements Operatefor External Faults
0.2
Comm. System Produces an Undesired
Permissive Trip
Comm. DC
System Fails2000
Microwave Tone
EquipmentFails2000
MicrowaveTransceiver
Fails3333
MicrowaveChannel
Fails2000
9333
1867
DCSystem
Fails1000
Breaker Fails333
DCWiringErrors250
CT Fails
3 • 157= 471
CTWiringErrors250
RelayApp. orSettings Errors1000
RelayFails333
VTWiringErrors250
HiddenFailures
50
VT Fails
3 • 278= 834
Note: Numbers shown are failure rates • 106
5
4
3
2
1
Fig. 11. Security fault tree for the dual-redundant POTT scheme with microwave channels.
15
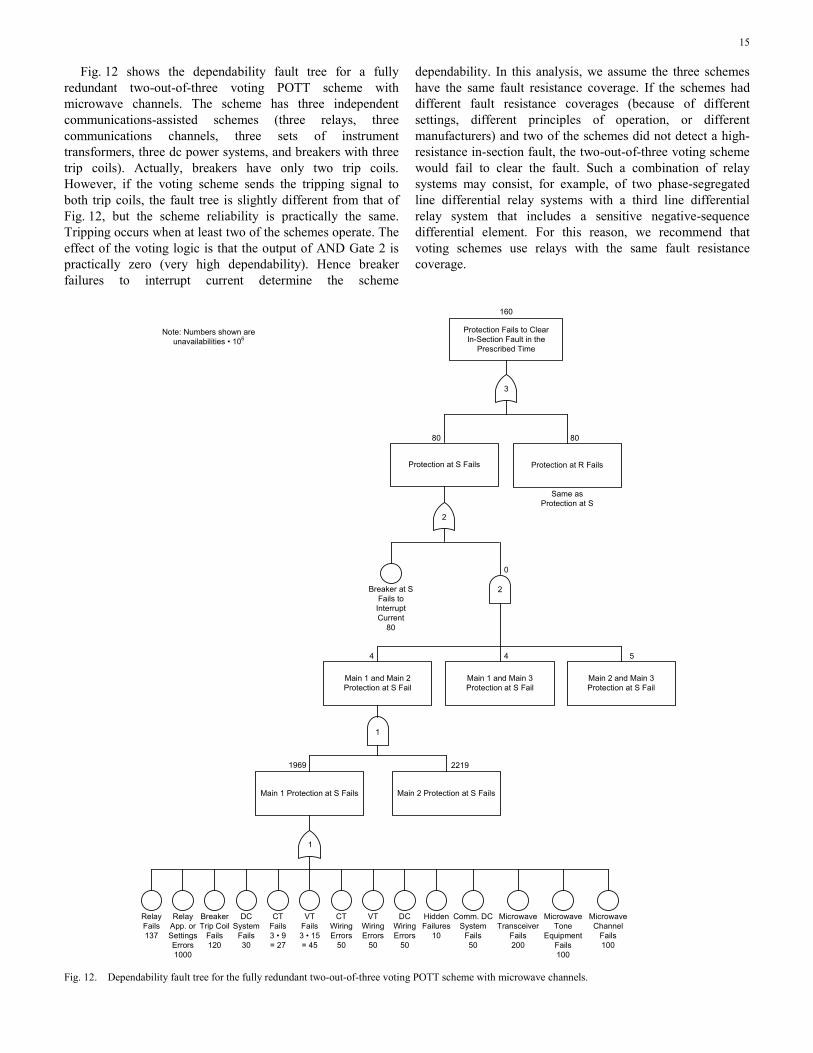
Fig. 12 shows the dependability fault tree for a fully redundant two-out-of-three voting POTT scheme with microwave channels. The scheme has three independent communications-assisted schemes (three relays, three communications channels, three sets of instrument transformers, three dc power systems, and breakers with three trip coils). Actually, breakers have only two trip coils. However, if the voting scheme sends the tripping signal to both trip coils, the fault tree is slightly different from that of Fig. 12, but the scheme reliability is practically the same. Tripping occurs when at least two of the schemes operate. The effect of the voting logic is that the output of AND Gate 2 is practically zero (very high dependability). Hence breaker failures to interrupt current determine the scheme
dependability. In this analysis, we assume the three schemes have the same fault resistance coverage. If the schemes had different fault resistance coverages (because of different settings, different principles of operation, or different manufacturers) and two of the schemes did not detect a high-resistance in-section fault, the two-out-of-three voting scheme would fail to clear the fault. Such a combination of relay systems may consist, for example, of two phase-segregated line differential relay systems with a third line differential relay system that includes a sensitive negative-sequence differential element. For this reason, we recommend that voting schemes use relays with the same fault resistance coverage.
Note: Numbers shown are unavailabilities • 106
5
Main 2 and Main 3Protection at S Fail
Main 2 Protection at S Fails
2219
4
Main 1 and Main 2Protection at S Fail
Main 1 Protection at S Fails
1969
4
Main 1 and Main 3Protection at S Fail
Protection Fails to ClearIn-Section Fault in the
Prescribed Time
160
Same asProtection at S
Breaker at SFails to Interrupt Current
80
Protection at S Fails
80
Protection at R Fails
80
Comm. DC System
Fails50
Microwave Tone
EquipmentFails100
MicrowaveTransceiver
Fails200
Microwave Channel
Fails100
DCSystem
Fails30
BreakerTrip Coil
Fails120
DCWiringErrors
50
CT Fails3 • 9= 27
CTWiringErrors
50
RelayApp. orSettings Errors1000
RelayFails137
VTWiringErrors
50
HiddenFailures
10
VT Fails3 • 15= 45
2
3
2
1
1
0
Fig. 12. Dependability fault tree for the fully redundant two-out-of-three voting POTT scheme with microwave channels.
16
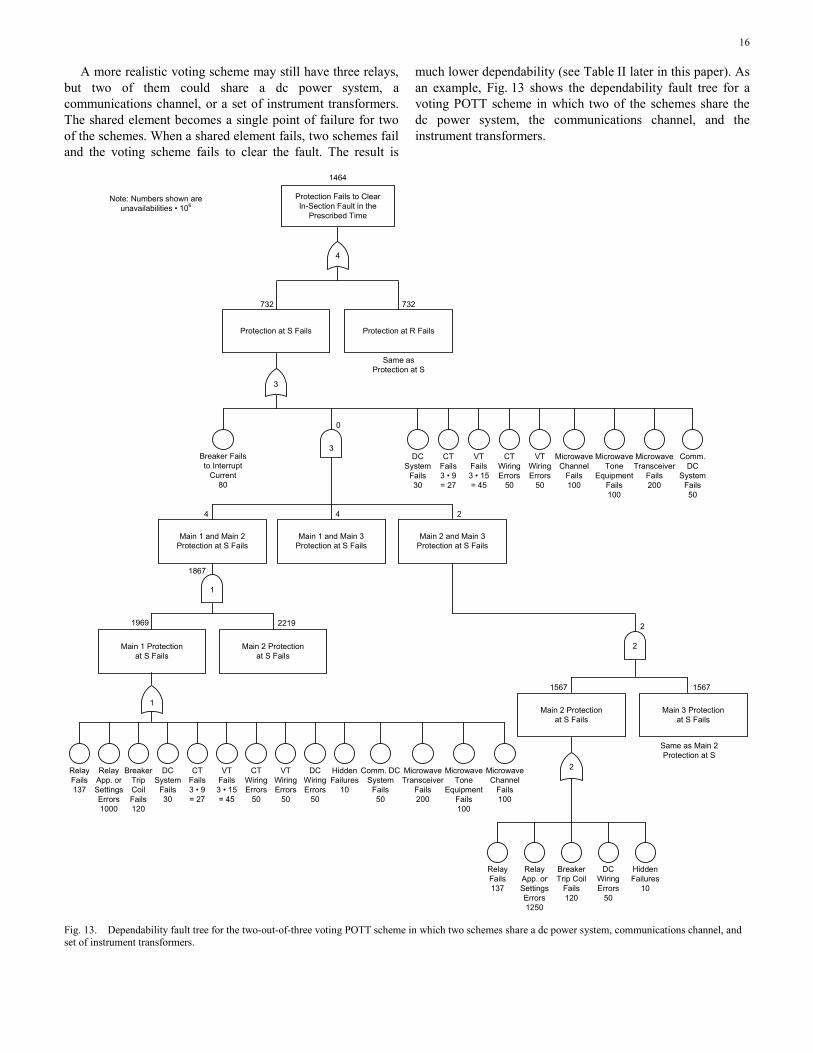
A more realistic voting scheme may still have three relays, but two of them could share a dc power system, a communications channel, or a set of instrument transformers. The shared element becomes a single point of failure for two of the schemes. When a shared element fails, two schemes fail and the voting scheme fails to clear the fault. The result is
much lower dependability (see Table II later in this paper). As an example, Fig. 13 shows the dependability fault tree for a voting POTT scheme in which two of the schemes share the dc power system, the communications channel, and the instrument transformers.
DCSystem
Fails30
2
Main 2 and Main 3Protection at S Fails
Main 2 Protectionat S Fails
2219
4
Main 1 and Main 2Protection at S Fails
Main 1 Protection at S Fails
1969
4
Main 1 and Main 3Protection at S Fails
Protection Fails to ClearIn-Section Fault in the
Prescribed Time
1464
Same asProtection at S
Note: Numbers shown are unavailabilities • 106
0
Breaker Fails to Interrupt
Current80
Protection at S Fails
732
Protection at R Fails
732
Main 2 Protection at S Fails
2
Main 3 Protection at S Fails
Same as Main 2Protection at S
15671567
Comm. DC System
Fails50
Microwave Tone
EquipmentFails100
MicrowaveTransceiver
Fails200
Microwave Channel
Fails100
DCSystem
Fails30
Breaker TripCoil Fails120
DCWiringErrors
50
CT Fails3 • 9= 27
CTWiringErrors
50
RelayApp. orSettings Errors1000
RelayFails137
VTWiringErrors
50
HiddenFailures
10
VT Fails3 • 15= 45
DCWiringErrors
50
HiddenFailures
10
RelayApp. orSettings Errors1250
RelayFails137
BreakerTrip Coil
Fails120
Microwave Channel
Fails100
Comm.DC
SystemFails50
Microwave Tone
EquipmentFails100
MicrowaveTransceiver
Fails200
CTFails3 • 9= 27
VT Fails3 • 15= 45
CTWiringErrors
50
VTWiringErrors
50
1
1
3
3
4
2
2
1867
Fig. 13. Dependability fault tree for the two-out-of-three voting POTT scheme in which two schemes share a dc power system, communications channel, and set of instrument transformers.
17
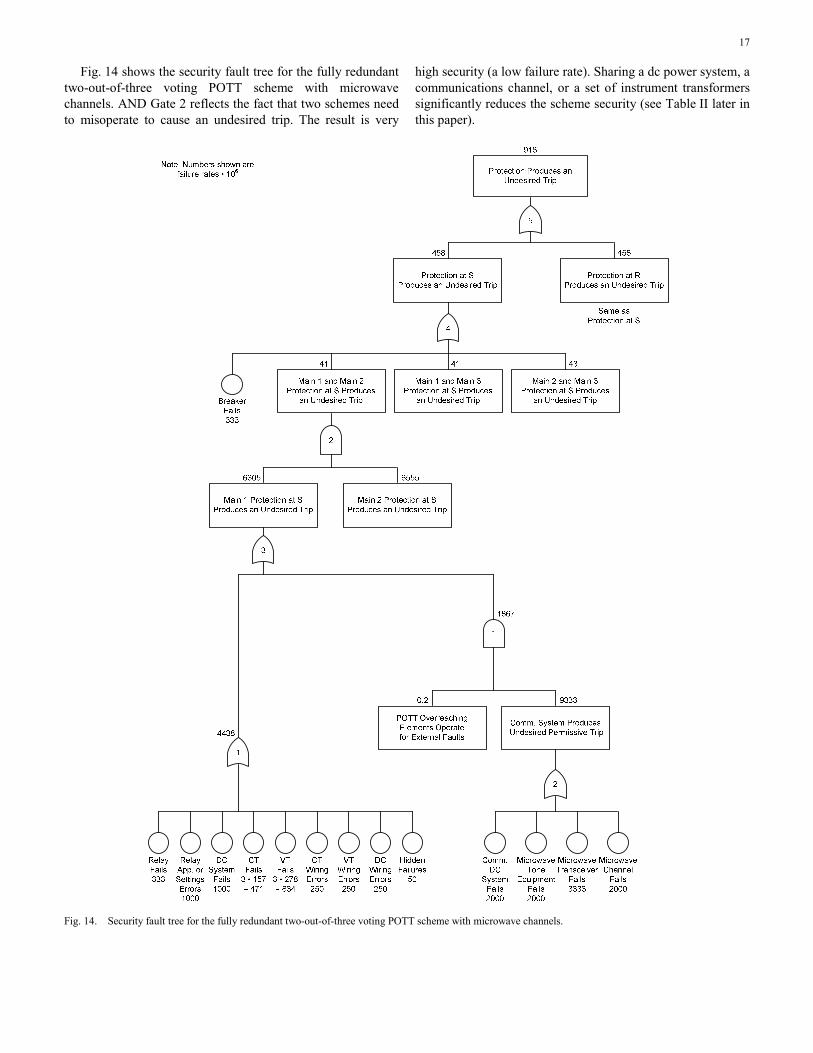
Fig. 14 shows the security fault tree for the fully redundant two-out-of-three voting POTT scheme with microwave channels. AND Gate 2 reflects the fact that two schemes need to misoperate to cause an undesired trip. The result is very
high security (a low failure rate). Sharing a dc power system, a communications channel, or a set of instrument transformers significantly reduces the scheme security (see Table II later in this paper).
Fig. 14. Security fault tree for the fully redundant two-out-of-three voting POTT scheme with microwave channels.
18
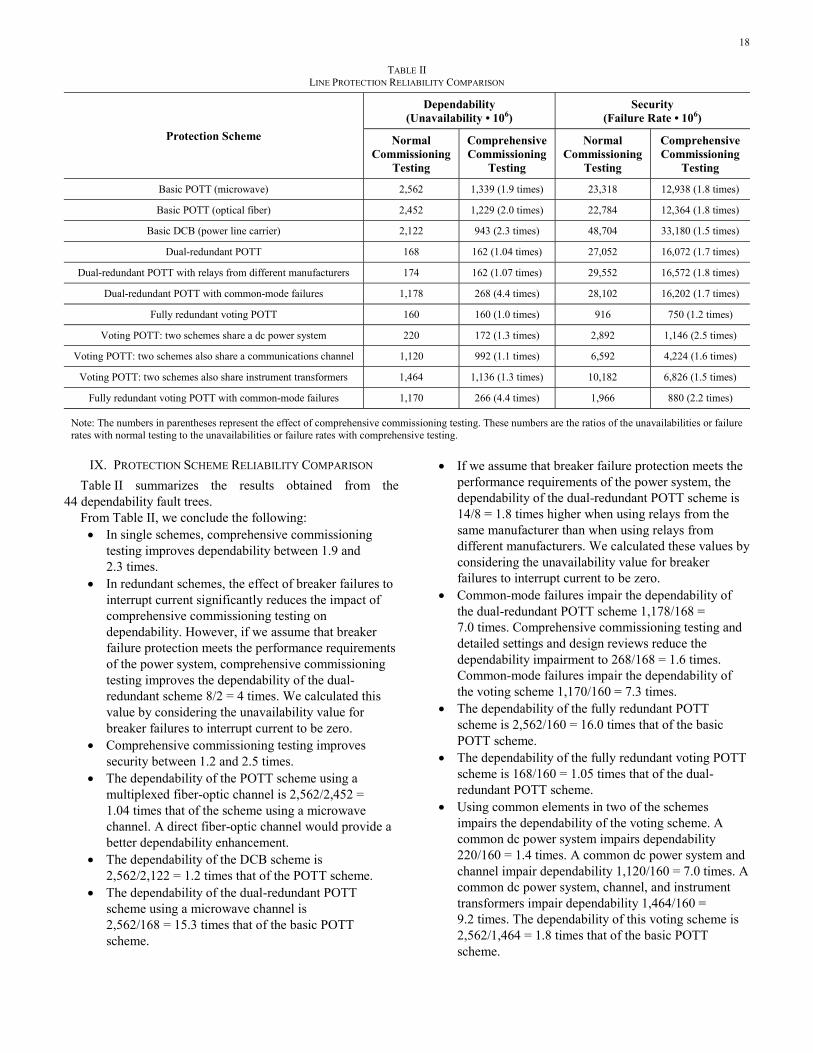
TABLE II LINE PROTECTION RELIABILITY COMPARISON
Protection Scheme
Dependability (Unavailability • 106)
Security (Failure Rate • 106)
Normal Commissioning
Testing
Comprehensive Commissioning
Testing
Normal Commissioning
Testing
Comprehensive Commissioning
Testing
Basic POTT (microwave) 2,562 1,339 (1.9 times) 23,318 12,938 (1.8 times)
Basic POTT (optical fiber) 2,452 1,229 (2.0 times) 22,784 12,364 (1.8 times)
Basic DCB (power line carrier) 2,122 943 (2.3 times) 48,704 33,180 (1.5 times)
Dual-redundant POTT 168 162 (1.04 times) 27,052 16,072 (1.7 times)
Dual-redundant POTT with relays from different manufacturers 174 162 (1.07 times) 29,552 16,572 (1.8 times)
Dual-redundant POTT with common-mode failures 1,178 268 (4.4 times) 28,102 16,202 (1.7 times)
Fully redundant voting POTT 160 160 (1.0 times) 916 750 (1.2 times)
Voting POTT: two schemes share a dc power system 220 172 (1.3 times) 2,892 1,146 (2.5 times)
Voting POTT: two schemes also share a communications channel 1,120 992 (1.1 times) 6,592 4,224 (1.6 times)
Voting POTT: two schemes also share instrument transformers 1,464 1,136 (1.3 times) 10,182 6,826 (1.5 times)
Fully redundant voting POTT with common-mode failures 1,170 266 (4.4 times) 1,966 880 (2.2 times)
Note: The numbers in parentheses represent the effect of comprehensive commissioning testing. These numbers are the ratios of the unavailabilities or failure rates with normal testing to the unavailabilities or failure rates with comprehensive testing.
IX. PROTECTION SCHEME RELIABILITY COMPARISON
Table II summarizes the results obtained from the 44 dependability fault trees.
From Table II, we conclude the following: • In single schemes, comprehensive commissioning
testing improves dependability between 1.9 and 2.3 times.
• In redundant schemes, the effect of breaker failures to interrupt current significantly reduces the impact of comprehensive commissioning testing on dependability. However, if we assume that breaker failure protection meets the performance requirements of the power system, comprehensive commissioning testing improves the dependability of the dual-redundant scheme 8/2 = 4 times. We calculated this value by considering the unavailability value for breaker failures to interrupt current to be zero.
• Comprehensive commissioning testing improves security between 1.2 and 2.5 times.
• The dependability of the POTT scheme using a multiplexed fiber-optic channel is 2,562/2,452 = 1.04 times that of the scheme using a microwave channel. A direct fiber-optic channel would provide a better dependability enhancement.
• The dependability of the DCB scheme is 2,562/2,122 = 1.2 times that of the POTT scheme.
• The dependability of the dual-redundant POTT scheme using a microwave channel is 2,562/168 = 15.3 times that of the basic POTT scheme.
• If we assume that breaker failure protection meets the performance requirements of the power system, the dependability of the dual-redundant POTT scheme is 14/8 = 1.8 times higher when using relays from the same manufacturer than when using relays from different manufacturers. We calculated these values by considering the unavailability value for breaker failures to interrupt current to be zero.
• Common-mode failures impair the dependability of the dual-redundant POTT scheme 1,178/168 = 7.0 times. Comprehensive commissioning testing and detailed settings and design reviews reduce the dependability impairment to 268/168 = 1.6 times. Common-mode failures impair the dependability of the voting scheme 1,170/160 = 7.3 times.
• The dependability of the fully redundant POTT scheme is 2,562/160 = 16.0 times that of the basic POTT scheme.
• The dependability of the fully redundant voting POTT scheme is 168/160 = 1.05 times that of the dual-redundant POTT scheme.
• Using common elements in two of the schemes impairs the dependability of the voting scheme. A common dc power system impairs dependability 220/160 = 1.4 times. A common dc power system and channel impair dependability 1,120/160 = 7.0 times. A common dc power system, channel, and instrument transformers impair dependability 1,464/160 = 9.2 times. The dependability of this voting scheme is 2,562/1,464 = 1.8 times that of the basic POTT scheme.
19
• The security of the basic POTT scheme is 48,704/23,318 = 2.1 times that of the DCB scheme.
• The security of the basic POTT scheme is 27,052/23,318 = 1.16 times that of the dual-redundant POTT scheme.
• The security of the dual-redundant POTT scheme is 29,552/27,052 = 1.09 times higher when using relays from the same manufacturer than when using relays from different manufacturers.
• Common-mode failures do not significantly impair the security of the dual-redundant POTT scheme.
• The security of the fully redundant voting POTT scheme is 23,318/916 = 25.5 times that of the basic POTT scheme.
• The security of the fully redundant voting POTT scheme is 27,052/916 = 29.5 times that of the dual-redundant scheme.
• Using common elements in two of the schemes impairs the security of the voting scheme. A common dc power system impairs security 2,892/916 = 3.2 times. A common dc power system and channel impair security 6,592/916 = 7.2 times. A common dc power system, channel, and instrument transformers impair security 10,182/916 = 11.1 times. The security of this voting scheme is 23,318/10,182 = 2.3 times that of the basic POTT scheme.
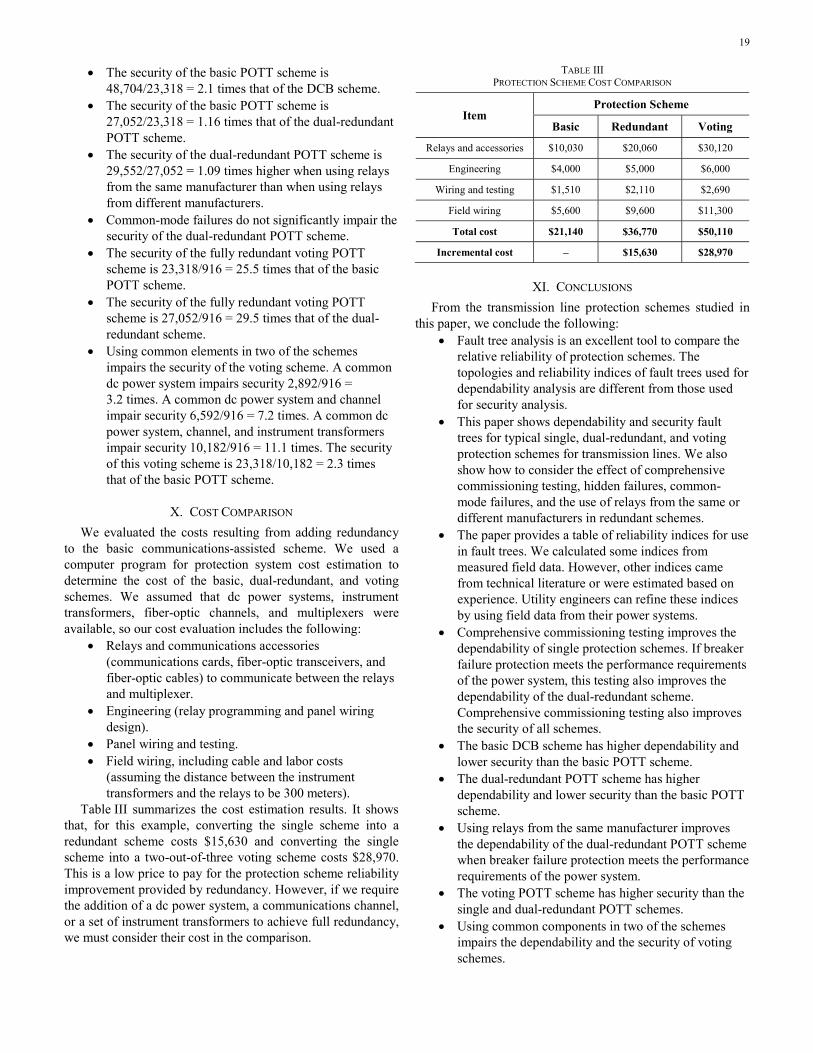
X. COST COMPARISON
We evaluated the costs resulting from adding redundancy to the basic communications-assisted scheme. We used a computer program for protection system cost estimation to determine the cost of the basic, dual-redundant, and voting schemes. We assumed that dc power systems, instrument transformers, fiber-optic channels, and multiplexers were available, so our cost evaluation includes the following:
• Relays and communications accessories (communications cards, fiber-optic transceivers, and fiber-optic cables) to communicate between the relays and multiplexer.
• Engineering (relay programming and panel wiring design).
• Panel wiring and testing. • Field wiring, including cable and labor costs
(assuming the distance between the instrument transformers and the relays to be 300 meters).
Table III summarizes the cost estimation results. It shows that, for this example, converting the single scheme into a redundant scheme costs $15,630 and converting the single scheme into a two-out-of-three voting scheme costs $28,970. This is a low price to pay for the protection scheme reliability improvement provided by redundancy. However, if we require the addition of a dc power system, a communications channel, or a set of instrument transformers to achieve full redundancy, we must consider their cost in the comparison.
TABLE III PROTECTION SCHEME COST COMPARISON
Item Protection Scheme
Basic Redundant Voting
Relays and accessories $10,030 $20,060 $30,120
Engineering $4,000 $5,000 $6,000
Wiring and testing $1,510 $2,110 $2,690
Field wiring $5,600 $9,600 $11,300
Total cost $21,140 $36,770 $50,110
Incremental cost – $15,630 $28,970
XI. CONCLUSIONS
From the transmission line protection schemes studied in this paper, we conclude the following:
• Fault tree analysis is an excellent tool to compare the relative reliability of protection schemes. The topologies and reliability indices of fault trees used for dependability analysis are different from those used for security analysis.
• This paper shows dependability and security fault trees for typical single, dual-redundant, and voting protection schemes for transmission lines. We also show how to consider the effect of comprehensive commissioning testing, hidden failures, common-mode failures, and the use of relays from the same or different manufacturers in redundant schemes.
• The paper provides a table of reliability indices for use in fault trees. We calculated some indices from measured field data. However, other indices came from technical literature or were estimated based on experience. Utility engineers can refine these indices by using field data from their power systems.
• Comprehensive commissioning testing improves the dependability of single protection schemes. If breaker failure protection meets the performance requirements of the power system, this testing also improves the dependability of the dual-redundant scheme. Comprehensive commissioning testing also improves the security of all schemes.
• The basic DCB scheme has higher dependability and lower security than the basic POTT scheme.
• The dual-redundant POTT scheme has higher dependability and lower security than the basic POTT scheme.
• Using relays from the same manufacturer improves the dependability of the dual-redundant POTT scheme when breaker failure protection meets the performance requirements of the power system.
• The voting POTT scheme has higher security than the single and dual-redundant POTT schemes.
• Using common components in two of the schemes impairs the dependability and the security of voting schemes.

20
• Breaker failures to interrupt current have a significant impact on the dependability of redundant schemes. A breaker failure to interrupt current causes a failure to clear the fault, no matter the redundancy of the rest of the scheme. To improve redundant scheme dependability, we suggest providing good breaker maintenance and monitoring and applying breaker failure protection.
• Hidden failures do not significantly affect the reliability of redundant protection schemes.
• Common-mode failures affect the reliability of redundant protection schemes. Comprehensive commissioning testing and detailed settings and design reviews significantly reduce the dependability impairment.
• The costs of converting the basic line protection scheme into a dual-redundant scheme or a voting scheme are relatively low unless the conversion requires adding a dc power system, a communications channel, or instrument transformers.
XII. APPENDIX
This appendix shows the reliability indices that we used in the dependability and security fault trees in this paper. We also explain how we calculated or estimated these indices. We have confidence in the relay failure rates because we have measured them for many years. We estimated other indices based on our experience and the information available in technical literature.
A. Reliability Indices Used in Fault Trees
Table IV shows the unavailability values that we used for dependability fault trees and the failure rate values that we used for security fault trees. We also show the MTBF values that we used to calculate the failure rates.
B. Comments on the Reliability Indices for Dependability Fault Trees (Unavailabilities)
1) Relay Fails Our calculation using observed field failure data gives
MTBF = 100 years (λ = 10,000 • 10–6) for dependability analysis. This MTBF value includes hardware and firmware failures and the effect of taking the relay out of service for corrective actions derived from service bulletins. Reference [6] gives an interval from 30 minutes to 2 weeks for MTTR. Assuming an average value of MTTR = 5 days, we have:
U = λ • MTTR = (0.01 failures/year) (120 hours) (1/8,760 hours/year) = 137 • 10–6
TABLE IV RELIABILITY INDICES USED IN FAULT TREES
Event
Dependability Security
Unavailability • 106 MTBF (Years)
Failure Rate • 106
Relay fails 137 3,000 333
Relay application or settings errors
1,000 1,000 1,000
Breaker fails 200 3,000 333
Breaker fails to interrupt current
80 – –
DC power system fails
30 1,000 1,000
CT fails 9 6,370 157
VT fails 15 3,600 278
Microwave tone equipment fails
100 500 2,000
Microwave transceiver fails
200 300 3,333
Microwave channel fails
100 500 2,000
Fiber-optic equipment fails
100 500 2,000
Fiber-optic channel fails
100 500 2,000
Power line carrier transceiver fails
– 55 18,250
Power line carrier equipment fails
– 55 18,250
Power line carrier channel fails
– 55 18,250
Communications dc power system fails
50 500 2,000 (or 18,250)
DC system wiring errors
50 4,000 250
CT or VT wiring errors
50 4,000 250
Hidden failures 10 20,000 50
Common-mode failures (hardware
or firmware) 5 40,000 25
Common-mode failures (settings or
design errors) 500 2,000 500
21
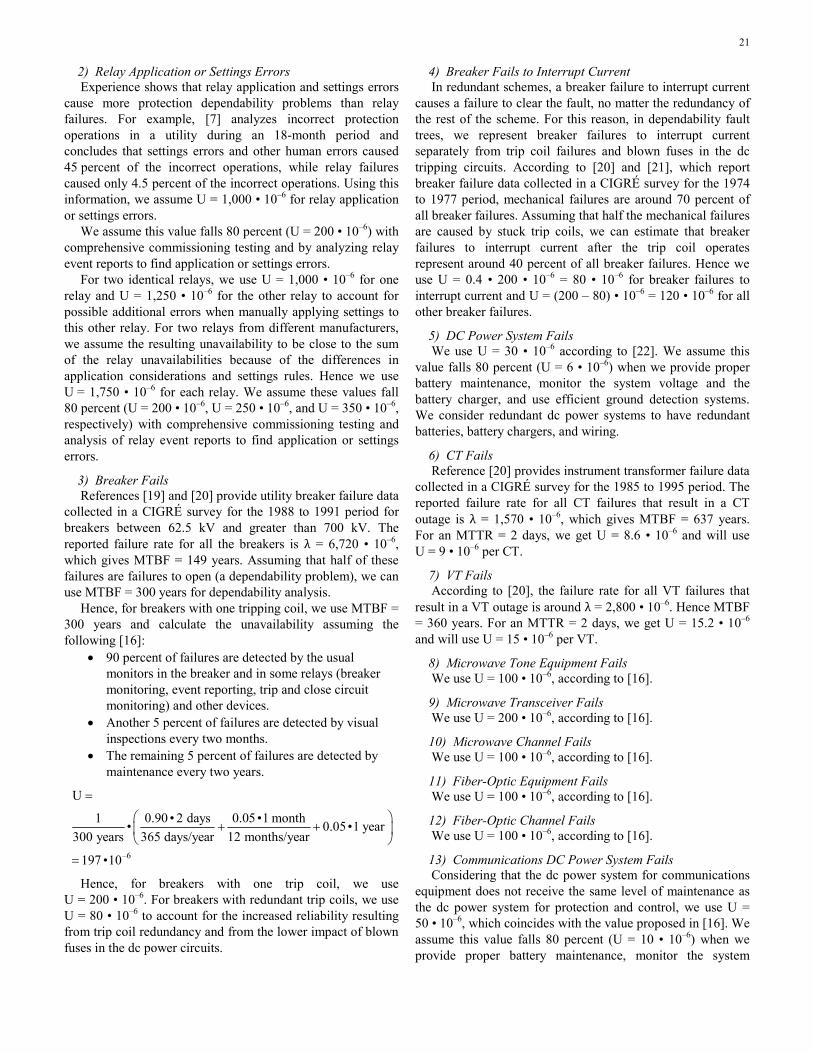
2) Relay Application or Settings Errors Experience shows that relay application and settings errors
cause more protection dependability problems than relay failures. For example, [7] analyzes incorrect protection operations in a utility during an 18-month period and concludes that settings errors and other human errors caused 45 percent of the incorrect operations, while relay failures caused only 4.5 percent of the incorrect operations. Using this information, we assume U = 1,000 • 10–6 for relay application or settings errors.
We assume this value falls 80 percent (U = 200 • 10–6) with comprehensive commissioning testing and by analyzing relay event reports to find application or settings errors.
For two identical relays, we use U = 1,000 • 10–6 for one relay and U = 1,250 • 10–6 for the other relay to account for possible additional errors when manually applying settings to this other relay. For two relays from different manufacturers, we assume the resulting unavailability to be close to the sum of the relay unavailabilities because of the differences in application considerations and settings rules. Hence we use U = 1,750 • 10–6 for each relay. We assume these values fall 80 percent (U = 200 • 10–6, U = 250 • 10–6, and U = 350 • 10–6, respectively) with comprehensive commissioning testing and analysis of relay event reports to find application or settings errors.
3) Breaker Fails References [19] and [20] provide utility breaker failure data
collected in a CIGRÉ survey for the 1988 to 1991 period for breakers between 62.5 kV and greater than 700 kV. The reported failure rate for all the breakers is λ = 6,720 • 10–6, which gives MTBF = 149 years. Assuming that half of these failures are failures to open (a dependability problem), we can use MTBF = 300 years for dependability analysis.
Hence, for breakers with one tripping coil, we use MTBF = 300 years and calculate the unavailability assuming the following [16]:
• 90 percent of failures are detected by the usual monitors in the breaker and in some relays (breaker monitoring, event reporting, trip and close circuit monitoring) and other devices.
• Another 5 percent of failures are detected by visual inspections every two months.
• The remaining 5 percent of failures are detected by maintenance every two years.
–6
U
1 0.90 • 2 days 0.05 •1 month• 0.05•1 year
300 years 365 days/year 12 months/year
197 •10
=
⎛ ⎞+ +⎜ ⎟
⎝ ⎠=
Hence, for breakers with one trip coil, we use U = 200 • 10–6. For breakers with redundant trip coils, we use U = 80 • 10–6 to account for the increased reliability resulting from trip coil redundancy and from the lower impact of blown fuses in the dc power circuits.
4) Breaker Fails to Interrupt Current In redundant schemes, a breaker failure to interrupt current
causes a failure to clear the fault, no matter the redundancy of the rest of the scheme. For this reason, in dependability fault trees, we represent breaker failures to interrupt current separately from trip coil failures and blown fuses in the dc tripping circuits. According to [20] and [21], which report breaker failure data collected in a CIGRÉ survey for the 1974 to 1977 period, mechanical failures are around 70 percent of all breaker failures. Assuming that half the mechanical failures are caused by stuck trip coils, we can estimate that breaker failures to interrupt current after the trip coil operates represent around 40 percent of all breaker failures. Hence we use U = 0.4 • 200 • 10–6 = 80 • 10–6 for breaker failures to interrupt current and U = (200 – 80) • 10–6 = 120 • 10–6 for all other breaker failures.
5) DC Power System Fails We use U = 30 • 10–6 according to [22]. We assume this
value falls 80 percent (U = 6 • 10–6) when we provide proper battery maintenance, monitor the system voltage and the battery charger, and use efficient ground detection systems. We consider redundant dc power systems to have redundant batteries, battery chargers, and wiring.
6) CT Fails Reference [20] provides instrument transformer failure data
collected in a CIGRÉ survey for the 1985 to 1995 period. The reported failure rate for all CT failures that result in a CT outage is λ = 1,570 • 10–6, which gives MTBF = 637 years. For an MTTR = 2 days, we get U = 8.6 • 10–6 and will use U = 9 • 10–6 per CT.
7) VT Fails According to [20], the failure rate for all VT failures that
result in a VT outage is around λ = 2,800 • 10–6. Hence MTBF = 360 years. For an MTTR = 2 days, we get U = 15.2 • 10–6 and will use U = 15 • 10–6 per VT.
8) Microwave Tone Equipment Fails We use U = 100 • 10–6, according to [16].
9) Microwave Transceiver Fails We use U = 200 • 10–6, according to [16].
10) Microwave Channel Fails We use U = 100 • 10–6, according to [16].
11) Fiber-Optic Equipment Fails We use U = 100 • 10–6, according to [16].
12) Fiber-Optic Channel Fails We use U = 100 • 10–6, according to [16].
13) Communications DC Power System Fails Considering that the dc power system for communications
equipment does not receive the same level of maintenance as the dc power system for protection and control, we use U = 50 • 10–6, which coincides with the value proposed in [16]. We assume this value falls 80 percent (U = 10 • 10–6) when we provide proper battery maintenance, monitor the system
22
voltage and the battery charger, and use efficient ground detection systems.
14) DC System Wiring Errors Experience shows that dc system wiring errors cause more
protection reliability problems than dc power system failures. We assume the unavailability caused by dc system wiring errors to be U = 50 • 10–6. We assume this value falls 80 percent (U = 10 • 10–6) with comprehensive commissioning testing and by analyzing relay event reports to find dc system wiring errors.
15) CT or VT Wiring Errors We assume the unavailability caused by CT or VT wiring
errors to be equal to that caused by dc system wiring errors. Hence we use U = 50 • 10–6 per CT or VT three-phase circuit. We assume this value falls to zero (U = 0) with comprehensive commissioning testing (using the advanced commissioning features available in modern relays) and by analyzing relay event reports to find CT or VT wiring errors.
16) Hidden Failures Hidden failures are very infrequent events. We assume the
unavailability caused by hidden failures is less than 10 percent of that caused by a relay failure. This is based on experience and the assumption that hidden failure unavailability must be less than known and measured data. Hence we use U = 10 • 10–6 for hidden failures. We assume this value falls to U = 5 • 10–6 with comprehensive commissioning testing and by analyzing relay event reports.
17) Common-Mode Failures Common-mode failures may result from the hardware or
firmware of two devices failing simultaneously or from common errors in device settings or in system design.
We assume the common-mode failures caused by hardware or firmware problems to be even less frequent than hidden failures. For example, the probability of a relay component failing at the same time in two redundant relays is very low, even if this component has an abnormally high failure rate. Hence we use U = 5 • 10–6 for these common-mode failures. We assume this value falls to U = 3 • 10–6 with comprehensive commissioning testing and by analyzing relay event reports.
We assume the common-mode failures caused by settings or design errors to be around half the failures caused by relay application and settings errors. Hence we use U = 500 • 10–6 for these common-mode failures. We assume this value falls 90 percent (U = 50 • 10–6) by carefully reviewing settings and designs and analyzing relay event reports.
C. Comments on the Reliability Indices for Security Fault Trees (Failure Rates)
1) Relay Fails Relays are typically designed to fail in a safe mode: not to
trip. Our calculation using observed field failure data gives MTBF = 3,000 years (λ = 333 • 10–6) for security analysis.
2) Relay Application or Settings Errors Experience shows that relay application and settings errors
cause more protection security problems than relay failures.
Hence we assume MTBF = 1,000 • 10–6 (λ = 1,000 • 10–6) for relay application or settings errors. We assume this value falls to λ = 200 • 10–6 with comprehensive commissioning testing and by analyzing relay event reports to find application or settings errors.
3) Breaker Fails Assuming that the breaker failures that cause undesired
closures are around ten times less likely than the breaker failures that cause failures to open, we define MTBF = 10 • 300 = 3,000 years (λ = 333 • 10–6) for breakers with one trip coil. For breakers with redundant trip coils, we define MTBF = 3,000/0.4 = 7,500 years (λ = 133 • 10–6).
4) DC Power System Fails The U = 30 • 10–6 value that we adopted for dependability
analysis represents MTBF = 100 years for an MTTR of one day, which is typical for battery systems. Assuming that the dc power system failures that cause undesired trips are around ten times less likely than the dc power system failures that cause failures to clear faults (a conservative assumption), we define MTBF = 1,000 years (λ = 1,000 • 10–6) for security analysis. We assume this value falls 80 percent (λ = 200 • 10–6) when we provide proper battery maintenance, monitor the system voltage and the battery charger, and use efficient ground detection systems.
5) CT Fails Assuming that the CT failures that cause undesired trips are
around ten times less likely than the CT failures to clear faults, we define MTBF = 6,370 years (λ = 157 • 10–6) for security analysis.
6) VT Fails Assuming that the VT failures that cause undesired trips
are around ten times less likely than the VT failures that cause failures to clear faults, we define MTBF = 3,600 years (λ = 278 • 10–6) for security analysis.
7) Microwave Tone Equipment Fails The U = 100 • 10–6 value that we adopted for dependability
analysis represents MTBF = 55 years for an MTTR of two days. Assuming that the tone equipment failures that cause undesired trips are around ten times less likely than the tone equipment failures that cause failures to clear faults, we define MTBF = 500 years (λ = 2,000 • 10–6) for security analysis.
8) Microwave Transceiver Fails The U = 200 • 10–6 value that we adopted for dependability
analysis represents MTBF = 27 years for an MTTR of two days. Assuming that the microwave transceiver failures that cause undesired trips are around ten times less likely than the microwave transceiver failures that cause failures to clear faults, we define MTBF = 300 years (λ = 3,330 • 10–6) for security analysis.
9) Microwave Channel Fails The U = 100 • 10–6 value that we adopted for dependability
analysis represents MTBF = 55 years for an MTTR of two days. Assuming that the microwave channel failures that

23
cause undesired trips are around ten times less likely than the microwave channel failures that cause failures to clear faults, we define MTBF = 500 years (λ = 2,000 • 10–6) for security analysis.
10) Fiber-Optic Equipment Fails The U = 100 • 10–6 value that we adopted for dependability
analysis represents MTBF = 55 years for an MTTR of two days. Assuming that the fiber-optic equipment failures that cause undesired trips are around ten times less likely than the fiber-optic equipment failures that cause failures to clear faults, we define MTBF = 500 years (λ = 2,000 • 10–6) for security analysis.
11) Fiber-Optic Channel Fails The U = 100 • 10–6 value that we adopted for dependability
analysis represents MTBF = 55 years for an MTTR of two days. Assuming that the fiber-optic channel failures that cause undesired trips are around ten times less likely than the fiber-optic channel failures that cause failures to clear faults, we define MTBF = 500 years (λ = 2,000 • 10–6) for security analysis.
12) Power Line Carrier Transceiver Fails A DCB scheme may trip undesirably for an external fault if
an overreaching element operates and the channel fails to convey the blocking signal from the remote line end. Hence, for DCB scheme security analysis, we must use the dependability indices of the communications equipment and channel. We assume the power line carrier transceiver has the same complexity as the microwave tone equipment. Hence, for security analysis, we use U = 100 • 10–6 [16], which represents MTBF = 55 years (λ = 18,200 • 10–6) for an MTTR of two days.
13) Power Line Carrier Equipment Fails This equipment includes the coaxial cable, line tuner,
coupling capacitor, drain coil, and line trap. We assume for this equipment U = 100 • 10–6, which represents MTBF = 55 years (λ = 18,200 • 10–6) for an MTTR of two days.
14) Power Line Carrier Channel Fails We assume for this channel that U = 100 • 10–6, which
represents MTBF = 55 years (λ = 18,200 • 10–6) for an MTTR of two days.
15) Communications DC Power System Fails The U = 50 • 10–6 value that we adopted for dependability
analysis represents MTBF = 55 years for an MTTR of one day, which is typical for battery systems. For POTT schemes, assuming that the dc power system failures that cause undesired trips are around ten times less likely than the dc power system failures that cause failures to clear faults, we define MTBF = 500 years (λ = 2,000 • 10–6) for security analysis. For DCB schemes, we use the dependability figure for the dc power system (MTBF = 55 years, which gives λ = 18,200 • 10–6) for security analysis.
16) DC System Wiring Errors Experience shows that relay application and settings errors
cause more protection security problems than dc system
wiring errors. Hence we assume MTBF = 4,000 years (λ = 250 • 10–6) for dc system wiring errors. We assume this value falls 80 percent (λ = 50 • 10–6) with comprehensive commissioning testing and by analyzing relay event reports to find dc system wiring errors.
17) CT or VT Wiring Errors Experience shows that relay application and settings errors
cause more protection security problems than CT or VT wiring errors, which are comparable with dc system wiring errors. Hence we assume MTBF = 4,000 years (λ = 250 • 10–6) for CT or VT wiring errors. We assume this value falls to zero (λ = 0) with comprehensive commissioning testing (using the advanced commissioning features available in modern relays) and by analyzing relay event reports to find CT or VT wiring errors.
18) Hidden Failures Assuming it takes around six months to detect a hidden
failure (MTTR = 0.5 years), the U = 10 • 10–6 value that we adopted for dependability analysis represents MTBF = 50,000 years. Assuming that hidden failures have the same likelihood of causing failures to clear faults as causing undesired trips, we assume a conservative value of MTBF = 20,000 years (λ = 50 • 10–6) for security analysis. We assume this value falls to λ = 25 • 10–6 with comprehensive commissioning testing and by analyzing relay event reports.
19) Common-Mode Failures Assuming it takes around six months to detect a common-
mode failure (MTTR = 0.5 years), the U = 5 • 10–6 and U = 500 • 10–6 values that we adopted for dependability analysis represent MTBF = 100,000 years and MTBF = 1,000 years, respectively. We assume that common-mode failures have the same likelihood of causing failures to clear faults as causing undesired trips. Hence, for security analysis, we assume a conservative value of MTBF = 40,000 years (λ = 25 • 10–6) for failures caused by hardware or firmware problems and MTBF = 2,000 years (λ = 500 • 10–6) for failures caused by settings or design errors. We assume these values fall to λ = 15 • 10–6 and λ = 50 • 10–6, respectively, with comprehensive commissioning testing and by analyzing relay event reports.
XIII. REFERENCES
[1] P. M. Anderson, Power System Protection. New York: IEEE Press/McGraw-Hill, 1999.
[2] H. J. Altuve Ferrer and E. O. Schweitzer, III (eds.), Modern Solutions for Protection, Control, and Monitoring of Electric Power Systems. Schweitzer Engineering Laboratories, Inc., Pullman, WA, 2010.
[3] A. Jezak and R. Garcia, “Aggressive Electromechanical Relay Panel Replacement Project at TXU Electric Delivery,” proceedings of the 58th Annual Conference for Protective Relay Engineers, College Station, TX, April 2005.
[4] Transmission and Generation Protection System Maintenance and Testing, NERC Standard PRC-005-1, May 2006. Available: http://www.nerc.com.
[5] K. Zimmerman, “SEL Recommendations on Periodic Maintenance Testing of Protective Relays.” Available: http://www.selinc.com.
[6] IEEE Power System Relaying Committee, Working Group I-19, Redundancy Considerations for Protective Relaying Systems. Available: http://www.pes-psrc.org/.
24
[7] R. Moxley, “Analyze Relay Fault Data to Improve Service Reliability,” proceedings of the 57th Annual Conference for Protective Relay Engineers, College Station, TX, March 2004.
[8] J. Sykes, V. Madani, J. Burger, M. Adamiak, and W. Premerlani, “Reliability of Protection Systems (What Are the Real Concerns),” proceedings of the 63rd Annual Conference for Protective Relay Engineers, College Station, TX, March 2010.
[9] D. A. Wiegmann and S. A. Shappell, A Human Error Analysis of Commercial Aviation Accidents Using the Human Factors Analysis and Classification System (HFACS), Report DOT/FAA/AM-01/3, U.S. Department of Transportation, Federal Aviation Administration, Office of Aviation Medicine, February 2001. Available: http://libraryonline. erau.edu/online-full-text/faa-aviation-medicine-reports/AM01-03.pdf.
[10] Electric Reliability Council of Texas, Reliability and Operations Subcommittee, ERCOT Operating Guides, Section 7: Disturbance Monitoring and System Protection, July 1, 2010. Available: http://www.ercot.com.
[11] L. Portillo, S. Woolard, and T. Planert, “Using Innovative Electrical and Electronic Devices in the Reduction of Panel Size,” proceedings of the 63rd Annual Conference for Protective Relay Engineers, College Station, TX, March 2010.
[12] D. Costello, “Fly Safe and Level: Customer Examples in Implementing Dual Primary Protection Systems.” Available: http://www.selinc.com.
[13] IEEE Standard for Relays and Relay Systems Associated With Electric Power Apparatus, IEEE Standard C37.90-2005.
[14] NERC System Protection and Control Task Force, “Protection System Reliability – Redundancy of Protection System Elements,” NERC Technical Paper, November 2008. Available: http://www.nerc.com/ docs/pc/spctf/Redundancy_Tech_Ref_1-14-09.pdf.
[15] A. Apostolov, “Reliability and Redundancy – Are You Ready for Simplicity?” PAC World, March 2010. Available: http://www.pacw.org/ issue/march_2010_issue/editorial.html.
[16] E. O. Schweitzer, III, B. Fleming, T. J. Lee, and P. M. Anderson, “Reliability Analysis of Transmission Protection Using Fault Tree Methods,” proceedings of the 24th Annual Western Protective Relay Conference, Spokane, WA, October 1997.
[17] K. Zimmerman, “Commissioning of Protective Relay Systems,” proceedings of the 34th Annual Western Protective Relay Conference, Spokane, WA, October 2007.
[18] K. Zimmerman and D. Costello, “Lessons Learned From Commissioning Protective Relay Systems,” proceedings of the 62nd Annual Conference for Protective Relay Engineers, College Station, TX, March 2009.
[19] Study Committee 13, Working Group 13.06, Final Report of the Second International Enquiry on High Voltage Circuit-Breaker Failures and Defects in Service, CIGRÉ Technical Brochure No. 83, 1994.
[20] C. E. Sölver, Past CIGRÉ Surveys on Reliability of HV Equipment, CIGRÉ Document. Available: http://www.mtec2000.com/cigre_a3_06/ Rio/past.pdf.
[21] G. Mazza and R. Michaca, “The First International Enquiry on Circuit-Breaker Failures and Defects in Service,” Elektra, No. 79, pp. 21–91, December 1981.
[22] R. Sandoval and J. León Eternod, “Evaluation of Methods for Breaker Flashover Protection,” proceedings of the 31st Annual Western Protective Relay Conference, Spokane, WA, October 2004.
XIV. BIOGRAPHIES Dr. Edmund O. Schweitzer, III is recognized as a pioneer in digital protection and holds the grade of Fellow of the IEEE, a title bestowed on less than one percent of IEEE members. In 2002, he was elected a member of the National Academy of Engineering. Dr. Schweitzer received his BSEE and MSEE from Purdue University, and his PhD from Washington State University. He served on the electrical engineering faculties of Ohio University and Washington State University, and in 1982 he founded Schweitzer Engineering Laboratories, Inc. (SEL) to develop and manufacture digital protective relays and related products and services. Today, SEL is an employee-owned company, which serves the electric power industry worldwide, and is certified to the international quality standard ISO-9001.
David Whitehead, P.E. is the vice president of research and development at Schweitzer Engineering Laboratories, Inc. (SEL). Prior to joining SEL, he worked for General Dynamics, Electric Boat Division as a combat systems engineer. He received his BSEE from Washington State University in 1989, his MSEE from Rensselaer Polytechnic Institute in 1994, and is pursuing his PhD at the University of Idaho. He is a registered professional engineer in Washington and Maryland and a senior member of the IEEE. Mr. Whitehead holds seven patents with several others pending. He has worked at SEL since 1994 as a hardware engineer, research engineer, and chief engineer/assistant director and has been responsible for the design of advanced hardware, embedded firmware, and PC software.
Héctor J. Altuve Ferrer received his BSEE degree in 1969 from the Central University of Las Villas, Santa Clara, Cuba, and his Ph.D. in 1981 from Kiev Polytechnic Institute, Kiev, Ukraine. From 1969 until 1993, he served on the faculty of the Electrical Engineering School at the Central University of Las Villas. He served as a professor of the Graduate Doctoral Program in the Mechanical and Electrical Engineering School at the Autonomous University of Nuevo León, Monterrey, Mexico, from 1993 to 2000. From 1999 to 2000, he was the Schweitzer Visiting Professor at Washington State University’s Department of Electrical Engineering. In January 2001, Dr. Altuve joined Schweitzer Engineering Laboratories, Inc., where he is currently a distinguished engineer and director of technology for Latin America. He has authored and coauthored several books and more than 100 technical papers and holds four patents. His main research interests are in power system protection, control, and monitoring. Dr. Altuve is an IEEE senior member.
Demetrios A. Tziouvaras received his BSEE from the University of New Mexico and MSEE from Santa Clara University. He is an IEEE senior member and a member of the Power System Relaying Committee (PSRC) and CIGRE. He previously worked at Pacific Gas and Electric Company, where he held various protection engineering positions, including principal protection engineer for 18 years. In 1998, he joined Schweitzer Engineering Laboratories, Inc., where he currently holds the position of senior research engineer. He holds four patents and has authored and coauthored more than 50 technical papers. He served as the convener of CIGRE working group B5.15 on “Modern Distance Protection Functions and Applications” and is a member of several IEEE PSRC and CIGRE working groups.
David A. Costello graduated from Texas A&M University in 1991 with a BSEE. He worked as a system protection engineer at Central Power and Light and Central and Southwest Services in Texas and Oklahoma. He has served on the System Protection Task Force for ERCOT. In 1996, Mr. Costello joined Schweitzer Engineering Laboratories, Inc., where he has served as a field application engineer and regional service manager. He presently holds the title of senior application engineer and works in Boerne, Texas. He is a senior member of IEEE and a member of the planning committee for the Conference for Protective Relay Engineers at Texas A&M University.
David Sánchez Escobedo received his BSEE degree in 1994 from the University of Guanajuato, Mexico, and his M.Sc. degree in 2005 from the University of Guadalajara, Mexico. From 1994 until 1998, he was head of the Protection and Metering Office in the Western Transmission Area of Comisión Federal de Electricidad (CFE) in Guadalajara, Jalisco, Mexico. Mr. Sánchez served on the faculty of the Autonomous University of Guadalajara in 1998. From 1998 until 2000, he worked for INELAP-PQE in Guadalajara, Mexico, as a protection system design engineer. In September 2000, Mr. Sánchez joined Schweitzer Engineering Laboratories, Inc., where he is currently the electrical engineering manager in San Luis Potosí, Mexico. He has authored and coauthored several technical papers.
Previously presented at the 2011 Texas A&M Conference for Protective Relay Engineers.
© 2011 IEEE – All rights reserved. 20110217 • TP6460