Embed Size (px)
Citation preview

Line Laser and Triple Laser Quantification of the Difference in International Roughness Index Between Textured and Non-Textured StripsBernard Izevbekhai, Principal InvestigatorOffice of Materials and Road ResearchMinnesota Department of Transportation
July 2017
Research ProjectFinal Report 2017-28
• mndot.gov/researchRESEARCH SERVICES & LIBRARY

To request this document in an alternative format, such as braille or large print, call 651-366-4718 or 1-800-657-3774 (Greater Minnesota) or email your request to [email protected]. Pleaserequest at least one week in advance.
Technical Report Documentation Page 1. Report No. 2. 3. Recipients Accession No.
MN/RC 2017-28
5. Report Date
July 2017
4. Title and Subtitle
Line Laser and Triple Laser Quantification of the Difference in
International Roughness Index between Textured and Non-
Textured Strips
6.
7. Author(s)
Bernard Igbafen Izevbekhai
Hyung Jun Ahn
8. Performing Organization Report No.
9. Performing Organization Name and Address 10. Project/Task/Work Unit No.
Minnesota Department of Transportation Office of Materials and Road Research 1400 Gervais Avenue, MS 645 Maplewood, Minnesota 55109
11. Contract (C) or Grant (G) No.
12. Sponsoring Organization Name and Address 13. Type of Report and Period Covered
Minnesota Department of Transportation Research Services & Library 395 John Ireland Boulevard, MS 330 St. Paul, Minnesota 55155-1899
Final Report 14. Sponsoring Agency Code
15. Supplementary Notes
http:// mndot.gov/research/reports/2017/201728.pdf 16. Abstract (Limit: 250 words)
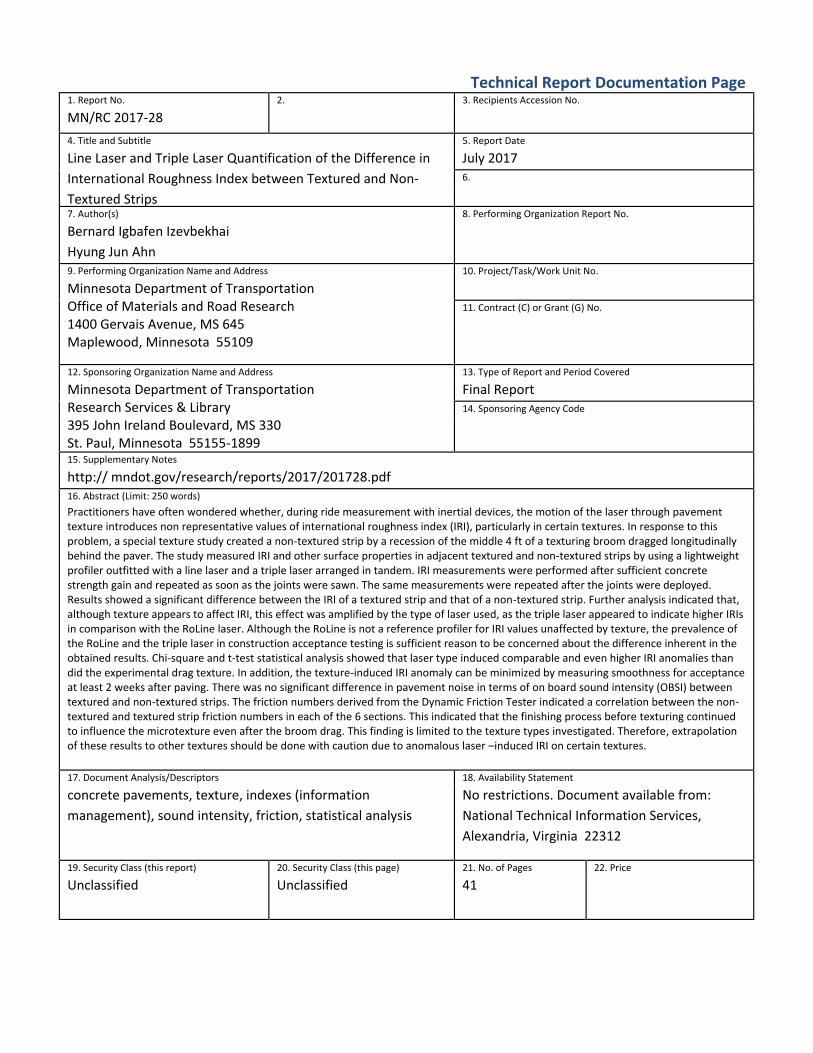
Practitioners have often wondered whether, during ride measurement with inertial devices, the motion of the laser through pavementtexture introduces non representative values of international roughness index (IRI), particularly in certain textures. In response to thisproblem, a special texture study created a non-textured strip by a recession of the middle 4 ft of a texturing broom dragged longitudinallybehind the paver. The study measured IRI and other surface properties in adjacent textured and non-textured strips by using a lightweightprofiler outfitted with a line laser and a triple laser arranged in tandem. IRI measurements were performed after sufficient concretestrength gain and repeated as soon as the joints were sawn. The same measurements were repeated after the joints were deployed.Results showed a significant difference between the IRI of a textured strip and that of a non-textured strip. Further analysis indicated that,although texture appears to affect IRI, this effect was amplified by the type of laser used, as the triple laser appeared to indicate higher IRIsin comparison with the RoLine laser. Although the RoLine is not a reference profiler for IRI values unaffected by texture, the prevalence ofthe RoLine and the triple laser in construction acceptance testing is sufficient reason to be concerned about the difference inherent in theobtained results. Chi-square and t-test statistical analysis showed that laser type induced comparable and even higher IRI anomalies thandid the experimental drag texture. In addition, the texture-induced IRI anomaly can be minimized by measuring smoothness for acceptanceat least 2 weeks after paving. There was no significant difference in pavement noise in terms of on board sound intensity (OBSI) betweentextured and non-textured strips. The friction numbers derived from the Dynamic Friction Tester indicated a correlation between the non-textured and textured strip friction numbers in each of the 6 sections. This indicated that the finishing process before texturing continuedto influence the microtexture even after the broom drag. This finding is limited to the texture types investigated. Therefore, extrapolationof these results to other textures should be done with caution due to anomalous laser –induced IRI on certain textures.
17. Document Analysis/Descriptors 18. Availability Statement
concrete pavements, texture, indexes (information
management), sound intensity, friction, statistical analysis
No restrictions. Document available from:
National Technical Information Services,
Alexandria, Virginia 22312
19. Security Class (this report) 20. Security Class (this page) 21. No. of Pages 22. Price
Unclassified Unclassified 41

Line Laser and Triple Laser Quantification of the Difference in International Roughness Index Between Textured and Non‐Textured Strips
FINAL REPORT
Prepared by:
Bernard Igbafen Izevbekhai, PE PhD Hyung Jun Ahn, PhD Office of Materials and Road Research Minnesota Department of Transportation
July 2017
Published by:
Minnesota Department of Transportation Research Services & Library 395 John Ireland Boulevard, MS 330 St. Paul, Minnesota 55155‐1899
This report represents the results of research conducted by the authors and does not necessarily represent the views or policies of the Minnesota Department of Transportation. This report does not contain a standard or specified technique.
The authors, the Minnesota Department of Transportation, do not endorse products or manufacturers. Trade or manufacturers’ names appear herein solely because they are considered essential to this report because they are considered essential to this report.

ACKNOWLEDGMENTS
Robert Orthmeyer, Senior Pavement Engineer of Federal Highway Administration facilitated the unique
outfitting of MnDOT’s lightweight profiler with RoLine and triple laser to enable this research work.
Steve Olson and John Pantelis of Minnesota Department of Transportation (MnDOT) facilitated on-site
testing. The Project Contractors Messrs. Shafer Contracting Company accommodated our elaborate
testing process in the test section after they created the adjacent textured and non-textured strips
within their already tight construction Schedule. The test section was created within an ongoing MnDOT
pavement construction project on Interstate 35 in Duluth. The cooperation of MnDOT District 1 is
therefore acknowledged.
MnDOT Pavement Manager, Curtis Turgeon and Concrete Engineer, Maria Masten of the Office of
Materials and Roads Research were the prime-movers of this research work.

TABLE OF CONTENTS
CHAPTER 1: Introduction ...................................................................................................................... 1
CHAPTER 2: Experimental Design and Equipment ................................................................................ 3
2.1 Test Section ........................................................................................................................................ 3
2.2 Light Weight Profiler ........................................................................................................................... 7
2.3 Circular Track Meter ........................................................................................................................... 7
2.4 Locked-Wheel Skid Tester .................................................................................................................. 7
2.5 Dynamic Friction Tester, ASTM E 1911 ............................................................................................... 8
2.6 On Board sound Intensity Tester ........................................................................................................ 9
CHAPTER 3: Results and Analysis ........................................................................................................ 10
3.1 Smoothness ...................................................................................................................................... 10
3.2 Texture Configuration Properties ..................................................................................................... 15
3.3 Pavement Friction ............................................................................................................................. 21
3.4 pavement Noise ................................................................................................................................ 23
CHAPTER 4: Statistical analysis of Effects of laser Type, Texture, Sawing, and Joint Deployment ........ 25
CHAPTER 5: Conclusions and Recommendations ................................................................................ 31
5.1 Conclusions ....................................................................................................................................... 31
5.2 Recommendations ............................................................................................................................ 32
REFERENCES ....................................................................................................................................... 33

LIST OF FIGURES
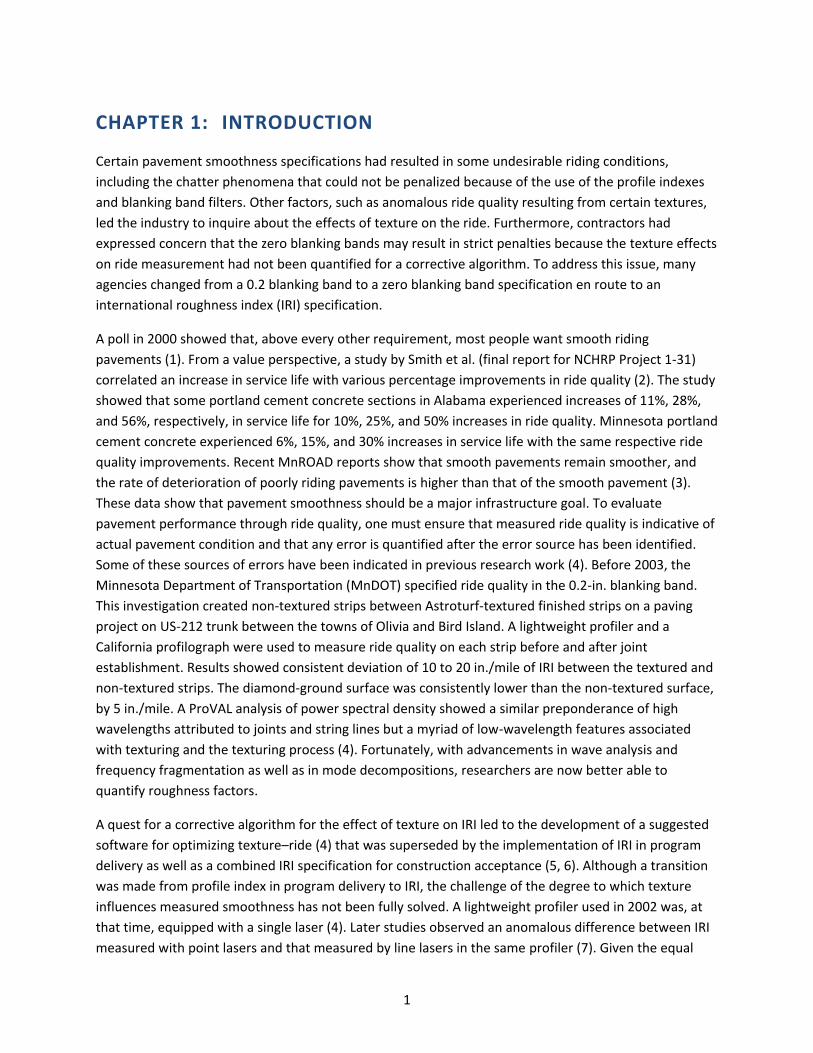
Figure 2-1 Location of test section on Interstate 35 near Duluth, MN (rd = road) ....................................... 4
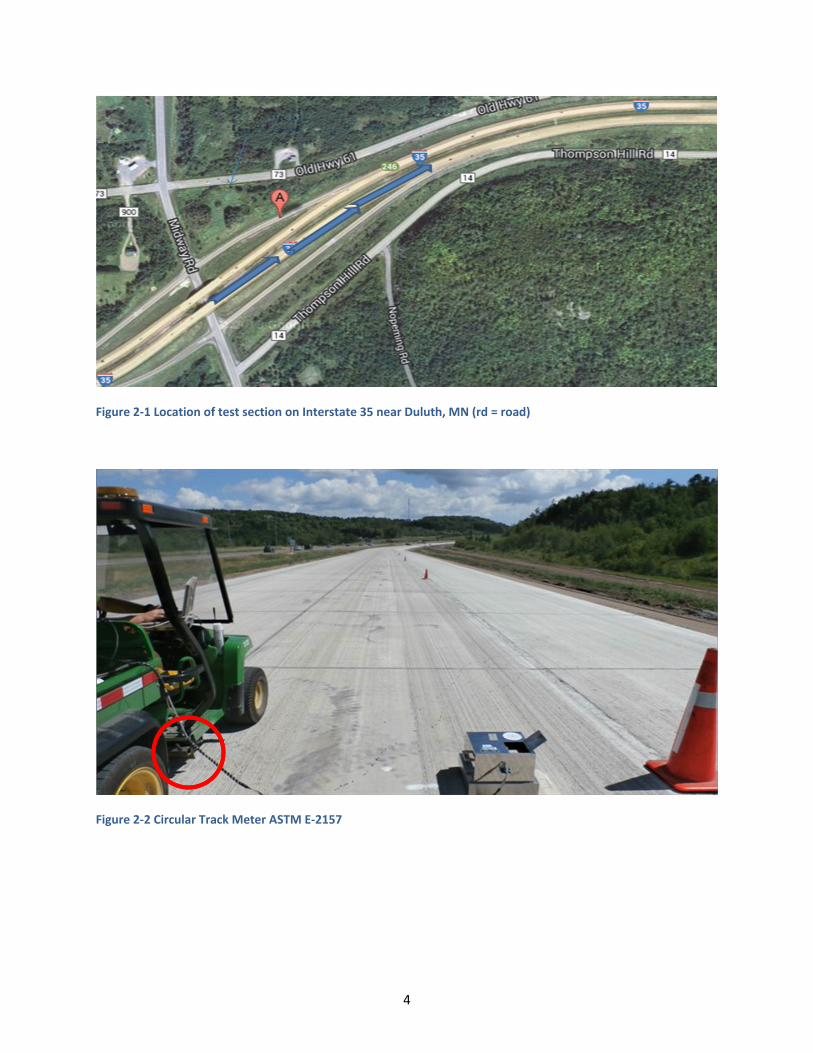
Figure 2-2 Circular Track Meter ASTM E-2157 .............................................................................................. 4
Figure 2-3 Lightweight Profiler used for pavement smoothness measurement .......................................... 5
Figure 2-4 Textured and non-textured strips: (a) sample area of 1,000 ft and (b) close-up view of
adjacent strips ............................................................................................................................................... 6
Figure 2-5 Dynamic Friction Tester (ASTM E 1911) used for friction evaluation in this project .................. 8
Figure 2-6 On Board Sound Intensity Tester ................................................................................................. 9
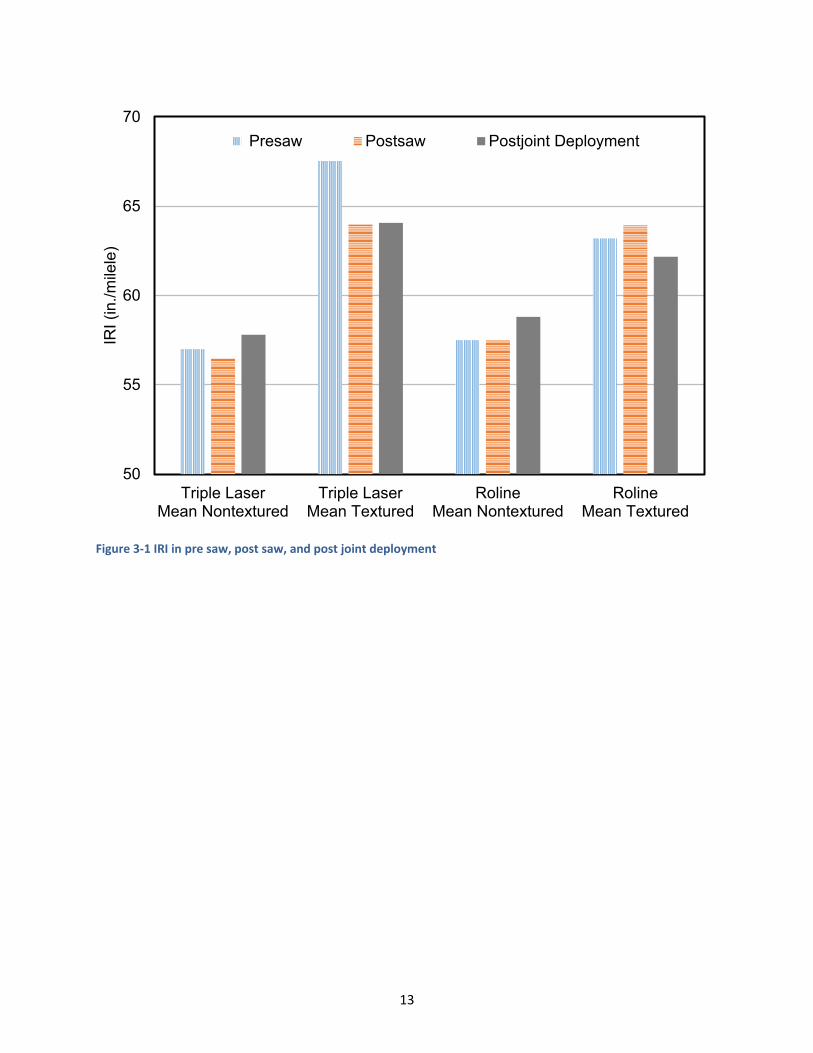
Figure 3-1 IRI in pre saw, post saw, and post joint deployment ................................................................. 13
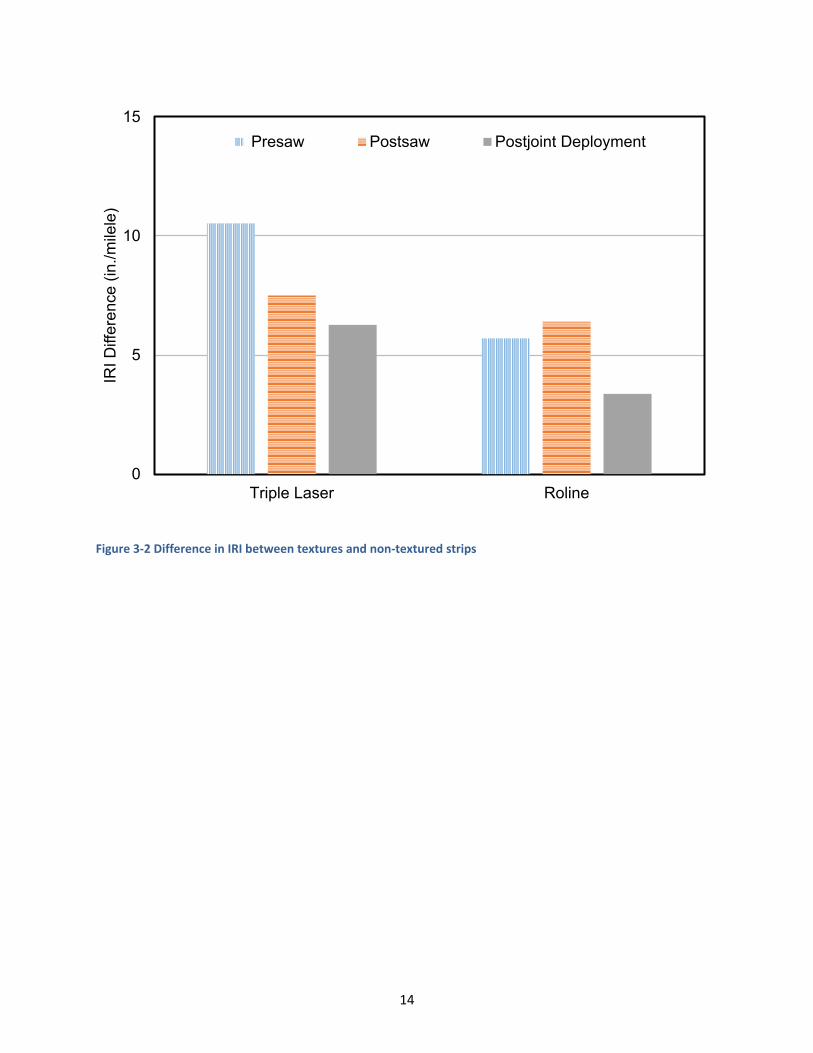
Figure 3-2 Difference in IRI between textures and non-textured strips ..................................................... 14
Figure 3-3 OBSI: (a) Non-textured Segment 1; (b) Textured Segment 1; (c) Non-textured Segment 2; (d)
Textured Segment 2 .................................................................................................................................... 24
LIST OF TABLES
Table 3-1 Presaw and postsaw test results for Triple Laser and RoLine ..................................................... 11
Table 3-2 Average IRI Presaw, Postsaw, and Postjoint Deployment .......................................................... 12
Table 3-3 Texture Test Results of Non-textured and Textured Strips at Stations 0 ................................... 17
Table 3-4 Texture Test Results of Non-textured and Textured Strips at Stations 100 ............................... 18
Table 3-5 Texture Test Results of Non-textured and Textured Strips at Stations 500 ............................... 19
Table 3-6 Texture Test Results of Non-textured and Textured Strips at Stations 600 ............................... 20
Table 3-7 Results of DFT (ASTM 1911) Friction Measurements ................................................................. 22
Table 3-8 Results of OBSI measurements ................................................................................................... 23
Table 4-1 Comparison of Significance of Texture and Laser Combinations ............................................... 27
Table 4-2 t-Test results ............................................................................................................................... 28

EXECUTIVE SUMMARY
Practitioners have often expressed concern that, during ride measurement with inertial devices, the
motion of the laser through pavement texture may introduce nonrepresentative values of international
roughness index (IRI), particularly in certain textures. In response to this problem, a special texture study
created a non-textured strip by a recession of the middle 4 ft of a texturing broom dragged
longitudinally behind the paver. The study measured IRI and other surface properties in adjacent
textured and non-textured strips by using a lightweight profiler outfitted with a line laser and a triple
laser arranged in tandem. IRI measurements were performed after sufficient concrete strength gain and
repeated as soon as the joints were sawn. The same measurements were repeated after the joints were
deployed. Results showed a significant difference between the IRI of a textured strip and that of a non-
textured strip. Further analysis indicated that, although texture appears to affect IRI, this effect was
amplified by the type of laser used, as the triple laser appeared to indicate higher IRIs in comparison
with the RoLine laser. Although the RoLine is not a reference profiler for IRI values unaffected by
texture, the prevalence of the RoLine and the triple laser in construction acceptance testing is sufficient
reason to be concerned about the difference inherent in the obtained results. Chi-square and t-test
statistical analysis showed that laser type induced comparable and even higher IRI anomalies than did
the experimental drag texture. In addition, the texture-induced IRI anomaly can be minimized by
measuring smoothness for acceptance at least 2 weeks after paving.
There was no significant difference in pavement noise in terms of OBSI between textured and non-
textured strips. The friction numbers derived from the Dynamic Friction Tester indicated a correlation
between the non-textured and textured strip friction numbers in each of the 6 sections. This indicated
that the finishing process before texturing continued to influence the microtexture even after the
broom drag. This finding is limited to the texture types investigated. Therefore, extrapolation of these
results to other textures should be done with caution due to anomalous laser –induced IRI on certain
textures.
1
CHAPTER 1: INTRODUCTION
Certain pavement smoothness specifications had resulted in some undesirable riding conditions,
including the chatter phenomena that could not be penalized because of the use of the profile indexes
and blanking band filters. Other factors, such as anomalous ride quality resulting from certain textures,
led the industry to inquire about the effects of texture on the ride. Furthermore, contractors had
expressed concern that the zero blanking bands may result in strict penalties because the texture effects
on ride measurement had not been quantified for a corrective algorithm. To address this issue, many
agencies changed from a 0.2 blanking band to a zero blanking band specification en route to an
international roughness index (IRI) specification.
A poll in 2000 showed that, above every other requirement, most people want smooth riding
pavements (1). From a value perspective, a study by Smith et al. (final report for NCHRP Project 1-31)
correlated an increase in service life with various percentage improvements in ride quality (2). The study
showed that some portland cement concrete sections in Alabama experienced increases of 11%, 28%,
and 56%, respectively, in service life for 10%, 25%, and 50% increases in ride quality. Minnesota portland
cement concrete experienced 6%, 15%, and 30% increases in service life with the same respective ride
quality improvements. Recent MnROAD reports show that smooth pavements remain smoother, and
the rate of deterioration of poorly riding pavements is higher than that of the smooth pavement (3).
These data show that pavement smoothness should be a major infrastructure goal. To evaluate
pavement performance through ride quality, one must ensure that measured ride quality is indicative of
actual pavement condition and that any error is quantified after the error source has been identified.
Some of these sources of errors have been indicated in previous research work (4). Before 2003, the
Minnesota Department of Transportation (MnDOT) specified ride quality in the 0.2-in. blanking band.
This investigation created non-textured strips between Astroturf-textured finished strips on a paving
project on US-212 trunk between the towns of Olivia and Bird Island. A lightweight profiler and a
California profilograph were used to measure ride quality on each strip before and after joint
establishment. Results showed consistent deviation of 10 to 20 in./mile of IRI between the textured and
non-textured strips. The diamond-ground surface was consistently lower than the non-textured surface,
by 5 in./mile. A ProVAL analysis of power spectral density showed a similar preponderance of high
wavelengths attributed to joints and string lines but a myriad of low-wavelength features associated
with texturing and the texturing process (4). Fortunately, with advancements in wave analysis and
frequency fragmentation as well as in mode decompositions, researchers are now better able to
quantify roughness factors.
A quest for a corrective algorithm for the effect of texture on IRI led to the development of a suggested
software for optimizing texture–ride (4) that was superseded by the implementation of IRI in program
delivery as well as a combined IRI specification for construction acceptance (5, 6). Although a transition
was made from profile index in program delivery to IRI, the challenge of the degree to which texture
influences measured smoothness has not been fully solved. A lightweight profiler used in 2002 was, at
that time, equipped with a single laser (4). Later studies observed an anomalous difference between IRI
measured with point lasers and that measured by line lasers in the same profiler (7). Given the equal

2
usage of line lasers and point lasers, a comprehensive evaluation of the effect of texture must include
the various types of lasers on adjacent textured and non-textured segments.
In response to this problem, a special texture study was performed on Interstate 35 in July 2013, in
Duluth Minnesota. This study which was performed in an identified test section on the interstate
highway during paving created a non-textured strip within the inverted turf dragged behind the
finishers. Subsequently, it measured IRI in the adjacent textured and non-textured strips using a light
weight profiler outfitted with the line laser and triple laser arranged in the line of the right wheels.
Measurements were performed as soon as the lightweight profiler could ride on the concrete and
measured again as soon as the joints were saw cut. The same measurements were repeated after the
joints were cut. Further measurements were conducted after the joints were deployed. Deployment of
joints is contextually defined as the completion of the propagation of vertical cracks below the depth of
cut and (by implication) the commencement of aggregate interlock load transfer at that joint.
Furthermore, pavement noise and surface friction were measured on textured and non-textured strips
utilizing on board sound intensity tester and friction tester (locked-wheel and dynamic), respectively.

3
CHAPTER 2: EXPERIMENTAL DESIGN AND EQUIPMENT
2.1 TEST SECTION
The test section consisted of 1,005 ft of the outside lane on northbound Interstate 35 near Midway Road
in Duluth, Minnesota. The southern limit of the test section was approximately 96.4 ft from the northern
limits of the Midway Bridge approach panel on this Interstate highway, as shown in Figure 2-1. This
section was part of a major project (SP 098-139) for construction of a new concrete pavement, which
consisted of doweled concrete 10 in. thick with nonskewed joints at 15 ft intervals. The paving was
followed by finishing and broom-drag texturing. In the test section, the broom was indented at the
middle (between wheel paths) to create a non-textured strip 4 ft wide between two textured strips of
that same width. Texturing was followed closely by the application of a uniform layer of alpha-methyl
styrene curing compound. When sufficient strength gain had occurred in 8 hr, a lightweight profiler was
able to get on the pavement. The first set of smoothness measurements were conducted on the
textured strip as well as on the non-textured strip. The Minnesota DOT had equipped the lightweight
profiler with a tandem arrangement of the triple-laser accelerometer and the line-laser accelerometer,
as shown in Figure 2-2. In this arrangement, the two accelerometers measured international roughness
index (IRI) simultaneously followed by two repeat runs in each strip. Figure 2-3 amplifies line laser beam
rays and triplepoint laser rays shown in Figure 2-2. These were the presaw ride measurements. Figure
Figure 2-4 shows the adjacent textured and non-textured strips. The corresponding (presaw) ride files
are identified as
mndotI35midwayDLpresawBWPnontxt (Runs 1 to 3).erd +5 ft from the centerline (CL) of the
road (non-textured) and
mndotI35midwayDLpresawRWPtxt (Runs 4 to 6).erd +8 ft from the CL of the road (broom
textured).
(The names and file extensions were chosen for continuity and easy access to a myriad of project and
research files.)
As soon as the transverse sawing was performed (3:00 a.m. the next day), longitudinal sawing
commenced and was completed at approximately 7:00 a.m. Joints were washed and cleaned of the
excess slurry. Another set of IRI measurements was taken on the textured and non-textured sections.
Postsawing ride files were identified as
mndotI35midwayDLpostsaw7.9.2013BWPnontxt (Runs 7 to 9) .erd +5 ft from the CL (non-
textured) and
mndotI35midwayDLpostsaw7.9.2013RWPtxt (Runs 10 to 12) .erd +8 ft from the CL of the road
(textured)
4
Figure 2-1 Location of test section on Interstate 35 near Duluth, MN (rd = road)
Figure 2-2 Circular Track Meter ASTM E-2157

5
Figure 2-3 Lightweight Profiler used for pavement smoothness measurement

6
(a)
(b)
Figure 2-4 Textured and non-textured strips: (a) sample area of 1,000 ft and (b) close-up view of adjacent strips

7
2.2 LIGHT WEIGHT PROFILER
To evaluate the effect of texturing on ride measurement, the lightweight profiler was equipped with
both the RoLine (line) laser and the TriODS (triple) laser on the right-hand side. This arrangement
facilitated the simultaneous collection of ride data with two types of lasers. Ride was measured with the
IRI. The IRI is based on the suspension algorithm of the quarter car traveling at 50 mph (8). Vertical
acceleration of the quarter car is associated with displacements that are summed over the traveled
distance as in. per mile or meters per kilometer. IRI is neither a slope of the profile nor a summation of
slopes of elements of the profile but the average rectified value of the slope of the power spectral
density. On the basis of the original intent for the quarter-car response to mimic the human response,
the plot of IRI gain versus frequency is characterized by two peaks that emphasize axle hop (of the
unsprung mass) and body bounce (of the sprung mass) (9).
2.3 CIRCULAR TRACK METER
Texture measurements were conducted with the circular track meter (ASTM E2157) so as to evaluate
the texture configuration associated with the textured and non-textured segments. The circular track
meter uses a laser-displacement sensor with a charge-coupled device to measure the profile of a circle
11.2 in. in diameter. The charge-coupled device is mounted on an arm that rotates 3.15 in. above the
surface. It is driven by a DC motor at a tangential velocity of 19.7 ft/min counterclockwise.
Measurements were performed in accordance with ASTM E2157. Accordingly, three measurements
were made at each test cell location. The output data were segmented into eight 4.4-in. arcs of 128
samples each. The precision for the given standard deviation of the eight measurements on the test cell
is 0.001 in. Outputs given by the device are the texture depth [mean profile depth (MPD)] of the eight
segments. By using the software developed for opening the data from the circular track meter (Figure
2), MPD is then reported.
2.4 LOCKED-WHEEL SKID TESTER
At MnDOT, a locked-wheel skid tester, as specified by the American Society of Testing and Materials
(ASTM E 274), is used. This device is towed behind a vehicle at a speed of 40 mph and measures the
Friction Number (FN). The vehicle also carries a supply of water that is laid down directly in front of the
test tire to test the pavement when it is wet. When the locked-wheel skid trailer reaches the testing
area, a measured amount of water is applied to the pavement in front of the test tire; then the tire
(ribbed or smooth) locks up, and the wheel is pulled along for a given length. During that period, it
measures the amount of tractive force required to pull the trailer. The measured force is then sent to a
laptop, which is stored inside the tow vehicle. Finally, the skid number or coefficient of friction can be
calculated by taking the tractive force divided by the known wheel load and then multiplied by 100 (this
is done automatically as the test is being conducted).

8
2.5 DYNAMIC FRICTION TESTER, ASTM E 1911
The Dynamic Friction Tester (DFT) shown in Figure 2-5 consists of three rubber sliders, positioned on a
disk of diameter 13.75 in, that are suspended above the pavement surface. When the tangential velocity
of the sliders reaches 90 km/hr water is applied to the surface, and the sliders make contact with the
pavement. A computer takes friction measurements across a range of speeds as the sliders slow to a
stop. A DFT value obtained at 20 km/hr, along with texture measurement provides a good indication of
International Friction Index (IFI).
Figure 2-5 Dynamic Friction Tester (ASTM E 1911) used for friction evaluation in this project

9
2.6 ON BOARD SOUND INTENSITY TESTER
Near field noise measurement method usually obtain sound measurements while a vehicle is in motion
using microphone(s) positioned very close to the tire pavement interaction. OBSI equipment consists of
a Chevrolet Impala and eight four meters connected via four communication cables to a Bruel and Kjaer
front-end collector connected to a dell laptop computer. The intensity meters are mounted on a rig
system attached to a standard reference test tire that is installed at the rear left side of the vehicle and
maintained at a temperature of 30 ˚C. After recording temperature, four intensity meters were plugged
in to the B &K front-end unit, as well as 12v power supply and Ethernet (computer) cable. With this
arrangement, the unit is capable of measuring repeatable tire & pavement-interaction noise of the tire-
pavement contact-patch at a speed of 60 mph, thus measuring approximately 440 ft within 5 seconds. It
is mandatory to mount the rig on a non-dedicated vehicle and calibrate microphones. Durometer
evaluation of the tire prior to measurement is also a required procedure, prior to data collection.
Figure 2-6 On Board Sound Intensity Tester

10
CHAPTER 3: RESULTS AND ANALYSIS
3.1 SMOOTHNESS
A gradual decrease in the difference between the IRIs of textured and non-textured strips is indicated by
the triple laser measurement (Table 3-1) from paving to joint deployment. Initially, before sawing, that
difference was 10.5 in./mile, which became 7.5 in./mile after sawing. The reduction in the net effect of
texturing is attributed in part to changes in the megatexture and stress relief from built-in warp and curl
attributable to joint sawing. After standard joint sawing to one-third the pavement thickness, the space
beneath the joint is expected to crack to the slab bottom and provide load transfer through aggregate
interlock. This phenomenon is referred to as “joint deployment.” Although it can be accelerated by
heavy equipment, such loads may cause uncontrolled cracking. Consequently, before traffic loading,
shrinkage of the concrete and restraint of the base (or interlayer) facilitate joint deployment.
However, crack propagation (joint deployment) seemed to have occurred fully 2 weeks after paving in
this test section. After joint deployment, a difference of 6.27 in./mile was observed. The RoLine in all
cases exhibited a lower IRI value than did the triple laser. This difference justified the fact that the
bridging of the texture asperities by a line laser may be more representative of a tire footprint that is not
necessarily affected by the texture asperities. Initially before sawing, RoLine showed an IRI difference of
6.2 in./mile between textured and non-textured strips. After sawing, this difference became 6.43
in./mile Crack deployment resulted in a difference of 3.37 in./mile Table 3-2 shows that the difference in
IRI arising from sawing of the joints is almost insignificant in the RoLine but remarkable with the triple
laser. Examination of the actual IRI values showed that the triple laser started at 57 in./mile in the non-
textured strip and decreased slightly to 56.47 in./mile after joints were sawed but changed to 57.8
in./mile when the joints were deployed in the non-textured strip. These numbers are within the margin
of error. In the textured strip, the triple laser started at 67.53 in./mile and decreased slightly to 63.97
in./mile after joints were sawed but increased slightly to 64.07 in./mile when the joints were deployed.
The RoLine started (presaw) at 57.0 in./mile in the non-textured strip and changed slightly to 57.5
in./mile after joints were sawed but increased slightly to 63.93 in./mile when the joints were deployed
in the non-textured strip. In the textured strip, the RoLine started (before sawing) at 63.2 in./mile and
increased slightly to 63.93 in./mile after joints were sawed and changed slightly to 62.17 in./mile when
the joints were deployed. Figure 3-1 clarifies the information summarized in Table 3-2. Figure 3-2
accentuates the IRI difference between textured and non-textured strips. The figure shows that laser
type and texturing were more influential to the changes than were the joints and the deployment.

11
Table 3-1 Presaw and postsaw test results for Triple Laser and RoLine
Ride File Name IRI (in./mile)
Triple Laser RoLine Difference
Non-textured
mndotI35midwayDLpresawBWPnontxtr1 57.20 57.20 0.00
mndotI35midwayDLpresawBWPnontxtr2 57.10 56.60 0.50
mndotI35midwayDLpresawBWPnontxtr3 56.70 57.20 -0.50
Mean 57.00 57.00 0.00
Textured
mndotI35midwayDLpresawRWPtxt4 69.00 63.50 5.50
mndotI35midwayDLpresawRWPtxt5 68.00 62.10 5.90
mndotI35midwayDLpresawRWPtxt6 65.60 64.00 1.60
Mean 67.53 63.20 4.33
Mean Difference (Textured -Non-textured) 10.53 6.20 4.33
Non-textured
mndotI35midwayDLpostsaw7.9.2013BWPnontxt1 56.10 57.70 -1.60
mndotI35midwayDLpostsaw7.9.2013BWPnontxt2 56.50 57.40 -0.90
mndotI35midwayDLpostsaw7.9.2013BWPnontxt3 56.80 57.40 -0.60
Mean 56.47 57.50 -1.03
Textured
mndotI35midwayDLpostsaw7.9.2013RWPtxt4 65.30 63.10 2.20
mndotI35midwayDLpostsaw7.9.2013RWPtxt5 62.50 64.40 -1.90
mndotI35midwayDLpostsaw7.9.2013RWPtxt6 64.10 64.30 -0.20
Mean 63.97 63.93 0.03
Mean Difference (Textured -Non-textured) 7.50 6.43 1.06

12
Table 3-2 Average IRI Presaw, Postsaw, and Postjoint Deployment
Measurement IRI (in./mile)
Presaw Postsaw Postjoint
Triple Laser
Mean Non-textured 57.00 56.47 57.80
Mean Textured 67.53 63.97 64.07
RoLine
Mean Non-textured 57.50 57.50 58.80
Mean Textured 63.20 63.93 62.17
Difference
Triple Laser 10.53 7.50 6.27
RoLine 5.70 6.43 3.37
13
Figure 3-1 IRI in pre saw, post saw, and post joint deployment
50
55
60
65
70
Triple LaserMean Nontextured
Triple LaserMean Textured
RolineMean Nontextured
RolineMean Textured
IRI (in./m
ilele
)
Presaw Postsaw Postjoint Deployment
14
Figure 3-2 Difference in IRI between textures and non-textured strips
0
5
10
15
Triple Laser Roline
IRI D
iffe
rence (
in./m
ilele
)
Presaw Postsaw Postjoint Deployment

15
3.2 TEXTURE CONFIGURATION PROPERTIES
This section describes the measurements and computation of texture configurations in the textured and
non-textured sections. The Turf or broom drag texture used is an anisotropic texture with longitudinally
directed asperities. It is, therefore, a longitudinal texture. The circular track meter is a device that uses a
charge coupled device (CCD) laser-displacement sensor to measure the profile of an 11.2 in. diameter
circle. The CCD is mounted on an arm that rotates at 3.15 in. above the surface. It is driven by a DC
motor at a tangential velocity of 19.7 ft./min in a counterclockwise direction. Measurements taken are
made according to the ASTM E 2157 standard. In the standard, it states that three measurements are to
be collected at each test cell location. The data collected are segmented into eight 4.4 in. arcs of 128
samples each (as shown in FIGURE 1). The precision for the given standard deviation of the eight
measurements on the test cell is 0.001 in. Test panels which are being tested on should have at least 24
by 24 in. in size. Additionally, the CTM is required to be oriented in such a way that the scanning of
segments C and G is perpendicular to the travel.
Outputs given by the device is texture depth (mean profile depth) (MTD) of the eight segments. By
using the software developed for opening the CT Meter data (as shown in FIGURE 1), mean profile depth
(MPD) and root mean square (RMS) of MPD is then reported. The theoretical formula to estimate MPD
from MTD values provided by the CT Meter is such as below:
MTD =0.947 MPD +0.0027 Equation 1
when both variables are expressed in in.
The MPD is a direct output of the CTM. Parameters obtained directly from the equipment include MPD
and an unscaled texture profile. However, in addition to MPD, texture direction, asperity interval, and
texture orientation are required for adequate characterization of the texture configuration. “Asperity
interval” is defined as the characteristic wavelength of a repeating texture pattern. It is positive for
positively skewed distributions and negative for negatively skewed ones. For texture direction, which is
different from texture orientation, the turf or broom drag texture used is an anisotropic one with
longitudinal asperities and is itself therefore longitudinal. Texture orientation (spikiness) is a measure of
the skewness of the amplitude distribution function of a texture (9). MPD values were obtained for
various measurement points at 0 + 00, 100 + 00, 500 +00, and 600 + 00 at various offsets and thus
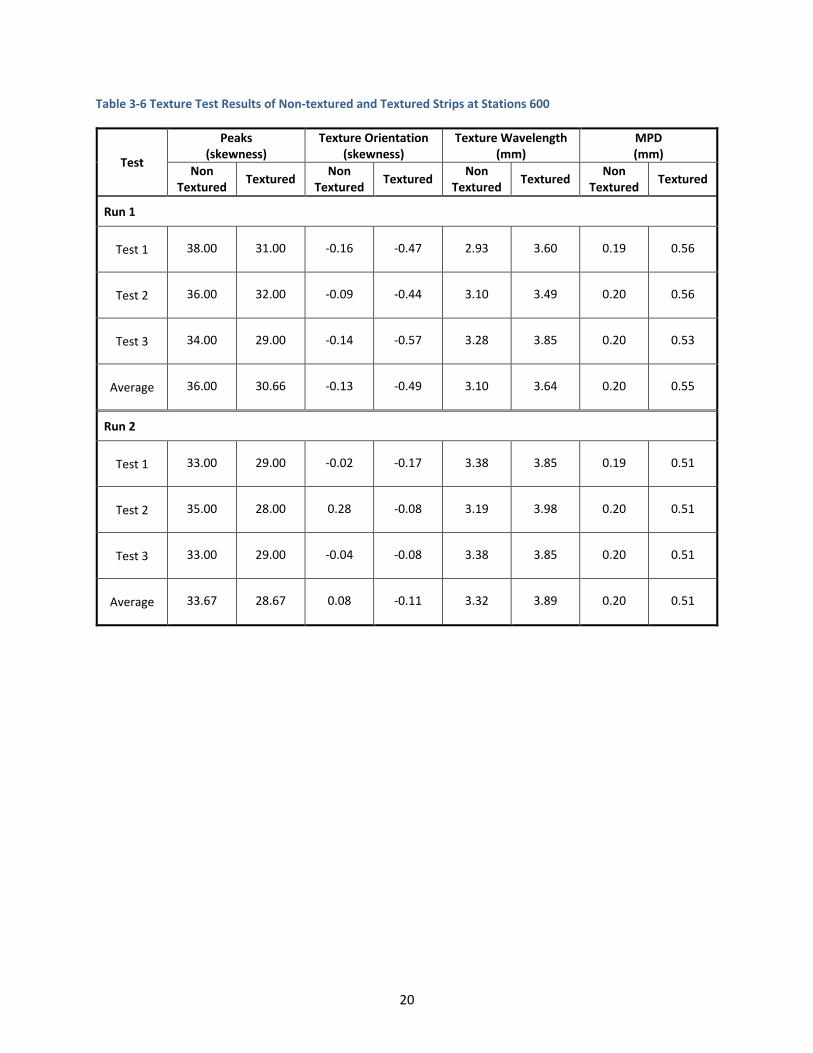
measured the textured and adjacent non-textured strips. Table 3-3, Table 3-4, Table 3-5, and Table 3-6
show the MPD values obtained at Stations 0 + 00, 100 + 00, 500 +00, and 600 + 00 in these strips. The
MPDs for the non-textured strip ranged from 0.15 to 0.3 mm, while the MPDs for the textured strip
ranged from 0.8 to 1.2 mm. These measurements were taken 2 weeks after paving and before opening
to traffic (but not without some light construction traffic). Consequently, if texture loss had occurred, it
would be proportionately higher in the textured strips. A Visual Basic program was developed by the Mn
DOT’s research team for concrete to aid in extracting raw data from the circular track meter. After raw
data files had been parsed, results were automatically saved in a new spreadsheet. Parser provided 128
texture depth measurements for each segment for each of three separate runs. Skewness (texture
orientation) was computed as in Equation 2:

16
Texture orientation = ∑ (𝒚𝒊−𝐘)̅̅ ̅𝐍
𝐢=𝟏
𝟑
(𝐍−𝟏)𝐒𝟑 Equation 2
where
i = segment of surface,
y = depth measured from reference,
Y = expected mean value of y,
N = Sample size, and
S = Sample standard deviation
Values obtained for the asperity interval showed that the textured segment had lower asperity intervals
of 3.1 to 3.4 mm while the broom texture showed asperity intervals of 3.8 to 4.6 mm. Texture
orientation is a measure of texture spikiness in pavement surfaces. Pavement surfaces are categorized
into two sorts: spiky and nonspiky. The signature characteristic of a spiky surface is the sharp peaks and
round valleys that indicate the appearance of asperities projected above the surface, while a nonspiky
surface has flat peaks and sharp valleys that indicate depressions in the surface. The probability density
function plotted by using the frequency of peak heights shows that the spiky surface has a positively
skewed distribution and that the nonspiky surface has a negatively skewed distribution. Values obtained
showed that the non-textured segments had a somewhat neutral texture orientation, while some were
slightly positive and ranged from −0.2 to +0.4. The textured segments exhibited a range of −10 to +0.2,
indicating a more negative texture. Table 3-3, Table 3-4, Table 3-5, and Table 3-6 show results of texture
measurements and subsequent analysis for the sections in this study.

17
Table 3-3 Texture Test Results of Non-textured and Textured Strips at Stations 0
Test
Peaks (skewness)
Texture Orientation (skewness)
Texture Wavelength (mm)
MPD (mm)
Non Textured
Textured Non
Textured Textured
Non Textured
Textured Non
Textured Textured
Run 1
Test 1 35.00 24.00 -0.08 -0.41 3.19 4.65 0.24 1.02
Test 2 35.00 24.00 -0.10 -0.43 3.19 4.65 0.24 1.01
Test 3 36.00 22.00 -0.15 -0.48 3.10 5.07 0.23 1.03
Average 35.33 23.33 -0.11 -0.44 3.16 4.79 0.24 1.02
Run 2
Test 1 36.00 28.00 0.04 -0.41 3.10 3.98 0.19 0.82
Test 2 35.00 29.00 -0.03 -0.42 3.19 3.85 0.18 0.81
Average 35.50 28.50 0.01 -0.41 3.14 3.91 0.19 0.82

18
Table 3-4 Texture Test Results of Non-textured and Textured Strips at Stations 100
Test
Peaks (skewness)
Texture Orientation (skewness)
Texture Wavelength (mm)
MPD (mm)
Non Textured
Textured Non
Textured Textured
Non Textured
Textured Non
Textured Textured
Run 1
Test 1 38.00 31.00 0.27 -0.56 2.93 3.60 0.23 0.51
Test 2 35.00 28.00 0.22 -0.50 3.19 3.98 0.23 0.52
Test 3 35.00 26.00 0.28 -0.54 3.19 4.29 0.22 0.50
Average 36.00 28.33 0.26 -0.54 3.10 3.96 0.22 0.51
Run 2
Test 1 35.00 26.00 -0.21 -10.95 3.19 4.29 0.19 0.54
Test 2 36.00 24.00 -0.24 -7.78 3.10 4.65 0.20 0.56
Test 3 35.00 26.00 -0.25 -10.95 3.19 4.29 0.19 0.57
Average 35.33 25.33 -0.24 -9.89 3.16 4.41 0.19 0.56

19
Table 3-5 Texture Test Results of Non-textured and Textured Strips at Stations 500
Test
Peaks (skewness)
Texture Orientation (skewness)
Texture Wavelength (mm)
MPD (mm)
Non Textured
Textured Non
Textured Textured
Non Textured
Textured Non
Textured Textured
Run 1
Test 1 34.00 28.00 0.00 -0.41 3.28 3.98 0.23 0.85
Test 2 34.00 24.00 0.04 -0.40 3.28 4.65 0.23 0.86
Test 3 37.00 27.00 0.00 -0.39 3.01 4.13 0.23 0.84
Average 35.00 26.33 0.01 -0.40 3.19 4.25 0.23 0.85
Run 2
Test 1 35.00 26.00 0.18 -0.10 3.19 4.29 0.34 0.86
Test 2 33.00 26.00 0.24 -0.11 3.38 4.29 0.34 0.85
Test 3 35.00 26.00 0.34 -0.10 3.19 4.29 0.35 0.85
Average 34.33 26.00 0.25 -0.10 3.25 4.29 0.34 0.85
20
Table 3-6 Texture Test Results of Non-textured and Textured Strips at Stations 600
Test
Peaks (skewness)
Texture Orientation (skewness)
Texture Wavelength (mm)
MPD (mm)
Non Textured
Textured Non
Textured Textured
Non Textured
Textured Non
Textured Textured
Run 1
Test 1 38.00 31.00 -0.16 -0.47 2.93 3.60 0.19 0.56
Test 2 36.00 32.00 -0.09 -0.44 3.10 3.49 0.20 0.56
Test 3 34.00 29.00 -0.14 -0.57 3.28 3.85 0.20 0.53
Average 36.00 30.66 -0.13 -0.49 3.10 3.64 0.20 0.55
Run 2
Test 1 33.00 29.00 -0.02 -0.17 3.38 3.85 0.19 0.51
Test 2 35.00 28.00 0.28 -0.08 3.19 3.98 0.20 0.51
Test 3 33.00 29.00 -0.04 -0.08 3.38 3.85 0.20 0.51
Average 33.67 28.67 0.08 -0.11 3.32 3.89 0.20 0.51

21
3.3 PAVEMENT FRICTION
Due to the nature of this test section, it was not expedient to bring in a skid trailer early in the curing
process of the concrete. The Dynamic friction tester was therefore used because of its lightness
portability and in spite of its limiting factor of spot testing. In other cases, the preferred equipment is
the lock wheel skid trailer particularly because of its continuous testing capability and its adaptability to
measurement under traffic to a safe degree. It was therefore found necessary to convert the DFT
coefficient of friction numbers to ribbed tire friction numbers. A correlation between the two has not
been developed at MnDOT, but Florida has authentic correlation algorithms (9) based on the work of
Bouzid et al. (10)
The regression equations relating the locked wheel test results and the DFT results at 40 mph (65 km/h)
are:
FN40R= 0.64 DFT40 + 9.23 (1)
DFT40 =1.56 FN40R - 14.42 (2)
where,
FN40R = Friction Number from locked wheel testing at 40 mph using a ribbed tire
DFT40 = Coefficient of Friction from DFT at 40 mph multiplied by 100.
Although the above equations can be used to convert the DFT (ASTM E-1911) result to the locked wheel
friction number at 40 mph and vice versa, conditions do exist where the DFT testing or the locked wheel
testing at 40 mph is not feasible due to constraints such as safety, traffic congestion, speed limits,
and/or roadway geometries. The following regression equations developed to convert the locked wheel
test results at 20 and 30 mph to those at 40 mph respectively are:
FN40R= 0.89FN20R- 4.88 ( 3 )
where,
FN20R = Friction Number from locked wheel testing at 20 mph using a ribbed tire, and
FN40R= 0.95FN30R - 2.91 (4)
where,
FN30R = Friction Number from locked wheel testing at 30 mph using a ribbed
tire.
These 2 equations above will be useful if a speed gradient function is to be integrated into a hysteresis
and adhesion decomposition of friction. An interesting observation above shows the correlation
between the non-textured surface friction and the textured surface friction. This indicates that the
22
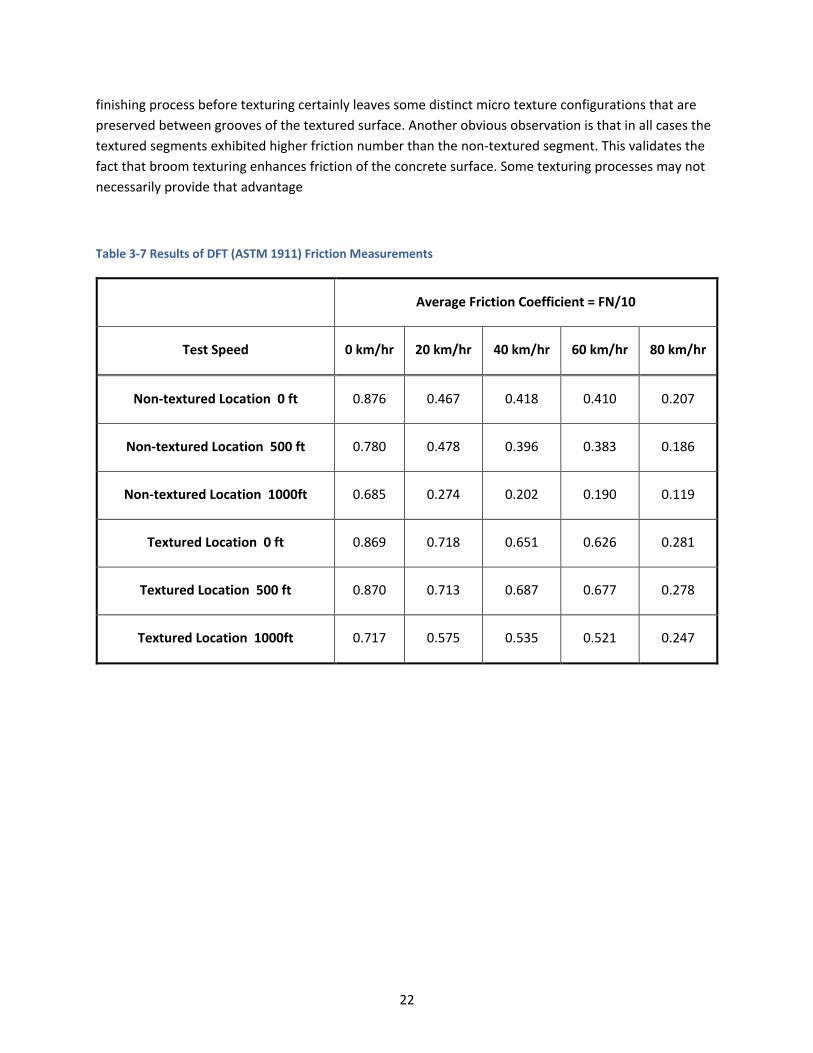
finishing process before texturing certainly leaves some distinct micro texture configurations that are
preserved between grooves of the textured surface. Another obvious observation is that in all cases the
textured segments exhibited higher friction number than the non-textured segment. This validates the
fact that broom texturing enhances friction of the concrete surface. Some texturing processes may not
necessarily provide that advantage
Table 3-7 Results of DFT (ASTM 1911) Friction Measurements
Average Friction Coefficient = FN/10
Test Speed 0 km/hr 20 km/hr 40 km/hr 60 km/hr 80 km/hr
Non-textured Location 0 ft 0.876 0.467 0.418 0.410 0.207
Non-textured Location 500 ft 0.780 0.478 0.396 0.383 0.186
Non-textured Location 1000ft 0.685 0.274 0.202 0.190 0.119
Textured Location 0 ft 0.869 0.718 0.651 0.626 0.281
Textured Location 500 ft 0.870 0.713 0.687 0.677 0.278
Textured Location 1000ft 0.717 0.575 0.535 0.521 0.247

23
3.4 PAVEMENT NOISE
On board sound intensity (OBSI) test was conducted on the adjacent textured, and textured strips and
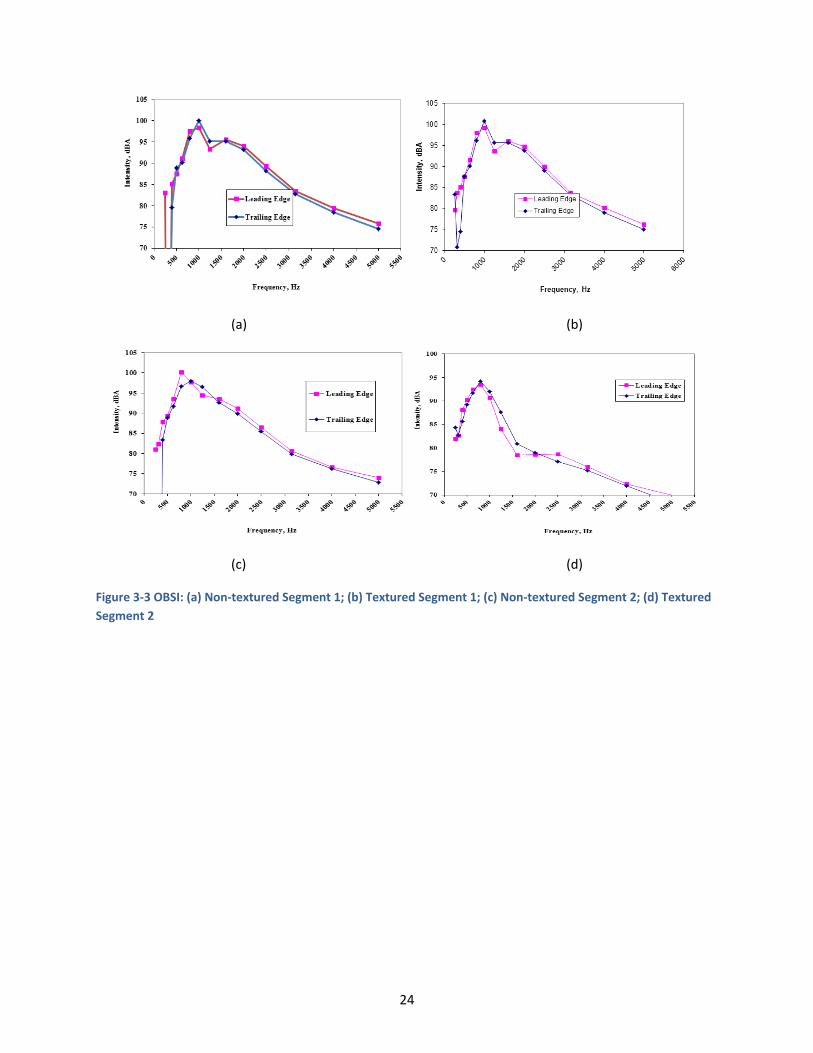
the results obtained are shown in Table 3-8. Except at peak frequency between 800 and 1800 Hz,
Leading edge microphone is louder that Trailing edge. There appears to be a tone at the peak frequency
1000 Hz. At higher frequencies, the leading edge microphone appears to be louder in both the non-
textured and textured strips. However, the trailing edge appears to louder at the multi-coincidence
frequency peaks (8) and in particular the tire resonance frequency of 1000Hz (Figure 3-3). It is evident
that the trailing edge microphone picks up the air compression relief mechanism and more thread block
impact mechanism on the asperities of the textured strip than the non-textured strip.
There is no significant difference between textured and non-textured OBSI as evident in Table 3-8.
However, the third set on the non-textured strip appears to be consistent with existing and accepted
OBSI prediction models (8).
Table 3-8 Results of OBSI measurements
Subsection
Textured Strip OBSI ( dBA) Non-textured Strip OBSI (dBA)
Difference Leading
Edge
Trailing
Edge Overall
Leading
Edge
Trailing
Edge Overall
0-500ft 104.2 103.2 103.7 103.6 103 103.3 0.4
0-500ft 104 103.1 103.6 103.9 103.6 103.7 -0.1
0-500ft 104 103.1 103.6 104.4 104.5 104.5 -0.9
500-1000ft 104.4 103.8 104.1 103.8 104.1 103.9 0.2
500-1000ft 104.2 103.6 103.9 104 104.3 104.2 -0.3
500-1000ft 104.4 103.7 104.1 98.3 98.7 98.5 5.6
24
(a) (b)
(c) (d)
Figure 3-3 OBSI: (a) Non-textured Segment 1; (b) Textured Segment 1; (c) Non-textured Segment 2; (d) Textured
Segment 2

25
CHAPTER 4: STATISTICAL ANALYSIS OF EFFECTS OF LASER TYPE,
TEXTURE, SAWING, AND JOINT DEPLOYMENT
This section examines texture, with the chi-square (χ2) test and the t-test (10) as the chosen statistical
tools to evaluate the relative importance of texture and laser in influencing IRI. The χ2 test first
calculates a χ2 statistic by using the formula in Equation 3:
∑ ∑(𝐴𝑖𝑗−𝐵𝑖𝑗)
2
𝐵𝑖𝑗
𝑐𝑗=1
𝑟𝑖=1 Equation 3
Where,
Aij = actual frequency in the i-th row, j-th column;
Eij = expected frequency in the i-th row, j-th column; and
r = number or rows c = number of columns.
A low value of χ2 is an indicator of independence. As the formula shows, χ2 is always positive or 0 only if
Aij = Bij for every i or j. This test returns the probability that a value of the χ2 statistic at least as high as
the value calculated by the above formula could have happened by chance under the assumption of
independence. The test uses the χ2 distribution with an appropriate number of degrees of freedom (df).
The χ2 statistic was first calculated in the comparison of the textured strip IRI with the non-textured
strip IRI. Subsequently, it was calculated between the prejoint deployment IRI and the postjoint
deployment IRI and between laser types. The results are shown in the first two rows of Table 4.
Proximity to one is an indication of similarity, in this case, or dependence, where applicable. In
subsequent rows of Table 4, the χ2 statistic was obtained for laser type and texture by using RoLine and
non-textured as the expected values. The results are shown in the postsaw IRI column of Table 4 and
indicate that joint sawing and joint deployment are not significant in the IRI distribution. The results also
show that the laser type has more influence on the IRI than does the joint sawing and deployment. The
t-test, based on the difference between means, considers data spread and computes the probability of
overlap. The final formula for the t-test is shown in Equation 4:
𝑡 =[(𝑥1+ 𝑥2)−𝑑]
𝑆𝐸 Equation 4
Where,

26
x1 = mean of textures surface or Laser 1, as applicable;
x2 = mean of non-textured surface of Laser 2, respectively;
d = hypothesized difference between population means; and
SE = standard error of the mean.
The P-value is the probability of a sample statistic being as extreme as the test statistic. Because the test
statistic is a t-score, the t-distribution was used to assess the probability associated with the t-score,
with df as computed earlier. If the sample findings are unlikely given the null hypothesis, the researcher
rejects the null hypothesis. Typically, this decision involves comparing the P-value to the significance
level and rejecting the null hypothesis when the P-value is less than the significance level. The t-value
will be positive if the first mean is larger than the second, and negative if the first mean is smaller than
the second. To test the significance, risk level [called the alpha (α) level] was set to .05. In the t-test, the
df is the population in both groups minus two. Given the alpha level and df, the t-value was obtained
from a standard table of significance. This test directly returned a P-value that was compared with a
pivot of .05. It showed that joint sawing and joint deployment were not significant in the IRI distribution.
It also showed that the laser type had more influence on the IRI than did the joint sawing and
deployment at this level of significance. Table 4-1 explains the relative importance of the various factors
(laser type, joint condition, and texturing) on IRI. The various factors in the first two columns of Table
4-1 were subjected to the two statistical tests described earlier, and the results ranked the columns
under the headings p-value and rank. The combined ranking formed the basis of evaluation of the
similarity or dissimilarity between various combinations of laser types, test strips, and joint conditions.
Joint condition refers to presawing, postsawing, and postjoint deployment in this context, not to the
degree of distress. Therefore, irrespective of joint condition, the triple laser and the RoLine
measurements on textured strips at a 95% confidence level were dissimilar despite the strong similarity
exhibited in the RoLine and triple laser in the non-textured strips. From the results of a comparison of
the relative tendency of textured to non-textured strips to introduce anomalies to ride measurements,
one may also deduce that the laser type may be more influential than the texture. However, in the non-
textured strips, the triple laser and RoLine appeared similar at a 95% confidence level. The RoLine on the
texture strip and the RoLine on the non-textured strip were also found to be dissimilar. Texturing
appears to have an effect, but this effect is amplified by the laser types and by the correspondingly
different laser effects. Table 4-1 arranges the tests in order of significance by each statistical test (t-test
and χ2 test) and sums the rankings into a final rank, with the lowest number being the most significant. It
identifies laser type and texture as very significant, as accentuated by the laser effect being insignificant
in the non-textured strip.

27
Table 4-1 Comparison of Significance of Texture and Laser Combinations
Test Variable
P-Value Rank
Effect
χ2 t-Test χ2 T Sum*
Triplelaser textured vs.
non-textured Texture, laser 0.381 2.5 E-8 2 1 3
Cleary
significant
Triplelaser vs. RoLine
(textured) Laser 0.229 0.037 1 3 4
Cleary
significant
RoLine textured vs. non-
textured Texture with RoLine 0.478 0.030 3 2 5
Cleary
significant
Postjoint vs. prejoint
deployment (all) Deployment 0.714 0.165 4 5 9 significant
Postsaw vs. presaw Sawing 0.948 0.276 5 6 11 Non
significant
Triplelaser vs. RoLine
(non-textured) Laser 0.980 0.039 6 4 10
Non
Significant
RoLine vs. RoLine (non-
textured) Reference 1 1 7 7 14 Reference
* sum = combined χ2 and t rank (arithmetic sum)

28
Table 4-2 t-Test results
t-Test: Paired Two Sample for Means
Triple Laser Mean Non-Textured Triple Laser Mean Textured
Mean 57.09 65.19
Variance 0.4483 4.1092
Observations 3 3
Pearson Correlation -0.091876289
Hypothesized Mean Difference 0
df 2
t Stat -6.399014622
P(T<=t) one-tail 0.011780942
t Critical one-tail 2.91998558
P(T<=t) two-tail 0.023561884
t Critical two-tail 4.30265273
t-Test: Paired Two Sample for Means
Triple Laser Mean Non-Textured RoLine Mean Non-Textured
Mean 57.09 57.93333333
Variance 0.4483 0.563333333
Observations 3 3
Pearson Correlation 0.918342347
Hypothesized Mean Difference 0
df 2
t Stat -4.906381934
P(T<=t) one-tail 0.019559819
t Critical one-tail 2.91998558
P(T<=t) two-tail 0.039119638
t Critical two-tail 4.30265273

29
t-Test: Paired Two Sample for Means
Triple Laser Mean Non-Textured RoLine Mean Textured
Mean 57.09 63.1
Variance 0.4483 0.7819
Observations 3 3
Pearson Correlation -0.999827434
Hypothesized Mean Difference 0
df 2
t Stat -6.699732629
P(T<=t) one-tail 0.010780284
t Critical one-tail 2.91998558
P(T<=t) two-tail 0.021560567
t Critical two-tail 4.30265273
t-Test: Paired Two Sample for Means
Triple Laser Mean Non-Textured Difference Triple Laser
Mean 57.09 8.1
Variance 0.4483 4.8069
Observations 3 3
Pearson Correlation -0.390335192
Hypothesized Mean Difference 0
df 2
t Stat 33.53801607
P(T<=t) one-tail 0.000443932
t Critical one-tail 2.91998558
P(T<=t) two-tail 0.000887864
t Critical two-tail 4.30265273

30
t-Test: Paired Two Sample for Means
Pre saw IRI
(inches/mile)
Post saw IRI
(Inches/mile)
Mean 48.249 47.030
Variance 634.133 622.624
Observations 8.000 8.000
Pearson Correlation 0.997
Hypothesized Mean Difference 0.000
df 7.000
t Stat 1.851
P(T<=t) one-tail 0.053
t Critical one-tail 1.895
P(T<=t) two-tail 0.107
t Critical two-tail 2.365
t-Test: Paired Two Sample for Means
Pre saw IRI
(inches/mile)
Post Joint Deployment
(inches/mile)
Mean 48.249 46.794
Variance 634.133 678.227
Observations 8.000 8.000
Pearson Correlation 0.997
Hypothesized Mean Diffe 0.000
df 7.000
t Stat 1.851
P(T<=t) one-tail 0.053
t Critical one-tail 1.895
P(T<=t) two-tail 0.107
t Critical two-tail 2.365

31
CHAPTER 5: CONCLUSIONS AND RECOMMENDATIONS
5.1 CONCLUSIONS
In response to current challenges particularly in an era of alternate bidding and in the wake of the
observation of anomalous laser induced roughness in certain longitudinal textures of in smoothness
measurement and texturing, this study has been performed.
A special texture study was performed on Interstate 35 In July 2013, in Duluth Minnesota. It created
adjacent textured and non-textured strips and measured IRI in the adjacent textured and non-textured
strips using a light weight profiler outfitted with the line laser and triple laser arranged in juxtaposition
in the line of the right wheels. It also measured friction, noise and texture geometries. Measurements
were performed as soon as the lightweight profiler could ride on the concrete and repeated as soon as
the joints were saw cut. The same measurements were repeated after the joints were saw cut.
The broom textured strips exhibited more negative orientation than the non-textured segments,
indicating that the broom imparted negative textures on the surface. The non-textured strip exhibited
texture isotropicity while the texture scan showed that the textured strip exhibited asperity alignment in
the longitudinal direction. The Broom texturing process appeared to have imparted a more negative
texture orientation (skewness) to the neutral orientation of the non-textured strip. Results showed a
difference of 10.75 in. per mile between the non-textured and the textured strips adjacent strips with
the triple point laser but 8 in. per mile with the line laser. The difference after saw cutting the joints was
typically less than one in. per mile but slightly higher in the textured sections. Subsequent IRI
measurements conducted after observable deployment of the joints indicated largely reduced
difference between textured and non-textured IRI. There was no significant difference in OBSI in two
measurements, but the third measurement appeared to follow known OBSI prediction models. Other
factors that reduce noise such as texture direction, asperity interval, and high temperature may not
have been preponderant over the low asperity interval of the broom drag that increases noise.
The derived friction numbers were clearly higher in the textured sections than the non-textured section.
Interestingly each adjacent pair of textured and non-textured strips exhibited correlated friction
numbers in each of the 6 sections. This indicated that the finishing process before texturing continued to
influence the micro texture even after the broom drag.
By observation, the IRI difference observed with the single laser during the 2002 testing (20 in. per mile)
with a single laser appears by a crude extrapolation to be valid considering that it was 5.7 in. per mile
with the RoLine and 10.75 in. per mile with the Triple laser. A value of 20 in. per mile with a single laser
would therefore not be unexpected.
The IRI difference between textured and non-textured strip decreased with sawing and subsequent
deployment of the joints from 10.75 to 7.5 in. per mile in the triple laser and from 5.7 to 6.4 in. per mile
in the RoLine after the joints were saw cut. After the deployment of joints, the differences became 6.27
and 3.36 in. per mile respectively. Measurements conducted after joint deployment showed a Triple

32
Laser – Roline IRI difference of 1 in. per mile and 2 in. per mile in the in the non-textured and textured
sections respectively. The RoLine may be more sensitive to joints as the entire line drops into the joint
and reports a very rough spot while the triple laser is more sensitive to texture effects but does not
completely accommodate or eliminate the effects thereof
There was no significant difference in pavement noise in terms of OBSI between textured and non-
textured strips. The friction numbers derived from the Dynamic Friction Tester indicated a correlation
between the non-textured and textured strip friction numbers in each of the six sections. This indicated
that the finishing process before texturing continued to influence the microtexture even after the
broom drag. This finding is limited to the texture types investigated. Therefore, extrapolation of these
results to other textures should be done with caution due to anomalous laser –induced IRI on certain
textures.
5.2 RECOMMENDATIONS
The effect of texturing and joints can therefore be minimized by measuring smoothness for acceptance
at least two weeks after paving particularly in systems like unbonded concrete overlay (UBOL) where
deployment is delayed by minimum restraint due to low interfacial friction. However adequate
accommodation for texture may be interpolated from the values obtained in this study.

33
REFERENCES
1. Swanlund, M. Enhancing Smooth Pavements. Public Roads, Vol. 64, No. 2, Sept.–Oct. 2000.
2. Smith, K. L., K. D. Smith, L. D. Evans, T. E. Hoerner, M. I. Darter, and J. H. Woodstrom. NCHRP Web
Document 1: Smoothness Specifications for Pavements. NCHRP Project 1-31 final report. TRB, National
Research Council, Washington, D.C., 1997. http://www.nap.edu/books/nch001/html/.
3. Snyder, M. B. Lessons Learned from MnROAD. Proc., 9th International Conference on Concrete
Pavements, International Society for Concrete Pavements, San Francisco, Calif., Aug. 17–21, 2008.
4. Izevbekhai, B. I. A Field Investigation of the Influence of Pavement Texture on Pavement Smoothness
Measurements. MnROAD Reports, Minnesota Department of Transportation, 2006.
http://www.mrr.dot.state.mn.us/research/pdf/2007mrrdoc009.pdf. Accessed July 3, 2012.
5. Wilde, W. J. Implementation of an International Roughness Index for MnDOT. Report MN/RC-2007-
09. Minnesota Department of Transportation, Saint Paul, 2007.
6. Wilde, W. J., and T. J. Nordstrom. MnDOT Combined Smoothness
Specification.http://www.lrrb.org/media/reports/201015.pdf. Accessed Oct. 13, 2012.
7. Izevbekhai, B. I., and E. Lukanen. Laser-Induced Roughness Index Anomalies in Longitudinal Box Car
Configurations. cchttp://www.mrr.dot.state.mn.us/research/pdf/2011MRRDOC008.pdf. Accessed Sept.
1, 2013.
8. Izevbekhai, B. I. Tire–Pavement Interaction Noise of Concrete Pavements. PhD dissertation. University
of Minnesota, Saint Paul, 2012.
9. Sayers, M. W. On the Calculation of International Roughness Index from Longitudinal Road Profile. In
Transportation Research Record 1501, TRB, National Research Council, Washington, D.C., 1995, pp. 1–
12.
10. Izevbekhai, B. I., and M. W. Watson. Evaluation of Concrete Texturing Practices in Minnesota.
Minnesota Department of Transportation, Saint Paul, June 2008.
http://www.lrrb.org/media/reports/200846.pdf. Accessed Oct. 12, 2013