Embed Size (px)
Citation preview
WAVES AND DETERMINANTS IN THE ACTIVITY OF MERGERS AND ACQUISITIONS: THE CASE OF LATIN AMERICA
Lina M. Cortés
Diego A. Agudelo Samuel Mongrut
No. 12‐22
2012

1
Waves and determinants in the activity of Mergers and Acquisitions:
The Case of Latin America
Lina M. Cortésa
Finance Department- School of Economics and Finance. Universidad EAFIT
Diego A. Agudelo
Finance Department- School of Economics and Finance. Universidad EAFIT
Samuel Mongrut
Instituto Tecnológico y de Estudios Superiores de Monterrey (ITESM), Campus Querétaro
Centro de Investigación de la Universidad del Pacifico (CIUP)
a Corresponding author Lina Marcela Cortes at: Carrera 49 7 Sur – 50. Medellín, Colombia. Tel.: (57) (4) – 2619500 ext. 9756. E-mail address: [email protected] (L. Cortés).

2
Waves and determinants in the activity of Mergers and Acquisitions:
The Case of Latin America
ABSTRACT
This paper contributes to the current literature of mergers and acquisitions (M&As) by studying the existence of waves and the determinants of M&A activity in the economies of Argentina, Brazil, Chile, Colombia, Mexico and Peru. From a sample of 2,490 M&As announcements reported by Thomson One for these countries, and applying the methodology proposed by Harford (2005), evidence of M&A waves is found for the periods 1993-2002 and 2003-2010 as reported for other regions in various international studies. After controlling for economic and business environment variables, as well as for profitability and book-to-market variables at industry level, we find evidence in favor of the neoclassical theory as a main explanation for M&As, but not for the misvaluation effect. For this purpose, a Prais-Winsten data model with panel corrected standard errors (PCSE) is used, and the results are confirmed through a negative binomial panel data estimation.
JEL classification:
C23, G34, K21
Keywords:
Mergers and Acquisitions
Mergers and Acquisitions Waves
Latin American Economics
PCSE
Counting Models

3
Highlights:
This study shows evidence consistent in favoring the neoclassical hypothesis as a fundamental motivation for carrying out operations of M&As, but not for an alternative hypothesis based on misvaluation.
Evidence has been provided of waves of M&A activity for the periods 1993-2002 and 2003-2010 seemingly contemporaneous with M&A waves reported for the markets of the United States, the United Kingdom, Europe and Asia.
Additionally, the activity of M&As in Latin American economies was found to be affected by macroeconomic, business environment and industry profitability variables, that in agreeing with the neoclassical hypothesis, indicate that the M&As correspond with a rational search for greater efficiency in industries and taking advantage of business opportunities.

4
1. Introduction
Two main hypotheses have been proposed to explain Mergers and Acquisitions (M&As). First, the neoclassical hypothesis explains M&As by fundamental reasons like the search for economies of scale, economies of vertical integration, combination of complementary resources, elimination of inefficiencies, industry consolidation, or profitable opportunities of growth (Brealey and Myers, 2003). Second, an alternative hypothesis explains M&As by three types of arguments: taking advantage of distortions on firm valuation (Harford, 2005), empire building (Jensen, 1986) or hubris on the part of the acquiring management (Roll, 1986). These hypotheses have been studied in international markets, but not in Latin America.
In this study we put to test the two competing hypothesis by modeling both the macroeconomic and industry-specific determinants of M&As in Latin America. Our sample includes 2,391 announcements of M&As in six Latin American countries: Argentina, Brazil, Chile, Colombia, México and Perú, in the period 1995 to 2010, taken from Thompson One. Following most of the literature, we employ a Prais-Winsten panel data with panel corrected standard errors (PCSE). Additionally we check the robustness of the results with a panel data negative binomial counting model, that allows for a more realistic modeling of the depending variable, number of M&As per year (Alba, Park & Wang, 2009; Hijzen, Görg & Manchin, 2008).
The models consistently show evidence supporting the neoclassical model as the fundamental motivation for M&A activity in Latin America. We found that macro economic variables like interest rate, GDP growth and unemployment, appear significant and with the predicted sign. That’s also true for business environment variables, like indexes of business freedom and tax freedom. Moreover, profitability measures at industry level also show a relationship with higher M&A deals. This holds on alternative specifications of the panel linear data, as well as in the alternative counting model.
We obtain further evidence of the neoclassical hypothesis driving M&A activity in Latin America. Consistent with the role of macro fundamental factors, we find that M&As in Latin America happen in waves. Using the methodology of Harford (2005) we find evidence of two M&A waves, the first between 1993-2002, and the second 2003-2010. Those are concurrent with waves of M&As in the United States, the United Kingdom, Europe and Asia (Martynova and Renneboog, 2008), suggesting that worldwide macroeconomic and business environment changes are a main driver of M&A activity in the region. Taken together, the results portray economic factors to be determinant of M&As in Latin America, supporting the neoclassical hypothesis.
In contrast, industry-specific variables that proxy for misvaluation, like the level and dispersion of the Book-to-market ratio, show almost no significance in alternative specifications. This observation fails to provide support for the misvaluation argument included in the alternative hypothesis.

5
The fact that the neoclassical hypothesis explains M&As in Latin America, but the alternative hypothesis does not, can be explained by looking at the literature of Corporate Governance on these markets. The presence of some of the Corporate Governance issues identified in Latin America, like cross property, different voting rights, and high property concentration on listed firms, prevents that M&As can be used as a mechanism of market discipline on poorly run companies (La Porta, Lopez-de-Silanes and Shleifer, 1999). In agreement with that, we note that none of the deals compiled in Thomson One for the six Latin American markets corresponds to a hostile takeover, and most of the deals were paid by cash.
The volume of announcements of mergers and acquisitions in Latin American economies has experienced a surge in the last 20 years. In the period between 1995 and 2010, M&A activity, measured as the number of announcements, grew by 67.4% while in Latin America grew by 198.8% . The search for new markets and the need to confront the challenges of a global market has motivated international companies, both from developed and LA countries, to expand in the region.
One advantage of focusing on Latin American M&As, is the variety of macroeconomic, business environment and industry specific variables, in a region with obvious similarities in legal origin, business culture, and governance issues across countries. Thus, Latin America offers an ideal setting to test for the drivers of M&As in panel data models. In addition, they present a structure of highly concentrated property (Benavides, 2005). These conditions can generate potentially different results between the markets already studied and the Latin American market.
This study is organized in the following manner: In the second section, literature regarding waves of M&As and the determinants of this activity are examined. In the third section, the hypothesis for verifying this study is put forward. In the fourth and fifth sections, the data and methodology employed are described, respectively. Finally, in the sixth section proofs are presented and results discussed. The work is concluded in the last section.
2. Background
Companies use M&As as part of the strategic plans to expand their operations, enter new markets and increase their competiveness in a globalised market (Brealey and Myers, 2003). Constituting a complex phenomenon in their motivation just as in their results, M&As have been studied from different perspectives. Some studies have principally focused on examining the economic and financial implications (Shleifer and Vishny, 1986; Shleifer and Vishny, 2003; Rossy and Volpin, 2004; Di Giovanni, 2005) managerial incentives of M&A deals (Roll, 1986; Jensen, 1986; Kosnik and Shapiro, 1997; Wang, Sakr, Ning and Davidson, 2010). Additionally, studies of events have tested the reaction of both the acquirer and the target price upon the announcement of the deals (Eckbo, 1983; Eckbo and Langohr, 1989; Bhagat, Dong, Hirshleifer and Noah, 2005). Alternatively, different authors have been

6
interested by the long term behavior of a company`s performance after an operation of M&As (Jensen and Ruback, 1983; Cosh and Guest, 2001; Bradley and Sundaram, 2004)
Studies of the determinants of M&As suggest that specific characteristics of both companies as well as macro variables of the target country are relevant to the decision (Andrade, Mitchell, and Stafford, 2001; Rossi and Volpin, 2004; Di Giovanni, 2005; Kamaly, 2007; Piñeiro, Chaitanya and Tamazian, 2008). Similarly, the levels of accounting regulation, protection of the investor’s rights and protection of the foreign investment increase the probability of M&As in given country (Pablo, 2009; Erel, Liao and Weisbach, 2010). Besides, factors such as distance and culture partially explain the distribution of M&A activity across countries (Angwin, 2001; Aybar and Ficici, 2009; Hattari and Rajan, 2010). Additionally, the literature identifies periods of high activity of M&As, in what is known as “waves of M&As” (Martynova and Renneboog, 2008).
Figure1.Waves of M&As for the United States between the period 1897-2002 (total number of deals).
Source: (Martynova & Renneboog, 2008)
In Figure 1, the periodicity in the evolution of the activity of M&As between 1897 to 2001 in the United States can be observed. The periods that have been identified as waves of M&As stand out. In their study, Golbe and White (1993) model the time-series behavior of M&As in United States between 1895 and 1989 using sinusoidal curve to approximate the wave-like pattern.
In this respect, the literature has been able to relate each episode of waves of M&As with economic, political and/or regulation changes, as well as with periods of overvaluation in the stock market. The first wave known as “Horizontal Integration”, occurred at the end of the 19th century, between the years 1897 and 1903 in the United States and coincided with a phase of economic expansion and the development of the Stock Exchange in New York (NYSE). The second wave, called “Vertical Integration”, came about in the United States in the period 1910 to 1929 related to the economic recovery after the First World War and changes to the anti-monopolies law in the United States. The third wave, “the Conglomeration

7
Era”, has been identified in the United States, the United Kingdom and Europe between 1950 and 1973 and arose with the economic recovery after the Second World War and new laws of promoting competition (anti-trust) in the United States. The fourth wave, the so-called “Industry Transformation”, reported in the United States, the United Kingdom, Europe and Asia in the period 1981 to 1989, began with the recovery from the 70’s recession and with the development of new financial tools. Finally, the fifth wave, known as “Megafusions”, came about in the United States, the United Kingdom, Europe and Asia between 1993 and 2001. This wave is contemporaneous with the boom in financial markets, and has been associated with breakthroughs in information technology, and the acceleration of processes of globalization, state deregulation and privatizations. (Davidson, 2003; Martynova and Renneboog, 2008).
Pioneering studies in Latin America regarding M&As are that of Fuenzalida, Mongrut, Nash, and Tapia (2006) that look to identify the existence of abnormal returns in the value of purchased companies (targets), on the public announcement of offers of acquisition in Latin American countries; Corredor, Pombo and Corredor (2009) that study the influence of corporate government indicators in the probability that M&As are carried out in Colombia; and Pablo (2009) that identifies the determinants of mergers and transnational acquisitions in Latin American countries. We don’t know of any study of M&As waves in Latin America.
Two main hypothesis have been proposed to explain the determinants of M&A activity. The neoclassical hypothesis suggests that the waves of M&As are a response to structural changes at industry level such as new regulations, changes in cost structure and technological innovations (industry shocks). Specifically, Gort (1969), Mitchell and Mulherin (1996) and Hartford (2005) argue that the shocks and structural changes in industries require the redistribution of assets to more productive uses, for example, in the form of M&As. In the same vein, a positive shock in the demand of an industry increases the cost of opportunity for an inefficient producer, in consequence, the assets will be relocalized in the search for greater productivity (Maksimovic and Phillips, 2001). In this respect Nelson (1959) finds that economic growth and the business cycle are related to the activity of M&As.
Finally, Harford (2005) presents evidence of M&As waves throughout the economy as a response to structural shocks that affect various industries at the same time, conditioned to the existence of sufficient liquidity to finance the deals.
Under the term “Alternative hypothesis” we include three alternative explanations to the neoclassical paradigm and efficient markets for M&A activity, namely: misvaluation, empire building and hubris. First, Shleifer and Vishny (2003) postulate that M&As are a consequence of rational management decisions taking advantage of irrational or erroneous valuations (misvaluations) on the market. In this context, the targets tend to be more undervalued than their acquirers. In this way, the market overvaluations could be linked to M&As waves, as argued by Rhodes-Kropf and Viswanathan (2004). As evidence to support this, the authors find a positive relation between the dispersion on the ratios of the companies in an industry ( p.e. the price-to-book ratio) and M&As waves. Supporting this explanation, Mueller, Gugler, and Weichselbaumer (2011) find that peaks in activity of M&As are limited

8
exclusively to companies listed on the stock exchange, and coincide with peaks of booms in the stock market, which can´t be explained by the neoclassical hypothesis
Second, M&As can be motivated by the benefits that management extract of running a larger firm, instead of sound fundamental reasons, in what is called “empire building” (Jensen, 1986; Martynova y and Renneboog, 2008). In this respect, Mueller (1969) argues that ill-monitored managers might embark in mergers and adquisictions for the sake of maximizing the company size, regardless of any value creation or destruction for the shareholders.
Third, Roll (1986) offers a theory in which management is irrational, and assumes incorrectly that its valuations are better than those of the market. In this case, activity of M&As is mainly triggered by personal motives associated with the hubris on the part of the acquiring management.
3. Hypothesis
The literature summarized above is the basis for the following hypothesis with respect to the activity of M&As in Latin American economies:
Hypothesis 1: In Latin American economies there is evidence of M&As waves, as in other regions of the world. Martynova and Renneboog (2008), compile studies regarding waves of M&As in the markets of the United States, the United Kingdom, Europe and Asia; in addition, the research of Mitchell and Mulherin (1996) and Harford (2005) document waves of M&As in the United States; and Mueller, Gugler, and Weichselbaumer (2011) for the United States, the United Kingdom and Europe. Inasmuch as M&As in Latin America are mostly explained by large scale structural changes and macroeconomic conditions, some of worldwide reach, we should expect M&A activity in the region to happen in waves.
Hypothesis 2: The M&A activity in Latin American countries is affected by macroeconomic and industry-specific factors.. Stigler (1950), Gort (1969), Mitchell and Mulherin (1996), Andrade, Mitchell, and Stafford (2001) and Harford (2005) find evidence of economic factors as an important motivation for M&As, as implied by the neoclassical hypothesis.
Hypothesis 3: The M&A activity in Latin American countries is affected by distortions in the valuation of the companies in stock markets. In the Alternative hypothesis, Rhodes-Kropf and Viswanathan (2004) and Rhodes-Kropf, Robinson, and Viswanathan,(2005) show the dispersion of firm market value with respect to their fundamental value as a determinant of M&A activity at industry-level. Additionally, Shleifer and Vishny (2003) present a model in which managers take advantage of misvaluations by means of M&As.

9
4. Data
The information concerning M&As announcements for six Latin American countries: Argentina, Brazil, Chile, Colombia, Mexico y Peru, from 1993 to 2010, obtained from the database Thomson One2. This database, provided by Thomson Financial’s Securities Data Company (SDC), contains information on the activity of M&As from countries around the world since 1985 and is referenced in the majority of works on M&As (p.e.: Rhodes-Kropf, Robinson, and Viswanathan, 2005; Harford, 2005 and Mueller Gugler and Weichselbaumer, 2011). Thomson One provide relevant details of the M&As, like the date of announcement, name of both the acquirer and the target, their SIC code (Standard Industry Classification), their home country, the percentage of participation looked for in the deal, method of payment and type of negotiation (hostile or friendly). As usual, from the sample are excluded leveraged buyouts (LBOs), spin-offs, recapitalizations, repurchases, and privatizations3. Excluded are industries strictly regulated and/or with special accounting, specifically financial services, utilities, education and health. Additionally, deals where the percentage of participation looked for by the bidder is less than 5% are discarded.
Financial and market information for individual companies is compiled from the Economática database, which includes most of the companies registered in the stock markets of the countries studied. From this database, we obtained consolidated financial statements in dollars, name of the company and industry classification for the period 1995 to 20104.
The macroeconomic variables and the business environment gradings, were taken from several sources: Bloomberg, World Bank, Political Risk Services Group and the Heritage Foundation. For the information regarding the regulation of the countries considered were consulted The Economist Intelligence Unit, and the regulatory agency in each country.
Applying the described selection criteria, we obtain a sample of 2,490 announcements of M&As, that correspond to 90% of the activity in total Latin America, reported by Thomson One. As detailed in Table 1, 43.5% of the deals took place in Brazil 15.1% in Argentina with 15.1%, 14.4% in Mexico, 11.0% in Chile , 8.4% in Colombia and finally 7.6% in Perú.
Table 1. Number of announcements of M&As in Latin American countries (1993-2010)
Source: own elaboration – Thomson One information
2 For the majority of industries in Colombia and Peru, the database contains of M&A deals starting only from 1993. 3Privatizations are excluded, since, despite sharing some determining factors with the processes of M&As, for being, in most part, an instrument of economic policy (Megginson, Nash, and Van Randerborgh, 1994; Megginson and Netter, 2001). 4 The difference in the periods taken for the identification of waves and determinants of activity is due to the lack of accounting data before 1995.
País 1993 1994 1995 1996 1997 1998 1999 2000 2001 2002 2003 2004 2005 2006 2007 2008 2009 2010 Total %
Argentina 5 9 18 21 44 48 26 39 12 11 6 11 13 20 28 18 17 31377 15.14%
Brazil 9 9 20 36 41 53 57 86 58 34 16 36 36 60 151 170 94 1171083 43.49%
Chile 2 12 8 5 17 10 30 17 18 9 5 19 9 10 25 19 22 37274 11.00%
Colombia 1 3 9 9 9 21 10 11 8 2 2 6 15 10 18 17 22 37 210 8.43%
Mexico 15 21 18 15 25 21 19 28 19 21 14 17 11 21 22 14 19 38358 14.38%
Peru 3 10 12 15 3 6 15 10 15 3 3 9 4 12 19 10 11 28188 7.55%
Total 35 64 85 101 139 159 157 191 130 80 46 98 88 133 263 248 185 288 2490100.00%

10
Starting from 1993, a growing tendency is observed in of the total number of M&As, interrupted in 2001. According to the report presented by the Economic Commission for Latin America and the Caribbean (CEPAL, 2002), the financial turbulence associated to the terrorist attacks on September 11, 2001 affected Latin American markets via the reduction in direct foreign investment flows from the United States and Europe. This added to the instability already generated by the regional financial crisis of Brazil in 1999 and that of Argentina in 2001, seems to have toned down the activity of M&As in the region. Since 2003 M&A activity in the region has steadily grown, sharply falling in 2009, in the aftermath of the financial and economic crisis of 2008. For 2010 the growth in announcements of M&As was 55.67%, recovering the levels of 2008 .
Table 2 reports the number of announcements of M&As depending on the procedence of the acquirer. In the period of study, 53% of the announcements correspond to national acquirers, 5.2% to acquirers came from the region, and the rest come from outside Latinamerica.
Table 2. Number of announcements of M&As for national and regional acquirers and for other countries
Source: own elaboration–Thomson One information
As presented in Table 3, 71.65% of all M&As announcements are between companies that operate in the same industry (focalization)6, while the rest correspond to interindustry deals, pursuing diversification or vertical integration. Finally, upon reviewing the method of payment it is found that for the M&As with available deal details, the principal method of payment is cash. Table 3 offers more details about the reported information.
Table 3. Number of announcements of M&As for strategy (focalization vs. interindustry) and method of
payment
Source: Own elaboration – Information Thomson One
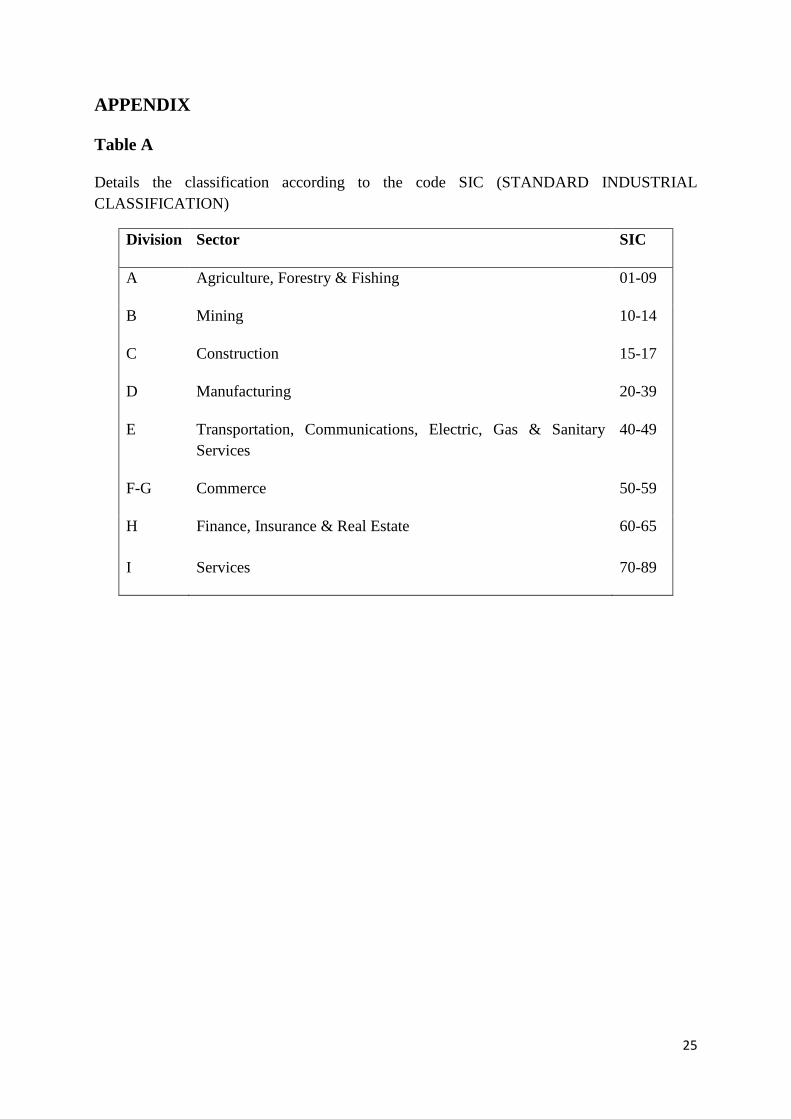
6We define as focalization the set of M&As between companies with the same first two digits of the SIC code, following Martynova and Renneboog (2006). Table A of the Appendix details the classification.
1993 1994 1995 1996 1997 1998 1999 2000 2001 2002 2003 2004 2005 2006 2007 2008 2009 2010 Total %
21 22 33 42 54 75 59 84 87 50 23 53 54 64 157 172 106 1631319 52.97%
Regional 1 7 6 5 4 6 8 9 1 3 2 4 3 9 18 12 9 22 129 5.18%
others 13 35 46 54 81 78 90 98 42 27 21 41 31 60 88 64 70 1031042 41.85%
35 64 85 101 139 159 157 191 130 80 46 98 88 133 263 248 185 288 2490100.00%
National
Transnational
Total
Acquiror type
M&A Type 1993 1994 1995 1996 1997 1998 1999 2000 2001 2002 2003 2004 2005 2006 2007 2008 2009 2010 Total %Focalización 23 37 62 70 102 115 109 126 92 55 34 73 71 99 198 187 132 1991784 71.65%
Diversification 12 27 23 31 37 44 48 65 38 25 12 25 17 34 65 61 53 89706 28.35%
Paid on cash 8 19 34 48 73 73 62 77 36 32 26 42 30 49 116 81 60 101967 38.84%
Paid on stocks 2 5 11 14 3 5 8 26 8 2 1 11 21 12 8 9 19 25 190 7.63%
Paid on stocks and cash 5 0 2 1 4 4 5 5 15 0 5 3 3 10 13 10 5 19 109 4.38%
not especified 20 40 38 38 59 77 82 83 71 46 14 42 34 62 126 148 101 1431224 49.16%
Total 35 64 85 101 139 159 157 191 130 80 46 98 88 133 263 248 185 288 2490 100.00%

11
5. Methodology
5.1 Identifiying waves of M&As
We begin testing for waves on M&A activity in Latin America following the methodology proposed by Harford (2005). As in that paper, given the decrease in activity between 2002 and 2003 (Figure 2), the sample is divided into two subperiods: 1993 to 2002 and 2003 to 2010. Starting from the M&As universe described above, the deals are grouped by country and economic sector in a quarterly basis. Then, each subperiod is divided into non-overlapping windows of two years. The methodology calls for identifying the window of two years with the greatest number of M&As, and testing through Simulation by Boostrapping. If that two-year window presents a statistically significant high number of deals compared with those of remaining two-year windows, a wave of M&As has been identified.
Figure 2. Announcements of M&As for countries in the period 1993-2010
Source: Own elaboration – Information Thomson One
5.2 Econometric model and description of variables
An unbalanced panel data model is used to tests for the determinants of M&A activity against economic environment, business environment and industry variables. We include as explanatory variables of the economic environment the interest rate (IR), the unemployment rate (UN), the GDP and the country risk (CR). The business environment variables are the business freedom index (BUS_FREE), the fiscal freedom index (FISCAL_FREE) and changes in the competition laws (REG). These two groups of variables allow to test the Neoclassical
0
20
40
60
80
100
120
140
160
180
Argentina Brazil Chile Colombia Mexico Peru
Núm
ero
de a
nunc
ios
1.993 1.994 1.995 1.996 1.997 1.998 1.999 2.000 2.001
2.002 2.003 2.004 2.005 2.006 2.007 2.008 2.009 2.010

12
Hypothesis (H2), following Stigler (1950), Gort (1969), Mitchell and Mulherin (1996), Rossy and Volpin (2004) and Pablo (2009). Finally, we include the following industry variables to test for some implications of the alternative hypothesis (H3): the return on assets (ROA) the Market-to-Book ratio (MTB) and Intra-industry standard deviation of the MTB. The definition, description and expected sign for each variable, is detailed in Table C of the Appendix. Additionally, to control for endogeneity, all explanatory variables are found lagging behind a period, following Harford (2005) and Kamaly (2007).
The dependent variable is calculated applying a logarithmic transformation on the number of announcements of M&As by industry-country-year, as follows:
���� = ln(1 + � �������&�)
Similar transformations have been employed by Di Giovanni (2005), Wang (2008) and Piñeiro, Chaitanya and Tamazian (2008), in studies of determinants of M&A activity.
The customary tests are performed to assure a proper specification. The Lagrange Multiplicator test by Breusch and Pagan discards a Pooled OLS in favor of Random Effects. In turn, the Hausman test rejects Random effects in favor of Fixed Effects. Finally, given that econometric proofs indicate the presence of autocorrelation and of heteroscedasticity, a Prais-Winsten model is estimated with Panel Corrected Standard Errors ( PCSE) with the following specification7:
���� = ��� + ���,���� � + ����
���� = ���,��� + !���
Where, t is the year , i represents industry, c indicates country, ���� is the measure of M&A activity, �′��,��� is the matrix of explanatory variables, ��� is the industry-country effect and
���� is the error. The model is estimated at industry-country level, at annual frequency, from 1995 to 2010, since most of the explanatory variables are only available beginning from 1995.
Country-industries with too few M&As were discarded using a Pareto analysis. Neither were included industries where accounting information was not available. The industries finally selected were metallic minerals, petroleum and natural gas, food, chemical products, machinery, transport equipment, commercial services and engineering and administration services, corresponding with the most dynamic industries of the economy in the Latin American countries.
7 Table B of the Appendix presents the matrix of correlations between the explanatory variables.

13
6. Results
6.1 Waves of M&As in Latin American economies
Table 4. Waves of M&As in the period 1993-2002 by economic sector.
*, ** and *** represent significance at 90%, 95% and 99% respectively
Upon applying the Hartford (2005) Methodology for the first half of the sample, 1993 to 2002, six of the eight sectors present waves of M&As, identified in the table as shady periods, concentrated mostly between 1997 to 2000, as presented in Table 4. The M&A waves can be linked to economic and regulatory changes in the region. In this period, Latin American companies faced increased conditions of global competition, as well as significant economic changes that transformed the region. Specifically, between 1986 and 1992 Latin American governments carried out a series of reforms in programs of economic liberalization and globalization, including adoption of policies of macroeconomic stability8, as well as privatization programs in economic sectors like public services, mining, finance, among others (Mustajo, 2000; Garcia, 2003). Along with privatizations, the regulation in those sectors was reformed with the aim of attracting foreign investors and improving the level of competition (Estache and Trujillo, 2004). For example, barriers were eliminated to the entry of foreign investment in the financial sector, motivating international banks to set up subsidiaries in the region by means of M&As (García and Gómez, 2009).
Table 5. Waves of M&As in the period 2003-2010
*, ** and *** represent significance to 90%, 95% and 99% respectively
For the second half of the sample, 2003 to 2010, four of the eight productive sectors present waves of M&As between 2007 and 2010, as reported in Table 5. According to the CEPAL (2005), starting from 2004 the recovery of the economies of Argentina, Brazil and Mexico
8As for example, the adoption of monetary policies like that of “inflation objective” used widely in Latin America in the last three decades.
1 2 3 4 51993-1994 1995-1996 1997-1998 1999-2000 2001-2002
Agriculture, Forestry & Fishing 3 2 2 5 4 0.495Commerce 10 10 26 25 13 0.207Construction 0 2 3 1 6 0.033**Finance, Insurance & Real Estate 19 34 71 56 45 0.023**Mining 9 21 12 12 10 0.057*Manufacturing 36 86 111 103 52 0.037**Services 8 11 36 64 28 <0.001***Transportation, Communications, Electric, Gas & Sanitary Services 14 20 37 82 52 0.026**
Sector M&A announcements per 2-year window
P-Value
1 2 3 42003-2004 2005-2006 2007-2008 2009-2010
Agriculture, Forestry & Fishing 2 1 10 13 0.105
Commerce 6 11 42 35 0.025**Construction 1 1 10 12 0.119Finance, Insurance & Real Estate 24 36 102 107 0.057*
Mining 23 27 54 73 0.028**
Manufacturing 40 64 118 112 0.124Services 16 35 126 63 0.002***Transportation, Communications, Electric, Gas & Sanitary Services 32 46 49 58 0.225
Sector M&A announcements per 2-year window
P-value

14
motivated the Foreign Direct Investment (FDI) activity in Latin-America. The growing trend was maintained until the end of 2008, when the financial crisis and the subsequent fu nding restrictions caused the M&A activity to taper off. However, since the fourth quarter of 2009 to 2010, an important recovery of M&A activity has been reported (Thomson Reuters, 2010). Furthermore, the greater part of the concentration of announcements is found in the window 2009-2010, which suggests the possibility that in the region a new wave of M&A activity was forming at the time.
In short, upon analyzing the activity of Latin American M&As in the sample from 1993 to 2010, we found evidence of waves in agreement with H1. They seem related with economics and regulatory changes in the region, such as reported in studies carried out in the United States, the United Kingdom, Europe and Asia. A formal test of those relations is provided below by the estimation of the panel data model
6.2 Determinants of M&As in Latin American economies
We run different specifications of the PCES Prais-Winsten model (1) to estimate the determinants of M&As in Latin America, the results of which are reported in Table 6. As mentioned above, the model includes macroeconomic and business environment variables, as well as industry specific variables to test both the neoclassical and the alternative hypothesis.
According to the results reported in column 1, the country economic and business environment seems to have an important impact on the activity of M&As. To begin with, a negative and significant coefficient of the interest rate (IR) can be interpreted as greater interest rates implying less M&A activity. This result coincides with Pablo (2009) who argues that lower rates of interest are signs of a better economic environment in the countries, and also with Harford (2005), who interprets it as a proxy of costs of transaction or funding.
For its part, the rate of unemployment (UN) presents a significant and negative relation with the M&A activity. In studies like those of Mitchell and Mulherin (1996) and Rau and Stouraitis (2009) the rate of unemployment is used as a proxy of economic stability in countries, hence this result suggests that a better economic environment makes more M&A deals possible. On the other hand, the coefficient of GDP presents a highly significant and negative coefficient with the activity of M&As, which have been supported in two ways. On one hand, Gort (1969), Brouthers and Brouthers (2000) and Neto, Brandão and Cerqueira (2010), indicate that a growth in demand can encourage the establishing of new businesses instead of carrying out M&As in a country. On the other hand, a weak economy might be favorable to the M&A deals searching consolidation inside an industry, looking for reducing costs and a more efficient use of resources (Gugler, Mueller, Yurtoglu and Zulehner, 2003).
In turn, the estimated coefficient of the the variable risk country (CR) resulted positive and highly significant. Given that a greater score signifies a lesser risk, the result agree with the

15
notion that a riskier country will have less activity in M&As, similar to that obtained in other studies that have used measures of political risk like Ragozzino (2009) or Bris, Cabolis and Janowski (2007).
To estimate the effect of the business environment in the activity of M&As, proxies the business freedom index (BUS_FREE) and the fiscal freedom index (FISCAL_FREE) are included in the model. With respect to BUS_FREE, the negative and highly significant coefficient suggests that a greater facility for creating and operating new businesses lessens the necessity for M&As, promoting greenfield investments. Regarding the second variable, FISCAL_FREE, the positive and highly significant coefficient indicates that low tax rates increase the activity of M&As, since high tax rates are disincentive for investments, especially FDI. A similar result was reported by Di Giovanni (2005) and Agostini and Jalile (2009). As an additional measure of the business environment the variable of regulatory changes in competition laws in the countries studied (REG). This is a dummy variable that takes the value 1 in the year of change in the law, 0 otherwise. In this respect, the positive and marginally significant coefficient reported, suggest that a regulatory improvement in competition increases the M&A activity. Stigler (1950) has already found similar results and in a more recent study and Bris, Cabolis and Janowski (2007) reported an increase in the activity of M&As after changes in the laws of competition for different countries of the world, including Argentina and Mexico. The authors argue that horizontal integrations are a form of incorporating efficiencies in industries with low level of concentration.
Finally, to determine the effect of the world financial crises of 2001 and 2009 in the activity of M&As, dummy variables are included (CRISIS1 Y CRISIS2) taking the value of 1 in the year of crisis, 0 otherwise. Although the reported negative effect of these variables was expected, it didn’t result statistically significant, probably captured by economic environment variables. The evidence presented until now indicates that the M&As in Latin America are determined by macroeconomic factors that condition their economic viability, in support of the neoclassical hypothesis.
Table 6. Determinants of M&As in Latin American economies

16
In the Table each coefficient is reported with its respective value-p between parenthesis. The dependent variable was calculated as ln[1+ number M&As]. *, ** and *** represent significance to 90%, 95% y 99% respectively.
In column 2 specific variables for industry are included. The first of these, return on assets (ROA), shows a positive and significant impact on the activity of M&As. This result suggest that upon considering an integration between companies, the operative efficiencies that can be incorporated after the integration are an important incentive, in agreement with the neoclassical hypothesis (H2). Harford (2005) obtained a similar result in his research for the United States, whereas Pablo (2009) reports a result statistically not significant for Latin America.
On the other hand, upon analyzing the Market to Book ratio (MTB) and the deviation intra-industry of the same variable (σ_MTB), a significant relation with the activity of M&As is not found, as reported in column 3. These two variables have been used in the literature to test for the misvaluation explanation (Rhodes-Kropf, Robinson, and Viswanathan, 2005 y Harford, 2005). Thus the results don’t support H3 in Latin American economies. Moreover, although the interest rate (IR) and the fiscal-free index (FISCAL_FREE) stop being significant in column (3), the rest of the economic and business environment variables maintain
(1) (2) (3) (4)
Dependent variable LMA
Macroeconomic environment variablesIR c,t-1 -0.0048 -0.0034 -0.0046
(0.037)** (0.170) (0.049)**
UN c,t-1 -0.0256 -0.0225 -0.0270
(0.031)** (0.094)* (0.031)**
GDP c,t-1 -0.0263 -0.0263 -0.0298
(<.0001)*** (0.001)*** (<.0001)***
CR c,t-1 0.0285 0.0266 0.0289
(<.0001)*** (<.0001)*** (<.0001)***
Business environment variablesBUS_FREE c,t-1 -0.0126 -0.0124 -0.0134
(<.0001)*** (<.0001)*** (<.0001)***
FISCAL_FREE c,t-1 0.0097 0.0075 0.0107
(0.046)** (0.173) (0.040)**
REG c,t-1 0.0899 0.0975 0.0857
(0.077)* (0.063)* (0.074)*
CRISIS1 t -0.1117 -0.1161
(0.161) (0.169)
CRISIS2 t -0.0675 -0.0815
(0.383) (0.366)
Industry specific variables ROA ic,t-1 0.5905 0.6011 0.2066
(0.065)* (0.070)* (0.007)***
MTB ic,t-1 -0.0004 -0.0002
(0.240) (0.445)
σ_MTB ic,t-1 0.0000 0.0000
(0.700) (0.872)R2 0.42 0.35 0.45 0.43Wald chi2 771.23 677.17 851.91 621.25Prob > chi2 <.0001 <.0001 <.0001 <.0001

17
qualitatively the same effect on M&A activity. Finally, in column 4, the coefficients of the base model excluding the non-significant variables are reported. Overall, this result suggests that the economic and business environment of the country, as well as the operative efficiency of the respective industry are important drivers of M&A activity in Latin America, whereas misvaluation effects are not.
5.1. Robustness tests
Next, two robustness tests are run. First, given that the present study finds a negative effect of the GDP on M&A activity, in contradiction with some previous studies (Di Giovanni, 2005 and Pablo, 2009), this effect is further explored employing interactive variables between GDP and country dummies. On the other hand, the model is run in two subsets: national and transnational M&As, depending on whether the acquirer and target share the same country. In Table 7 the findings are summarised.
In column 1 the results of the base model, already shown in column 3 of Table 6, are included. As can be observed in column 2, upon incorporating the interactive variables, the effect of the GDP variables per country keep the negative sign, however, this result is only significant for Argentina, Chile and Mexico, whereas the coefficients of the other variables result are still consistent with previous reports.
Column 3 corresponds to the results of the model for the subset of national M&As. The results indicate that only the interest rate, the business freedom index and the risk country are significant when it comes down to explaining variation in the national M&As. On the other hand, the results reported in column 4 belong to the base model run for the transnational M&As showing that all economic environment variables of the original model, except the interest rate, motivate the activity of this subset of M&As.
As shown by the results in Table 7, the coefficients of macro and industry determinants of the activity of M&As model turn out robust to the alternative specifications, supporting the neoclassical hypothesis (H2). On one hand, the negative effect of GDP over the activity of M&As is confirmed, for the sample countries, statistically significant for the half of them. On the other hand, the effect of most of the variables on the base model is maintained when the dependent variable is restricted either to national or transnational M&As
Table 7. Determinants of M&As in Latin American economies. Robustness tests.

18
In the Table each coefficient is reported with its respective value-p between parenthesis. The dependent variable was calculated as ln[1+ number M&As]. *, ** and *** represent significance to 90%, 95% and 99% respectively.
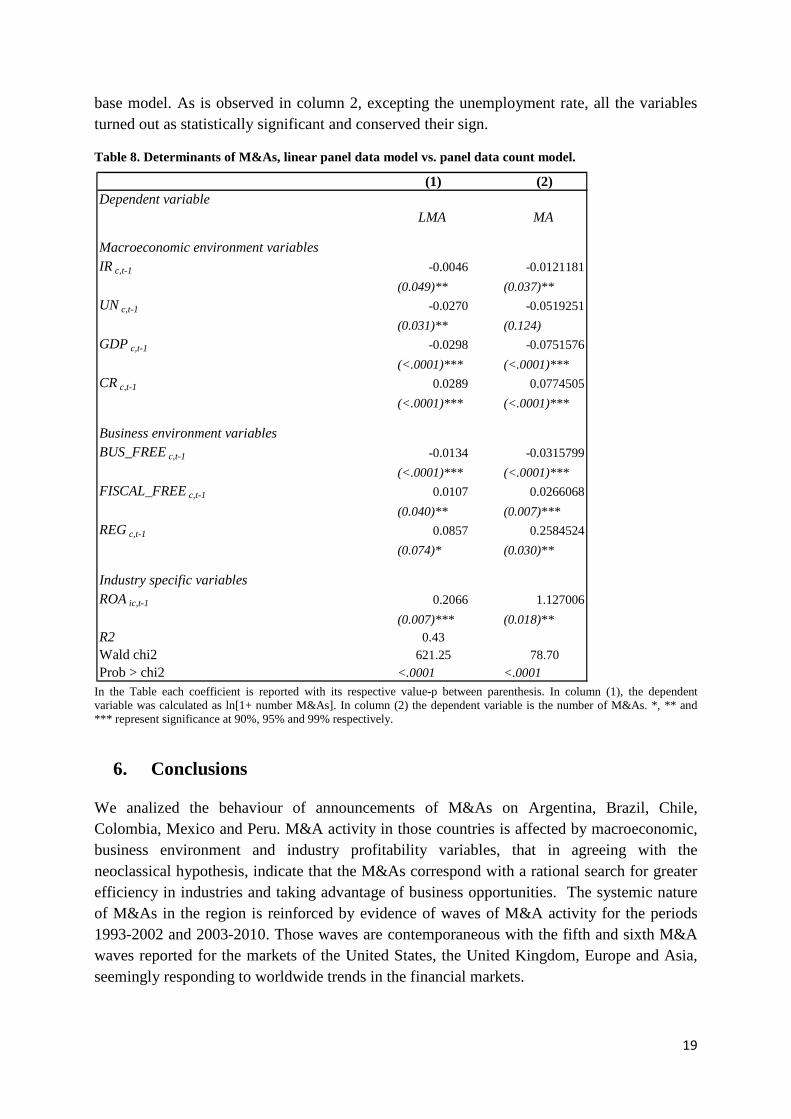
Due to the discreteness of the dependent variable, number of M&A deals by industry-country-year , we run a counting model as an additional robustness test for the determinants of M&As 9. The marginal effects of a negative binominal counting model for panel data are reported in column 2 of table 8. For convenience, column 1 reproduces the estimations of the
9The most common of them is the Poisson regression. However, the negative binomial regression is a more flexible alternative that doesn’t assume that the mean and the variance are the same (Cámeron and Trivedi, 2005). In fact, the Poisson model is found inadequate by the overdispersion-in-variance test. Instead, the negative binomial regression model generalizes the Poisson model by introducing an unobserved individual effect to the variance of the model: #(����|%����) = �%&(�′����) and '(�(����|%����) = �%&(�′����))1 +��%&(�′����)*.
(1) (2) (3) (4)Dependent variable LMA
Macroeconomic environment variablesIR c,t-1 -0.0046 -0.0042 -0.0032 -0.0023
(0.049)** (0.077)* (0.065)** (0.293)
UN c,t-1 -0.0270 -0.0298 0.0065 -0.0290
(0.031)** (0.023)** (0.461) (0.013)**
GDP c,t-1 -0.0298 -0.0082 -0.0270
(<.0001)*** (0.114) (<.0001)***
CR c,t-1 0.0289 0.0294 0.0183 0.0220
(<.0001)*** (<.0001)*** (0.001)*** (0.001)***
Business environment variablesBUS_FREE c,t-1 -0.0134 -0.0133 -0.0083 -0.0089
(<.0001)*** (<.0001)*** (<.0001)*** (0.001)**
FISCAL_FREE c,t-1 0.0107 0.0115 0.0027 0.0049
(0.040)** (0.032)** (0.532) (0.314)
REG c,t-1 0.0857 0.0701 0.0529 0.0425
(0.074)* (0.174) (0.164) (0.359)
Industry specific variables ROA ic,t-1 0.2066 0.1989 0.0153 0.2353
(0.007)*** (0.006)*** (0.744) (0.004)***
Interactive variablesGDP_ARG t-1 -0.0325
(0.002)***
GDP_BRA t-1 -0.0379
(0.188)
GDP_CHI t-1 -0.0478
(0.003)***
GDP_COL t-1 -0.0239
(0.195)
GDP_MEX t-1 -0.0301
(0.027)**
GDP_PER t-1 -0.0149
(0.282)R2 0.43 0.42 0.38 0.31Wald chi2 621.25 615.06 236.04 387.97Prob > chi2 <.0001 <.0001 <.0001 <.0001
19
base model. As is observed in column 2, excepting the unemployment rate, all the variables turned out as statistically significant and conserved their sign.
Table 8. Determinants of M&As, linear panel data model vs. panel data count model.
In the Table each coefficient is reported with its respective value-p between parenthesis. In column (1), the dependent variable was calculated as ln[1+ number M&As]. In column (2) the dependent variable is the number of M&As. *, ** and *** represent significance at 90%, 95% and 99% respectively.
6. Conclusions
We analized the behaviour of announcements of M&As on Argentina, Brazil, Chile, Colombia, Mexico and Peru. M&A activity in those countries is affected by macroeconomic, business environment and industry profitability variables, that in agreeing with the neoclassical hypothesis, indicate that the M&As correspond with a rational search for greater efficiency in industries and taking advantage of business opportunities. The systemic nature of M&As in the region is reinforced by evidence of waves of M&A activity for the periods 1993-2002 and 2003-2010. Those waves are contemporaneous with the fifth and sixth M&A waves reported for the markets of the United States, the United Kingdom, Europe and Asia, seemingly responding to worldwide trends in the financial markets.
(1) (2)Dependent variable
LMA MA
Macroeconomic environment variablesIR c,t-1 -0.0046 -0.0121181
(0.049)** (0.037)**
UN c,t-1 -0.0270 -0.0519251
(0.031)** (0.124)
GDP c,t-1 -0.0298 -0.0751576
(<.0001)*** (<.0001)***
CR c,t-1 0.0289 0.0774505
(<.0001)*** (<.0001)***
Business environment variablesBUS_FREE c,t-1 -0.0134 -0.0315799
(<.0001)*** (<.0001)***
FISCAL_FREE c,t-1 0.0107 0.0266068
(0.040)** (0.007)***
REG c,t-1 0.0857 0.2584524
(0.074)* (0.030)**
Industry specific variables ROA ic,t-1 0.2066 1.127006
(0.007)*** (0.018)**
R2 0.43Wald chi2 621.25 78.70Prob > chi2 <.0001 <.0001

20
Finally, no evidence was found to favor the alternative hypothesis as a complementary explanation in the activity of M&As in the studied countries. Specifically, upon examining the level of activity in relation to distortions in the valuation of companies in the stock markets, there were no significant statistical results. The absence of a misvaluation effect on the M&A activity appears consistent with the typical high ownership concentration detected in Latin America’s firms. This, along with other negative corporate governance features in the region, might be impeding the use of hostile takeovers as a way to impose market discipline in mismanaged companies (La Porta et al, 1999). Reinforcing this point, we note that none of the deals compiled in Thomson One for the six Latin American markets corresponds to a hostile takeover, and most of the deals were paid by cash.
Left for future studies are the analysis of the behavior of M&As in Latin America conditioned on the strategy of integration (horizontal, vertical or diversification), and the study of agency problems and corporative government associated to M&A deals, as well as the short and long term behavior of the performance of companies after M&As.
References
Alba, J. D., Park, D., y Wang, P. (2009, Febrero). Corporate governance and merger and acquisition foreign direct investment: firm-level evidence from japanese foreign direct investment into the US. (Asian Development Bank Economics Working Paper)
Agostini, C., Jalile, I., 2009. Efectos de los impuestos corporativos en la inversión extranjera en América Latina. Latin American Research Review 44, 84-108.
Andrade, G., Mitchell, M., Stafford, E., 2001. New evidence and perspectives on mergers. The Journal of Economic Perspectives 15, 103-120.
Angwin, D., 2001. Mergers and acquisitions across European borders: National perspectives on preacquisition due diligence and use of professional adviser. Journal of World Business, 32-57.
Aybar, B., & Ficini, A., 2009. Cross-border acquisitions and firm value: An analysis of emerging-market multinationals. Journal of International Business Studies 40, 1317-1338.
Benavides, J., 2005. Concentración de la propiedad y desempeño contable: El Caso Latinoamericano. Borradores de Economía y Finanzas 4, 1-35.
Bhagat, S., Dong, M., Hirshleifer, D., Noah, R., 2005. Do tender offers create value? New methods and evidence. Journal Financial Economics 76, 70–81.
Bradley, M., Sundaram, A., 2004. Do acquisitions drive performance or does performance drive acquisitions? SSRN Working Paper .
Brealey, R., Myers, S., 2003. Principles of Corporate Finance. Seventh Edition: McGraw-Hill.

21
Bris, A., Cabolis, C., Janowski, V., 2007. The effect of merger laws on merger activity: International evidence. Corporate Governance and Regulatory Impact on Mergers and Acquisitions: Research and Analysis on Activity Worldwide Since 1990, eds. GN Greg .
Brouthers, K., Brouthers, L., 2000. Acquisition or greenfield start-up? Institutional, cultural and transaction cost influences. Strategic Management Journal 21 , 89–97.
Cameron, A., Trivedi, P., 2005. Microeconometrics: Methods and applications. New York: Cambridge University Press.
CEPAL 2002. Estudio Económico de América Latina y el Caribe, 2001-2002 , 320.
Chatterjee, S., 1986. Types of synergy and economic value: The impact of acquisitions on merging and rival firms. Strategic Management Journal 7 , 119-139.
Corredor, S., Pombo, C., Corredor, A., 2009. Corporate mergers in a developing country: An empirical analysis of the merger probability. Working paper .
Cosh, A., Guest, P., 2001. The long run performance of hostile takeovers: UK evidence. Centre for Business Research Working Paper 215 .
Davidson, K. M., 2003. Megamergers: corporate America's billion-dollar takeovers. Washington, D.C.: Beard Books.
Di Giovanni, J., 2005. What drive capital flows? The case of cross-border M&A Activity and Financial Deeping. Journal of International Economics 65 , 127-149.
Eckbo, B., 1983. Horizontal mergers, collusion, and stockholder wealth. Journal financial Economics 11, 241–274.
Eckbo, B., Langohr, H., 1989. Information disclosure, method of payment, and takeover premiums: public and private tender offers in France. Journal Financial Economics, 363.
Erel, I., Liao, R., Weisbach, M., 2010. Determinants of cross-border mergers and acquisitions. Charles A. Dice Center Working Paper No. 2009-03-011; Fisher College of Business Working Paper No. 2009-03-11 , Available at SSRN: http://ssrn.com/abstract=1427408.
Estache, A., Trujillo, L., 2004. La privatización en América Latina en la década de los años 90. Revista Asturiana de Economía 31 , 69-91.
Fama, E., French, K., 1997. Industry costs of equity. Journal of Financial Economics 43 , 153-193.
Fuenzalida, D., Mongrut, S., Nash, M., Tapia, J., 2006. Tender offers in South America: are abnormal returns really high? Estudios Gerenciales 22 , 13-36.
García, A., Gómez, J., 2009. Determinantes de las fusiones y adquisiciones en el sistema financiero colombiano. 1990-2007. Borradores de Economía, 550 , 29.

22
Garcia, J., 2003. De la primera a la segunda generación de reformas del estado en América Latina; giro ideológico y cambio conceptual. Cuadernos de Economía 22, 95-125.
Golbe, D., White, L., 1993. Catch a wave: The time series behavior of mergers. Review of Economics and Statistics, 493-499.
Gort, M., 1969. An economic disturbance theory of mergers. Quarterly Journal of Economics 83, 623–642.
Harford, J., 2005. What drives merger waves? Journal of Financial Economics 77 , 561–603.
Hattari, R., Rajan, R., 2010. Cross-border mergers and acquisitions (M&As) in Developing Asia: The Role of Financial Variables. GMU School of Public Policy Research Paper No. 2010-17 , HKIMR Working Paper No. 36/2009. Available at SSRN: http://ssrn.com/abstract=1628014.
Hijzen, A., Görg, H., & Manchin, M. (2008). Cross-border mergers and acquisitions and the role of trade costs. European Economic Review, 52(5), 849-866.
Jensen, M., 1986. Agency costs of free cash flow, corporate finance and takeovers. American Economic Review 76 , 323–329.
Jensen, M., Ruback, R., 1983. The market for corporate control: the scientific evidence. Journal of Finanancial Economics 11 , 5–50.
Kamaly, A., 2007. Trends and determinants of mergers and acquisitions in developing countries in the 1990s. International Research Journal of Finance and Economics 8 , 16-30.
Kogut, B., Singh, H., 1988. The effect of national culture on the choice of entry mode. Journal of International Bussines Studies 19, 411-432.
Kosnik, R., Shapiro, D., 1997. Agency conflicts between investment banks and corporateclients in merger and acquisition transactions: causes and remedies. Academy Management Executive 11, 7-20.
La Porta, R., Lopez-de-Silanes, F., Shleifer, A., 1998. Law and Finance. Journal of Political Economy 106, 1113–1155.
Maksimovic, V., Phillips, G., 2001. The market for corporate assets: who engages in mergers and asset sales and are there efficiency gains? The Journal of Finance 56, 2019–2065.
Martynova, M., Renneboog, L., 2008. A century of corporate takeovers: What have we learned and where do we stand? Journal of Banking & Finance 32, 2148–2177.
Martynova, M., Renneboog, L., 2006. Mergers and acquisitions in Europe. ECGI - Finance Working Paper No. 114/2006; Center Discussion Paper Series No. 2006-06. Available at SSRN: http://ssrn.com/abstract=880379 .

23
Megginson, W., Netter, J., 2001. From the State to Market: A Survey of Empirical Studies on Privatization. Journal of Economic Literature 39, 321-389.
Megginson, W., Nash, R., Van Randerborgh, M., 1994. The Financial and Operating Performance of Newly Privatized Firms: An International Analysis. The Journal of Finance 49, 403-452.
Mitchell, M., Mulherin, J., 1996. The impact of industry shocks on takeover and restructuring activity. Journal of Financial Economics 41, 193–229.
Mueller, D., Sirower, M., 2003a. The causes of mergers: Tests based on the gains to acquiring firms' shareholders and the size of premia. Managerial and decision Economics 24, 373-391.
Mueller, D., Gugler, K., Weichselbaumer, M., 2011. The determinants of merger waves: An international perspective. In Press, Corrected Proof, Available online .
Mueller, D., Gugler, K., Yurtoglu, B., Zulehner, C., 2003b. The effects of mergers: an international comparison. International Journal of Industrial Organization 21, 625–653.
Mustajo, R., 2000. Gasto social y distribución del ingreso: caracterización e impacto redistributivo en paises seleccionados de América Latina y el Caribe. Serie Reformas Económicas. CEPAL 69 , 58.
Nelson, R., 1959. Merger Movements in American Industry, 1895–1954. Princeton: Princeton University Press.
Neto, P., Brandão, A., Melo, A., 2010. The macroeconomic determinants of cross-border mergers and acquisitions and greenfield investments. The IUP Journal of Business Strategy VII, 21-57.
Pablo, E., 2009. Determinants of cross-border M&As in Latin America. Journal of Business Research 62, 861–867.
Piñeiro, J., Chaitany, K., Tamazia, A., 2008. Does growth & quality of capital markets drive foreign capital? The case of cross-border mergers & acquisitions from leading emerging economies. William Davidson Institute Working Paper Number 911, 1-26.
Ragozzino, R., 2009. The effects of geographic distance on the foreign acquisition activity of U.S. firms. Management International Review 49, 509-535.
Rhodes-Kropf, M., Viswanathan, S., 2004. Market valuation and merger waves. Journal of Finance 59, 2685-2718.
Rhodes-Kropf, M., Robinson, D., Viswanathan, S., 2005. Valuation waves and merger activity: The empirical evidence. Journal of Financial Economics 77, 561-603.
Roll, R., 1986. The hubris hypothesis of corporate takeovers. Journal of Bussines 59, 197-216.
24
Rossy, S., Volpin, P., 2004. Cross-country determinants of mergers and acquisitions. Journal of Financial Economics 74, 277–304.
Seth, A., Song, K., Pettit, R., 2002. Value creation and destruction in cross-border acquisitions: an empirical analysis of foreign acquisitions of U.S. firms. Strategic Management Journal 23, 921–940.
Shleife, A., Vishny, R., 1986. Large shareholders and corporate control. Journal of Political Economy 94, 461-488.
Shleifer, A., Vishny, R., 2003. Stock market driven acquisitions. Journal of Financial Economics 70, 295-311.
Stigler, G., 1950. Monopoly and oligopoly power by merger. American Economic Review 40, 23-34.
Thomson Reuters. (10 de 02 de 2010). Recuperado el 15 de 07 de 2011, de http://lta.reuters.com/article/businessNews/idLTASIE61914820100210
Town, R., 1992. Merger Waves and the estructure of merger and acquisition time-series. Journal of Applied Econometrics 7, S83-S100.
Wang, J., 2008. The macro determinants of M&A timing in China. International Journal of Business and Management, 141-146.
25
APPENDIX
Table A
Details the classification according to the code SIC (STANDARD INDUSTRIAL CLASSIFICATION)
Division Sector SIC
A Agriculture, Forestry & Fishing 01-09
B Mining 10-14
C Construction 15-17
D Manufacturing 20-39
E Transportation, Communications, Electric, Gas & Sanitary Services
40-49
F-G Commerce 50-59
H Finance, Insurance & Real Estate 60-65
I Services 70-89

26
Table B
Matrix of correlations between the explanatory variables
Own elaboration
IR c,t-1 UN c,t-1 GDP c,t-1 CR c,t-1 BUS_FREE c,t-1FISCAL_FREEROA ic,t-1 MTB ic,t-1 σ_MTB ic,t-1
IR c,t-1 1.0000
UN c,t-1 0.0541 1.0000
GDP c,t-1 -0.1112 -0.2788 1.0000
CR c,t-1 -0.4277 -0.4877 -0.4241 1.0000
BUS_FREE c,t-1 -0.2527 0.3082 -0.1028 0.2645 1.0000
FISCAL_FREE c,t-1 0.1983 0.1672 0.0016 -0.0711 0.2328 1.0000
ROA ic,t-1 -0.0128 -0.0797 0.1123 0.0778 -0.0664 0.0647 1.0000
MTB ic,t-1 0.0512 0.0145 -0.0238 -0.0670 -0.0141 0.0584 -0.0201 1.0000
σ_MTB ic,t-1 0.0446 0.0278 -0.0329 -0.1084 -0.0229 0.1062 -0.0189 0.3679 1.0000
Correlations

27
Table C
Definition, description and expected sign for each variable Variable Description Source Expected sign
Dependent
+�����
Natural logarithm of 1 plus the number of M&As at the industry-country level and per year
ln(1 + �����)
Thomson One, own calculations
N/A
Explanatory
,-�,��� Prime Rate of each country per year Bloomberg
(-)
Harford, (2005), Pablo, (2009)
./�,��� Unemployment rate of each country per year World Bank
(-)
Mitchell & Mulherin, (1996)
012�,��� Growth rate of GDP of each country per year Bloomberg
(?)
Gort (1969), Brouthers & Brouthers (2000) Neto, Brandão & Cerqueira (2010) Pablo (2009)
3.4_6-##�,���
Is a quantitative measure that represents the level of procedures required to start, operate, and close a business. The freedom score for each country and year is a number between 0 and 100, where 100 equals the free enterprise environment
The Heritage Foundation
(-)
6,47�+_6-##�,���
Is a measure of the tax burden regulated by the government in the countries. The freedom score for each country per year is a number between 0 and 100, with 100 equaling the environment of lower tax burden.
The Heritage Foundation
(+)
Di Giovanni, (2005) Agostini & Jalile (2009).
Continue

28
Continuation Table C Variable Description Source Expected sign
Explanatory
�83��,���
Market to Book Ratio measured at the industry-country level and per year. Calculated as an average per industry.
Economática, own calculations
(+)
Rhodes-Kropf, Robinson, & Viswanathan (2005) Harford (2005)
9_�83��,���
Desviation of the Market to Book Ratio in Intra-Industry Books per country and per year.
Economática, own calculations
(+)
Rhodes-Kropf, Robinson, & Viswanathan (2005) Harford (2005)
7-,4,41�
Dummy variable that takes the value of 1 for the crisis of 2001, and the value of 0 otherwise
N/A (-)
7-,4,42�
Dummy variable that takes the value of 1 for the crisis of 2009, and the value of 0 otherwise.
N/A (-)
-#0�,���
Dummy variable that has a value of 1 if there were improvements in competition laws in each country, and the value of 0 otherwise
The Economist Intelligence Unit
(+)
Stigler (1950) Bris, Cabolis and Janowski (2007)
7-�,���
Is the Composite Risk Rating as a measure of country risk. The score for each country and year is a number between 0 and 100, where 100 equals the lower risk environment.
Political Risk Services Group
(+)
(Ragozzino, 2009) Bris, Cabolis and Janowski (2007)
-;���,���
Return on Assets measured at the industry-country level and per year. Calculated as an average per industry
Economática, own calculations
(+)
Harford (2005) Pablo (2009)
Own elaboration