Embed Size (px)
Citation preview
February 10, 2011
Portfolio Strategy Limits of Leverage
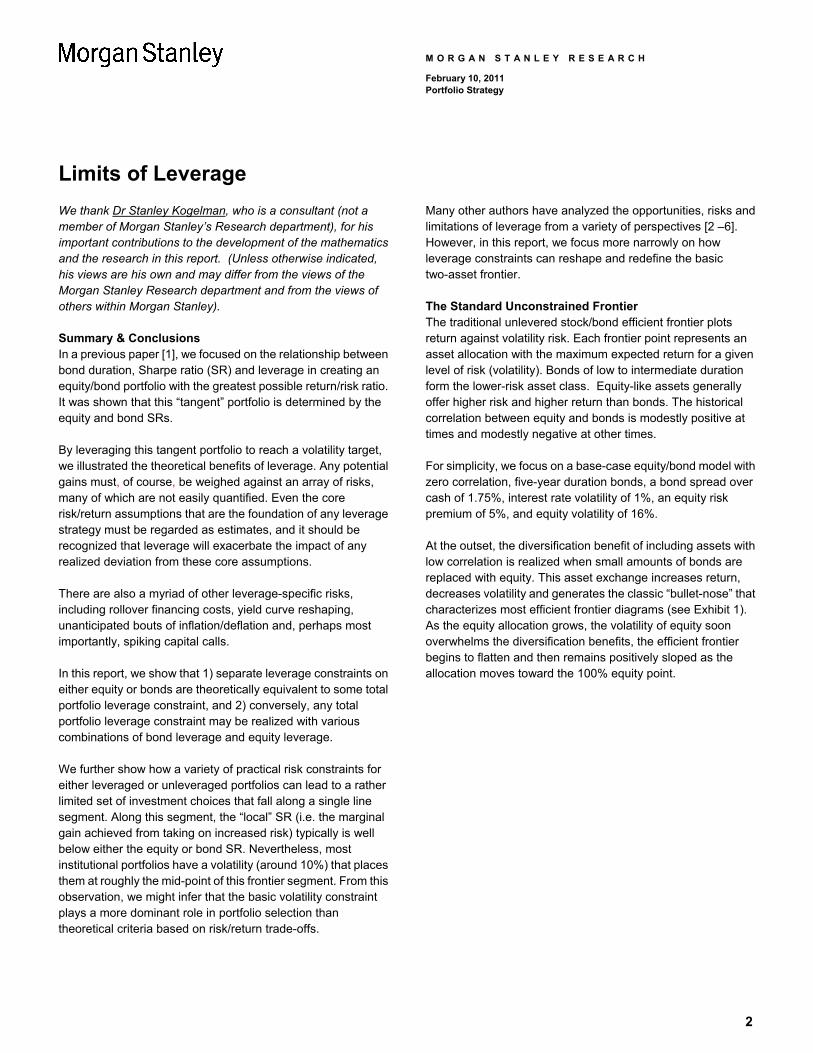
Leverage can significantly expand the range of portfolio choices. However, in practice, multiple constraints exist that limit the use of leverage, the nature of the assets that can be leveraged, and the acceptable levels of total portfolio and asset-specific risks.
Such constraints may force the available efficient frontier to shrink to a surprisingly narrow set of portfolios — ones that fall along a single, modestly sloped line located in the middle of the risk/return space.
Any form of leverage is also subject to a number of special concerns: vulnerability to changing financing costs, unanticipated capital calls, illiquidity spirals, etc.
On the one hand, the perceived advantages of leverage can induce a temptation for excessive risk-taking. On the other hand, one must be sensitive to the fact that pragmatic issues and cautionary concerns may keep many funds from even considering the use of leverage. In all cases, it can be enlightening — even for funds that are currently prohibited from using leverage — to envision how other investors that do use leverage can influence the common investment landscape.
Recent Reports
Title Date
Portfolio Strategy: Slow Rebalancing: A 50-Year History
Jan 19, 2011
Martin Leibowitz / Anthony Bova
Portfolio Strategy: Beta Convexity in Long/Short Funds
Nov 29, 2010
Martin Leibowitz / Anthony Bova
Portfolio Strategy: Beta Convexity Oct 18, 2010Martin Leibowitz / Anthony Bova
Portfolio Strategy: Beta-Range Rebalancing Aug 31, 2010Martin Leibowitz / Anthony Bova
Portfolio Strategy: Reversals, Trends and “Slow Rebalancing”
Jul 29, 2010
Martin Leibowitz / Anthony Bova
Portfolio Strategy: “Slow Rebalancing” Jul 9, 2010Martin Leibowitz / Anthony Bova
Portfolio Strategy: Portfolio-Level Leverage Jun 17, 2010Martin Leibowitz / Anthony Bova
Portfolio Strategy: Beta Rebalancing in the Short-Term
May 11, 2010
Martin Leibowitz / Anthony Bova
Portfolio Strategy: Policy Portfolios and Rebalancing Behavior
Mar 3, 2010
Martin Leibowitz / Anthony Bova
Portfolio Strategy: Illiquidity Surges, Capital Calls and “Bargain Scenarios”
Feb 16, 2010
Martin Leibowitz / Anthony Bova
Morgan Stanley does and seeks to do business with companies covered in Morgan Stanley Research. As a result, investors should be aware that the firm may have a conflict of interest that could affect the objectivity of Morgan Stanley Research. Investors should consider Morgan Stanley Research as only a single factor in making their investment decision.
For analyst certification and other important disclosures, refer to the Disclosure Section, located at the end of this report.
M O R G A N S T A N L E Y R E S E A R C H
N O R T H A M E R I C A
Morgan Stanley & Co. Incorporated Martin Leibowitz
[email protected] +1 212 761 7597
Anthony Bova [email protected] +1 212 761 3781
2
M O R G A N S T A N L E Y R E S E A R C H
February 10, 2011 Portfolio Strategy
Limits of Leverage
We thank Dr Stanley Kogelman, who is a consultant (not a member of Morgan Stanley’s Research department), for his important contributions to the development of the mathematics and the research in this report. (Unless otherwise indicated, his views are his own and may differ from the views of the Morgan Stanley Research department and from the views of others within Morgan Stanley).
Summary & Conclusions In a previous paper [1], we focused on the relationship between bond duration, Sharpe ratio (SR) and leverage in creating an equity/bond portfolio with the greatest possible return/risk ratio. It was shown that this “tangent” portfolio is determined by the equity and bond SRs.
By leveraging this tangent portfolio to reach a volatility target, we illustrated the theoretical benefits of leverage. Any potential gains must, of course, be weighed against an array of risks, many of which are not easily quantified. Even the core risk/return assumptions that are the foundation of any leverage strategy must be regarded as estimates, and it should be recognized that leverage will exacerbate the impact of any realized deviation from these core assumptions.
There are also a myriad of other leverage-specific risks, including rollover financing costs, yield curve reshaping, unanticipated bouts of inflation/deflation and, perhaps most importantly, spiking capital calls.
In this report, we show that 1) separate leverage constraints on either equity or bonds are theoretically equivalent to some total portfolio leverage constraint, and 2) conversely, any total portfolio leverage constraint may be realized with various combinations of bond leverage and equity leverage.
We further show how a variety of practical risk constraints for either leveraged or unleveraged portfolios can lead to a rather limited set of investment choices that fall along a single line segment. Along this segment, the “local” SR (i.e. the marginal gain achieved from taking on increased risk) typically is well below either the equity or bond SR. Nevertheless, most institutional portfolios have a volatility (around 10%) that places them at roughly the mid-point of this frontier segment. From this observation, we might infer that the basic volatility constraint plays a more dominant role in portfolio selection than theoretical criteria based on risk/return trade-offs.
Many other authors have analyzed the opportunities, risks and limitations of leverage from a variety of perspectives [2 –6]. However, in this report, we focus more narrowly on how leverage constraints can reshape and redefine the basic two-asset frontier.
The Standard Unconstrained Frontier The traditional unlevered stock/bond efficient frontier plots return against volatility risk. Each frontier point represents an asset allocation with the maximum expected return for a given level of risk (volatility). Bonds of low to intermediate duration form the lower-risk asset class. Equity-like assets generally offer higher risk and higher return than bonds. The historical correlation between equity and bonds is modestly positive at times and modestly negative at other times.
For simplicity, we focus on a base-case equity/bond model with zero correlation, five-year duration bonds, a bond spread over cash of 1.75%, interest rate volatility of 1%, an equity risk premium of 5%, and equity volatility of 16%.
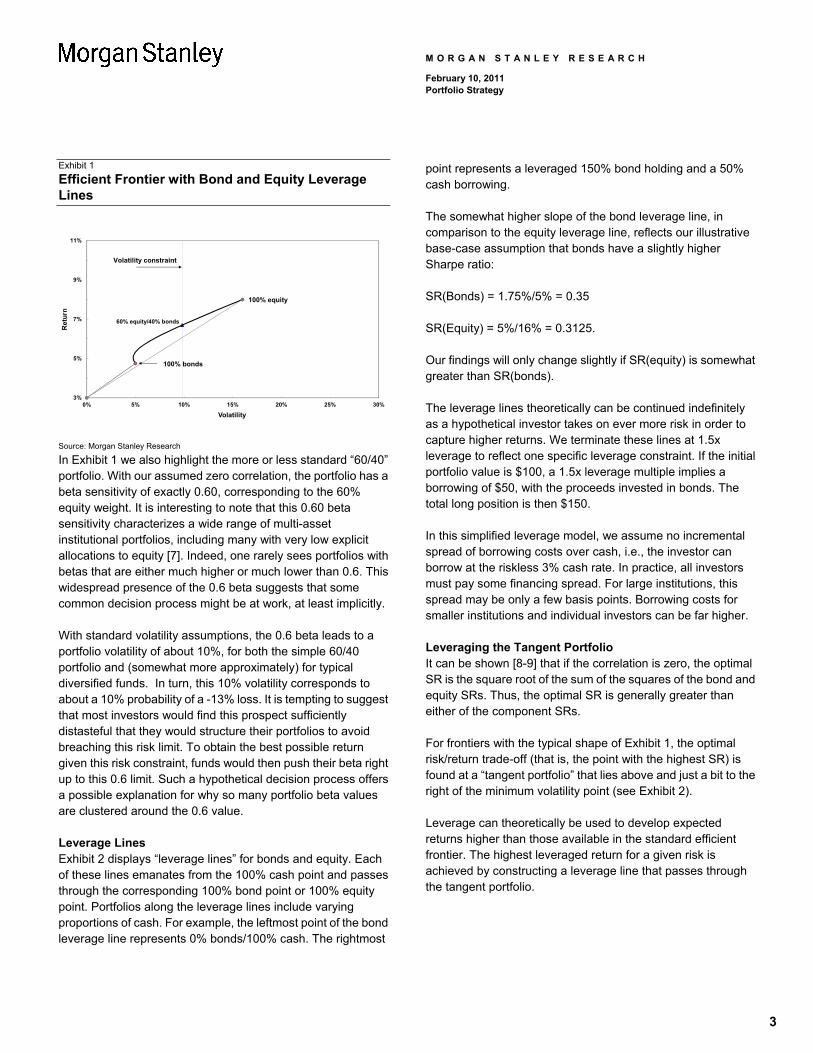
At the outset, the diversification benefit of including assets with low correlation is realized when small amounts of bonds are replaced with equity. This asset exchange increases return, decreases volatility and generates the classic “bullet-nose” that characterizes most efficient frontier diagrams (see Exhibit 1). As the equity allocation grows, the volatility of equity soon overwhelms the diversification benefits, the efficient frontier begins to flatten and then remains positively sloped as the allocation moves toward the 100% equity point.
3
M O R G A N S T A N L E Y R E S E A R C H
February 10, 2011 Portfolio Strategy
Exhibit 1
Efficient Frontier with Bond and Equity Leverage Lines
3%
5%
7%
9%
11%
0% 5% 10% 15% 20% 25% 30%
Ret
urn
Volatility
Volatility constraint
100% bonds
100% equity
60% equity/40% bonds
Source: Morgan Stanley Research
In Exhibit 1 we also highlight the more or less standard “60/40” portfolio. With our assumed zero correlation, the portfolio has a beta sensitivity of exactly 0.60, corresponding to the 60% equity weight. It is interesting to note that this 0.60 beta sensitivity characterizes a wide range of multi-asset institutional portfolios, including many with very low explicit allocations to equity [7]. Indeed, one rarely sees portfolios with betas that are either much higher or much lower than 0.6. This widespread presence of the 0.6 beta suggests that some common decision process might be at work, at least implicitly.
With standard volatility assumptions, the 0.6 beta leads to a portfolio volatility of about 10%, for both the simple 60/40 portfolio and (somewhat more approximately) for typical diversified funds. In turn, this 10% volatility corresponds to about a 10% probability of a -13% loss. It is tempting to suggest that most investors would find this prospect sufficiently distasteful that they would structure their portfolios to avoid breaching this risk limit. To obtain the best possible return given this risk constraint, funds would then push their beta right up to this 0.6 limit. Such a hypothetical decision process offers a possible explanation for why so many portfolio beta values are clustered around the 0.6 value.
Leverage Lines Exhibit 2 displays “leverage lines” for bonds and equity. Each of these lines emanates from the 100% cash point and passes through the corresponding 100% bond point or 100% equity point. Portfolios along the leverage lines include varying proportions of cash. For example, the leftmost point of the bond leverage line represents 0% bonds/100% cash. The rightmost
point represents a leveraged 150% bond holding and a 50% cash borrowing.
The somewhat higher slope of the bond leverage line, in comparison to the equity leverage line, reflects our illustrative base-case assumption that bonds have a slightly higher Sharpe ratio:
SR(Bonds) = 1.75%/5% = 0.35
SR(Equity) = 5%/16% = 0.3125.
Our findings will only change slightly if SR(equity) is somewhat greater than SR(bonds).
The leverage lines theoretically can be continued indefinitely as a hypothetical investor takes on ever more risk in order to capture higher returns. We terminate these lines at 1.5x leverage to reflect one specific leverage constraint. If the initial portfolio value is $100, a 1.5x leverage multiple implies a borrowing of $50, with the proceeds invested in bonds. The total long position is then $150.
In this simplified leverage model, we assume no incremental spread of borrowing costs over cash, i.e., the investor can borrow at the riskless 3% cash rate. In practice, all investors must pay some financing spread. For large institutions, this spread may be only a few basis points. Borrowing costs for smaller institutions and individual investors can be far higher.
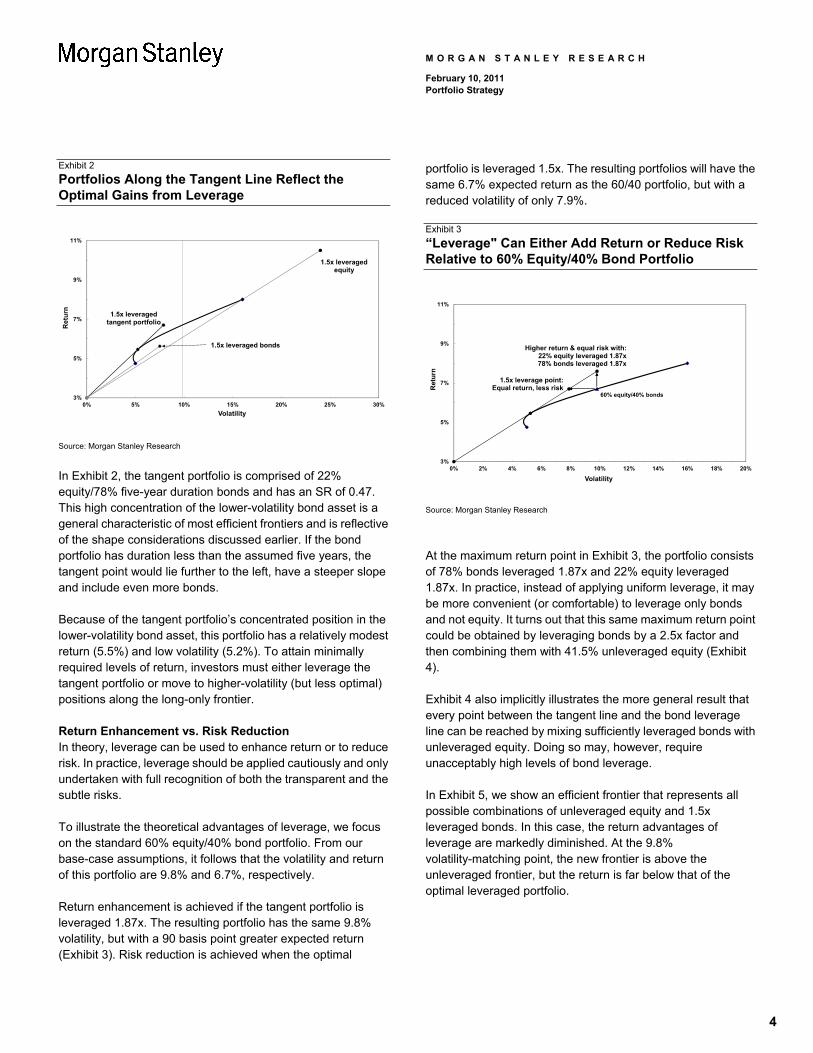
Leveraging the Tangent Portfolio It can be shown [8-9] that if the correlation is zero, the optimal SR is the square root of the sum of the squares of the bond and equity SRs. Thus, the optimal SR is generally greater than either of the component SRs.
For frontiers with the typical shape of Exhibit 1, the optimal risk/return trade-off (that is, the point with the highest SR) is found at a “tangent portfolio” that lies above and just a bit to the right of the minimum volatility point (see Exhibit 2).
Leverage can theoretically be used to develop expected returns higher than those available in the standard efficient frontier. The highest leveraged return for a given risk is achieved by constructing a leverage line that passes through the tangent portfolio.
4
M O R G A N S T A N L E Y R E S E A R C H
February 10, 2011 Portfolio Strategy
Exhibit 2
Portfolios Along the Tangent Line Reflect the Optimal Gains from Leverage
3%
5%
7%
9%
11%
0% 5% 10% 15% 20% 25% 30%
Ret
urn
Volatility
1.5x leveraged bonds
1.5x leveraged tangent portfolio
1.5x leveraged equity
Source: Morgan Stanley Research
In Exhibit 2, the tangent portfolio is comprised of 22% equity/78% five-year duration bonds and has an SR of 0.47. This high concentration of the lower-volatility bond asset is a general characteristic of most efficient frontiers and is reflective of the shape considerations discussed earlier. If the bond portfolio has duration less than the assumed five years, the tangent point would lie further to the left, have a steeper slope and include even more bonds.
Because of the tangent portfolio’s concentrated position in the lower-volatility bond asset, this portfolio has a relatively modest return (5.5%) and low volatility (5.2%). To attain minimally required levels of return, investors must either leverage the tangent portfolio or move to higher-volatility (but less optimal) positions along the long-only frontier.
Return Enhancement vs. Risk Reduction In theory, leverage can be used to enhance return or to reduce risk. In practice, leverage should be applied cautiously and only undertaken with full recognition of both the transparent and the subtle risks.
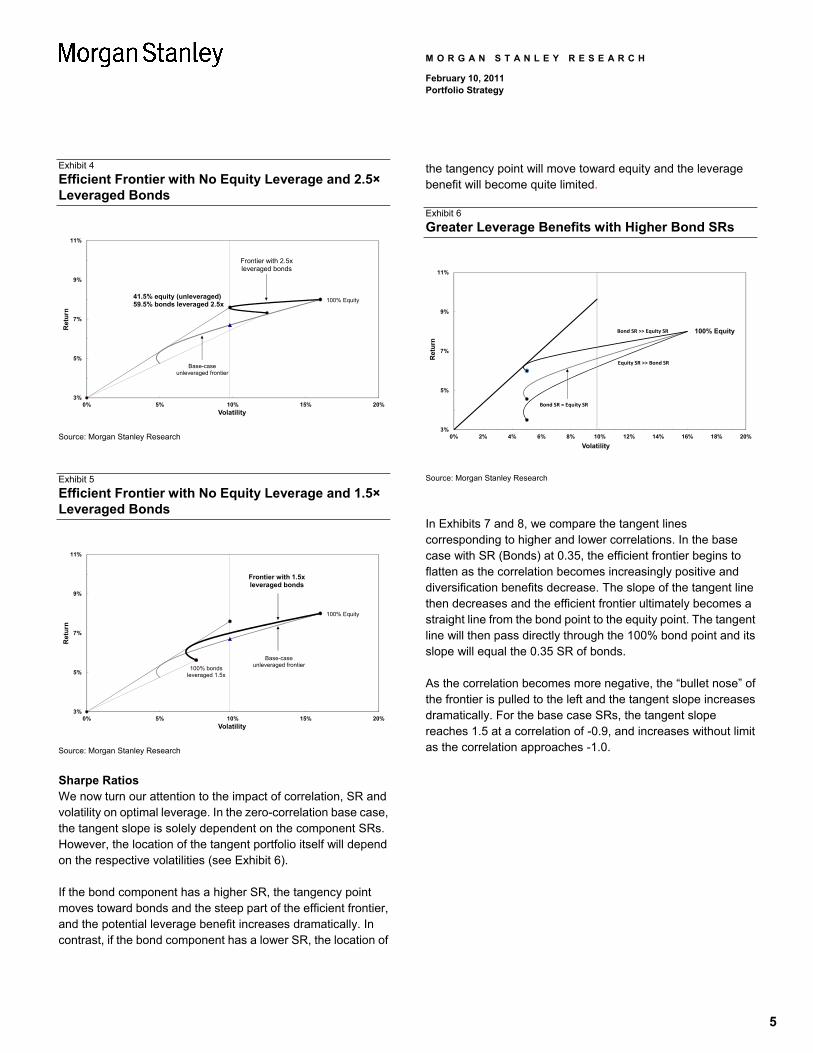
To illustrate the theoretical advantages of leverage, we focus on the standard 60% equity/40% bond portfolio. From our base-case assumptions, it follows that the volatility and return of this portfolio are 9.8% and 6.7%, respectively.
Return enhancement is achieved if the tangent portfolio is leveraged 1.87x. The resulting portfolio has the same 9.8% volatility, but with a 90 basis point greater expected return (Exhibit 3). Risk reduction is achieved when the optimal
portfolio is leveraged 1.5x. The resulting portfolios will have the same 6.7% expected return as the 60/40 portfolio, but with a reduced volatility of only 7.9%.
Exhibit 3
“Leverage" Can Either Add Return or Reduce Risk Relative to 60% Equity/40% Bond Portfolio
3%
5%
7%
9%
11%
0% 2% 4% 6% 8% 10% 12% 14% 16% 18% 20%
Ret
urn
Volatility
1.5x leverage point:Equal return, less risk
Higher return & equal risk with:22% equity leveraged 1.87x78% bonds leveraged 1.87x
60% equity/40% bonds
Source: Morgan Stanley Research
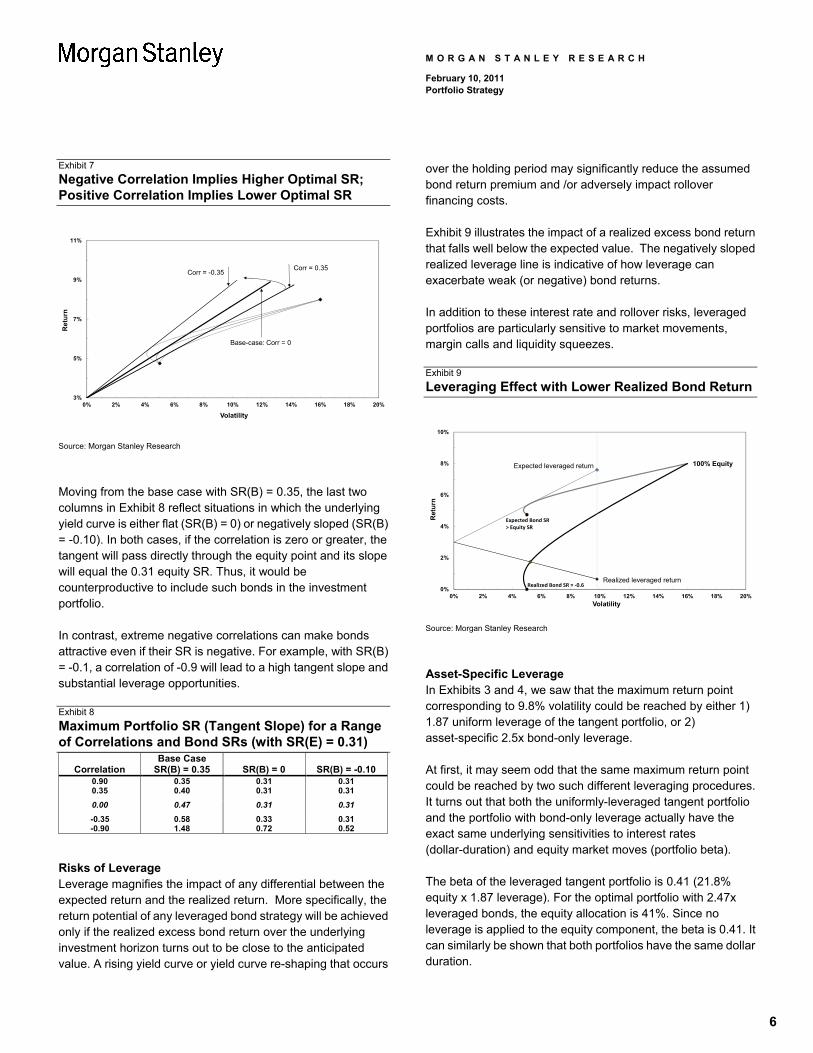
At the maximum return point in Exhibit 3, the portfolio consists of 78% bonds leveraged 1.87x and 22% equity leveraged 1.87x. In practice, instead of applying uniform leverage, it may be more convenient (or comfortable) to leverage only bonds and not equity. It turns out that this same maximum return point could be obtained by leveraging bonds by a 2.5x factor and then combining them with 41.5% unleveraged equity (Exhibit 4).
Exhibit 4 also implicitly illustrates the more general result that every point between the tangent line and the bond leverage line can be reached by mixing sufficiently leveraged bonds with unleveraged equity. Doing so may, however, require unacceptably high levels of bond leverage.
In Exhibit 5, we show an efficient frontier that represents all possible combinations of unleveraged equity and 1.5x leveraged bonds. In this case, the return advantages of leverage are markedly diminished. At the 9.8% volatility-matching point, the new frontier is above the unleveraged frontier, but the return is far below that of the optimal leveraged portfolio.
5
M O R G A N S T A N L E Y R E S E A R C H
February 10, 2011 Portfolio Strategy
Exhibit 4
Efficient Frontier with No Equity Leverage and 2.5× Leveraged Bonds
3%
5%
7%
9%
11%
0% 5% 10% 15% 20%
Ret
urn
Volatility
100% Equity
Frontier with 2.5x leveraged bonds
Base-caseunleveraged frontier
41.5% equity (unleveraged) 59.5% bonds leveraged 2.5x
Source: Morgan Stanley Research
Exhibit 5
Efficient Frontier with No Equity Leverage and 1.5× Leveraged Bonds
3%
5%
7%
9%
11%
0% 5% 10% 15% 20%
Ret
urn
Volatility
100% Equity
Frontier with 1.5x leveraged bonds
Base-caseunleveraged frontier
100% bonds leveraged 1.5x
Source: Morgan Stanley Research
Sharpe Ratios We now turn our attention to the impact of correlation, SR and volatility on optimal leverage. In the zero-correlation base case, the tangent slope is solely dependent on the component SRs. However, the location of the tangent portfolio itself will depend on the respective volatilities (see Exhibit 6).
If the bond component has a higher SR, the tangency point moves toward bonds and the steep part of the efficient frontier, and the potential leverage benefit increases dramatically. In contrast, if the bond component has a lower SR, the location of
the tangency point will move toward equity and the leverage benefit will become quite limited.
Exhibit 6
Greater Leverage Benefits with Higher Bond SRs
3%
5%
7%
9%
11%
0% 2% 4% 6% 8% 10% 12% 14% 16% 18% 20%R
etu
rn
Volatility
100% Equity
Equity SR >> Bond SR
Bond SR >> Equity SR
Bond SR = Equity SR
Source: Morgan Stanley Research
In Exhibits 7 and 8, we compare the tangent lines corresponding to higher and lower correlations. In the base case with SR (Bonds) at 0.35, the efficient frontier begins to flatten as the correlation becomes increasingly positive and diversification benefits decrease. The slope of the tangent line then decreases and the efficient frontier ultimately becomes a straight line from the bond point to the equity point. The tangent line will then pass directly through the 100% bond point and its slope will equal the 0.35 SR of bonds.
As the correlation becomes more negative, the “bullet nose” of the frontier is pulled to the left and the tangent slope increases dramatically. For the base case SRs, the tangent slope reaches 1.5 at a correlation of -0.9, and increases without limit as the correlation approaches -1.0.
6
M O R G A N S T A N L E Y R E S E A R C H
February 10, 2011 Portfolio Strategy
Exhibit 7
Negative Correlation Implies Higher Optimal SR; Positive Correlation Implies Lower Optimal SR
3%
5%
7%
9%
11%
0% 2% 4% 6% 8% 10% 12% 14% 16% 18% 20%
Ret
urn
Volatility
Corr = -0.35Corr = 0.35
Base-case: Corr = 0
Source: Morgan Stanley Research
Moving from the base case with SR(B) = 0.35, the last two columns in Exhibit 8 reflect situations in which the underlying yield curve is either flat (SR(B) = 0) or negatively sloped (SR(B) = -0.10). In both cases, if the correlation is zero or greater, the tangent will pass directly through the equity point and its slope will equal the 0.31 equity SR. Thus, it would be counterproductive to include such bonds in the investment portfolio.
In contrast, extreme negative correlations can make bonds attractive even if their SR is negative. For example, with SR(B) = -0.1, a correlation of -0.9 will lead to a high tangent slope and substantial leverage opportunities.
Exhibit 8
Maximum Portfolio SR (Tangent Slope) for a Range of Correlations and Bond SRs (with SR(E) = 0.31)
Correlation Base Case
SR(B) = 0.35 SR(B) = 0 SR(B) = -0.10 0.90 0.35 0.31 0.310.35 0.40 0.31 0.31
0.00 0.47 0.31 0.31
-0.35 0.58 0.33 0.31-0.90 1.48 0.72 0.52
Risks of Leverage Leverage magnifies the impact of any differential between the expected return and the realized return. More specifically, the return potential of any leveraged bond strategy will be achieved only if the realized excess bond return over the underlying investment horizon turns out to be close to the anticipated value. A rising yield curve or yield curve re-shaping that occurs
over the holding period may significantly reduce the assumed bond return premium and /or adversely impact rollover financing costs.
Exhibit 9 illustrates the impact of a realized excess bond return that falls well below the expected value. The negatively sloped realized leverage line is indicative of how leverage can exacerbate weak (or negative) bond returns.
In addition to these interest rate and rollover risks, leveraged portfolios are particularly sensitive to market movements, margin calls and liquidity squeezes.
Exhibit 9
Leveraging Effect with Lower Realized Bond Return
0%
2%
4%
6%
8%
10%
0% 2% 4% 6% 8% 10% 12% 14% 16% 18% 20%
Ret
urn
Volatility
100% EquityExpected leveraged return
Realized leveraged return
Expected Bond SR> Equity SR
Realized Bond SR = -0.6
Source: Morgan Stanley Research
Asset-Specific Leverage In Exhibits 3 and 4, we saw that the maximum return point corresponding to 9.8% volatility could be reached by either 1) 1.87 uniform leverage of the tangent portfolio, or 2) asset-specific 2.5x bond-only leverage.
At first, it may seem odd that the same maximum return point could be reached by two such different leveraging procedures. It turns out that both the uniformly-leveraged tangent portfolio and the portfolio with bond-only leverage actually have the exact same underlying sensitivities to interest rates (dollar-duration) and equity market moves (portfolio beta).
The beta of the leveraged tangent portfolio is 0.41 (21.8% equity x 1.87 leverage). For the optimal portfolio with 2.47x leveraged bonds, the equity allocation is 41%. Since no leverage is applied to the equity component, the beta is 0.41. It can similarly be shown that both portfolios have the same dollar duration.
7
M O R G A N S T A N L E Y R E S E A R C H
February 10, 2011 Portfolio Strategy
This observation has several important implications and generalizations (see Appendix II):
1) the same equity risk and dollar-duration exposures generally can be achieved in a variety of ways
2) any feasible return/risk point can be reached by either uniform leverage or by various mixtures of asset-specific leverage
3) all leveraging procedures leading to a given portfolio beta and dollar-duration necessarily have the same total leverage
4) a given portfolio risk/return point that lies to the right of the tangent line and above the efficient frontier can have only one “efficient” beta and dollar-duration.
The Uniformly Leveraged Frontier In the earlier sections of this paper, we focused on movement along the tangent line, reflecting the gains that leverage can provide, at least in theory. Such movements entailed uniformly leveraging the bond and equity components of the 22% equity/78% bonds tangent portfolio. For example, in Exhibit 2, we highlighted the point corresponding to the 1.5x leveraged bond and equity positions. With such uniform leverage, the proportion of equity and bonds remains the same as in the initial long-only portfolio.
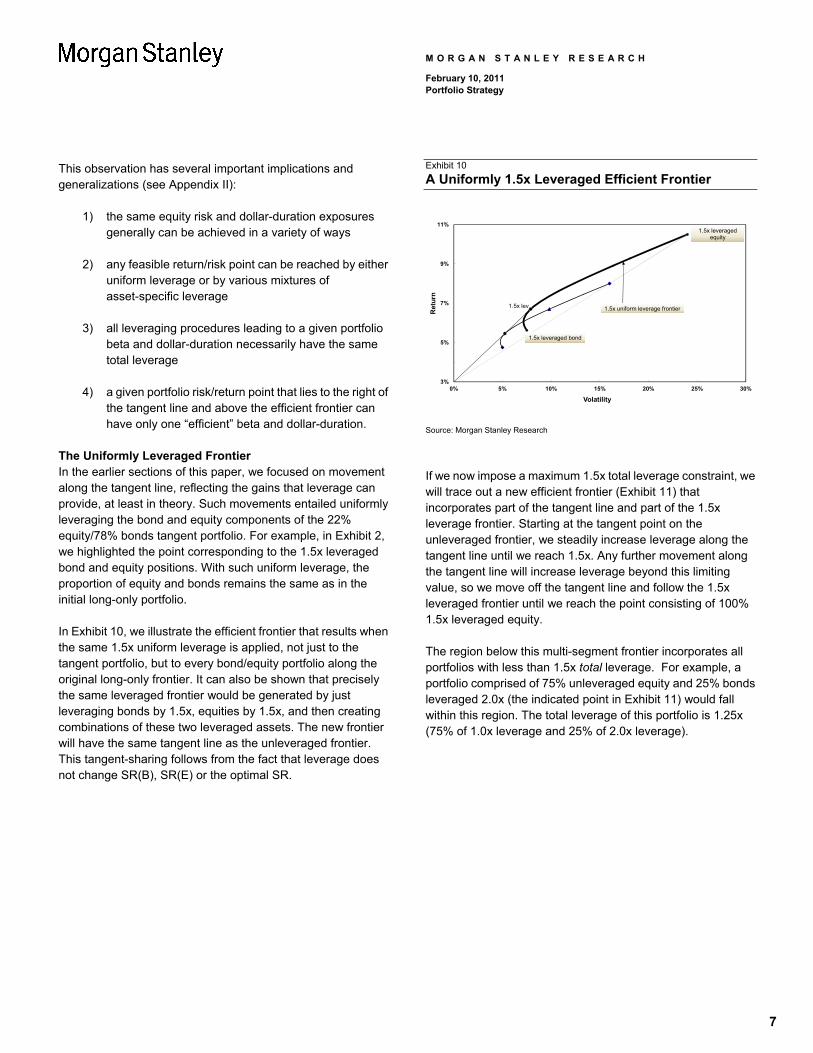
In Exhibit 10, we illustrate the efficient frontier that results when the same 1.5x uniform leverage is applied, not just to the tangent portfolio, but to every bond/equity portfolio along the original long-only frontier. It can also be shown that precisely the same leveraged frontier would be generated by just leveraging bonds by 1.5x, equities by 1.5x, and then creating combinations of these two leveraged assets. The new frontier will have the same tangent line as the unleveraged frontier. This tangent-sharing follows from the fact that leverage does not change SR(B), SR(E) or the optimal SR.
Exhibit 10
A Uniformly 1.5x Leveraged Efficient Frontier
3%
5%
7%
9%
11%
0% 5% 10% 15% 20% 25% 30%
Ret
urn
Volatility
1.5x lev
1.5x leveraged bond
1.5x leveraged equity
1.5x uniform leverage frontier
Source: Morgan Stanley Research
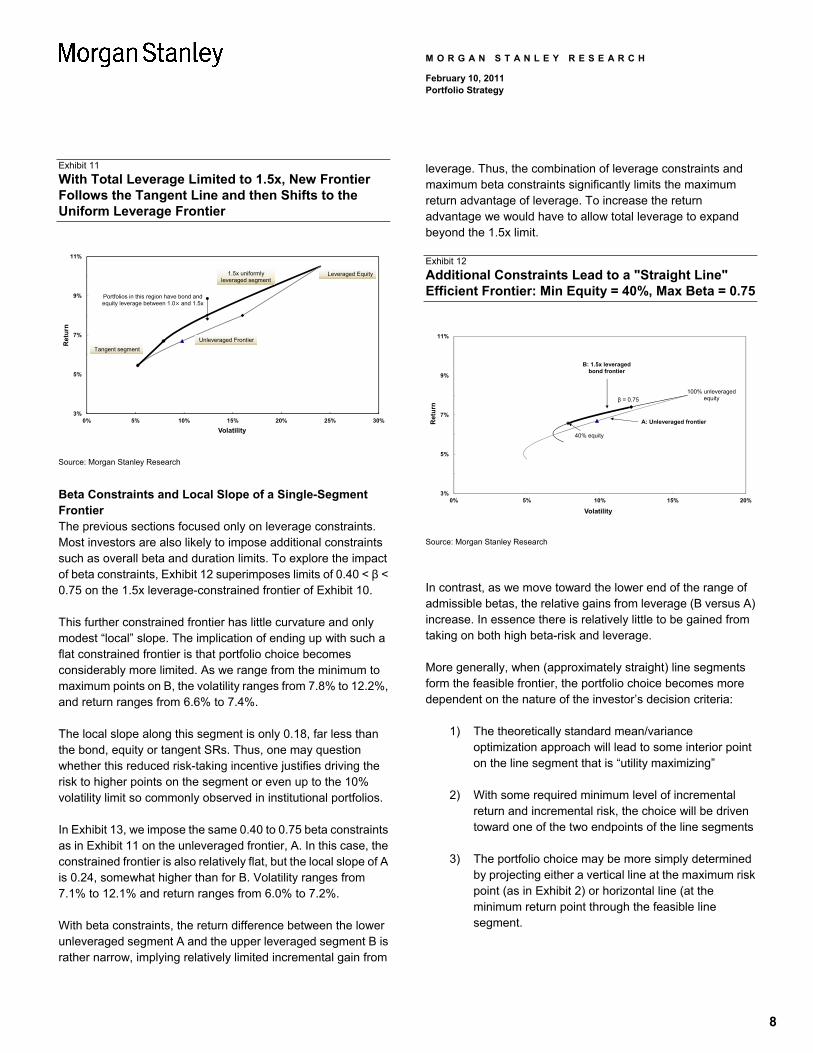
If we now impose a maximum 1.5x total leverage constraint, we will trace out a new efficient frontier (Exhibit 11) that incorporates part of the tangent line and part of the 1.5x leverage frontier. Starting at the tangent point on the unleveraged frontier, we steadily increase leverage along the tangent line until we reach 1.5x. Any further movement along the tangent line will increase leverage beyond this limiting value, so we move off the tangent line and follow the 1.5x leveraged frontier until we reach the point consisting of 100% 1.5x leveraged equity.
The region below this multi-segment frontier incorporates all portfolios with less than 1.5x total leverage. For example, a portfolio comprised of 75% unleveraged equity and 25% bonds leveraged 2.0x (the indicated point in Exhibit 11) would fall within this region. The total leverage of this portfolio is 1.25x (75% of 1.0x leverage and 25% of 2.0x leverage).
8
M O R G A N S T A N L E Y R E S E A R C H
February 10, 2011 Portfolio Strategy
Exhibit 11
With Total Leverage Limited to 1.5x, New Frontier Follows the Tangent Line and then Shifts to the Uniform Leverage Frontier
3%
5%
7%
9%
11%
0% 5% 10% 15% 20% 25% 30%
Ret
urn
Volatility
Portfolios in this region have bond andequity leverage between 1.0 and 1.5x
1.5x uniformlyleveraged segment
Tangent segment
Unleveraged Frontier
Leveraged Equity
Source: Morgan Stanley Research
Beta Constraints and Local Slope of a Single-Segment Frontier The previous sections focused only on leverage constraints. Most investors are also likely to impose additional constraints such as overall beta and duration limits. To explore the impact of beta constraints, Exhibit 12 superimposes limits of 0.40 < β < 0.75 on the 1.5x leverage-constrained frontier of Exhibit 10.
This further constrained frontier has little curvature and only modest “local” slope. The implication of ending up with such a flat constrained frontier is that portfolio choice becomes considerably more limited. As we range from the minimum to maximum points on B, the volatility ranges from 7.8% to 12.2%, and return ranges from 6.6% to 7.4%.
The local slope along this segment is only 0.18, far less than the bond, equity or tangent SRs. Thus, one may question whether this reduced risk-taking incentive justifies driving the risk to higher points on the segment or even up to the 10% volatility limit so commonly observed in institutional portfolios.
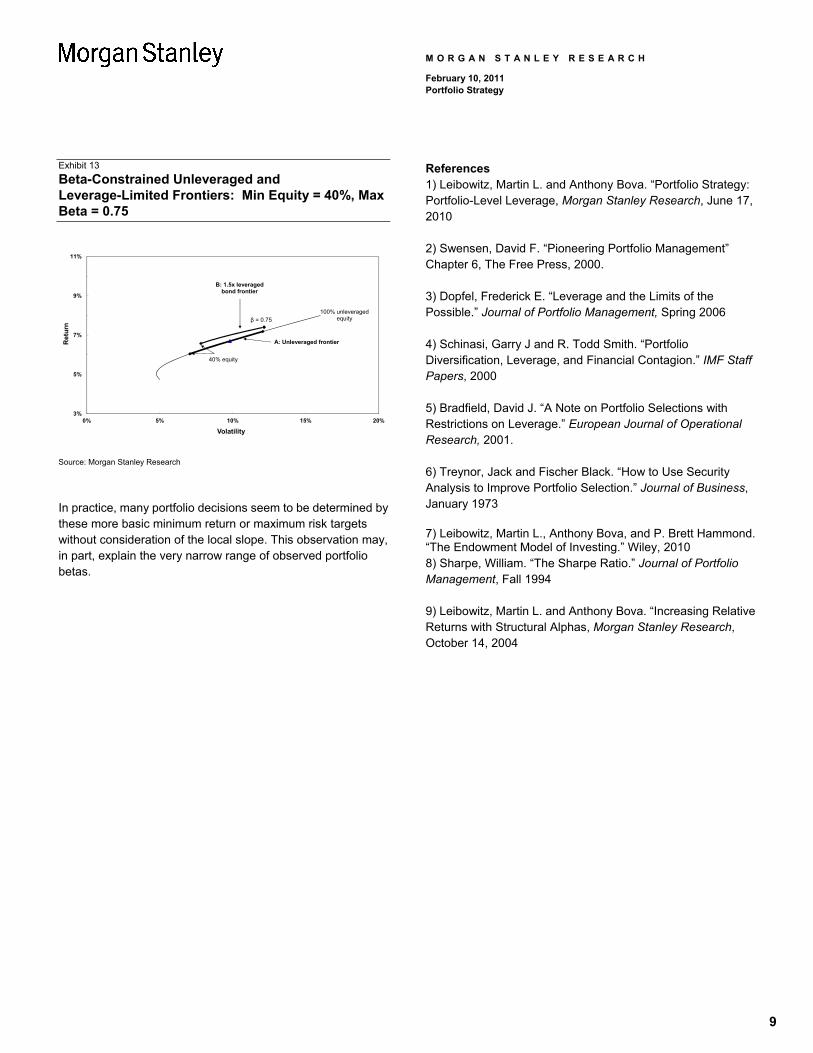
In Exhibit 13, we impose the same 0.40 to 0.75 beta constraints as in Exhibit 11 on the unleveraged frontier, A. In this case, the constrained frontier is also relatively flat, but the local slope of A is 0.24, somewhat higher than for B. Volatility ranges from 7.1% to 12.1% and return ranges from 6.0% to 7.2%.
With beta constraints, the return difference between the lower unleveraged segment A and the upper leveraged segment B is rather narrow, implying relatively limited incremental gain from
leverage. Thus, the combination of leverage constraints and maximum beta constraints significantly limits the maximum return advantage of leverage. To increase the return advantage we would have to allow total leverage to expand beyond the 1.5x limit.
Exhibit 12
Additional Constraints Lead to a "Straight Line" Efficient Frontier: Min Equity = 40%, Max Beta = 0.75
3%
5%
7%
9%
11%
0% 5% 10% 15% 20%
Ret
urn
Volatility
β = 0.75
40% equity
B: 1.5x leveraged bond frontier
100% unleveraged equity
A: Unleveraged frontier
Source: Morgan Stanley Research
In contrast, as we move toward the lower end of the range of admissible betas, the relative gains from leverage (B versus A) increase. In essence there is relatively little to be gained from taking on both high beta-risk and leverage.
More generally, when (approximately straight) line segments form the feasible frontier, the portfolio choice becomes more dependent on the nature of the investor’s decision criteria:
1) The theoretically standard mean/variance optimization approach will lead to some interior point on the line segment that is “utility maximizing”
2) With some required minimum level of incremental return and incremental risk, the choice will be driven toward one of the two endpoints of the line segments
3) The portfolio choice may be more simply determined by projecting either a vertical line at the maximum risk point (as in Exhibit 2) or horizontal line (at the minimum return point through the feasible line segment.
9
M O R G A N S T A N L E Y R E S E A R C H
February 10, 2011 Portfolio Strategy
Exhibit 13
Beta-Constrained Unleveraged and Leverage-Limited Frontiers: Min Equity = 40%, Max Beta = 0.75
3%
5%
7%
9%
11%
0% 5% 10% 15% 20%
Ret
urn
Volatility
β = 0.75
40% equity
B: 1.5x leveraged bond frontier
100% unleveraged equity
A: Unleveraged frontier
Source: Morgan Stanley Research
In practice, many portfolio decisions seem to be determined by these more basic minimum return or maximum risk targets without consideration of the local slope. This observation may, in part, explain the very narrow range of observed portfolio betas.
References 1) Leibowitz, Martin L. and Anthony Bova. “Portfolio Strategy: Portfolio-Level Leverage, Morgan Stanley Research, June 17, 2010
2) Swensen, David F. “Pioneering Portfolio Management” Chapter 6, The Free Press, 2000.
3) Dopfel, Frederick E. “Leverage and the Limits of the Possible.” Journal of Portfolio Management, Spring 2006
4) Schinasi, Garry J and R. Todd Smith. “Portfolio Diversification, Leverage, and Financial Contagion.” IMF Staff Papers, 2000
5) Bradfield, David J. “A Note on Portfolio Selections with Restrictions on Leverage.” European Journal of Operational Research, 2001.
6) Treynor, Jack and Fischer Black. “How to Use Security Analysis to Improve Portfolio Selection.” Journal of Business, January 1973
7) Leibowitz, Martin L., Anthony Bova, and P. Brett Hammond. “The Endowment Model of Investing.” Wiley, 2010 8) Sharpe, William. “The Sharpe Ratio.” Journal of Portfolio Management, Fall 1994
9) Leibowitz, Martin L. and Anthony Bova. “Increasing Relative Returns with Structural Alphas, Morgan Stanley Research, October 14, 2004
10
M O R G A N S T A N L E Y R E S E A R C H
February 10, 2011 Portfolio Strategy
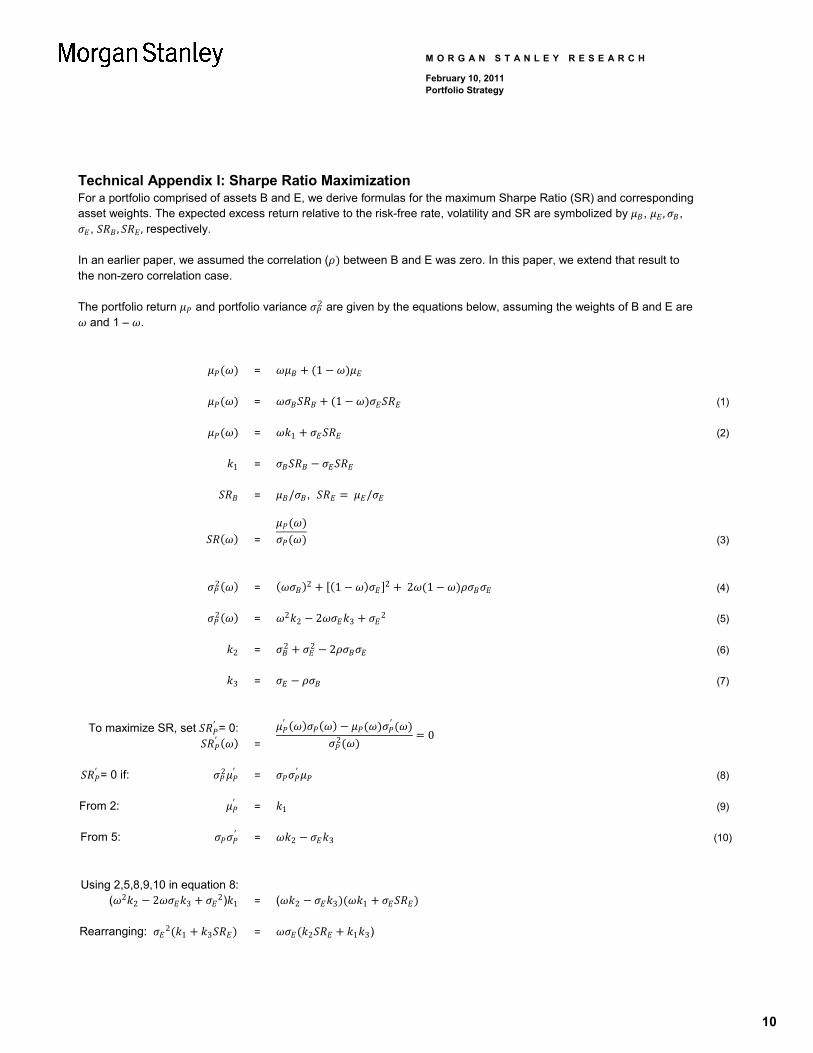
Technical Appendix I: Sharpe Ratio Maximization For a portfolio comprised of assets B and E, we derive formulas for the maximum Sharpe Ratio (SR) and corresponding asset weights. The expected excess return relative to the risk-free rate, volatility and SR are symbolized by , , ,
, , , respectively.
In an earlier paper, we assumed the correlation ( between B and E was zero. In this paper, we extend that result to the non-zero correlation case.
The portfolio return and portfolio variance 2 are given by the equations below, assuming the weights of B and E are and 1 – .
= 1
= 1 (1)
= 1 (2)
1 =
= / , /
=
(3)
2 = 2 1 2 2 1 (4)
2 = 22 2 3
2 (5)
2 = 2 2 2 (6)
3 = (7)
To maximize SR, set = 0: = 2 0
= 0 if: 2 = (8)
From 2: = 1 (9)
From 5: = 2 3 (10)
Using 2,5,8,9,10 in equation 8: ( 2
2 2 32) 1 = ( 2 3 1
Rearranging: 21 3 = 2 1 3)
11
M O R G A N S T A N L E Y R E S E A R C H
February 10, 2011 Portfolio Strategy
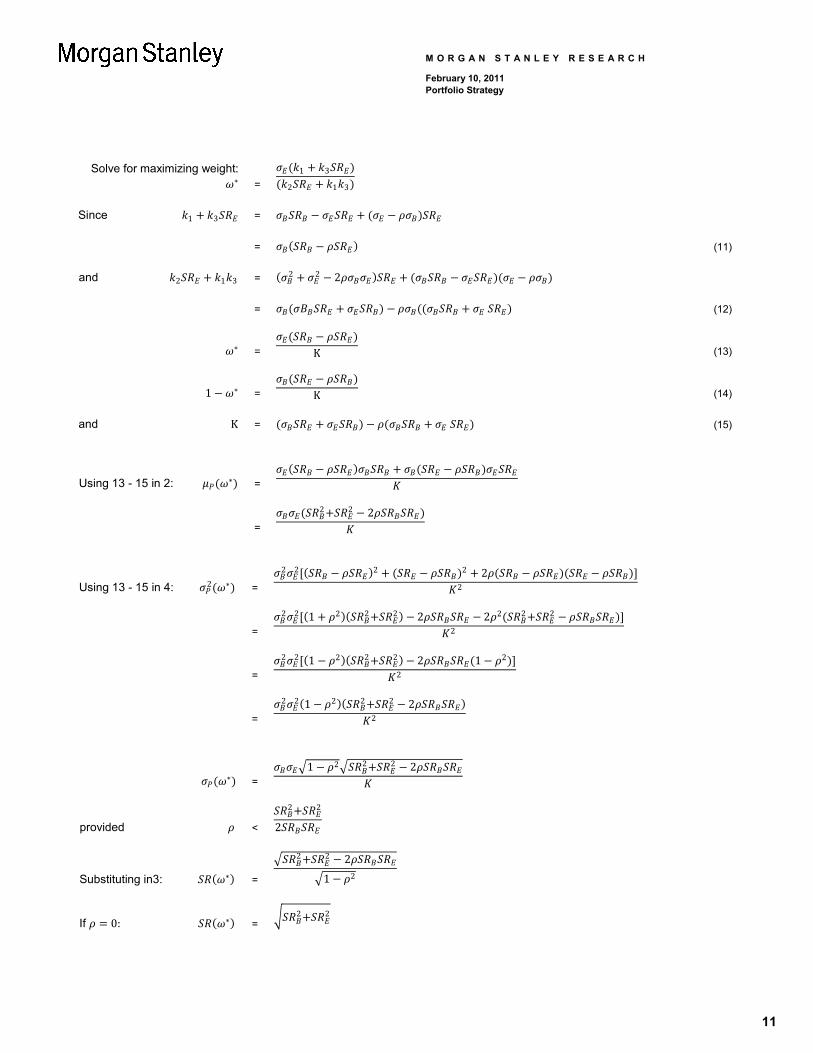
Solve for maximizing weight: =
1 3
2 1 3
Since 1 3 =
= (11)
and 2 1 3 = 2 2 2
= (12)
= K (13)
1 = K (14)
and K = (15)
Using 13 - 15 in 2: =
=
2 2 2
Using 13 - 15 in 4: 2 =
2 2 2 2 22
=
2 2 1 2 2 2 2 2 2 2 2
2
=
2 2 1 2 2 2 2 1 2
2
=
2 2 1 2 2 2 22
= 1 2 2 2 2
provided <
2 2
2
Substituting in3: =
2 2 2
1 2
If 0: = 2 2
12
M O R G A N S T A N L E Y R E S E A R C H
February 10, 2011 Portfolio Strategy
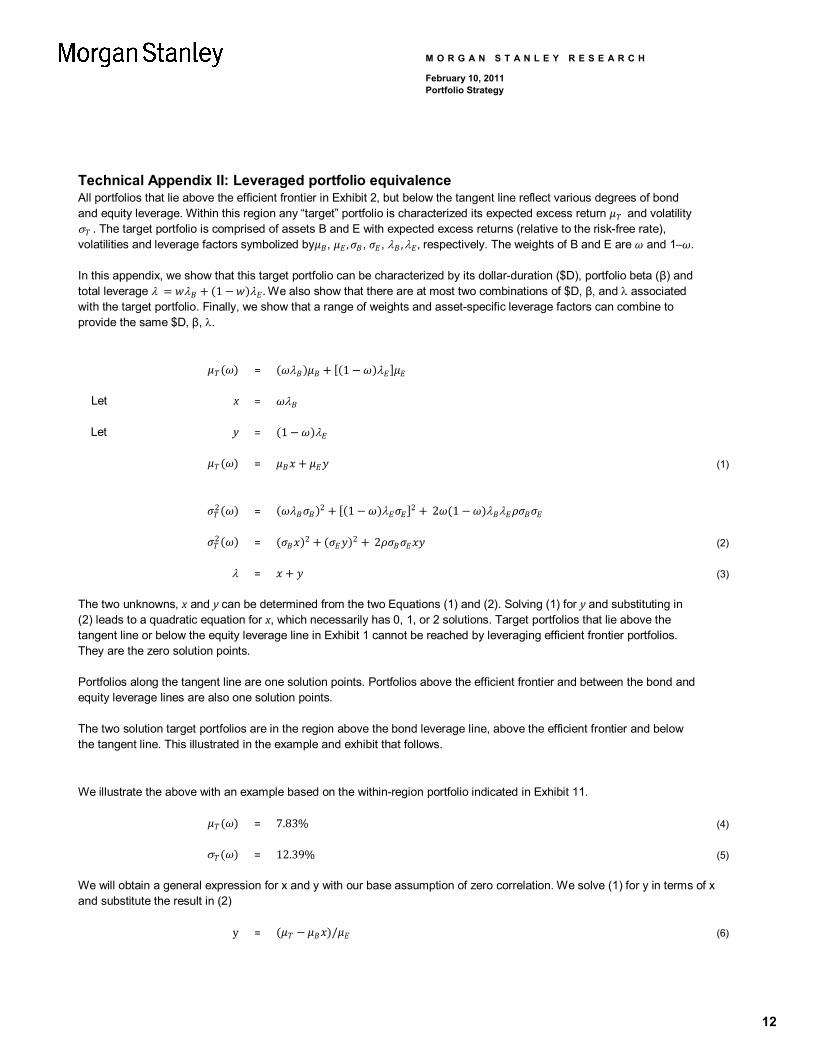
Technical Appendix II: Leveraged portfolio equivalence All portfolios that lie above the efficient frontier in Exhibit 2, but below the tangent line reflect various degrees of bond and equity leverage. Within this region any “target” portfolio is characterized its expected excess return and volatility . The target portfolio is comprised of assets B and E with expected excess returns (relative to the risk-free rate), volatilities and leverage factors symbolized by , , , , , , respectively. The weights of B and E are and 1– .
In this appendix, we show that this target portfolio can be characterized by its dollar-duration ($D), portfolio beta (β) and total leverage 1 . We also show that there are at most two combinations of $D, β, and associated with the target portfolio. Finally, we show that a range of weights and asset-specific leverage factors can combine to provide the same $D, β, .
= 1
Let x =
Let y = 1
= (1)
2 = 2 1 2 2 1
2 = 2 2 2 (2)
= (3)
The two unknowns, x and y can be determined from the two Equations (1) and (2). Solving (1) for y and substituting in (2) leads to a quadratic equation for x, which necessarily has 0, 1, or 2 solutions. Target portfolios that lie above the tangent line or below the equity leverage line in Exhibit 1 cannot be reached by leveraging efficient frontier portfolios. They are the zero solution points.
Portfolios along the tangent line are one solution points. Portfolios above the efficient frontier and between the bond and equity leverage lines are also one solution points.
The two solution target portfolios are in the region above the bond leverage line, above the efficient frontier and below the tangent line. This illustrated in the example and exhibit that follows.
We illustrate the above with an example based on the within-region portfolio indicated in Exhibit 11.
= 7.83% (4)
= 12.39% (5)
We will obtain a general expression for x and y with our base assumption of zero correlation. We solve (1) for y in terms of x and substitute the result in (2)
y = / (6)

13
M O R G A N S T A N L E Y R E S E A R C H
February 10, 2011 Portfolio Strategy
2 = 2 2 / 2
Rearranging terms above
0 = 2 (7)
a = 2
2
b = -2 / 2
c =
22
Using our base assumptions along with (4) and (5)
a = 0.56%
b = -1.73%
c = 0.85%
Using the above values in (7) and applying the quadratic formula
x = 1.7313% 1.0353%
1.1272%
1 = 0.6175
From (6) 1 = 0.7500
From (3) 1 = 1.3675
2 = 2.4544
2 = 0.1071
2 = 2.5615
Each of the two solutions defines a unique total leverage. In most cases, all other things being equal, one would prefer less leverage so the solution 1, 1 would typically be chosen. We now delve more deeply into the meaning of x and y.
If the second asset, E, is equity, then the expression 1 represents the portfolio β and, therefore, so does y. If the first asset, B, is bonds, then the portfolio $D = D = xD, where D is the duration of the bond component. Thus, x and y fully determine the interest rate and equity risk of the portfolio. Since there are exactly two solutions to (7) for the given target risk and return, there are precisely two possibilities for the combination of leverage, interest rate risk and equity risk that lead to the target portfolio characteristics. However, there are a wide range of choices for the weights and leverage of the bond and equity components that give rise to the same , $D and portfolio β.
14
M O R G A N S T A N L E Y R E S E A R C H
February 10, 2011 Portfolio Strategy
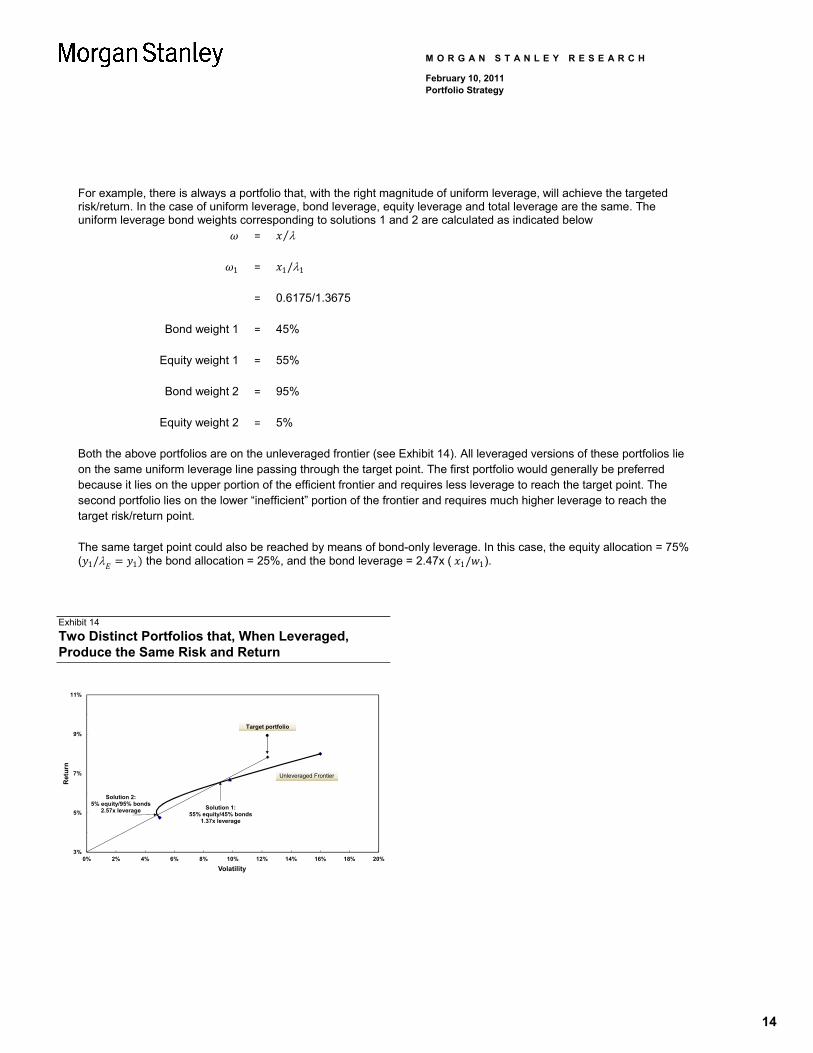
For example, there is always a portfolio that, with the right magnitude of uniform leverage, will achieve the targeted risk/return. In the case of uniform leverage, bond leverage, equity leverage and total leverage are the same. The uniform leverage bond weights corresponding to solutions 1 and 2 are calculated as indicated below
= ⁄
1 = 1/1
= 0.6175/1.3675
Bond weight 1 = 45%
Equity weight 1 = 55%
Bond weight 2 = 95%
Equity weight 2 = 5%
Both the above portfolios are on the unleveraged frontier (see Exhibit 14). All leveraged versions of these portfolios lie on the same uniform leverage line passing through the target point. The first portfolio would generally be preferred because it lies on the upper portion of the efficient frontier and requires less leverage to reach the target point. The second portfolio lies on the lower “inefficient” portion of the frontier and requires much higher leverage to reach the target risk/return point.
The same target point could also be reached by means of bond-only leverage. In this case, the equity allocation = 75% ( 1/ 1 the bond allocation = 25%, and the bond leverage = 2.47x ( 1/ 1).
Exhibit 14
Two Distinct Portfolios that, When Leveraged, Produce the Same Risk and Return
3%
5%
7%
9%
11%
0% 2% 4% 6% 8% 10% 12% 14% 16% 18% 20%
Ret
urn
Volatility
Target portfolio
Unleveraged Frontier
Solution 1:55% equity/45% bonds
1.37x leverage
Solution 2:5% equity/95% bonds
2.57x leverage
15
M O R G A N S T A N L E Y R E S E A R C H
February 10, 2011 Portfolio Strategy
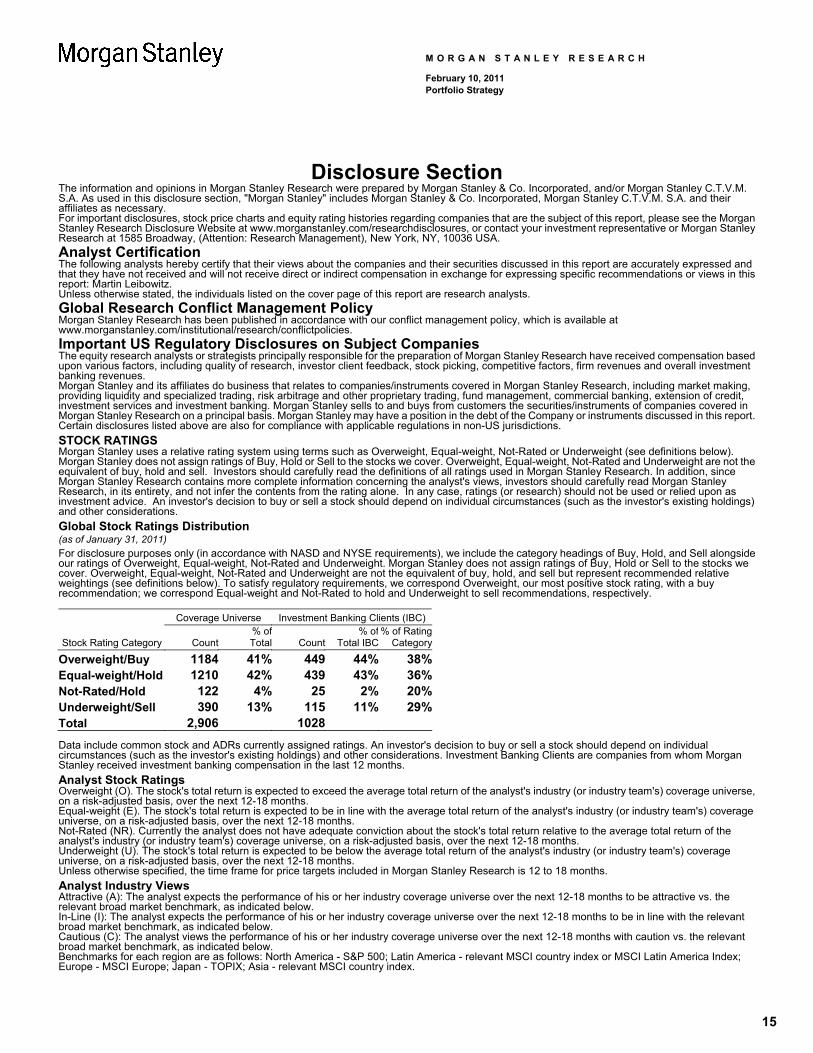
Disclosure Section The information and opinions in Morgan Stanley Research were prepared by Morgan Stanley & Co. Incorporated, and/or Morgan Stanley C.T.V.M. S.A. As used in this disclosure section, "Morgan Stanley" includes Morgan Stanley & Co. Incorporated, Morgan Stanley C.T.V.M. S.A. and their affiliates as necessary. For important disclosures, stock price charts and equity rating histories regarding companies that are the subject of this report, please see the Morgan Stanley Research Disclosure Website at www.morganstanley.com/researchdisclosures, or contact your investment representative or Morgan Stanley Research at 1585 Broadway, (Attention: Research Management), New York, NY, 10036 USA.
Analyst Certification The following analysts hereby certify that their views about the companies and their securities discussed in this report are accurately expressed and that they have not received and will not receive direct or indirect compensation in exchange for expressing specific recommendations or views in this report: Martin Leibowitz. Unless otherwise stated, the individuals listed on the cover page of this report are research analysts.
Global Research Conflict Management Policy Morgan Stanley Research has been published in accordance with our conflict management policy, which is available at www.morganstanley.com/institutional/research/conflictpolicies.
Important US Regulatory Disclosures on Subject Companies The equity research analysts or strategists principally responsible for the preparation of Morgan Stanley Research have received compensation based upon various factors, including quality of research, investor client feedback, stock picking, competitive factors, firm revenues and overall investment banking revenues. Morgan Stanley and its affiliates do business that relates to companies/instruments covered in Morgan Stanley Research, including market making, providing liquidity and specialized trading, risk arbitrage and other proprietary trading, fund management, commercial banking, extension of credit, investment services and investment banking. Morgan Stanley sells to and buys from customers the securities/instruments of companies covered in Morgan Stanley Research on a principal basis. Morgan Stanley may have a position in the debt of the Company or instruments discussed in this report. Certain disclosures listed above are also for compliance with applicable regulations in non-US jurisdictions.
STOCK RATINGS Morgan Stanley uses a relative rating system using terms such as Overweight, Equal-weight, Not-Rated or Underweight (see definitions below). Morgan Stanley does not assign ratings of Buy, Hold or Sell to the stocks we cover. Overweight, Equal-weight, Not-Rated and Underweight are not the equivalent of buy, hold and sell. Investors should carefully read the definitions of all ratings used in Morgan Stanley Research. In addition, since Morgan Stanley Research contains more complete information concerning the analyst's views, investors should carefully read Morgan Stanley Research, in its entirety, and not infer the contents from the rating alone. In any case, ratings (or research) should not be used or relied upon as investment advice. An investor's decision to buy or sell a stock should depend on individual circumstances (such as the investor's existing holdings) and other considerations.
Global Stock Ratings Distribution (as of January 31, 2011)
For disclosure purposes only (in accordance with NASD and NYSE requirements), we include the category headings of Buy, Hold, and Sell alongside our ratings of Overweight, Equal-weight, Not-Rated and Underweight. Morgan Stanley does not assign ratings of Buy, Hold or Sell to the stocks we cover. Overweight, Equal-weight, Not-Rated and Underweight are not the equivalent of buy, hold, and sell but represent recommended relative weightings (see definitions below). To satisfy regulatory requirements, we correspond Overweight, our most positive stock rating, with a buy recommendation; we correspond Equal-weight and Not-Rated to hold and Underweight to sell recommendations, respectively.
Coverage Universe Investment Banking Clients (IBC)
Stock Rating Category Count % of Total Count
% of Total IBC
% of Rating Category
Overweight/Buy 1184 41% 449 44% 38%Equal-weight/Hold 1210 42% 439 43% 36%Not-Rated/Hold 122 4% 25 2% 20%Underweight/Sell 390 13% 115 11% 29%Total 2,906 1028 Data include common stock and ADRs currently assigned ratings. An investor's decision to buy or sell a stock should depend on individual circumstances (such as the investor's existing holdings) and other considerations. Investment Banking Clients are companies from whom Morgan Stanley received investment banking compensation in the last 12 months.
Analyst Stock Ratings Overweight (O). The stock's total return is expected to exceed the average total return of the analyst's industry (or industry team's) coverage universe, on a risk-adjusted basis, over the next 12-18 months. Equal-weight (E). The stock's total return is expected to be in line with the average total return of the analyst's industry (or industry team's) coverage universe, on a risk-adjusted basis, over the next 12-18 months. Not-Rated (NR). Currently the analyst does not have adequate conviction about the stock's total return relative to the average total return of the analyst's industry (or industry team's) coverage universe, on a risk-adjusted basis, over the next 12-18 months. Underweight (U). The stock's total return is expected to be below the average total return of the analyst's industry (or industry team's) coverage universe, on a risk-adjusted basis, over the next 12-18 months. Unless otherwise specified, the time frame for price targets included in Morgan Stanley Research is 12 to 18 months.
Analyst Industry Views Attractive (A): The analyst expects the performance of his or her industry coverage universe over the next 12-18 months to be attractive vs. the relevant broad market benchmark, as indicated below. In-Line (I): The analyst expects the performance of his or her industry coverage universe over the next 12-18 months to be in line with the relevant broad market benchmark, as indicated below. Cautious (C): The analyst views the performance of his or her industry coverage universe over the next 12-18 months with caution vs. the relevant broad market benchmark, as indicated below. Benchmarks for each region are as follows: North America - S&P 500; Latin America - relevant MSCI country index or MSCI Latin America Index; Europe - MSCI Europe; Japan - TOPIX; Asia - relevant MSCI country index.
16
M O R G A N S T A N L E Y R E S E A R C H
February 10, 2011 Portfolio Strategy
.
Important Disclosures for Morgan Stanley Smith Barney LLC Customers Citi Investment Research & Analysis (CIRA) research reports may be available about the companies or topics that are the subject of Morgan Stanley Research. Ask your Financial Advisor or use Research Center to view any available CIRA research reports in addition to Morgan Stanley research reports. Important disclosures regarding the relationship between the companies that are the subject of Morgan Stanley Research and Morgan Stanley Smith Barney LLC, Morgan Stanley and Citigroup Global Markets Inc. or any of their affiliates, are available on the Morgan Stanley Smith Barney disclosure website at www.morganstanleysmithbarney.com/researchdisclosures. For Morgan Stanley and Citigroup Global Markets, Inc. specific disclosures, you may refer to www.morganstanley.com/researchdisclosures and https://www.citigroupgeo.com/geopublic/Disclosures/index_a.html. Each Morgan Stanley Equity Research report is reviewed and approved on behalf of Morgan Stanley Smith Barney LLC. This review and approval is conducted by the same person who reviews the Equity Research report on behalf of Morgan Stanley. This could create a conflict of interest.
Other Important Disclosures Morgan Stanley produces an equity research product called a "Tactical Idea." Views contained in a "Tactical Idea" on a particular stock may be contrary to the recommendations or views expressed in research on the same stock. This may be the result of differing time horizons, methodologies, market events, or other factors. For all research available on a particular stock, please contact your sales representative or go to Client Link at www.morganstanley.com. Morgan Stanley Research does not provide individually tailored investment advice. Morgan Stanley Research has been prepared without regard to the individual financial circumstances and objectives of persons who receive it. Morgan Stanley recommends that investors independently evaluate particular investments and strategies, and encourages investors to seek the advice of a financial adviser. The appropriateness of a particular investment or strategy will depend on an investor's individual circumstances and objectives. The securities, instruments, or strategies discussed in Morgan Stanley Research may not be suitable for all investors, and certain investors may not be eligible to purchase or participate in some or all of them. The fixed income research analysts or strategists principally responsible for the preparation of Morgan Stanley Research have received compensation based upon various factors, including quality, accuracy and value of research, firm profitability or revenues (which include fixed income trading and capital markets profitability or revenues), client feedback and competitive factors. Fixed Income Research analysts' or strategists' compensation is not linked to investment banking or capital markets transactions performed by Morgan Stanley or the profitability or revenues of particular trading desks. Morgan Stanley Research is not an offer to buy or sell or the solicitation of an offer to buy or sell any security/instrument or to participate in any particular trading strategy. The "Important US Regulatory Disclosures on Subject Companies" section in Morgan Stanley Research lists all companies mentioned where Morgan Stanley owns 1% or more of a class of common equity securities of the companies. For all other companies mentioned in Morgan Stanley Research, Morgan Stanley may have an investment of less than 1% in securities/instruments or derivatives of securities/instruments of companies and may trade them in ways different from those discussed in Morgan Stanley Research. Employees of Morgan Stanley not involved in the preparation of Morgan Stanley Research may have investments in securities/instruments or derivatives of securities/instruments of companies mentioned and may trade them in ways different from those discussed in Morgan Stanley Research. Derivatives may be issued by Morgan Stanley or associated persons. With the exception of information regarding Morgan Stanley, Morgan Stanley Research is based on public information. Morgan Stanley makes every effort to use reliable, comprehensive information, but we make no representation that it is accurate or complete. We have no obligation to tell you when opinions or information in Morgan Stanley Research change apart from when we intend to discontinue equity research coverage of a subject company. Facts and views presented in Morgan Stanley Research have not been reviewed by, and may not reflect information known to, professionals in other Morgan Stanley business areas, including investment banking personnel. Morgan Stanley Research personnel may participate in company events such as site visits and are generally prohibited from accepting payment by the company of associated expenses unless pre-approved by authorized members of Research management. The value of and income from your investments may vary because of changes in interest rates, foreign exchange rates, default rates, prepayment rates, securities/instruments prices, market indexes, operational or financial conditions of companies or other factors. There may be time limitations on the exercise of options or other rights in securities/instruments transactions. Past performance is not necessarily a guide to future performance. Estimates of future performance are based on assumptions that may not be realized. If provided, and unless otherwise stated, the closing price on the cover page is that of the primary exchange for the subject company's securities/instruments. Morgan Stanley may make investment decisions or take proprietary positions that are inconsistent with the recommendations or views in this report. To our readers in Taiwan: Information on securities/instruments that trade in Taiwan is distributed by Morgan Stanley Taiwan Limited ("MSTL"). Such information is for your reference only. Information on any securities/instruments issued by a company owned by the government of or incorporated in the PRC and listed in on the Stock Exchange of Hong Kong ("SEHK"), namely the H-shares, including the component company stocks of the Stock Exchange of Hong Kong ("SEHK")'s Hang Seng China Enterprise Index; or any securities/instruments issued by a company that is 30% or more directly- or indirectly-owned by the government of or a company incorporated in the PRC and traded on an exchange in Hong Kong or Macau, namely SEHK's Red Chip shares, including the component company of the SEHK's China-affiliated Corp Index is distributed only to Taiwan Securities Investment Trust Enterprises ("SITE"). The reader should independently evaluate the investment risks and is solely responsible for their investment decisions. Morgan Stanley Research may not be distributed to the public media or quoted or used by the public media without the express written consent of Morgan Stanley. Information on securities/instruments that do not trade in Taiwan is for informational purposes only and is not to be construed as a recommendation or a solicitation to trade in such securities/instruments. MSTL may not execute transactions for clients in these securities/instruments. To our readers in Hong Kong: Information is distributed in Hong Kong by and on behalf of, and is attributable to, Morgan Stanley Asia Limited as part of its regulated activities in Hong Kong. If you have any queries concerning Morgan Stanley Research, please contact our Hong Kong sales representatives. Morgan Stanley Research is disseminated in Japan by Morgan Stanley MUFG Securities Co., Ltd.; in Hong Kong by Morgan Stanley Asia Limited (which accepts responsibility for its contents); in Singapore by Morgan Stanley Asia (Singapore) Pte. (Registration number 199206298Z) and/or Morgan Stanley Asia (Singapore) Securities Pte Ltd (Registration number 200008434H), regulated by the Monetary Authority of Singapore, which accepts responsibility for its contents; in Australia to "wholesale clients" within the meaning of the Australian Corporations Act by Morgan Stanley Australia Limited A.B.N. 67 003 734 576, holder of Australian financial services license No. 233742, which accepts responsibility for its contents; in Australia to "wholesale clients" and "retail clients" within the meaning of the Australian Corporations Act by Morgan Stanley Smith Barney Australia Pty Ltd (A.B.N. 19 009 145 555, holder of Australian financial services license No. 240813, which accepts responsibility for its contents; in Korea by Morgan Stanley & Co International plc, Seoul Branch; in India by Morgan Stanley India Company Private Limited; in Canada by Morgan Stanley Canada Limited, which has approved of, and has agreed to take responsibility for, the contents of Morgan Stanley Research in Canada; in Germany by Morgan Stanley Bank AG, Frankfurt am Main and Morgan Stanley Private Wealth Management Limited, Niederlassung Deutschland, regulated by Bundesanstalt fuer Finanzdienstleistungsaufsicht (BaFin); in Spain by Morgan Stanley, S.V., S.A., a Morgan Stanley group company, which is supervised by the Spanish Securities Markets Commission (CNMV) and states that Morgan Stanley Research has been written and distributed in accordance with the rules of conduct applicable to financial research as established under Spanish regulations; in the United States by Morgan Stanley & Co. Incorporated, which accepts responsibility for its contents. Morgan Stanley & Co. International plc, authorized and regulated by the Financial Services Authority, disseminates in the UK research that it has prepared, and approves solely for the purposes of section 21 of the Financial Services and Markets Act 2000, research which has been prepared by any of its affiliates. Morgan Stanley Private Wealth Management Limited, authorized and regulated by the Financial Services Authority, also disseminates Morgan Stanley Research in the UK. Private U.K. investors should obtain the advice of their Morgan Stanley & Co. International plc or Morgan Stanley Private Wealth Management representative about the investments concerned. RMB Morgan Stanley (Proprietary) Limited is a member of the JSE Limited and regulated by the Financial Services Board in South Africa. RMB Morgan Stanley (Proprietary) Limited is a joint venture owned equally by Morgan Stanley International Holdings Inc. and RMB Investment Advisory (Proprietary) Limited, which is wholly owned by FirstRand Limited. The information in Morgan Stanley Research is being communicated by Morgan Stanley & Co. International plc (DIFC Branch), regulated by the Dubai Financial Services Authority (the DFSA), and is directed at Professional Clients only, as defined by the DFSA. The financial products or financial services to which this research relates will only be made available to a customer who we are satisfied meets the regulatory criteria to be a Professional Client. The information in Morgan Stanley Research is being communicated by Morgan Stanley & Co. International plc (QFC Branch), regulated by the Qatar Financial Centre Regulatory Authority (the QFCRA), and is directed at business customers and market counterparties only and is not intended for Retail Customers as defined by the QFCRA. As required by the Capital Markets Board of Turkey, investment information, comments and recommendations stated here, are not within the scope of investment advisory activity. Investment advisory service is provided in accordance with a contract of engagement on investment advisory concluded between brokerage houses, portfolio
17
M O R G A N S T A N L E Y R E S E A R C H
February 10, 2011 Portfolio Strategy
management companies, non-deposit banks and clients. Comments and recommendations stated here rely on the individual opinions of the ones providing these comments and recommendations. These opinions may not fit to your financial status, risk and return preferences. For this reason, to make an investment decision by relying solely to this information stated here may not bring about outcomes that fit your expectations. The trademarks and service marks contained in Morgan Stanley Research are the property of their respective owners. Third-party data providers make no warranties or representations of any kind relating to the accuracy, completeness, or timeliness of the data they provide and shall not have liability for any damages of any kind relating to such data. The Global Industry Classification Standard ("GICS") was developed by and is the exclusive property of MSCI and S&P. Morgan Stanley Research, or any portion thereof may not be reprinted, sold or redistributed without the written consent of Morgan Stanley. Morgan Stanley Research is disseminated and available primarily electronically, and, in some cases, in printed form.
Additional information on recommended securities/instruments is available on request.
© 2011 Morgan Stanley
M O R G A N S T A N L E Y R E S E A R C H
The Americas
1585 Broadway
New York, NY 10036-8293
United States
Tel: +1 (1) 212 761 4000
Europe
20 Bank Street, Canary Wharf
London E14 4AD
United Kingdom
Tel: +44 (0) 20 7 425 8000
Japan
4-20-3 Ebisu, Shibuya-ku
Tokyo 150-6008
Japan
Tel: +81 (0) 3 5424 5000
Asia/Pacific
1 Austin Road West
Kowloon
Hong Kong
Tel: +852 2848 5200