Embed Size (px)
Citation preview
150
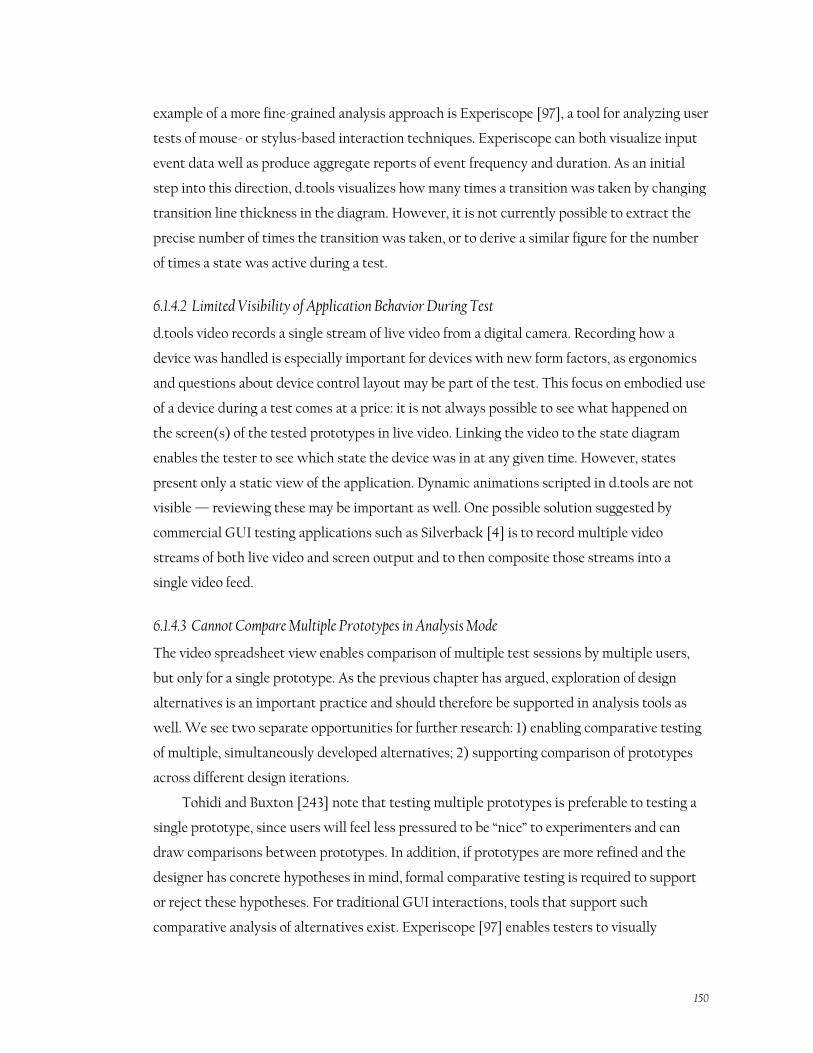
example of a more fine-grained analysis approach is Experiscope [97], a tool for analyzing user
tests of mouse- or stylus-based interaction techniques. Experiscope can both visualize input
event data well as produce aggregate reports of event frequency and duration. As an initial
step into this direction, d.tools visualizes how many times a transition was taken by changing
transition line thickness in the diagram. However, it is not currently possible to extract the
precise number of times the transition was taken, or to derive a similar figure for the number
of times a state was active during a test.
6.1.4.2 Limited Visibility of Application Behavior During Test
d.tools video records a single stream of live video from a digital camera. Recording how a
device was handled is especially important for devices with new form factors, as ergonomics
and questions about device control layout may be part of the test. This focus on embodied use
of a device during a test comes at a price: it is not always possible to see what happened on
the screen(s) of the tested prototypes in live video. Linking the video to the state diagram
enables the tester to see which state the device was in at any given time. However, states
present only a static view of the application. Dynamic animations scripted in d.tools are not
visible — reviewing these may be important as well. One possible solution suggested by
commercial GUI testing applications such as Silverback [4] is to record multiple video
streams of both live video and screen output and to then composite those streams into a
single video feed.
6.1.4.3 Cannot Compare Multiple Prototypes in Analysis Mode
The video spreadsheet view enables comparison of multiple test sessions by multiple users,
but only for a single prototype. As the previous chapter has argued, exploration of design
alternatives is an important practice and should therefore be supported in analysis tools as
well. We see two separate opportunities for further research: 1) enabling comparative testing
of multiple, simultaneously developed alternatives; 2) supporting comparison of prototypes
across different design iterations.
Tohidi and Buxton [243] note that testing multiple prototypes is preferable to testing a
single prototype, since users will feel less pressured to be ―nice‖ to experimenters and can
draw comparisons between prototypes. In addition, if prototypes are more refined and the
designer has concrete hypotheses in mind, formal comparative testing is required to support
or reject these hypotheses. For traditional GUI interactions, tools that support such
comparative analysis of alternatives exist. Experiscope [97] enables testers to visually
151
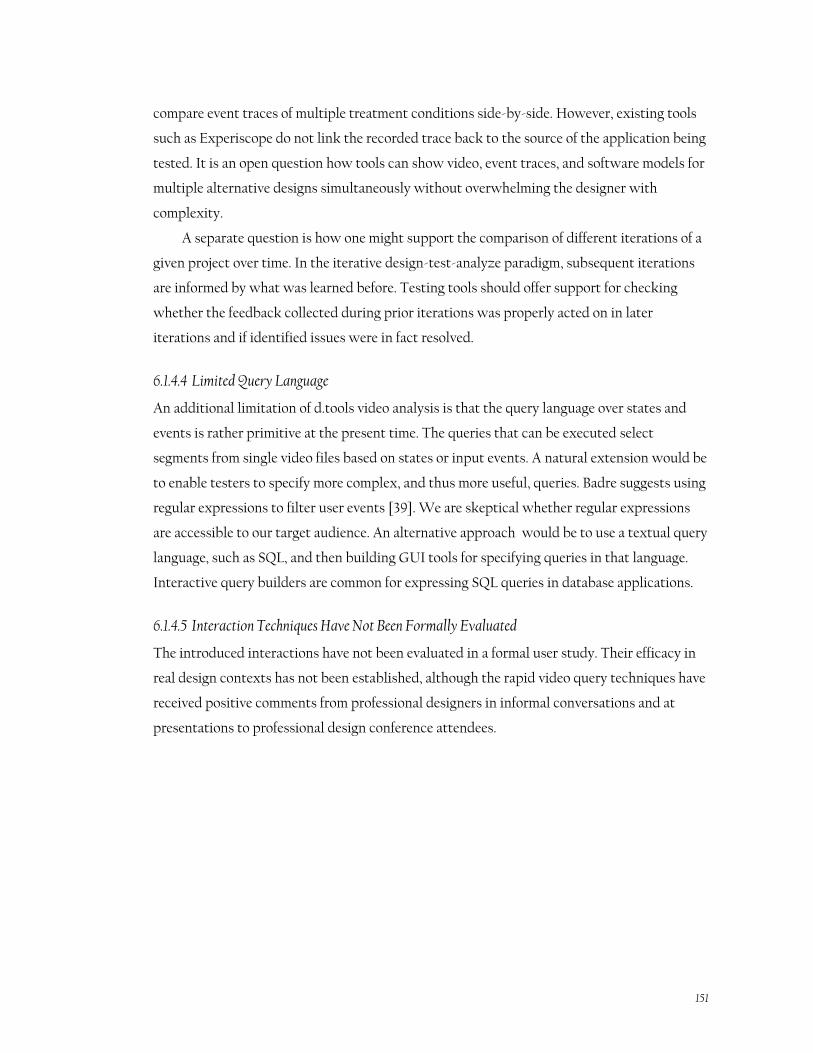
compare event traces of multiple treatment conditions side-by-side. However, existing tools
such as Experiscope do not link the recorded trace back to the source of the application being
tested. It is an open question how tools can show video, event traces, and software models for
multiple alternative designs simultaneously without overwhelming the designer with
complexity.
A separate question is how one might support the comparison of different iterations of a
given project over time. In the iterative design-test-analyze paradigm, subsequent iterations
are informed by what was learned before. Testing tools should offer support for checking
whether the feedback collected during prior iterations was properly acted on in later
iterations and if identified issues were in fact resolved.
6.1.4.4 Limited Query Language
An additional limitation of d.tools video analysis is that the query language over states and
events is rather primitive at the present time. The queries that can be executed select
segments from single video files based on states or input events. A natural extension would be
to enable testers to specify more complex, and thus more useful, queries. Badre suggests using
regular expressions to filter user events [39]. We are skeptical whether regular expressions
are accessible to our target audience. An alternative approach would be to use a textual query
language, such as SQL, and then building GUI tools for specifying queries in that language.
Interactive query builders are common for expressing SQL queries in database applications.
6.1.4.5 Interaction Techniques Have Not Been Formally Evaluated
The introduced interactions have not been evaluated in a formal user study. Their efficacy in
real design contexts has not been established, although the rapid video query techniques have
received positive comments from professional designers in informal conversations and at
presentations to professional design conference attendees.
152
6.2 CAPTURING FEEDBACK FROM OTHER DESIGNERS: D.NOTE
Interaction design in teams oscillates between individual work and team reviews and
discussions. Team reviews of user interface prototypes provide valuable critique and suggest
avenues forward [189:pp. 374-5]. However, changes proposed by others can rarely be realized
immediately: often the proposer lacks the implementation knowledge, the changes are too
complex, or the ideas are not sufficiently resolved.
In many areas of design, annotations layered on top of existing drawings and images, or
―sketches on top of sketches‖ [55], are the preferred way of capturing proposed changes. They
are rapid to construct, they enable designers to handle different levels of abstraction and
ambiguity simultaneously [66], and they serve as common ground for members with different
expertise and toolsets [205]. Individual designers later incorporate the proposed changes into
the next prototype. This annotate-review-incorporate cycle is similar to revising and
commenting on drafts of written documents [198]. While word processors offer specialized
revision tools for these tasks, such tools don‘t yet exist for the domain of interaction design.
This section demonstrates how three primary text revision techniques can be applied to
interaction design: commenting, tracking changes, and visualizing those changes. It also
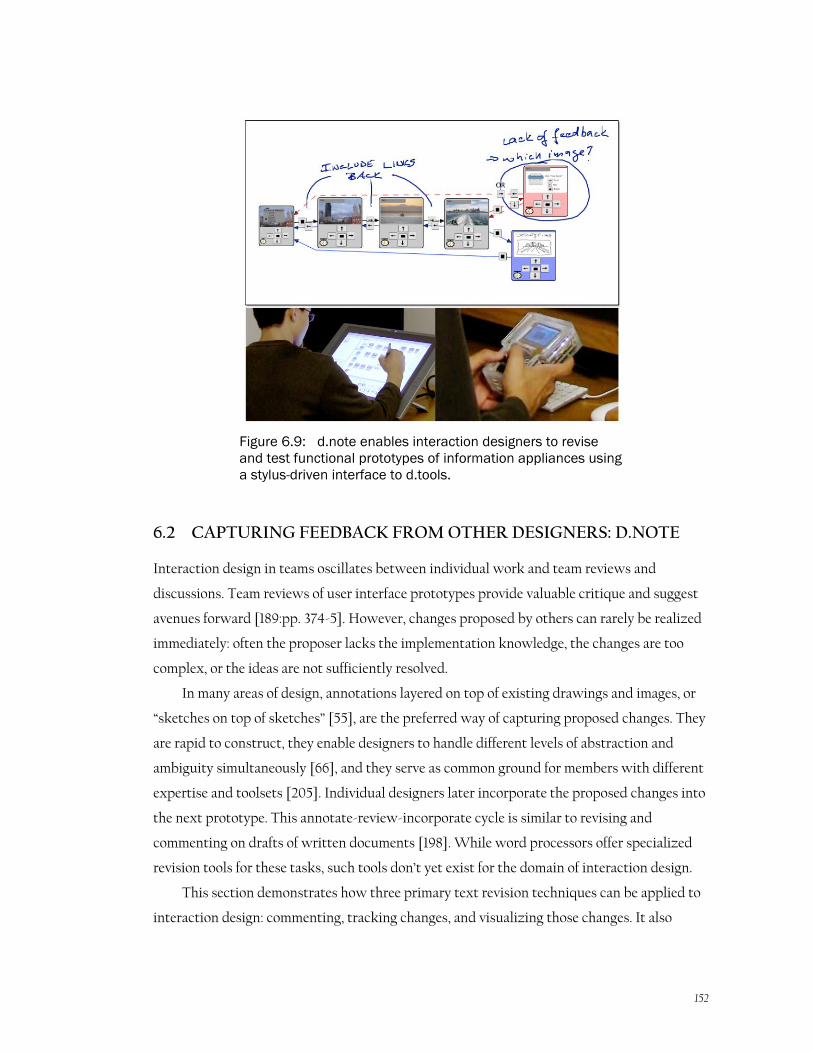
Figure 6.9: d.note enables interaction designers to revise
and test functional prototypes of information appliances using
a stylus-driven interface to d.tools.
153
introduces revision tools unique to interaction design: immediate testing of revisions and
proposing alternatives. The novel revision techniques are embodied in d.note (Figure 6.9), an
extension to d.tools. The d.note notation supports modification, commenting, and proposal of
alternatives (see Section 5.7, p. 140) for both appearance and behavior of information
appliance prototypes. Concrete modifications to behavior can be tested while a prototype is
running. Such modifications can exist alongside more abstract, high-level comments and
annotations.
This section also contributes a characterization of the benefits and tradeoffs of digital
revision tools such as d.note through two user studies. We show that the choice of revision
tool affects both what kind of revisions are expressed, as well as the ability of others to interpret
those revisions later on. Participants who used d.note to express revisions focused more on
the interaction architecture of the design, marked more elements for deletion, and wrote
fewer text comments than participants without d.note. Participants who interpreted d.note
diagrams asked for fewer clarifications than participants that interpreted freeform
annotations, but had more trouble discerning the reviser‘s intent.
In the remainder of this section, we first describe revision principles from related
domains. Current practices of UI designers were described in Section 3.1.2.2. We then
introduce d.note and its implementation. We present results from two studies of revision
expression and interpretation, and conclude by discussing the design space of revision tools.
6.2.1 REVISION PRACTICES IN OTHER DOMAINS
Interaction designers are concerned with both look and feel of applications [189]. Absent a
current, complete solution for both aspects, we can draw on important insights from revising
textual documents, source code, and movie production.
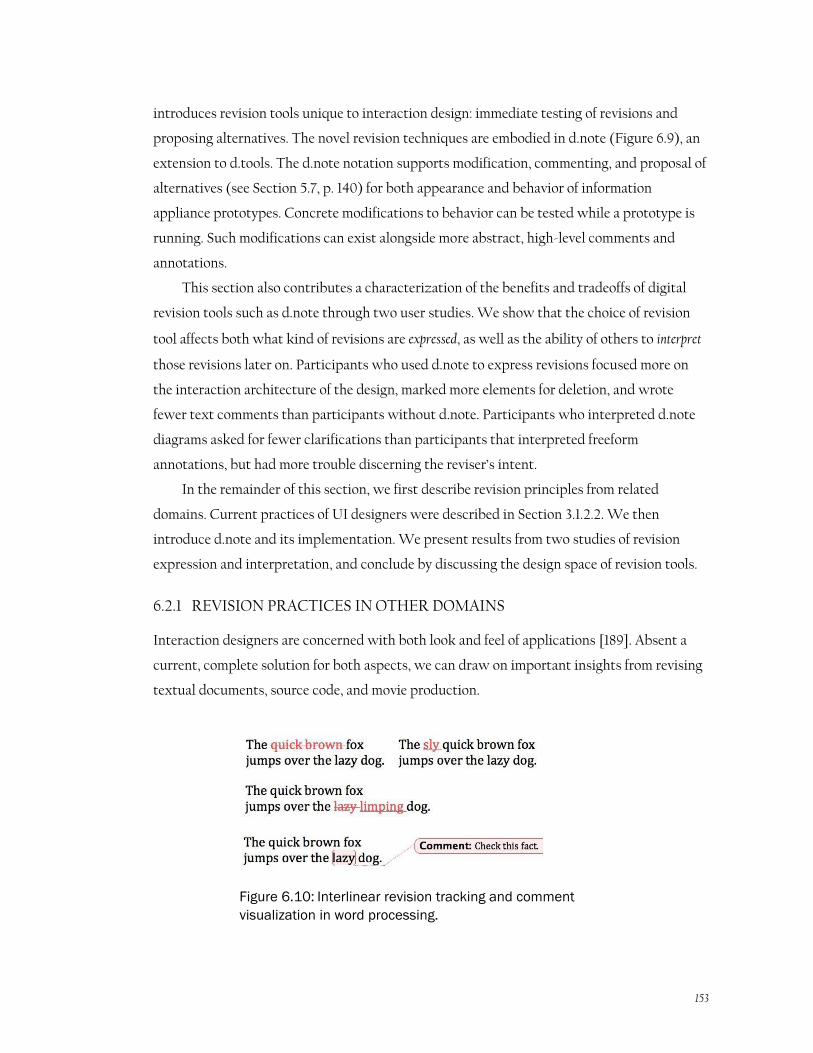
Figure 6.10: Interlinear revision tracking and comment
visualization in word processing.
154
TEXT DOCUMENTS
The fundamental actions in written document revision are history-preserving modification
(insertion, deletion) and commenting. Each operation has two components: visual syntax and
semantics. For example, in word processing, a common interlinear syntax to express deletion
is striking through the deleted text (Figure 6.10); the semantics are to remove the stricken
text from the next version of the document, should the revision be accepted. Original and
modification are visible simultaneously, to communicate the nature of a change. Furthermore,
edits are visually distinguished from the base version so the recipient can rapidly identify
them. When editing documents collaboratively, different social roles of co-author,
commenter, and reader exist [198]. Offering ways to modify the underlying text as well as
adding meta-content that suggests further modification serves these different roles.
SOURCE CODE DOCUMENTS
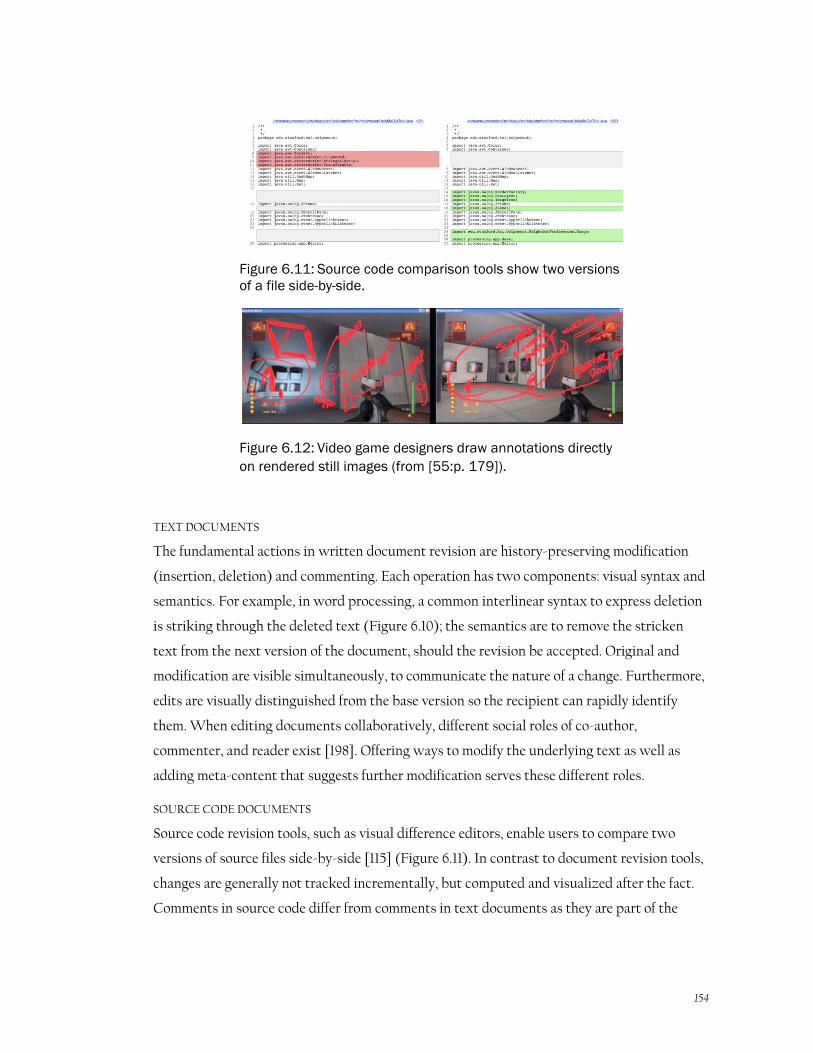
Source code revision tools, such as visual difference editors, enable users to compare two
versions of source files side-by-side [115] (Figure 6.11). In contrast to document revision tools,
changes are generally not tracked incrementally, but computed and visualized after the fact.
Comments in source code differ from comments in text documents as they are part of the
Figure 6.11: Source code comparison tools show two versions
of a file side-by-side.
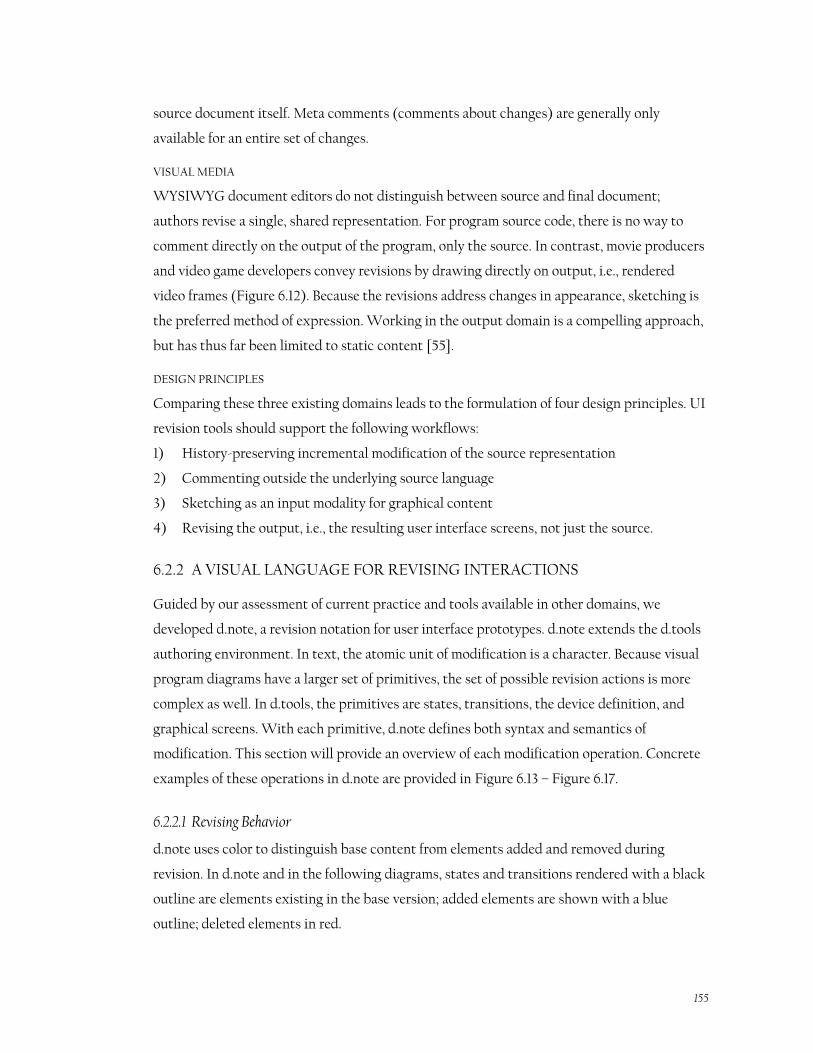
Figure 6.12: Video game designers draw annotations directly
on rendered still images (from [55:p. 179]).
155
source document itself. Meta comments (comments about changes) are generally only
available for an entire set of changes.
VISUAL MEDIA
WYSIWYG document editors do not distinguish between source and final document;
authors revise a single, shared representation. For program source code, there is no way to
comment directly on the output of the program, only the source. In contrast, movie producers
and video game developers convey revisions by drawing directly on output, i.e., rendered
video frames (Figure 6.12). Because the revisions address changes in appearance, sketching is
the preferred method of expression. Working in the output domain is a compelling approach,
but has thus far been limited to static content [55].
DESIGN PRINCIPLES
Comparing these three existing domains leads to the formulation of four design principles. UI
revision tools should support the following workflows:
1) History-preserving incremental modification of the source representation
2) Commenting outside the underlying source language
3) Sketching as an input modality for graphical content
4) Revising the output, i.e., the resulting user interface screens, not just the source.
6.2.2 A VISUAL LANGUAGE FOR REVISING INTERACTIONS
Guided by our assessment of current practice and tools available in other domains, we
developed d.note, a revision notation for user interface prototypes. d.note extends the d.tools
authoring environment. In text, the atomic unit of modification is a character. Because visual
program diagrams have a larger set of primitives, the set of possible revision actions is more
complex as well. In d.tools, the primitives are states, transitions, the device definition, and
graphical screens. With each primitive, d.note defines both syntax and semantics of
modification. This section will provide an overview of each modification operation. Concrete
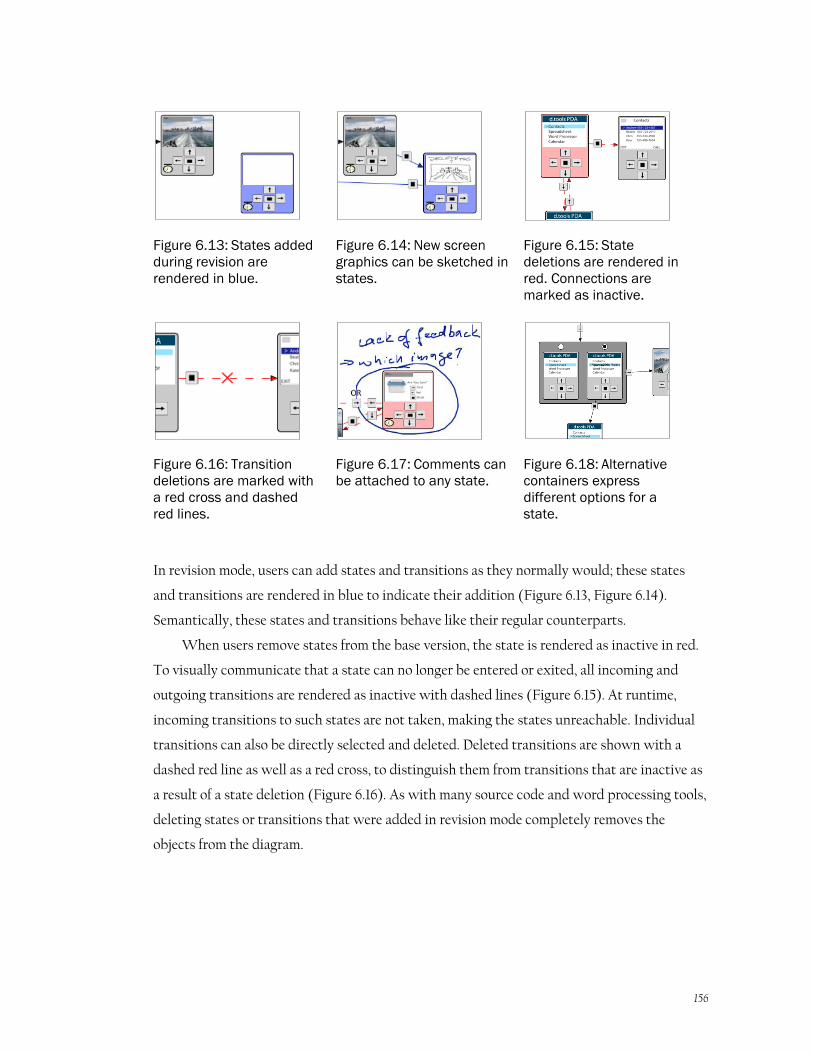
examples of these operations in d.note are provided in Figure 6.13 – Figure 6.17.
6.2.2.1 Revising Behavior
d.note uses color to distinguish base content from elements added and removed during
revision. In d.note and in the following diagrams, states and transitions rendered with a black
outline are elements existing in the base version; added elements are shown with a blue
outline; deleted elements in red.
156
In revision mode, users can add states and transitions as they normally would; these states
and transitions are rendered in blue to indicate their addition (Figure 6.13, Figure 6.14).
Semantically, these states and transitions behave like their regular counterparts.
When users remove states from the base version, the state is rendered as inactive in red.
To visually communicate that a state can no longer be entered or exited, all incoming and
outgoing transitions are rendered as inactive with dashed lines (Figure 6.15). At runtime,
incoming transitions to such states are not taken, making the states unreachable. Individual
transitions can also be directly selected and deleted. Deleted transitions are shown with a
dashed red line as well as a red cross, to distinguish them from transitions that are inactive as
a result of a state deletion (Figure 6.16). As with many source code and word processing tools,
deleting states or transitions that were added in revision mode completely removes the
objects from the diagram.
Figure 6.13: States added
during revision are
rendered in blue.
Figure 6.14: New screen
graphics can be sketched in
states.
Figure 6.15: State
deletions are rendered in
red. Connections are
marked as inactive.
Figure 6.16: Transition
deletions are marked with
a red cross and dashed
red lines.
Figure 6.17: Comments can
be attached to any state.
Figure 6.18: Alternative
containers express
different options for a
state.
157
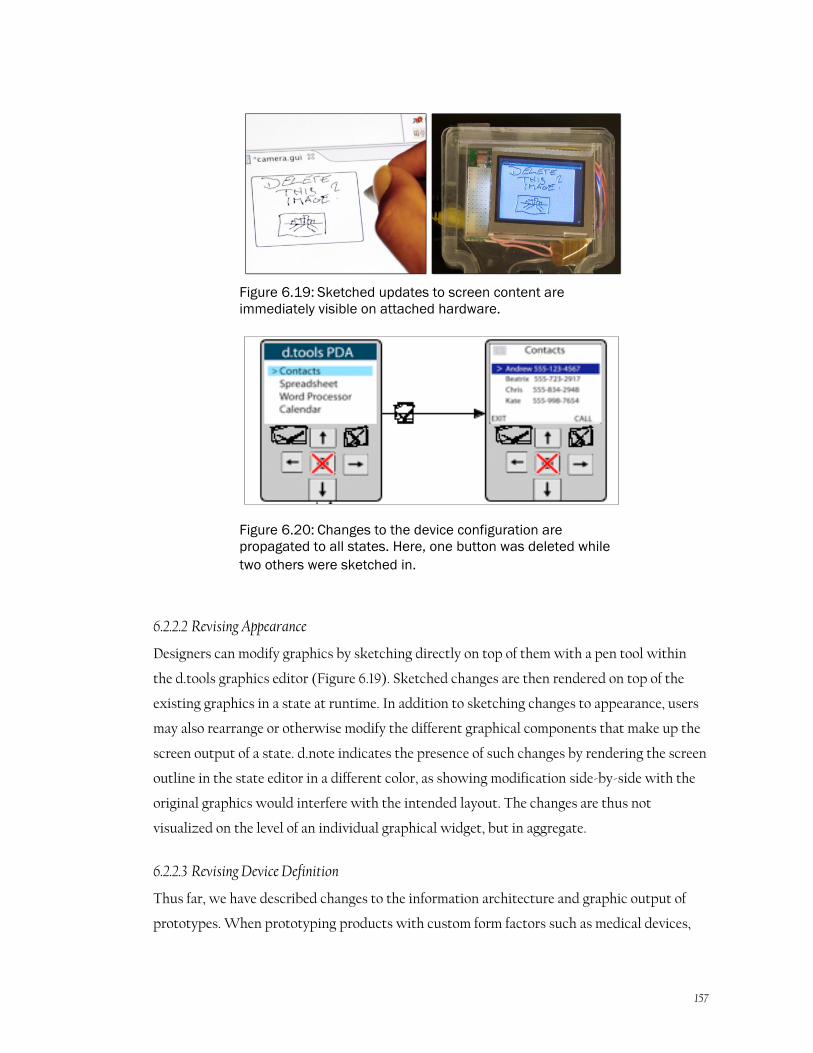
6.2.2.2 Revising Appearance
Designers can modify graphics by sketching directly on top of them with a pen tool within
the d.tools graphics editor (Figure 6.19). Sketched changes are then rendered on top of the
existing graphics in a state at runtime. In addition to sketching changes to appearance, users
may also rearrange or otherwise modify the different graphical components that make up the
screen output of a state. d.note indicates the presence of such changes by rendering the screen
outline in the state editor in a different color, as showing modification side-by-side with the
original graphics would interfere with the intended layout. The changes are thus not
visualized on the level of an individual graphical widget, but in aggregate.
6.2.2.3 Revising Device Definition
Thus far, we have described changes to the information architecture and graphic output of
prototypes. When prototyping products with custom form factors such as medical devices,
Figure 6.19: Sketched updates to screen content are
immediately visible on attached hardware.
Figure 6.20: Changes to the device configuration are
propagated to all states. Here, one button was deleted while
two others were sketched in.
158
the set of I/O components used on the device may also be subject to change and discussion.
When revising designs in d.note, users can introduce new input elements by sketching them
in the device editor (Figure 6.20). Prior to binding the new component to an actual piece of
hardware, designers can simulate its input during testing using the d.tools simulation tool
(see Section 4.1.3). Currently, the d.note implementation does not support adding output
devices through sketching; we believe adding output within this paradigm would be fairly
straightforward.
6.2.2.4 Commenting
In addition to functional revision commands, users can sketch comments on the canvas of
device, graphics, and storyboard editors (Figure 6.17). Any stroke that is not recognized as a
revision command is rendered as ink. This allows tentative or ambiguous change proposals to
coexist with concrete changes. Inked comments are bound to the closest state so they
automatically move with that state when the user rearranges the diagram.
6.2.2.5 Proposing Alternatives
As covered in Section 5.7 (p. 140), users can introduce alternatives for appearance and
application logic. We summarize the functionality of alternative containers again briefly:
d.tools represents the alternative by duplicating the original state and visually encapsulating
both original and alternative (Figure 6.18). The original state‘s incoming connections are
rerouted to point to the encapsulating container. Each state maintains its own set of outgoing
transitions. To define which of the alternative states should become active when control
transfers to an alternative set, the set container shows radio buttons, one above each
contained state. To reduce visual clutter, only outgoing transitions of the active alternative
are shown; other outgoing transitions are hidden until that alternative is activated.
6.2.3 SCENARIO
The following scenario summarizes the benefits d.note provides to interaction design teams.
Adam is designing a user interface for a new digital camera with on-camera image editing
functions. To get feedback, he drops his latest prototype off in Betty‘s office. Betty picks up
the camera prototype, and tries to crop, pan and color balance one of the pictures that Adam
preloaded on the prototype. She notices that exiting to the top level menu is handled
inconsistently in different screens. She opens up the d.tools diagram for the prototype and,
with d.note enabled, changes the transitions from those screens to the menu state. She next
159
notices that the image delete functionality is lacking a confirmation screen – images are
deleted right away. To highlight this omission, Betty creates a new state and sketches a
rudimentary confirmation dialog, which she connects to the rest of the diagram with new
transitions so she can immediately test the new control flow. Betty is not convinced that the
mapping of available buttons to crop an image region is optimal. She selects the crop state and
creates an alternative for it. In the alternative, she redirects button input and adds a comment
for Adam to compare the two implementations. She also thinks that the current interface for
balancing colors via RGB sliders is cumbersome. Since she does not have time to change the
implementation, she circles the corresponding states and leaves a note to consider using an
alternative color space instead.
6.2.4 THE D.NOTE JAVA IMPLEMENTATION
d.note was implemented as an extension to d.tools. As such, it was written in Java 5 and
makes use of the Eclipse platform, specifically the Graphical Editing Framework (GEF) [24].
d.note runs on both Windows and Mac OS X operating systems.
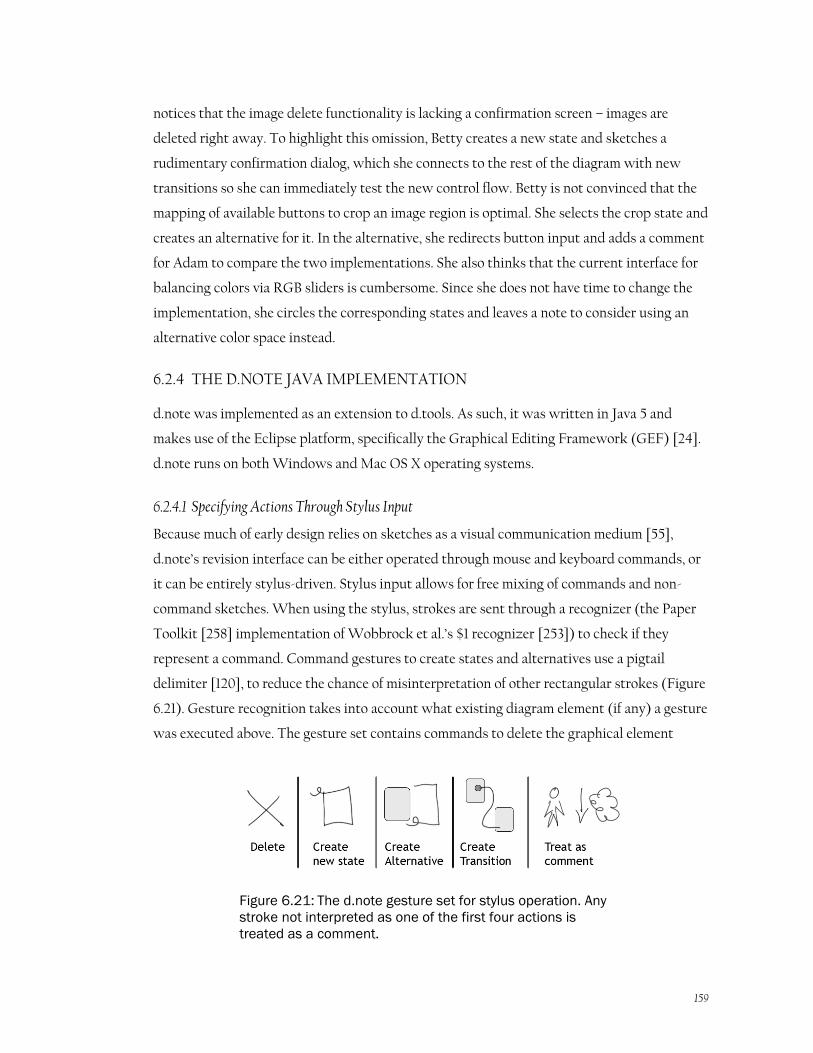
6.2.4.1 Specifying Actions Through Stylus Input
Because much of early design relies on sketches as a visual communication medium [55],
d.note‘s revision interface can be either operated through mouse and keyboard commands, or
it can be entirely stylus-driven. Stylus input allows for free mixing of commands and non-
command sketches. When using the stylus, strokes are sent through a recognizer (the Paper
Toolkit [258] implementation of Wobbrock et al.‘s $1 recognizer [253]) to check if they
represent a command. Command gestures to create states and alternatives use a pigtail
delimiter [120], to reduce the chance of misinterpretation of other rectangular strokes (Figure
6.21). Gesture recognition takes into account what existing diagram element (if any) a gesture
was executed above. The gesture set contains commands to delete the graphical element
Figure 6.21: The d.note gesture set for stylus operation. Any
stroke not interpreted as one of the first four actions is
treated as a comment.
160
underneath the gesture, and to create new states, transitions and alternatives. All other
strokes are interpreted as comments. In addition to providing drawing and gesture
recognition, d.note extends the d.tools runtime system to correctly handle the interaction
logic semantics of its notation, e.g., ignore states marked for deletion.
6.2.5 EVALUATION: COMPARING INTERACTIVE & STATIC REVISIONS
To understand the user experience of the interactive revision techniques manifest in d.note,
we conducted two studies: the first compared authoring of revisions with and without d.note;
the second compared interpretation of revisions with and without d.note. We recruited
product design and HCI students at our university. Because the required expertise in creating
UIs limited recruitment, we opted for a within-subjects design, with counterbalancing and
randomization where appropriate.
6.2.5.1 Study 1: Authoring Revisions
In the domain of word processing, Wojahn [254] found that the functionality provided by a
revision interface influenced the number and type of problems discussed. Do users revise
interaction designs differently with a structured, interactive tool than by making freeform,
static annotations on a diagram?
METHOD
We recruited twelve participants. Participants each completed two revision tasks: one
without d.note and one with. The non-d.note condition was always assigned first to prevent
exposure to d.note notation from influencing freeform annotation patterns. Each revision task
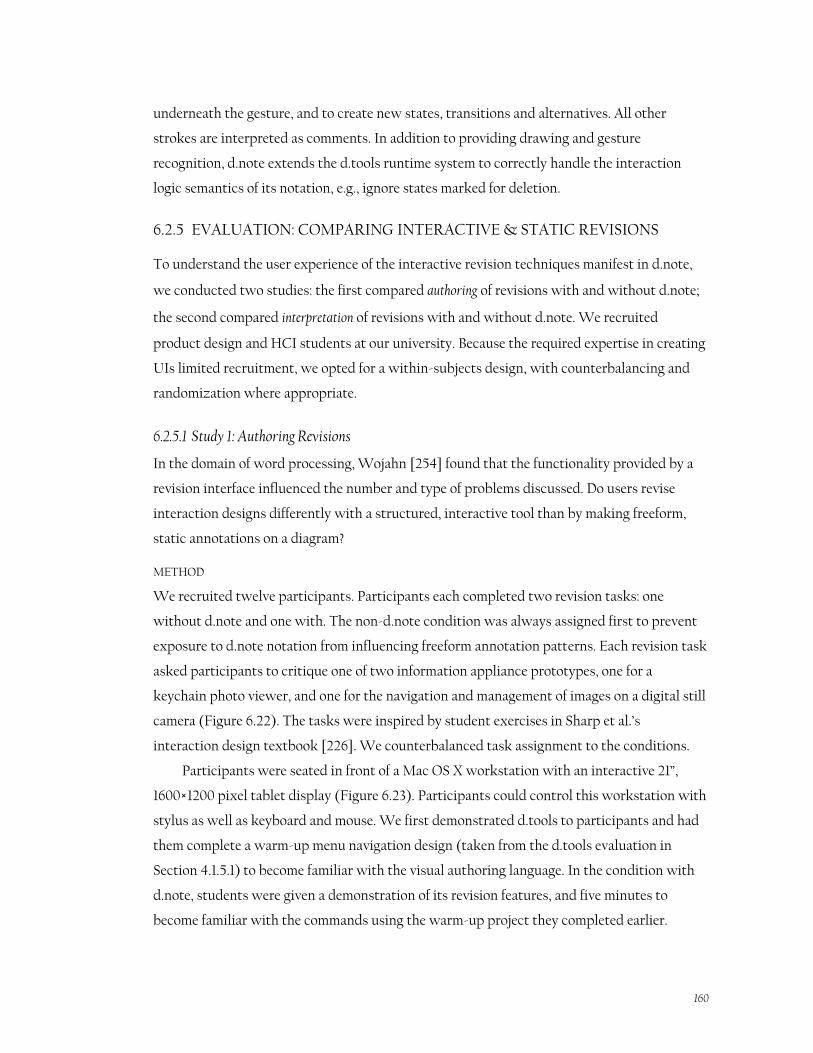
asked participants to critique one of two information appliance prototypes, one for a
keychain photo viewer, and one for the navigation and management of images on a digital still
camera (Figure 6.22). The tasks were inspired by student exercises in Sharp et al.‘s
interaction design textbook [226]. We counterbalanced task assignment to the conditions.
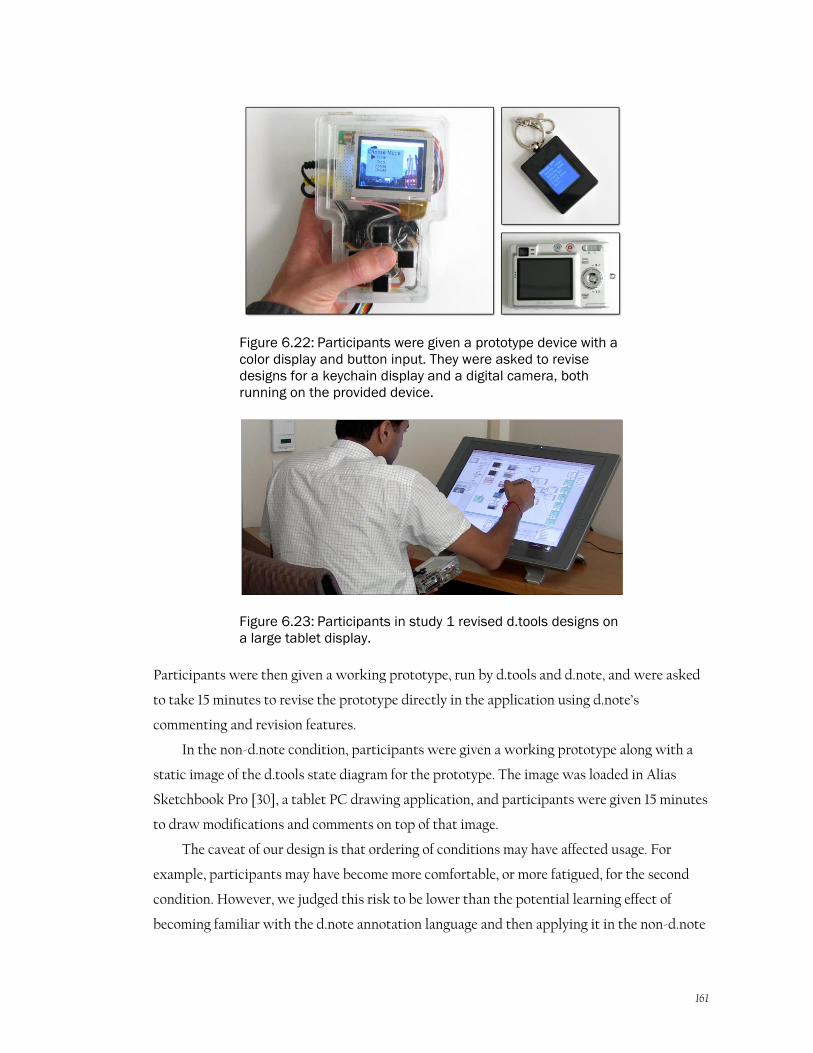
Participants were seated in front of a Mac OS X workstation with an interactive 21‖,
1600×1200 pixel tablet display (Figure 6.23). Participants could control this workstation with
stylus as well as keyboard and mouse. We first demonstrated d.tools to participants and had
them complete a warm-up menu navigation design (taken from the d.tools evaluation in
Section 4.1.5.1) to become familiar with the visual authoring language. In the condition with
d.note, students were given a demonstration of its revision features, and five minutes to
become familiar with the commands using the warm-up project they completed earlier.
161
Participants were then given a working prototype, run by d.tools and d.note, and were asked
to take 15 minutes to revise the prototype directly in the application using d.note‘s
commenting and revision features.
In the non-d.note condition, participants were given a working prototype along with a
static image of the d.tools state diagram for the prototype. The image was loaded in Alias
Sketchbook Pro [30], a tablet PC drawing application, and participants were given 15 minutes
to draw modifications and comments on top of that image.
The caveat of our design is that ordering of conditions may have affected usage. For
example, participants may have become more comfortable, or more fatigued, for the second
condition. However, we judged this risk to be lower than the potential learning effect of
becoming familiar with the d.note annotation language and then applying it in the non-d.note
Figure 6.22: Participants were given a prototype device with a
color display and button input. They were asked to revise
designs for a keychain display and a digital camera, both
running on the provided device.
Figure 6.23: Participants in study 1 revised d.tools designs on
a large tablet display.
162
condition. After the design reviews, participants completed a survey that elicited high-level
summative feedback in free response format.
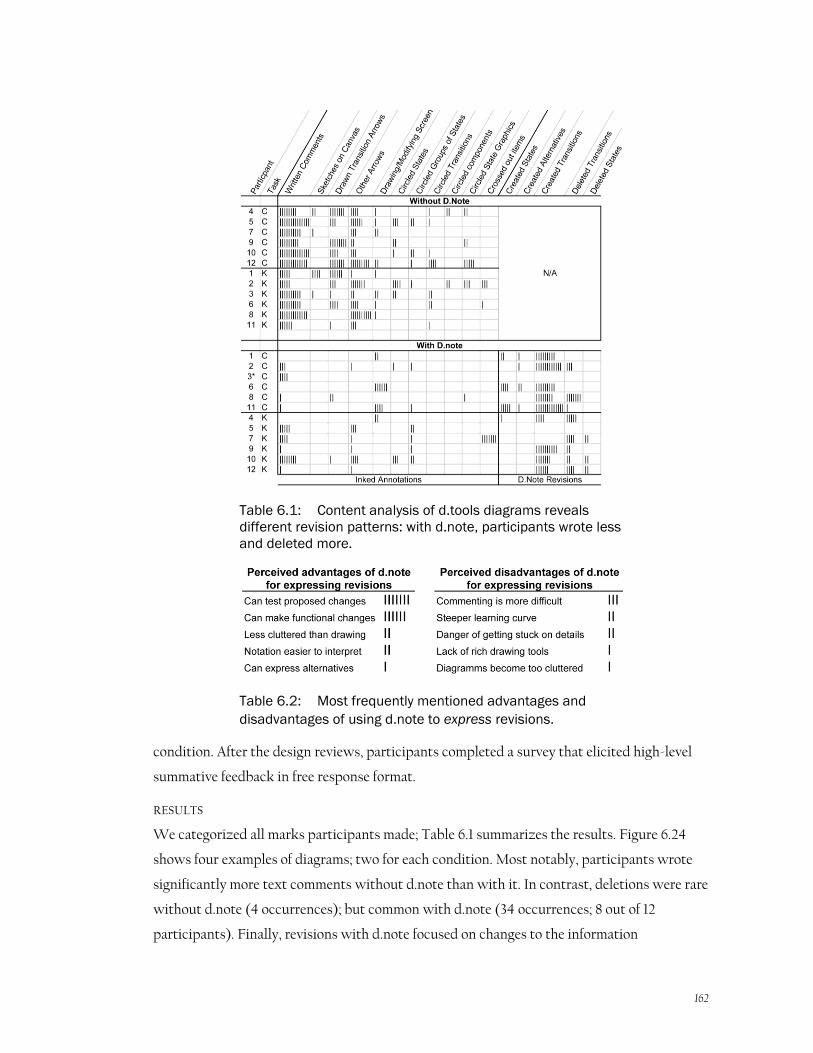
RESULTS
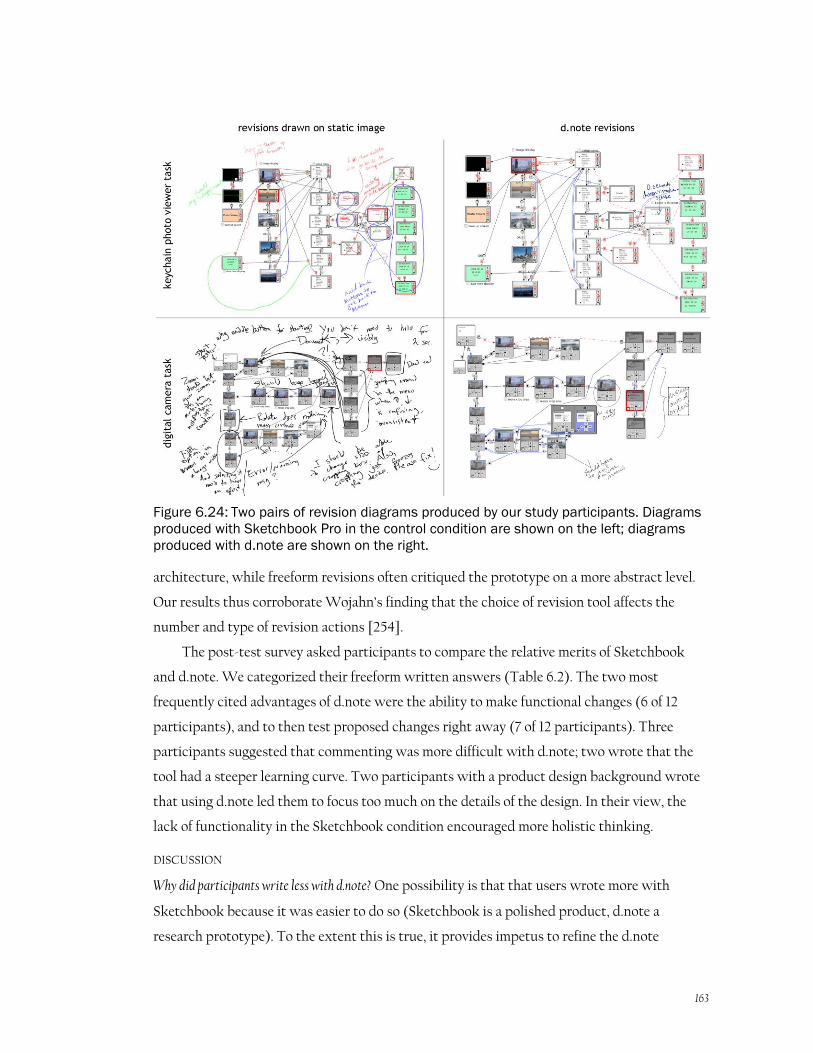
We categorized all marks participants made; Table 6.1 summarizes the results. Figure 6.24
shows four examples of diagrams; two for each condition. Most notably, participants wrote
significantly more text comments without d.note than with it. In contrast, deletions were rare
without d.note (4 occurrences); but common with d.note (34 occurrences; 8 out of 12
participants). Finally, revisions with d.note focused on changes to the information
Table 6.1: Content analysis of d.tools diagrams reveals
different revision patterns: with d.note, participants wrote less
and deleted more.
Table 6.2: Most frequently mentioned advantages and
disadvantages of using d.note to express revisions.
163
architecture, while freeform revisions often critiqued the prototype on a more abstract level.
Our results thus corroborate Wojahn‘s finding that the choice of revision tool affects the
number and type of revision actions [254].
The post-test survey asked participants to compare the relative merits of Sketchbook
and d.note. We categorized their freeform written answers (Table 6.2). The two most
frequently cited advantages of d.note were the ability to make functional changes (6 of 12
participants), and to then test proposed changes right away (7 of 12 participants). Three
participants suggested that commenting was more difficult with d.note; two wrote that the
tool had a steeper learning curve. Two participants with a product design background wrote
that using d.note led them to focus too much on the details of the design. In their view, the
lack of functionality in the Sketchbook condition encouraged more holistic thinking.
DISCUSSION
Why did participants write less with d.note? One possibility is that that users wrote more with
Sketchbook because it was easier to do so (Sketchbook is a polished product, d.note a
research prototype). To the extent this is true, it provides impetus to refine the d.note
Figure 6.24: Two pairs of revision diagrams produced by our study participants. Diagrams
produced with Sketchbook Pro in the control condition are shown on the left; diagrams
produced with d.note are shown on the right.
164
implementation, but tells us little about the relative efficacy of a static and dynamic approach
to design revision.
More fundamentally, d.note may enable users to capture intended changes in a more
succinct form than text comments. Four participants explicitly wrote that d.note reduced the
need for long, explanatory text comments in their survey responses: ―[with d.note] making a
new state is a lot shorter than writing a comment explaining a new state‖; ―[without d.note] I
felt I had to explain my sketches.‖ d.note‘s rich semantics enable a user‘s input to be more
economical: an added or deleted transition is unambiguously visualized as such. In d.note,
users can implement concrete changes interactively; only abstract or complex changes require
comments. Without d.note, both these functions have to be performed through the same
notation (drawing), and participants explained their graphic marks with additional text
because of the ambiguity. In our data, inked transition arrows drawn without d.note (44
drawn transitions) were replaced with functional transitions with d.note (78 functional
transitions added; only 3 drawn as comments).
Though participants could have disregarded the revision tools and only commented with
ink, the mere option of having functional revision tools available had an effect on their
activity. This tendency has been noted in other work [55,156] as well.
Why did participants delete more with d.note? While participants created new states and
transitions in both conditions, deletions were rare without d.note. Deletions may have been
implied, e.g., drawing a new transition to replace a previously existing one, but these
substitutions were rarely noted explicitly. We suggest that deletions with d.note were
encouraged by the ability to immediately test concrete changes. Quick revise-test cycles
exposed areas in which diagrams had ambiguous control structure (more than one transition
exiting a state on the same event).
Why were more changes to information architecture made with d.note? The majority of revision
actions with d.note concerned the flow of control: adding and deleting transitions and states.
In the Sketchbook condition, participants also revised the information architecture, but
frequently focused on more abstract changes (Example comment: ―Make [feedback] messages
more apparent‖). The scarcity of such comments with d.note is somewhat surprising, as
freeform commenting was equally available. One possible explanation is that participants
focused on revising information architecture because more powerful techniques were at hand
to do so. Each tool embodies a preferred method of use; even if other styles of work remain
possible, users are driven to favor the style for which the tool offers the most leverage.
165
6.2.5.2 Study 2: Interpreting Revisions
The first study uncovered differences in expressing revisions. Are there similar characteristic
differences in interpreting revisions created with the two tools?
METHOD
Eight (different) participants interpreted the revisions created by participants of the first
study. After a demonstration and warm-up task (as in study 1), participants were shown the
two working prototypes (camera and key chain) and given time to explore. Next, participants
were shown screenshots of annotated diagrams from the first study (Figure 6.24) on a second
display. Participants were asked to prepare two lists in a word processor: one that
enumerated all revision suggestions that were clear and understandable to them; and a second
list with questions for clarification about suggestions they did not understand. Participants
completed this task four times: one d.note and one freeform diagram were chosen at random
for each of the two prototypes.
RESULTS
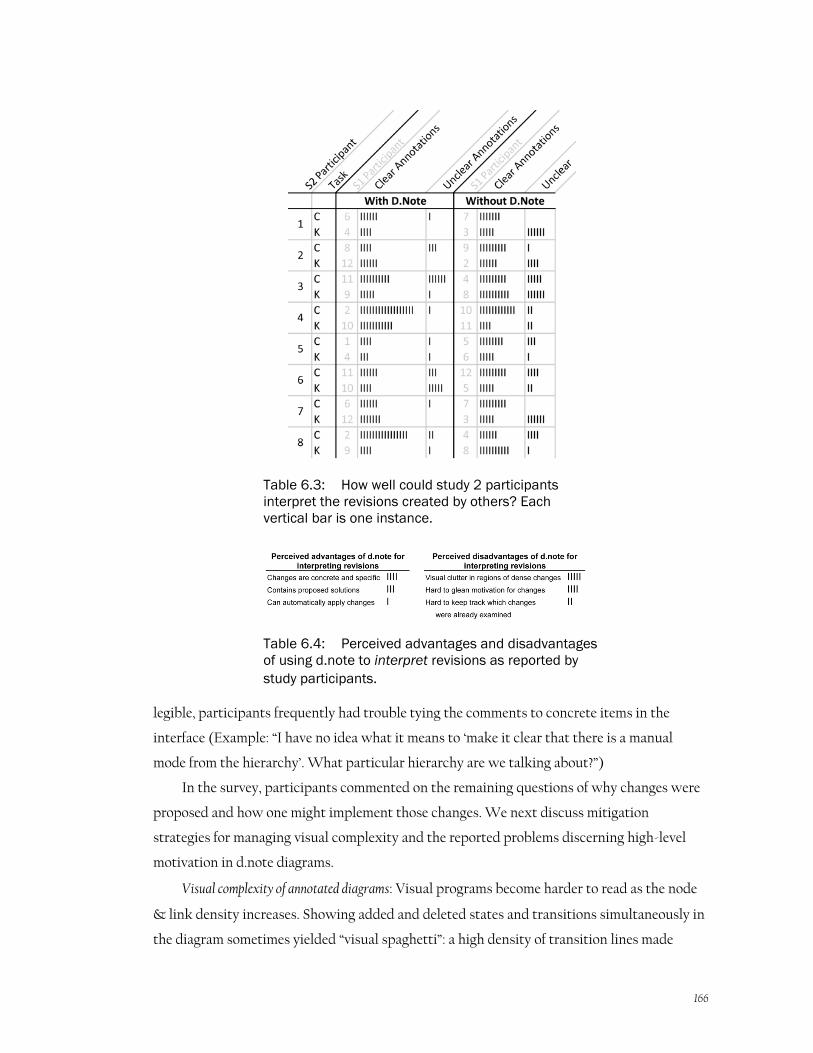
The cumulative count of clear and unclear revision suggestions for all participants are shown
in Table 6.3. Participants, on average, requested 1.3 fewer clarifications on revisions when
using d.note than when sketching on static images (two-sample t(29)=1.90, p=0.03).
The post-test survey asked participants to compare the relative merits of interpreting
diagrams revised with d.note and Sketchbook. The most frequently mentioned benefits arose
from having a notation with specified semantics (Table 6.4): revisions were more concrete,
specific, and actionable. Frequently mentioned drawbacks were visual complexity and
problems discerning high-level motivation in d.note diagrams.
DISCUSSION
Why did participants ask for fewer clarifications with d.note? When interpreting revised diagrams,
participants are faced with three questions: First, what is the proposed change? Second, why
was this change proposed? Third, how would I realize that change? The structure of the
second user study asked participants to explicitly answer the first question by transcribing
all proposed changes. We suggest that the formal notation in d.note decreased the need for
clarification for two reasons. First, the presence of a formal notation resulted in a smaller
number of handwritten comments, and hence fewer problems with legibility (Example
without d.note: ―Change 6 — unreadable‖). Second, because of the ad-hoc nature of
handwritten annotation schemes in absence of a formal system, even if comments were
166
legible, participants frequently had trouble tying the comments to concrete items in the
interface (Example: ―I have no idea what it means to ‗make it clear that there is a manual
mode from the hierarchy‘. What particular hierarchy are we talking about?‖)
In the survey, participants commented on the remaining questions of why changes were
proposed and how one might implement those changes. We next discuss mitigation
strategies for managing visual complexity and the reported problems discerning high-level
motivation in d.note diagrams.
Visual complexity of annotated diagrams: Visual programs become harder to read as the node
& link density increases. Showing added and deleted states and transitions simultaneously in
the diagram sometimes yielded ―visual spaghetti‖: a high density of transition lines made
Table 6.3: How well could study 2 participants
interpret the revisions created by others? Each
vertical bar is one instance.
Table 6.4: Perceived advantages and disadvantages
of using d.note to interpret revisions as reported by
study participants.
167
distinguishing and following individual lines hard. The connection density problem becomes
worse when state alternatives are introduced because each alternative for a state has an
independent set of outbound transitions.
In response, we already modified the drawing algorithm for state alternatives to only
show outgoing connections for the currently active alternative within an alternative
container. Additional simplification techniques are needed though. One option to selectively
lower transition density in the diagram while preserving relevant context would be to only
render direct incoming and outgoing transitions for a highlighted state and hide all other
transitions on demand.
Capturing the motivation for changes: While many handwritten comments focused on high-
level goals without specifying implementations, tracked changes make the opposite tradeoff:
the implementation is obvious since it is already specified, but the motivation behind the
change can remain opaque. We see two possible avenues to address this challenge. First,
when using change tracking, multiple individual changes may be semantically related. For
example, deleting one state and adding a new state in its stead are two actions that express a
desired single intent of replacement. The authoring tool should detect such related actions
automatically or at least enable users to specify groups of related changes manually. Second,
even though freeform commenting was available in d.note, it was not used frequently.
Therefore, techniques that proactively encourage users to capture the rationale for changes
may be useful.
6.2.6 LIMITATIONS & EXTENSIONS
The d.note project introduced a notation and interaction techniques for managing revisions of
user interface designs expressed as state diagrams. Diagrams can be modified and annotated.
The particular implementation of revision techniques in d.note represents only one point
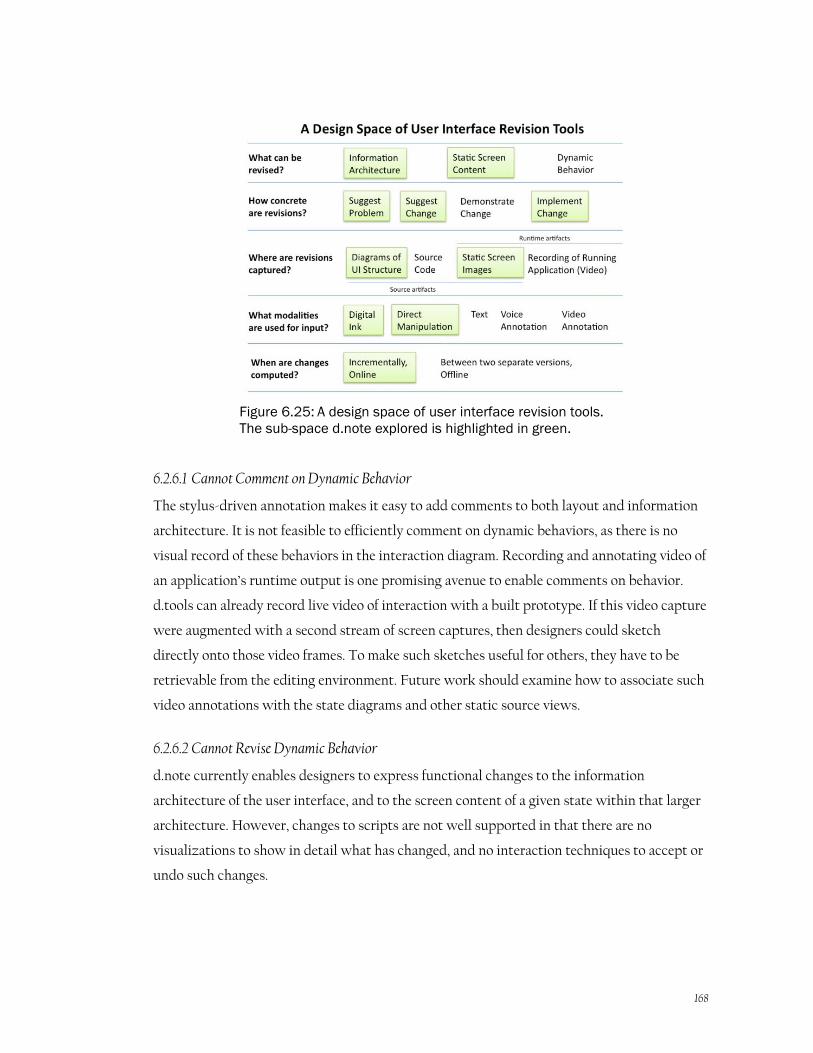
solution in a larger design space of possible user interface revision tools. The main salient
dimensions we considered during our work are summarized in Figure 6.25. This table reveals
limitations and additional areas of exploration we have not touched upon so far.
168
6.2.6.1 Cannot Comment on Dynamic Behavior
The stylus-driven annotation makes it easy to add comments to both layout and information
architecture. It is not feasible to efficiently comment on dynamic behaviors, as there is no
visual record of these behaviors in the interaction diagram. Recording and annotating video of
an application‘s runtime output is one promising avenue to enable comments on behavior.
d.tools can already record live video of interaction with a built prototype. If this video capture
were augmented with a second stream of screen captures, then designers could sketch
directly onto those video frames. To make such sketches useful for others, they have to be
retrievable from the editing environment. Future work should examine how to associate such
video annotations with the state diagrams and other static source views.
6.2.6.2 Cannot Revise Dynamic Behavior
d.note currently enables designers to express functional changes to the information
architecture of the user interface, and to the screen content of a given state within that larger
architecture. However, changes to scripts are not well supported in that there are no
visualizations to show in detail what has changed, and no interaction techniques to accept or
undo such changes.
Figure 6.25: A design space of user interface revision tools.
The sub-space d.note explored is highlighted in green.
169
6.2.6.3 How To Support Identified Revision Principles for Source Code?
The presented design space finally raises the question how one might offer the benefits of a
revision tool such as d.note for user interfaces specified entirely in source code. The particular
revision techniques of d.note are based on a visual language that shows both user interface
content and information architecture in the same environment. The techniques should
therefore transfer to other visual control-flow tools such as DENIM [171] or SUEDE [148]. But
what about user interfaces that are not programmed visually? Existing source revision
techniques for non-visual programs do not permit designers to comment or revise the output
of their application. Future research should investigate if sketch-based input and annotation
in the output domain of a program can be transferred to such applications.
170
CHAPTER 7 CONCLUSIONS AND FUTURE WORK
This dissertation has shown how to support creation, exploration, and iteration of user
interface prototypes for ubiquitous computing applications. This final chapter recapitulates
the contributions made by the presented systems, and concludes with an outlook on future
work.
7.1 RESTATEMENT OF CONTRIBUTIONS
We introduced principles and systems for prototyping user interfaces that span physical and
digital interactions. Three areas of technical contributions can be distinguished:
1) Techniques for authoring user interfaces with non-traditional input/output
configurations. This dissertation contributed:
a. Rapid authoring of interaction logic through a novel combination of storyboard
diagrams for information architecture with imperative programming for interactive
behaviors.
b. Demonstration-based definition of discrete input events from continuous sensor data
streams enabled by a combination of pattern recognition with a direct
manipulation interface for the generalization criteria of the recognition
algorithms.
c. Management of input/output component configurations for interface prototypes through
an editable virtual representation of the physical device being built. This
representation reduces cognitive friction by collapsing levels of abstraction; it
is enabled by a custom hardware interface with a plug-and-play component
architecture.
2) Principles and techniques for exploring multiple user interface alternatives. The
dissertation contributed:
a. Techniques for efficiently defining and managing multiple alternatives of user interfaces in
procedural source code and visual control flow diagrams.
b. User-directed generation of control interfaces to modify relevant variables of user
interfaces at runtime.
171
c. Support for sequential and parallel comparison of user interface alternatives through
parallel execution, selectively parallel user input, and management of
parameter configurations across executions.
d. Implementations of the runtime techniques for three different platforms: desktop PCs,
mobile phones, and microcontrollers.
3) Techniques for capturing feedback from users and design team members on user
interface prototypes, and integrating that feedback into the design environment. The
dissertation contributed:
a. Timestamp correlation between live video, software states, and input events during a
usability test of a prototype to enable rapid semantic access of video during
later analysis.
b. Novel video query techniques: query by state selection where users access video
segments by selecting states in a visual storyboard; and query by input
demonstration where sections of usability video are retrieved through
demonstrating, on a physical device prototype, the kind of input that should
occur in the video.
c. A visual notation and stylus-controlled gestural command set for revising user interfaces
expressed as control flow diagrams.
The dissertation also provided evidence, through laboratory studies and class deployments,
that the introduced techniques are successful. In particular, the dissertation contributed:
1) Evidence that the introduced authoring methods for sensor-based interaction are
accessible and expressive through two laboratory evaluations and two class
deployments.
2) Evidence from a laboratory study that the techniques for managing interface alternatives
enable designers to explore a wider range of design options, faster.
3) Evidence from two laboratory studies that an interactive revision notation for interfaces
leads to more concrete and actionable revisions.
7.2 FUTURE WORK
Future work in the space of design tools outlined by this dissertation falls into two general
categories. First, additional research can extend the introduced systems and techniques, to
overcome present limitations or to take logical next steps that enhance expressivity and
utility. Second, reconsidering the assumptions underlying the systems described in this thesis
172
yields additional opportunities for different types of tools that can support a broader range of
authoring tasks. Important limitations and possible extensions were discussed at the
conclusion of each preceding chapter, in Sections 4.1.7 (d.tools, p. 92), 4.2.6 (Exemplar, p.
116), 5.6 (Juxtapose, p. 136), 6.1.4 (d.tools video analysis, p. 149), and 6.2.6 (d.note, p. 167). This
chapter briefly discusses some larger future research directions.
In retrospect, most of the work presented in this dissertation implicitly shares a set of
assumptions: that an individual designer creates one or more alternative designs for a single device,
starting from scratch, through a desktop-based graphical user interface tool. Changing any of these
four core assumptions yields areas of future work that suggest different types of design tools.
We review each of these four areas in turn.
7.2.1 DESIGN TOOLS THAT SUPPORT COLLABORATION
Most existing authoring tools for user interfaces, the ones proposed in this dissertation
included, focus on the work of a single creative individual. Future research should broaden
this scope to integrate support for collaboration and sharing directly into authoring
environments. Two reasons for making such a shift are the predominance of team-based
design in industry, and the rise of open, amateur design communities online.
PROFESSIONAL DESIGN TAKES PLACE IN TEAMS
Professional work on complex user interfaces takes place in design teams; and an increasing
number of such teams are geographically distributed. Office suite applications such as word
processors and spreadsheets now routinely offer support for asynchronous review and
annotation; some web-based applications also support synchronous collaborative editing.
Outside the realm of office applications, support for distributed work is still lacking. In this
dissertation, the d.note project for revising interaction design diagrams considered the
importance of asynchronous communication about such diagrams between team members.
But the presented work has not yet addressed synchronous collaboration. How can
technology help teams jointly construct, discuss, and test user interface prototypes? In this
chapter, Section 7.2.3.1 proposes a concrete project to redesign the interaction design studio
itself to better support team activities.
SUPPORTING AMATEUR DESIGN COMMUNITIES
Beyond the professional, corporate context, social production of both information and
software is becoming increasingly important. Successful online environments for
collaborative information production (e.g., Wikipedia, ‗view source‘ on Web 1.0 HTML
173
pages) are built around open access to modify, copy, and reuse content. For interaction design
beyond HTML pages, and programming in general, most social exchanges today happen
outside the authoring environments, through plain text in online forums and blogs. We
believe that there is significant additional latent value in integrating collaborative aspects of
design and development directly into our authoring tools, where richer ways for collecting,
presenting, and interacting with authored media are available.
As a first step, some programming IDEs have begun to integrate support for publishing
projects online. Scratch [13], the multimedia programming environment for children
developed at the MIT Media Lab, has a function to share one‘s program on the Scratch
website. Resnick recently reported that 30% of projects on the Scratch website are based on
other projects; and that some projects have been ―remixed‖ (copied, modified, and shared
again) up to 29 different times [76]. We believe that sharing the authoring process in addition
to the end result can significantly aid designers and developers in gaining expertise,
integrating pre-existing pieces of functionality into their project, and understanding and
correcting problems. The following section on authoring by example modification introduces
some concrete research projects along these lines.
7.2.2 AUTHORING BY EXAMPLE MODIFICATION
Most existing authoring tools implicitly assume that creators start with a clean slate, and
then create their design, e.g., a user interface, a layout of a brochure, or a personal website,
from scratch. However, less design happens tabula rasa than one might surmise. In practice,
much creative work starts with finding relevant existing examples and modifying those to fit
a new context.
Examples play at least two fundamental roles in the design and programming of user
interfaces: they can provide inspiration by providing anchors for analogical thinking [85], and
they can provide concrete functionality that can shortcut the time required for implementation.
For inspiration, designers like to immerse themselves in the domain of their current project by
collecting a large and diverse set of examples [118]. These examples can be competing
products, swatches of materials, color schemes (e.g., ‗mood boards‘), or clever mechanisms
(e.g., the IDEO Tech Box [141:pp. 143-145] ). In fact, ―shopping for functionality‖ was reported
as an important early design activity in our study of interaction, web, and hardware designers
[108]. Examples provide an experiential feel for the space of existing solutions and allow
identification of desirable traits, both concrete (―knob should be self-centering with detents‖)
174
and abstract (―product should feel warm and welcoming‖). These traits are then transferred
to the product being designed by analogy.
Many designers and programmers also rely on examples to provide working
implementations of desired functionality. Integrating existing examples may be faster, more
economical, or may enable designers to leverage functionality they could not create
themselves. In the software domain, programming by example modification [196] is especially
useful for learning how to integrate existing libraries into one‘s own project. Brandt et al.
found programming by example modification to be pervasive [50]. In a lab study where
subjects had to implement a chat room application, all participants extensively copied code
found on web sites: 1/3 of the final code in participants‘ projects came from pre-existing
examples..
If use of examples is pervasive in design and programming, what are the implications for
future design tools? We see four aspects deserving of future work: New tools can help users
find relevant examples, synthesize new examples if none exist, extract examples from larger
projects, and facilitate integration of found examples into projects. The following sections
review three of these areas in some additional detail.
7.2.2.1 Finding Examples
For programmers, code search engines like Assieme [122] and Mica [235] provide support for
finding relevant source examples. Brandt‘s Blueprint system integrates search for example
code snippets directly into the Adobe Flex development environment [49]. Going beyond
source code, it is not immediately clear how searches for examples should be specified. For
visual material, hierarchical browsing interfaces [181], faceted metadata browsing [257], and
image search by sketching [223] have been proposed, but we are not aware of studies about
the efficacy of such techniques for design. It is even less clear how designers might search for
interactive behaviors.
7.2.2.2 Synthesizing Examples
Our d.mix project [113] explored how to automatically synthesize new examples of web
service API calls by enabling developers to point to elements on web pages that they would
like to access programmatically. The Design Galleries system [181] generates a space-spanning
set of examples based on algorithms evaluating alternatives. For any system that
automatically generates examples, designers somehow have to steer and control the synthesis
175
process. Whether the right interfaces for doing so can be general or have to be domain-
specific remains to be determined.
7.2.2.3 Extracting Examples
Useful examples for programmers are short, minimal, self-sufficient, and have explanatory
documentation. These attributes are entirely different from the characteristic of source code
found in open repositories, where projects are large, complex, and rife with
interdependencies. One possible area of future research is therefore how to give developers
the right tools to make it easier (or automatic) to publish relevant, small examples from their
larger codebases.
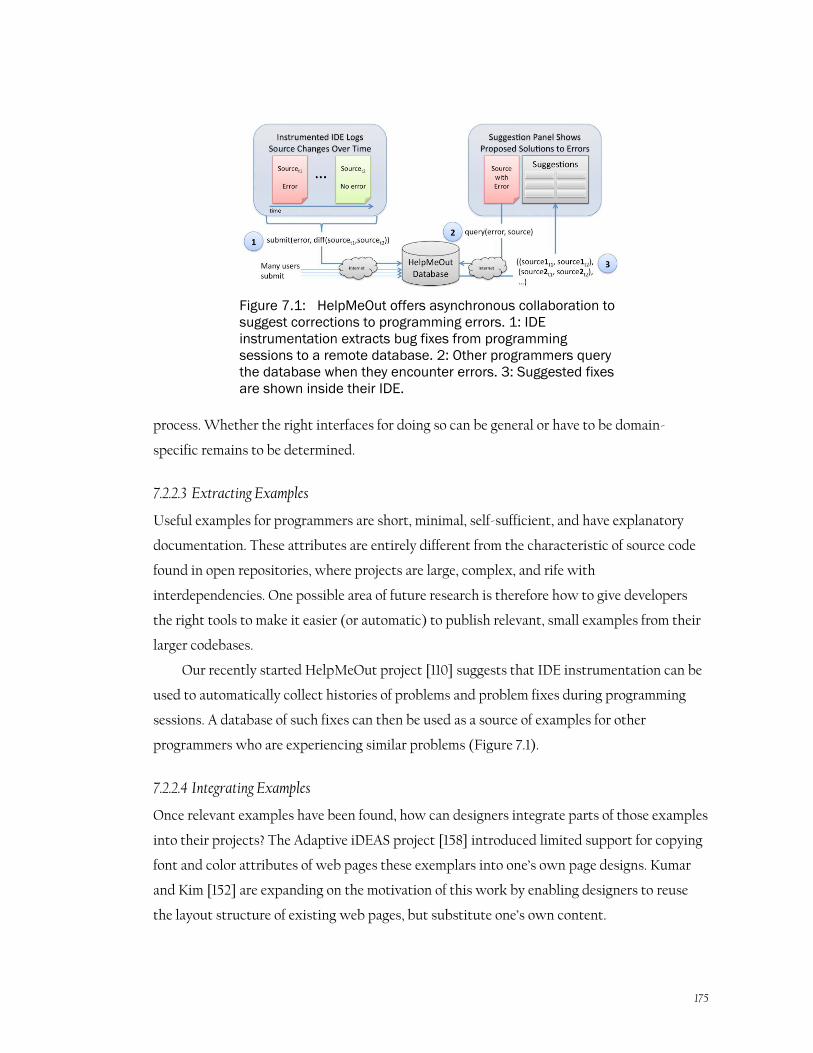
Our recently started HelpMeOut project [110] suggests that IDE instrumentation can be
used to automatically collect histories of problems and problem fixes during programming
sessions. A database of such fixes can then be used as a source of examples for other
programmers who are experiencing similar problems (Figure 7.1).
7.2.2.4 Integrating Examples
Once relevant examples have been found, how can designers integrate parts of those examples
into their projects? The Adaptive iDEAS project [158] introduced limited support for copying
font and color attributes of web pages these exemplars into one‘s own page designs. Kumar
and Kim [152] are expanding on the motivation of this work by enabling designers to reuse
the layout structure of existing web pages, but substitute one‘s own content.
Figure 7.1: HelpMeOut offers asynchronous collaboration to
suggest corrections to programming errors. 1: IDE
instrumentation extracts bug fixes from programming
sessions to a remote database. 2: Other programmers query
the database when they encounter errors. 3: Suggested fixes
are shown inside their IDE.
A top of page text box for a figure or table
176
Kelleher‘s Looking Glass project [138] aims to enable users of the Alice virtual world
authoring system to ―steal‖ behaviors from other users. Since these behaviors are represented
in code in a structured editor, key challenges are how to find the right scope of code to copy,
and how to adapt the found code to fit, e.g., by remapping object identifiers. How to aid
similar integration for arbitrary code remains an open question. It would also be valuable to
have a more concrete understanding which kind of examples are most frequently consulted
and appropriated for different kinds of design projects by studying example use in real-world
scenarios.
7.2.3 AUTHORING OFF THE DESKTOP
The tools introduced in this dissertation focused predominantly on prototyping user
interfaces that aim beyond the standard desktop paradigm. However, the tools proposed for
doing so were desktop applications themselves. What benefits can be realized by moving the
authoring environment off the desktop? We propose two possible research directions: going
large to create new design studio spaces, and going small by researching authoring tools for
mobile computing devices.
7.2.3.1 Going Large: New Studio Spaces for Interaction Design
As noted in section 7.2.1, professional design is a team activity. Creative work alternates
between phases of individual production and team discussion, ideation, and review. Based on
insight into design team work patterns, what should the computing infrastructure in the
interaction design studio of the future look like? To what extent can designers benefit from
interactive spaces that are tailored to their design process, as opposed to generic meeting
support? Three different ―form factors‖ have been proposed in prior work to support team
collaboration: large interactive wall displays, interactive tables, and entire augmented rooms
that combine interactive walls, tables, and other computing devices.
WALLS
A number of prior systems have focused on supporting design teams with interactive display
walls. Notable systems include PostBrainstorm [98], a large high-resolution projected mural
for enhancing and capturing brainstorming sessions, TEAM STORM [101] a brainstorm
support system that uses individual tablet displays and a shared wall display; and the
Designers‘ Outpost [147], a wall display that integrates digital capture and projection, and
physical post-it notes to create information architecture diagrams for web sites. While wall
177
displays offer the benefit of a shared focal point, arm fatigue limits their use for extended
work sessions [95:p. 1322].
TABLES
Interactive tables have unique benefits that may make them suitable for interaction design
and product design. Discussion in these domains is almost always tied to concrete artifacts:
designers use sketches, photographs, physical prototypes, and other products to structure
conversation and creativity. As a result, design meetings, whether they focus on planning,
brainstorming, or reviewing, draw on a wide variety of ―stuff.‖ Creative thought moves freely
across digital and physical boundaries. We hypothesize that interactive tables are particularly
suited to support and enhance group design work when they enable co-habitation of digital
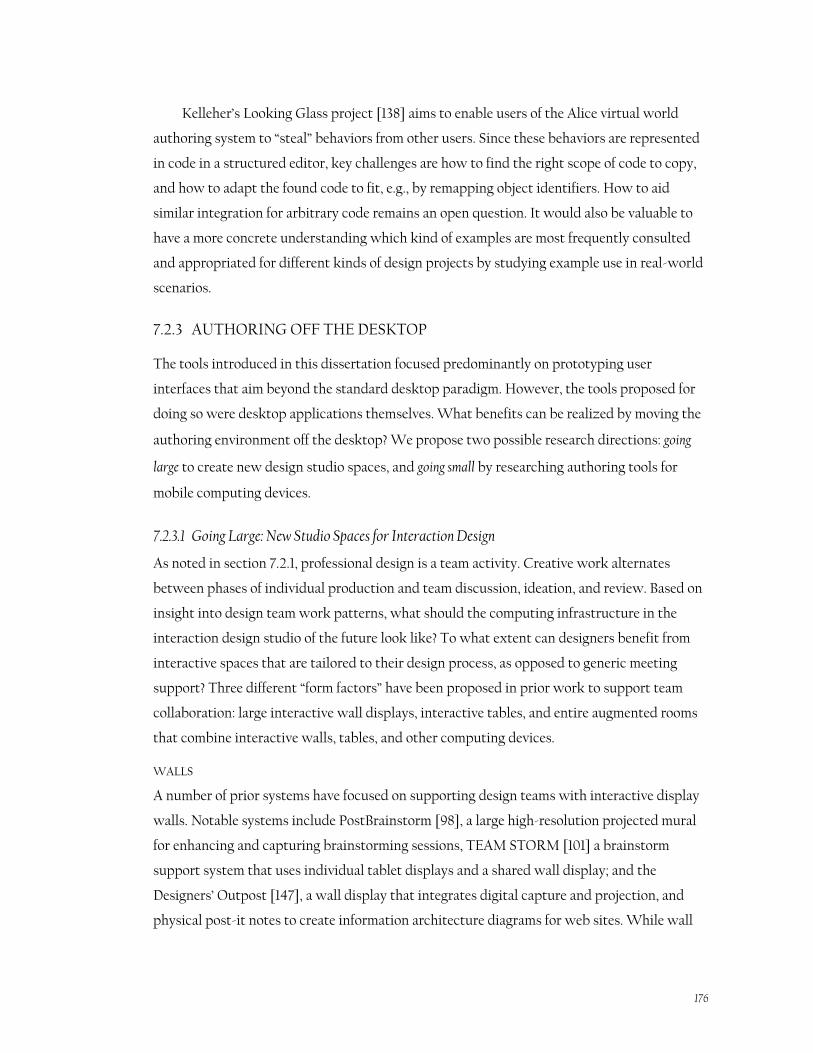
and physical artifacts on the table surface. In our own recent work, we have developed
Pictionaire (Figure 7.2), a large, multi-user, standing height interactive table that supports
physical to digital transition techniques through overhead image capture [111]. Pictionaire
was expressly created for team meetings of user interface designers; its software supports the
creation of linear interface walkthroughs from sketches and photographs. The next logical
step is to move beyond sketching straightforward walkthroughs into higher-fidelity
prototyping of interfaces on the table.
There are additional reasons for moving away from desktop UIs, even for individual
design work: in the domain of 3D modeling and animation, repetitive strain injuries (RSI) are
a serious problem for professional artists. Research on leveraging multi-touch authoring
techniques for animation professionals, e.g., at Pixar, is ongoing [142]. Large interactive tables
Figure 7.2: The Pictionaire table supports co-located design
team work through multi-touch, multi-device input and
overhead image capture.
178
that offer high-resolution pen-input for digital drawing are also an active area of research
[102].
To truly gauge the potential of table form factors and to find the right fit with
professional practice, longer deployments outside research labs are needed. It would therefore
be valuable to study use of a large interactive table such as our Pictionaire system with a local
professional design company.
ROOMWARE
Streitz‘ iLand [234] and the Stanford iRoom [134] investigated how collections of many
different computing form factors can support team work in a single room. The results, at least
for the Stanford iRoom, have been mixed. Distinct benefits of a room-scale infrastructure
include the ability to migrate applications between multiple displays and retarget interaction
based on the best available input device at the time. However, the complexity of room-scale
systems also creates maintenance and challenges that may outweigh the offered benefits. It is
telling that one particular interactive wall display was replaced with a traditional, non-
interactive whiteboard after it fell into disuse. The experience with roomware then should
serve as reminder not to blindly accept a vision of an all-digital future. More realistically,
future research will have to find solutions that tread a careful line between keeping
appropriate physical processes physical while adding digital flexibility where it is beneficial.
7.2.3.2 Going Small: Authoring on Handheld Devices
As a counterpoint to large, complex team design environments, we may also ask what kind of
authoring is possible on very small devices such as smart phones or PDAs. This question is
reasonable to consider because of two trends:
1) At the cutting edge of technology, smart phones today offer the processing power found
on desktop computers only a few years ago. Video and still image capture, location
sensing, and 3D graphics acceleration are becoming common place. The latest version for
Apple‘s iPhone now includes an application for video cutting and editing on the phone.
2) On the other end of the spectrum, for the majority of the world‘s population, access to
computation happens through cheap, low-powered cell phones. The mobile phone may
be the only computing device millions of people will ever have access to.
These two trends raise the following research questions: Fundamentally, what kind of
content will users want to author on mobile devices in the future? What kind of content can be
authored on such devices? The technical challenges are plentiful. The limited input/output
179
affordances of mobile devices are an immediate, obvious hurdle. While mobile authoring is
unlikely to replace the desktop paradigm, these questions are deserving of future study.
7.2.4 DESIGNING DEVICE ECOLOGIES
d.tools, Exemplar, and Juxtapose all assumed that a single, standalone device or software
interface was being designed. Increasingly, this assumption is no longer sufficient, as a
growing number of smart products offer their value through device or application ecologies
with multiple, connected components. An important, if overused, example of such an ecology
is the Apple iPod + iTunes system. The iPod is a portable digital music player; iTunes is an
application to play and manage one‘s digital media library on a desktop computer, linked to
an online store for browsing and purchasing new music. The overall user experience arises
out of the tight integration between the components. As another example, personal fitness
devices such as heart rate monitors are starting to include web interfaces for analyzing and
sharing the collected data [224].
Sensor networks — collections of small, programmable, self-powered computing nodes
that communicate with each other over ad-hoc wireless networks, are another area where
behavior for multiple interconnected components has to be authored. While early sensor
networks were used for unattended data collection, for example in conflict areas or for
environmental monitoring, future applications, e.g., controlling energy usage in smart
buildings, will likely require end-user interfaces. Merrill‘s Siftables project [187] explicitly
realizes the potential of sensor networks as user interfaces. Each node has a small color
display and can sense neighboring nodes as well as acceleration. While existing research has
introduced hardware and software tools for programming sensor network applications (e.g.,
tinyOS [160]), and multi-display applications (e.g., Vigo [151]), such tools are aimed at
researchers and technology experts. Support for prototyping and end-user authoring of multi-
display or multi-device applications is still lacking and worthy of future research.
180
7.3 CLOSING REMARKS
The desktop computing paradigm has largely ossified around a common set of input devices
and interaction techniques. With the rise of mobile and ubiquitous computing, it has also
already eclipsed its zenith. While desktop computing still has an important role to play, a
wider variety of different computing devices are quickly populating our lives. Beyond bringing
new technologies for novel interfaces within the reach of interaction designers, this
dissertation advocated that tools should also explicitly support fundamental design process
steps. By encouraging exploration of alternatives, informed by feedback, design tools can help
designers create interfaces that truly fit their intended users, contexts, and tasks, while being
delightful to use. The research presented in this dissertation empowers designers to better
envision and realize a broader range of such alternative futures for the post-desktop
computing age.