Embed Size (px)
Citation preview

1
Limited-stop bus service: An evaluation of an implementation strategy
Ahmed M. El-Geneidy (corresponding author) Assistant Professor School of Urban Planning McGill University Suite 400, 815 Sherbrooke St. W. Montréal, Québec, H3A 2K6 Canada Tel.: 514-398-8741 Fax: 514-398-8376 Email: [email protected] Julien Surprenant-Legault Analyst Transportation Systems Modelling Service Ministère des Transports du Québec 35, rue de Port-Royal Est, 4e étage Montréal, Québec, H3L 3T1 Canada Tel.: 514-864-1750, ext. 5060 Fax: 514-864-1765 Email: [email protected]
For Citation Please use: El-Geneidy, A., & *Surprenant-Legault, J. (2010). Limited stop bus service: An evaluation of an implementation strategy. Public Transport: Planning and Operations, 2(4), 291-306.

2
ABSTRACT
Transit agencies implement limited-stop (express) bus services as a mean to provide an attractive and competitive transit service. The Société de transport de Montréal (STM), the transit agency providing service on the Island of Montréal, Canada, implemented a limited-stop service to run parallel to route 67 Saint-Michel, a heavily used bus route. The design process regarding which stops to include in the new service involved an evaluation of several scenarios and an estimation of running time savings. In this paper, we use archived vehicle location and passenger count data to measure changes in on-time performance and running times, and to compare these changes to previous estimates through a before-and-after study. In addition, an on-site survey is conducted to measure the riders' perception of time savings. Implementing a limited-stop service yielded to 4.6 minutes savings in running time for the new limited service; meanwhile, the existing regular service experienced an increase of 0.8 minute in average running time, an increase that could be due to a new smart card system introduced in the same period. The running time savings for the limited-stop service fall in the expected estimates made by the research team, which strengthens our trust in the methodology used to select stops and to estimate savings. Finally, the study shows that riders are generally satisfied with the new service. They also tend to overestimate the savings associated with the implementation of the new limited-stop service by 4 to 7 minutes more than the actual savings. Key Words: Running time, On-time Performance, Travel Time, Limited-Stop Bus Service, Express Service, Transit Planning, Transit Operations Please cite as: El-Geneidy, A., & *Surprenant-Legault, J. (accepted). Limited stop bus service: An evaluation of an implementation strategy. Public Transport: Planning and Operations. DOI 10.1007/s12469-010-0030-9

3
INTRODUCTION
Transit agencies implement limited-stop (express) bus services as a mean to provide an
attractive and competitive transportation mode when compared to the automobile. Limited-stop
bus services provide riders with shorter in-vehicle time. For the initiative to be successful, travel
time savings should be substantial and easily perceivable by riders (Ercolano, 1984). In 2008, the
Société de transport de Montréal (STM), the transit agency providing service on the Island of
Montréal, Québec, Canada, was considering various measures to improve bus service. These
measures included implementing a limited-stop service to run parallel to route 67 Saint-Michel, a
heavily used bus route east of the central business district (CBD). The STM went through a
selection process with our research team to select the best set of stops. Scenarios were developed
for using one stop of the new service replacing 4 or 5 regular stops. Finally, the STM selected
around 40% of the original stops to be included in the new service (one every three stops),
leading to an increase in stop spacing to an average of 615 meters (0.382 mile), which is a little
lower than the recommended spacing in the transit industry for such services (Conlon, Foote,
O'Malley, & Stuart, 2001; Furth & Day, 1985; Silverman, Orosz, & Zicklin, 1998). The selection
process regarding which stops to include in the new service involved an evaluation of several
scenarios and estimates of running time savings (Tétreault & El-Geneidy, 2010). The first
scenario kept only transfer stops. The second scenario selected stops in the first quartile of
passenger activity as measured by the Automatic Passenger Counter (APC) counts. The third
scenario used the Montréal origin-destination survey data for users of this route and selected the
top quartile of stops with the most activity (Agence métropolitaine de transport, 2003). The
fourth and final scenario incorporated all the above criteria in selecting the limited-stop service.

4
Run-time models were then generated using archived Automatic Vehicle Location (AVL) and
APC to estimate savings along both the new and the existing services. The running time savings
for the limited-stop service from scenario four were estimated to be in the range of 11 to 38
percent with a realistic estimate of 20 percent. The use of AVL and APC data in estimating
savings and changes in the existing services is common in the transit research field (Dueker,
Kimpel, Strathman, & Callas, 2004; El-Geneidy, Strathman, Kimpel, & Crout, 2006; Kimpel,
Strathman, Bertini, Bender, & Callas, 2004).
The STM implemented route 467 Express Saint-Michel on March 30, 2009. This article
uses archived AVL and APC data for routes 67 and 467 Saint-Michel to quantify the running
time savings, changes in on-time performance and evaluate the accuracy of the previous
estimates made by the research team through a before-and-after study. In addition, an on-site
survey is conducted to measure the riders’ satisfactions and perceptions of time savings along
both routes.
The paper starts with a literature review of bus running time and limited-stop service
followed by a description of the studied route and estimates from the previous study. The next
section pertains to the methodology used to prepare and analyze the data for running time, on-
time performance, and survey questions. It is then followed by a discussion of those results and
finally by a conclusion section.
LITERATURE REVIEW
Transit users want to have a reliable service that arrives on-time, with a minimum in-
vehicle time (Murray & Wu, 2003), and minimum access and egress time (Hensher, Stopher, &
Bullock, 2003). AVL and APC systems have been implemented by a number of transit agencies

5
(Crout, 2007; Schweiger, 2003) and analyzed by a number of researchers (Furth, 2006; Furth,
Hemily, Muller, & Strathman, 2003; Strathman, 2002; Strathman, Dueker, Kimpel, Gerhart, &
Callas, 2002). Running time models are usually used in understanding the existing service and in
evaluating several transit planning and operation strategies, such as implementation of transit
signal priority (TSP) or adoption of new technologies (Berkow, El-Geneidy, & Bertini, 2009;
Bertini & El-Geneidy, 2004; Kimpel, et al., 2004).
Running time is known as the time that takes a bus to complete a trip between two
defined points along a route. Running time is affected by factors that do not fall under the control
of the transit agency, such as congestion or weather, and those that can be controlled by the
agency such as route design and the behavior of drivers (Strathman & Hopper, 1993). Most
researchers agree on the basic factors affecting bus running times (Abkowitz & Engelstein, 1983;
Abkowitz & Tozzi, 1987; Guenthner & Sinha, 1983; Levinson, 1983a; Strathman, et al., 2000).
Table 1 contains a summary of known factors affecting running times.
Table 1: Factors affecting transit travel times Variables Description Distance Segment length Intersections Number of signalized intersections Bus stops Number of bus stops Boarding Number of passenger boardings Alighting Number of passenger alightings Time Time period Driver Driver experience Period of service How long the driver has been on service in the study period Departure delay Observed departure time minus scheduled Stop delay time Time lost in stops based on bus configuration (low floor etc.) Nonrecurring events Lift usage, bridge opening etc. Direction Inbound or outbound service Weather Weather related conditions Road Road characteristics Operating environment Congestion
Reduction in running time is expected to lead to an increase in ridership (Vuchic, 2005)
and will greatly increase riders satisfaction (Hensher, et al., 2003). One of the most effective

6
strategies for decreasing running time is decreasing the number of stops being served by a route.
This can be done through revision of existing stop spacing and/or eliminating some of the
existing stops. The savings from this strategy leads to more time savings than eliminating the
effects of congestion (1983b). This reduction can be achieved either by stop consolidation (El-
Geneidy, et al., 2006) or by offering limited or express bus service (Ercolano, 1984; Furth &
Day, 1985; Vuchic, 2005). To our knowledge the use of archived AVL and APC data to quantify
the amount of savings in running time due to implementation of limited-stops services is not
present in the transit literature. Only one study looked at savings due to implementation of
limited-stop services in Chicago (Conlon, et al., 2001) and they concentrated mainly on riders
satisfaction after the implementation of the service. The second study, which we are evaluating
in this paper, concentrated on the selection criteria and estimates of time savings (Tétreault & El-
Geneidy, 2010).
Express or limited buses stop at only few stops along a route while a parallel regular
route serves all of the limited and intermediate stops. One of the drawbacks of express service is
that waiting times tend to increase after implementation (Furth & Day, 1985), therefore they
should be implemented parallel to high frequency routes (routes with short headways, 8 minutes
or less) and high ridership routes. Accordingly, an evaluation of customer satisfaction after the
implementation of such a service is a must. This evaluation can be done through an on-site
survey.
CASE STUDY
Montréal, Québec, is the second most populous metropolitan area in Canada with 3.7
million inhabitants. The STM operates bus and subway services on the Island of Montréal, which
is home to about half of the region’s population. Four subway lines served by 759 cars and 192

7
bus routes served by 1,600 vehicles comprise the STM network, allowing for over a million trips
per weekday. Routes 67 and 467 are located east of downtown Montréal and run north-south
along a boulevard crossing through five boroughs of the City of Montréal. The routes are 9.16
km long in the northbound direction and 9.96 km southbound. Both lines 67 and 467 connect to
two métro (subway) stations, one at its southern terminus and another at its midway point. The
built form around the route is mostly three-storey triplexes mixed with some commercial
buildings near major intersections. Table 2 includes a summary of route characteristics, while
Figure 1 is a map of the studied routes.
Table 2: Physical and schedule characteristics of Routes 67 and 467 Saint-Michel Northbound Southbound
Route 67 Route 467 Route 67 Route 467
Tot
al
Length (kilometers) 9.16 9.16 9.96 9.96
Traffic signals 40 40 43 43
Number of stops 39 16 40 17
Average stop spacing (meters) 241 611 255 623
An
alys
is
Length (kilometers) 8.38 8.38 8.89 8.89
Traffic signals 36 36 40 40
Number of stops 36 14 37 15
Hea
dw
ay
Average scheduled 2008 (minutes) 4.3 --- 5 ---
Average scheduled 2009 (minutes) 6.3 4.2 6.5 4.5
Combined headway (minutes) 3.9 3.6
Tri
ps Number of Trips per day 2008 263 --- 236 ---
Number of Trips per day 2009 182 173 177 159
Combined nb. of trips per day 2009 334 311
1 km = 0.6214 mile
The experience with APC and AVL technology at the STM dates back to 1999. AVL
systems are widespread in North America (Strathman, et al., 2000), and the third-generation
system used by the STM equips 220 buses out of 1,600 in the fleet. Buses with APC and AVL
are assigned to different routes to obtain a sample of bus operational information. Data are
8
recorded at both the stop and the trip levels by the system, mainly in order to revise schedules
and generate performance measures such as schedule adherence. Route 467 operates between
6:00 and 19:00 with maximal headways of 10 minutes (Société de Transport de Montréal, 2009).
Due to real or de facto layover points, and to the need to compare routes 67 and 467 at the same
stops, the defined route was shortened by four stops northbound and by three stops southbound.
It is clear from Table 2 that the introduction of route 467 has lead to an average combined
headway of 3.9 minutes in the northbound direction and of 3.6 minutes southbound at the
stations being served by both routes. Besides, the stations served by route 67 only were subject
to an increase in headway of 2 minutes northbound and of 1.5 minutes southbound. The
introduction of the express bus service increased the number of trips going northbound from 263
to 334 per day. For trips going southbound, the number of trips increased from 236 to 311 trips
per day. Again, this increase was present only for the stops being served by both routes. The
number of trips serving route 67 declined in both directions after implementation of the limited-
stop service..

9
Figure 1: Study routes and segments
METHODOLOGY
The objective of this paper is to evaluate the selection criteria proposed by the research
team for a limited-stop bus service and to measure the accuracy of the running time estimates
introduced in the previous study by Tétreault and El-Geneidy (2010). An analysis of archived

10
AVL and APC data collected before and after the implementation of a limited-stop service is
performed. AVL and APC data is obtained from a sample of trips serving route 67 during the
before period, and routes 67 and 467 during the after period. Over 240,000 individual stop
records were obtained from the STM data archival system. Entries include bus arrival and
departure times at each stop along the route, as well as information on passenger activity. The
before data was collected between April 7 and July 4, 2008, while the after data was collected
between April 6 and July 3, 2009. The records were cleaned in order to remove incomplete trips
and recording errors.
The first step is to prepare summary tables and running time models to quantify the time
savings associated with both routes after the implementation of the limited-stop bus service.
After data cleaning and eliminating short-turn runs, two databases are built. A database with all
complete trips contains 2601 before trips and 2637 after trips for route 67, and 130 after trips for
route 467. Besides, in December 2008, the City of Montréal upgraded the traffic signal timing
along a small part of the route. Accordingly, the route is divided for the analysis into four
segments northbound and four corresponding sections southbound (see Figure 1 for their exact
location), yielding 10,480 before segments and 10,621 after segments for route 67, and 6,481
after segments for route 467. The division of the route into segments also allowed including
more data from route 467, for which many incomplete trips were recorded by the AVL.
The trip-level analysis excludes data from the first and last stops in both directions. In
order to compare routes 67 and 467, the second to the last stops used were corresponding to the
route 467 ones. For more precision, leave time from the first stop in the northbound direction is
kept, but not passenger activity because of a higher risk of error for this variable at the first stop

11
due to a layover. Besides, the second to the last stop in the northbound direction also has to be
removed from the analysis because layovers are often taken at this stop rather than at the last
scheduled stop. Hence, the third to the last stop is used for route 467, which corresponds to the
fourth to the last stop for route 67. Table 3 is a list of variables prepared to conduct the analysis.
Table 3: Variables included in the statistical model
Variable Name Description
Running time The running time per trip or segment in seconds, from the departure of the first stop before the designated trip or segment to the departure from the last stop of the designated trip or segment
After A dummy variable that equals to 1 if the trip observed is recorded in the after time period (2009)
R467 A dummy variable that equals to 1 if the trip observed is serving route 467 (only in the after time period)
Southbound Dummy variable for southbound trips
Distance Segment The distance in meters travelled per segment
TP Peak AM Dummy variable for trips or segments scheduled between 6:30 AM and 9:30 AM
TP Midday Dummy variable for trips or segments scheduled between 9:30 AM and 3:30 PM
TP Peak PM Dummy variable for trips or segments scheduled between 3:30 PM and 6:30 PM
TP Evening and Night Dummy variable for trips or segments scheduled between 6:30 PM and 3 AM
Delay Start The delay at the start of the route in seconds (leave time – scheduled time)
Delay End The delay at the end of the route in seconds (leave time – scheduled time)
Tweaked Traffic Lights A dummy variable that equals to one if the traffic light cycle in the segment were adjusted to ease bus traffic (valid only for segment 2, in 2009)
Passenger Activity The sum of boardings and alighting per trip or segment
Passenger Activity Squared The sum of the square of boardings plus alighting at each stop per trip or segment
Maximum Load The maximum load during a trip or segment
Proportion Stops Made The proportion of the scheduled stops that was actually made
The first part of the before and after analysis necessitates modeling running times. Our
general running time model incorporates a number of variables relating to the time of day, delay,
and passenger activity information (Environment Canada, 2008) in addition to a set of dummy
variables to control for the before and after and the type of service (limited or regular). It is
important to note that all buses serving the route during the two study periods were low-floor
12
buses. Weather conditions were tested as well, yet we could not find any adverse weather
conditions or differences between the two study periods. Accordingly, weather conditions are not
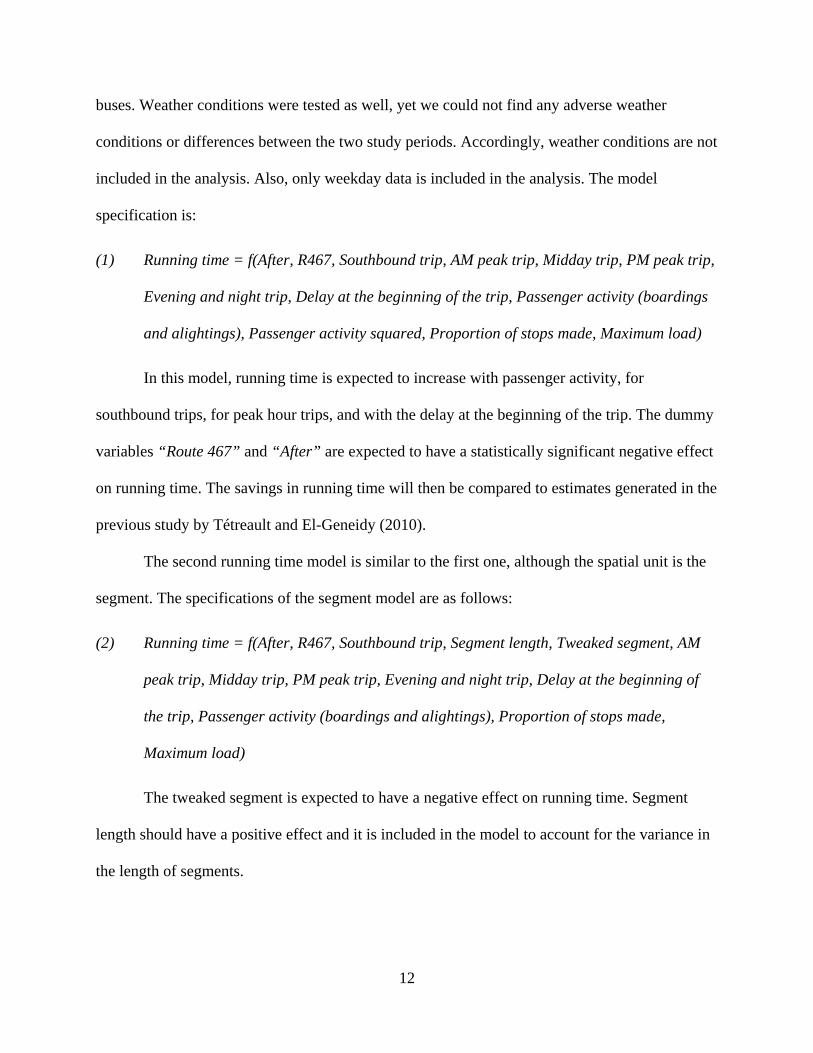
included in the analysis. Also, only weekday data is included in the analysis. The model
specification is:
(1) Running time = f(After, R467, Southbound trip, AM peak trip, Midday trip, PM peak trip,
Evening and night trip, Delay at the beginning of the trip, Passenger activity (boardings
and alightings), Passenger activity squared, Proportion of stops made, Maximum load)
In this model, running time is expected to increase with passenger activity, for
southbound trips, for peak hour trips, and with the delay at the beginning of the trip. The dummy
variables “Route 467” and “After” are expected to have a statistically significant negative effect
on running time. The savings in running time will then be compared to estimates generated in the
previous study by Tétreault and El-Geneidy (2010).
The second running time model is similar to the first one, although the spatial unit is the
segment. The specifications of the segment model are as follows:
(2) Running time = f(After, R467, Southbound trip, Segment length, Tweaked segment, AM
peak trip, Midday trip, PM peak trip, Evening and night trip, Delay at the beginning of
the trip, Passenger activity (boardings and alightings), Proportion of stops made,
Maximum load)
The tweaked segment is expected to have a negative effect on running time. Segment
length should have a positive effect and it is included in the model to account for the variance in
the length of segments.

13
The second part of this study includes analyzing changes in on-time performance at
several stops serving routes 67 and 467. The stops selected for the on-time performance analysis
are the stops at the end of each segment (highlighted in Figure 1). What follows is the model
specification used in this analysis:
(3) Delay at a time point = f(After dummy,R467, Southbound trip, Segment length, Tweaked
segment, AM peak trip, Midday trip, PM peak trip, Evening and night trip, Delay at the
beginning of the trip, Passenger activity (boardings and alightings), Proportion of stops
made, Maximum load)
In this model, the delay is expected to increase with passenger activity, for southbound
trips, for peak hour trips, and with the delay at the beginning at the trip. It is expected that on-
time performance will decline for the regular route and increase for the 467.
The third part of the analysis serves to compare savings identified in the running time
models and changes in delays at time points to riders’ perceptions of the savings. In June 2009,
the research team conducted a short on-site survey at stops serving both routes 67 and 467. 270
existing riders were surveyed on the changes that they noticed in waiting and running times since
the introduction of the limited-stop service. The survey also asked the riders if they changed their
usual stop to use route 467 and for how long they had been using route 67.
ANALYSIS AND DISCUSSION
The average running time along route 67 was 34.3 minutes northbound and 35 minutes
southbound during the before time period. During the after time period for route 67, the average
running time was 33.7 minutes northbound and 34.5 minutes southbound. Hence, improvements
14
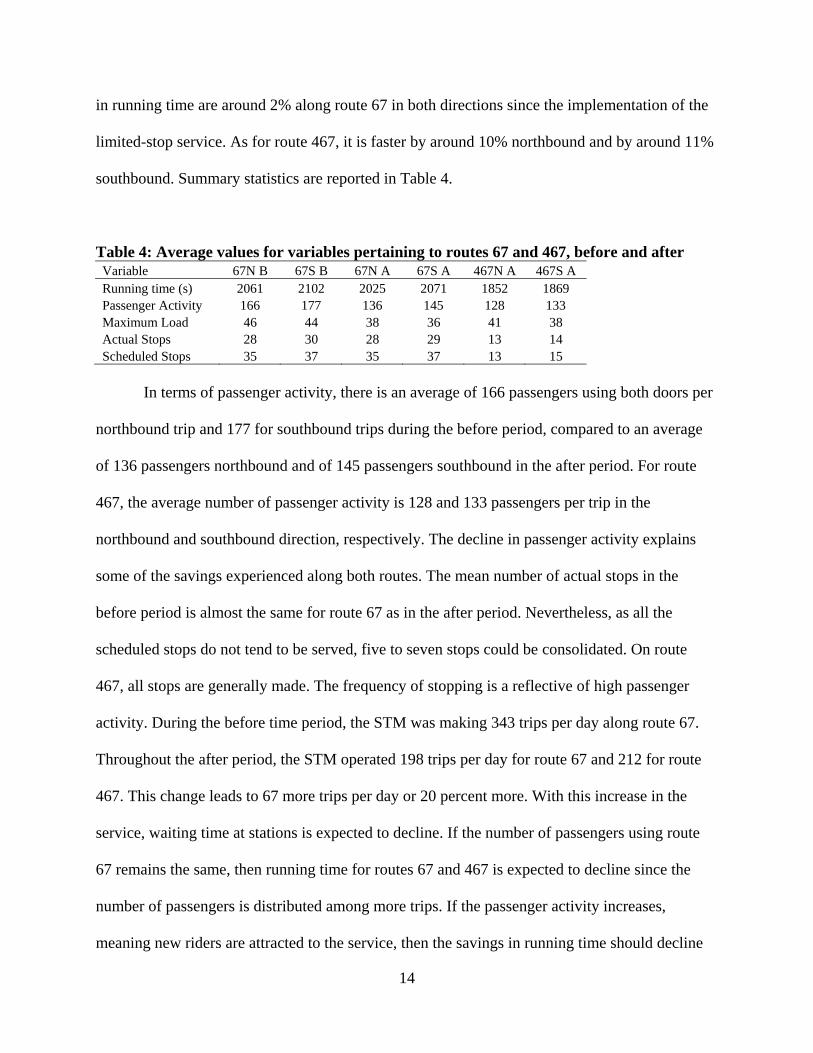
in running time are around 2% along route 67 in both directions since the implementation of the
limited-stop service. As for route 467, it is faster by around 10% northbound and by around 11%
southbound. Summary statistics are reported in Table 4.
Table 4: Average values for variables pertaining to routes 67 and 467, before and after Variable 67N B 67S B 67N A 67S A 467N A 467S A Running time (s) 2061 2102 2025 2071 1852 1869 Passenger Activity 166 177 136 145 128 133 Maximum Load 46 44 38 36 41 38 Actual Stops 28 30 28 29 13 14 Scheduled Stops 35 37 35 37 13 15
In terms of passenger activity, there is an average of 166 passengers using both doors per
northbound trip and 177 for southbound trips during the before period, compared to an average
of 136 passengers northbound and of 145 passengers southbound in the after period. For route
467, the average number of passenger activity is 128 and 133 passengers per trip in the
northbound and southbound direction, respectively. The decline in passenger activity explains
some of the savings experienced along both routes. The mean number of actual stops in the
before period is almost the same for route 67 as in the after period. Nevertheless, as all the
scheduled stops do not tend to be served, five to seven stops could be consolidated. On route
467, all stops are generally made. The frequency of stopping is a reflective of high passenger
activity. During the before time period, the STM was making 343 trips per day along route 67.
Throughout the after period, the STM operated 198 trips per day for route 67 and 212 for route
467. This change leads to 67 more trips per day or 20 percent more. With this increase in the
service, waiting time at stations is expected to decline. If the number of passengers using route
67 remains the same, then running time for routes 67 and 467 is expected to decline since the
number of passengers is distributed among more trips. If the passenger activity increases,
meaning new riders are attracted to the service, then the savings in running time should decline

15
compared to the expected estimates. A more detailed analysis of running time can help in
quantifying the exact savings along both routes and changes in on-time performance.
Running time and on-time performance models
The characteristics of the running time model are well known in transit literature (Bertini & El-
Geneidy, 2004; El-Geneidy, et al., 2006; Levinson, 1983b). The first step is to check the effects
of the independent variables on running time and to what extent the effects of these variables
follow theory of transit planning. This step is used as our benchmark for assessing the quality of
the collected data. Also, the “After” and “Route 467” variables are key variables for evaluating
changes in running time. A general multivariate linear regression model for running time (in
seconds) is derived using the archived trip data and is given in Table 5. In addition, the same
table includes a running time model at the segment level (in seconds), and an on-time
performance model (in seconds).

16
Table 5: Linear regression models
Route Running Time Segment Running Time
On-Time Performance
Variable Name Coef. t Coef. t Coef. t
After 52.92* 13.38 13.83* 12.43 16.54* 13.85
Route 467 -262.87* -18.34 -65.10* -48.73 -30.52* -21.28
Southbound 56.45* 13.27 -16.66* -18.20 -20.44* -20.81
Segment Length (m) 0.23* 281.65 -0.01* -14.92
Tweaked Segment -1.97 -1.49 2.96** 2.09
AM Peak 214.72* 24.23 57.45* 27.16 9.34* 4.11
Midday 258.54* 29.67 70.68* 34.83 12.23* 5.62
PM Peak 324.88* 34.78 88.25* 40.90 6.11** 2.64
Evening and Night 116.88* 14.33 33.98* 16.52 18.22* 8.25
Delay at Start (s) -0.37* -17.40 -0.11* -27.22 0.87* 205.17
Passenger Activity 1.90* 15.53 1.46* 53.33 0.98* 33.14
Passenger Activity Squared -0.01* -2.94
Maximum Load -0.41 -1.61 -0.06 -1.14 0.54* 10.39
Proportion of stops made 227.73* 8.77 53.53* 18.36 43.76* 13.98
Constant 1392.53* 87.53 -134.95* -40.61 -68.78* -19.28
R Square 0.654 0.92 0.68
N 5364 27577 27577 *Indicate Statistical Significance at the 99% confidence level **Indicate Statistical Significance at the 95% confidence level
First, the “After” variable accounts for the difference between time gains on route 67 and
time losses due to changes in external factors such as the arrival of the new smart card system, a
system that slows boarding time. The net effect is an increase of 53 seconds in running time on
route 67 and a decrease of 210 seconds on route 467. As would be expected, passenger activity
(boardings and alightings) increases running time by 1.9 seconds per passenger, but since the
activity squared is negative, time per passenger decreases as overall passenger activity increases.
This finding is standard in the transit literature. Southbound trips are longer by 56 seconds,
which accounts for the additional distance, intersections and traffic signals. Time of the day also
has an important influence on running time. What is curious is that the coefficient associated
with midday trips is greater than the AM peak trips one. Of course, trips in the AM peak would

17
still be longer when accounting for increased passenger activity, but this difference may be due
to waiting at time points or other factors apart from traffic conditions. PM peak trips are much
longer than other trips (324 seconds), probably because of congestion. The proportion of stops
actually made increases running time and mostly accounts for deceleration and acceleration time.
227 seconds have to be added to running time if a bus serves all the scheduled stops. Buses
starting their runs late are faster than on-time or ahead of schedule buses. Drivers may be
adjusting their behavior based on whether they are ahead or behind schedule since running time
decreases by 0.37 second for every second of delay at the beginning of the route. The model
developed here is consistent with previous research and can be used for further analysis, thus
establishing the robustness of the STM collection and archival system (Bertini & El-Geneidy,
2004; El-Geneidy, et al., 2006; Furth & Muller, 2007; Kimpel, et al., 2004; Levinson, 1983b;
Strathman, et al., 2002).
The estimated changes in running time can be generated by using the coefficients from
the above model to conduct a sensitivity analysis and predict the average new running time when
keeping all variables constant at their mean values. The estimated numbers are shown in Table 6.
It is clear that savings in running time are present for routes 67 and 467 in all directions during
both peaks except for Route 67 in the PM peak going southbound, yet the negative change is
minor (4 seconds). Running time in general went down on route 67, mainly due to a decline in
the number of passengers using the route, while for route 467, the decline is related to the decline
in the number of stops and to the number of passengers using the route per trip. Meanwhile, it is
important to note that the STM implemented a smart card system in December 2008, which is
after the before time period and before the after time period. This new system requires each
passenger to scan his or her card upon riding the bus. The switch from a waive-card system to a

18
scanning one could have added more time for every passenger activity, since the scanning
requires passengers to keep their card adjacent to the card reader for at least 2 seconds. A new
fare box system was implemented, as well. Both changes can help in explaining the increase
noticed in travel times along the regular route (67) and why time savings for route 467 are close
to the lower end of the estimations.
Table 6: Running times (time savings*) in minutes predicted by the complete route model Route 67 before Route 467 after Route 67 after
Peak AM Southbound 35.79 30.88 (4.91) 35.41 (0.39)
Peak AM Northbound 34.93 29.98 (4.95) 34.38 (0.55)
Peak PM Southbound 38.61 33.47 (5.14) 38.69 (-0.07)
Peak PM Northbound 37.27 32.73 (4.54) 36.70 (0.56)
*Change is indicated between brackets
Regarding the running time model along the four segments, it is clear that the model
follows the same signs and magnitude as the route model, except for the northbound variable.
The difference may be due to the addition of the segment length variable. In fact, buses running
northbound are in general faster when controlling for distance travelled. For the “tweaked
segment” where the City of Montréal implemented several changes in the signalization program
to favor transit service, no statistically significant impact on running time could be found from
this model. In the segment model, the square of passenger activity was not statistically
significant.
The on-time performance model is reported in Table 5, as well. On-time performance is
calculated by subtracting the scheduled time from the leave time. A negative value indicates that
the bus arrives early at the stop, while a positive value indicates a delay. The on-time
performance has declined by 16 seconds when measured at the end of each segment during the
after period. Here as well, the new smart card may have induced unplanned delays to the service.

19
In the meantime, on-time performance has improved for route 467 relative to route 67. As a
result, waiting time decreased by around 30 seconds for passengers using route 467. It is also
important to note that buses are not allowed to depart stops early at time points. On-time
performance improves with the increase in segment length, that is the longer the segment, the
higher the probability that a driver will arrive on time at the end of the studied segment. This
finding is consistent with the finding from running time models where drivers try to go faster
when they are delayed. The segment that was exposed to the changes in traffic signals has
experienced a statistically significant decrease in on-time performance of 2.9 seconds. On
average, buses arrive late at the end of this segment; hence, a revision to the schedule is needed
to address the change in the traffic signals system. Still, the statistically significant positive
coefficient associated with the amount of delay at the beginning of segments indicates that
although drivers try to go faster when they are late at the beginning of the route, they tend to fall
behind schedules by 0.87 seconds for every second of delay at the beginning of the route. This
variable also shows that some adjustments to schedules to add more recovery time can help in
the operations of this route.
Comparing the amount of savings from implementing the limited-stop service directly to
the savings estimated from the previous study as absolute numbers is not possible. The previous
study was conducted during the winter and the definition of the study route is different due to
data issues. Accordingly, the comparison can only be done in terms of proportions. Table 7
presents the different scenarios developed in the previous study and the amount of expected
savings compared to the observed savings derived from the above models.

20
Table 7: Estimates versus actual savings Route 467 Route 67
Scenario Optimist Pessimist Realist After Optimist Pessimist Realist After Peak AM Southbound 38.4% 11.3% 19.9% 13.7% 21.7% 0.0% 12.5% 1.1%
Peak AM Northbound 45.3% 12.5% 23.0% 14.2% 24.7% 0.0% 14.2% 1.6%
Peak PM Southbound 38.6% 11.4% 20.0% 13.3% 21.8% 0.0% 12.6% -0.2%
Peak PM Northbound 39.1% 11.3% 20.4% 12.2% 21.8% 0.0% 12.5% 1.5%
Actual time savings proved to be slightly over the pessimistic ones, with up to 2.4% more
time savings when compared to the before period, for both route 467 and route 67. The full trip
time on route 467 in the after period during peak hour is about 13% shorter than in the previous
period, while it is about 1% shorter for route 67 after the implementation of route 467. The
situation originally described by the pessimistic scenario is one where there is no change on the
variables affecting route 67, and where route 467 only benefits from time savings made by
skipping stops. The reason why the real savings only compare to the pessimistic estimates can be
the introduction of the smart card system that adds on average 2 to 4 seconds per passenger, thus
slowing considerably bus runs. Time consumed by the introduction of the smart card and the new
fare box system could largely contribute to offset time savings from the increase in the number
of buses running on the Saint-Michel axis. All in all, the new limited-stop service route 467 is
going faster than the previous route 67, and so within the estimated ranges.
Survey analysis
The final step in this study is to quantify to what extent users have perceived the time
savings. A survey was carried out for this research in June 2009 among 270 users of routes 67
and 467 at 8 northbound stops and at 11 southbound stops for both routes, as well as at 1
northbound 67-only stop. Confidence intervals for multiple-choice questions vary between
21
6.13% and 6.84%. The answers revealed that 62.1% of the respondents used route 467 most
often compared to 37.9% for route 67, and that 67.5% did not change their usual stop to use
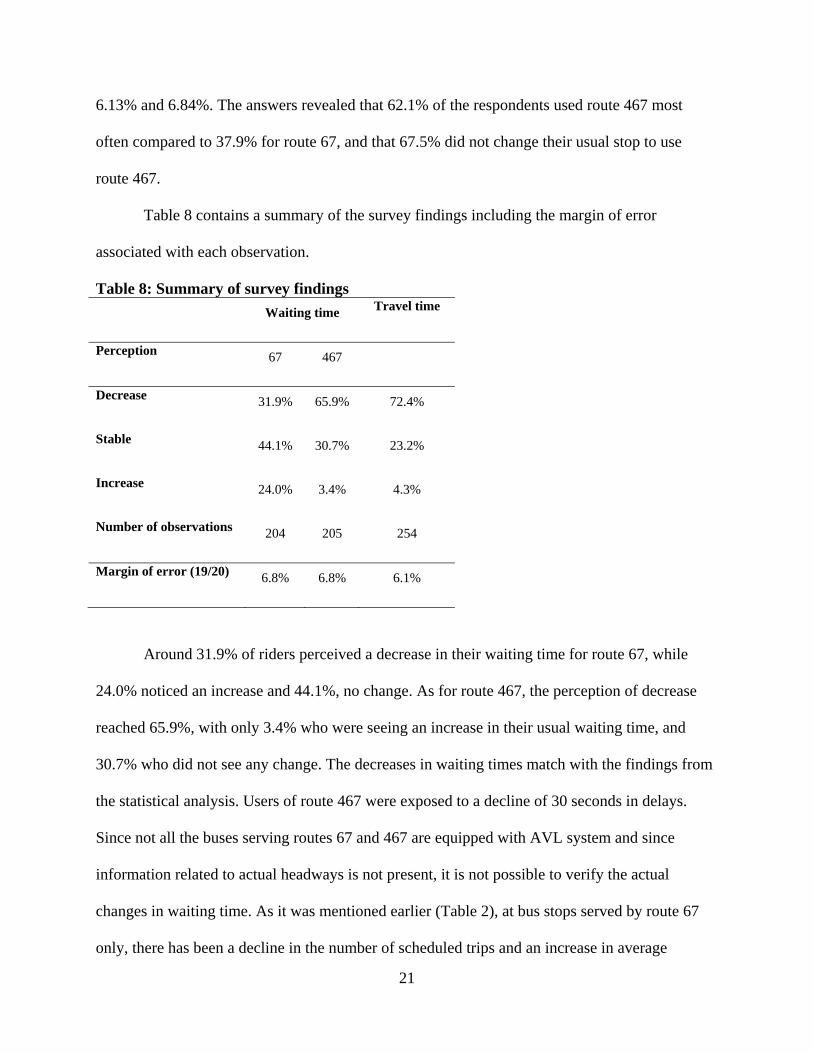
route 467.
Table 8 contains a summary of the survey findings including the margin of error
associated with each observation.
Table 8: Summary of survey findings Waiting time Travel time
Perception 67 467
Decrease 31.9% 65.9% 72.4%
Stable 44.1% 30.7% 23.2%
Increase 24.0% 3.4% 4.3%
Number of observations 204 205 254
Margin of error (19/20) 6.8% 6.8% 6.1%
Around 31.9% of riders perceived a decrease in their waiting time for route 67, while
24.0% noticed an increase and 44.1%, no change. As for route 467, the perception of decrease
reached 65.9%, with only 3.4% who were seeing an increase in their usual waiting time, and
30.7% who did not see any change. The decreases in waiting times match with the findings from
the statistical analysis. Users of route 467 were exposed to a decline of 30 seconds in delays.
Since not all the buses serving routes 67 and 467 are equipped with AVL system and since
information related to actual headways is not present, it is not possible to verify the actual
changes in waiting time. As it was mentioned earlier (Table 2), at bus stops served by route 67
only, there has been a decline in the number of scheduled trips and an increase in average

22
scheduled headway. So, it was expected that a certain percentage of transit users would suffer
from a minor increase in waiting time. This increase in scheduled headway was between 1.5 and
2 minutes and it was noticed by 24% of the existing users in our sample.
Around 72.4% of riders thought that their travel time decreased since the introduction of
route 467, 23.2% did not notice a change, and 4.3% felt a longer commute. The survey also
asked the riders to quantify the amount of savings in their personal trip time, as well as to
identify the bus stops that they use for boarding and alighting. This information was compared
for every rider to the average travel time between the two defined stops using archived AVL
data. A difference in means test was used to compare perceptions to the average travel time
obtained from the AVL data. For route 467 riders, a statistically significant difference exists
between their estimates and the actual savings. Real travel time savings were on average 1.5
minutes per trip, while users estimated them within a range of 6.9 to 11.9 minutes. Still, there
was no significant difference between the perception of change in running time along route 67
and the actual change, which was equal to 0.04 minutes (2.4 seconds).
CONCLUSION
The first objective of this research was to evaluate the estimates of Tétreault and El-
Geneidy (2010), who attempted to predict time savings associated with the implementation of a
new limited-stop bus service running parallel to an existing route in Montréal, Québec, Canada.
A before and after approach was used here in order to measure the actual changes in running
times and on-time performance along routes 67 and 467 Saint-Michel. The actual values found
are slightly over Tétreault and El-Geneidy’s pessimistic estimates. A running time model

23
indicated savings of nearly 5 minutes (13%) during peak hour along the limited-stop service,
while savings for route 67 were minor, around 1% of running time gains. The introduction of a
new smart card and fare box system is likely to have reduced running time gains for both routes.
The second objective of this paper involved the analysis of on-time performance. On-
time performance of buses riding the different segments of routes 67 and 467 is affected by the
same factors as the ones affecting running time. It is important to note that for each second of
delay at the beginning of a trip, a bus arrives 0.87 seconds late, meaning that the drivers do not
have enough recovery time in their schedules. It is also clear that buses serving route 67 tend to
serve 5 or 7 stops less per trip than the scheduled stops. An analysis is recommended to identify
the potential savings from consolidating these stops along route 67.
The third objective of this article was to examine the users’ perceptions of time savings
from the new limited-stop bus service. As the survey reported, users perceive important time
gains, both in waiting and travel time. Some riders experienced an increase in waiting time
(25%), mainly the users of stops being served by route 67 only. Nevertheless, this increase was
minor (1.5 to 2 minutes based on schedule). For running time, it was found that existing riders
overestimate the average savings for their trips. For example, the 1.5 minutes of actual time
savings were estimated to be between 5.4 to 10.4 minutes, which means errors ranging between
360% and 693%. These estimates need to be taken carefully since they are based on a sample of
250 users; accordingly, a more comprehensive survey is recommended with a bigger sample
size. Still, transit agencies should note that even minor savings in travel time are generally
perceived positively and can thus increase customer satisfaction.
Overall, the limited-stop service is providing real time savings to its users as well as
important additional perceptions of time savings. The STM has taken a conservative action and

24
kept 40% of its original stops for the limited-stop service, more than the 1 out of 3 stops rule.
Further time savings for the agency and the users could be observed if longer average stop
spacing than the current one of 615 meters (0.38 mi) were to be adopted. Due to STM material
and financial limitations, not all buses serving the studied routes are equipped with APC and
AVL systems, preventing research on key elements such as variability of service before and after
the implementation, changes in actual headway, and variability in headway. Also, we could not
use the data in hand to generate a reliable estimate of the change in the total passenger activity
along the route.
Evaluating the impact of the new smart card system on running time is one of the areas
that needs more research. The smart card system used by the STM requires the card to be
approached to the reader for 2 to 4 seconds, which had an effect on the models. An evaluation of
the smart card effects on the STM system in general is suggested. The STM started replacing the
existing buses serving this route with articulated buses in October 2009, while TSP and an
exclusive bus way are planned for the route. Therefore, a study is recommended to measure the
effect of these changes as well on running time of both routes 67 and 467.
ACKNOWLEDGEMENTS
We would like to acknowledge the Société de transport de Montréal (STM) which
partially funding and data for this project. Especially, Michel Tremblay, Jocelyn Grondines, and
Sébastien Gagné for their feedback and support throughout this project. This research was
funded by the National Science and Engineering Research Council of Canada (NSERC-CRD). In
addition, we would like to thank the TRAM research group members, for their help in

25
conducting the on-site survey. Finally, we would like to thank Paul Tétreault for his help in the
early stages of this study.
REFERENCES
Abkowitz, M., & Engelstein, I. (1983). Factors affecting running time on transit routes.
Transportation Research Part A, 17(2), 107-113.
Abkowitz, M., & Tozzi, J. (1987). Research contributing to managing transit service reliability.
Journal of Advanced Transportation, 21(spring), 47-65.
Agence métropolitaine de transport. (2003). Enquête origine-destination 2003. Montréal, QC.
Berkow, M., El-Geneidy, A., & Bertini, R. (2009). Beyond generating transit performance
measures: Visualizations and statistical analysis using historical data. Paper presented at
the Transportation Research Board 88th Annual Meeting, Washington DC.
Bertini, R., & El-Geneidy, A. (2004). Modeling schedule recovery processes in transit operations
for bus arrival time prediction. Journal of Transportation Engineering, 130(1), 56-67.
Conlon, M., Foote, P., O'Malley, K., & Stuart, D. (2001). Successful arterial street limited-stop
express bus service in Chicago. Transportation Research Record, 1760, 74-80.
Crout, D. T. (2007). Accuracy and precision of TriMet's Transit Tracker system. Paper presented
at the Transportation Research Board 86th Annual Meeting.
Dueker, K. J., Kimpel, T. J., Strathman, J. G., & Callas, S. (2004). Determinants of bus dwell
time. Journal of Public Transportation, 7(1), 21-40.
El-Geneidy, A., Strathman, J., Kimpel, T., & Crout, D. (2006). The effects of bus stop
consolidation on passenger activity and transit operations. Transportation Research
Record, 1971, 32-41.

26
Environment Canada. (2008). Climate Data Online. Retrieved June 16, 2008, from
http://www.climate.weatheroffice.ec.gc.ca/climateData/canada_e.html
Ercolano, J. M. (1984). Limited-Stop Bus Operations: An Evaluation. Transportation Research
Record, 994, 24-29.
Furth, P. (2006). Using archived AVL-APC data to improve transit performance and
management. Washington, DC: Transportation Research Board.
Furth, P., & Day, B. (1985). Transit routing and scheduling strategies for heavy demand
corridors. Transportation Research Record, 1011, 23-26.
Furth, P., Hemily, B., Muller, T., & Strathman, J. (2003). Uses of archived AVL-APC data to
improve transit performance and management: Review and potential (TCRP Web
Document No. H-28). Washington DC: Transportation Research Board.
Furth, P., & Muller, T. (2007). Service reliability and optimal running time schedules. Paper
presented at the Transportation Research Board 86th Annual Meeting.
Guenthner, R. P., & Sinha, K. C. (1983). Modeling bus delays due to passengers boardings and
alightings. Transportation Research Record, 915, 7-13.
Hensher, D. A., Stopher, P., & Bullock, P. (2003). Service quality-developing a service quality
index in the provision of commercial bus contracts. Transportation Research Part A, 37,
499–517.
Kimpel, T., Strathman, J., Bertini, R., Bender, P., & Callas, S. (2004). Analysis of transit signal
priority using archived TriMet bus dispatch system data. Paper presented at the 84th
Transportation Research Board Annual Meeting, Washington DC.
Levinson, H. (1983a). Analyzing transit travel time performance. Transportation Research
Record, 915, 1-6.

27
Levinson, H. (1983b). Analyzing transit travel time performance. Transportation Research
Record, 915, 1-6.
Murray, A., & Wu, X. (2003). Accessibility tradeoffs in public transit planning. [Article].
Journal of Geographical Systems, 5(1), 93-107.
Schweiger, C. L. (2003). Real-time bus arrival information systems. Washington, DC:
Transportation Research Board.
Silverman, N., Orosz, T., & Zicklin, A. (1998). Practitioner's Forum: Limited-Stop Bus Service
at New York City Transit. Journal of Transportation Engineering, 124(6), 503-509.
Société de Transport de Montréal. (2009, March 19, 2009). Un service de bus plus rapide et
compétitif grâce à la création de la ligne 467 express Saint-Michel et à l'implantation de
mesures prioritaires. Retrieved March 22, 2009, from http://www.stm.info/info/comm-
09/co090319b.htm
Strathman, J. G. (2002). Tri-Met's experience with automatic passenger counter and automatic
vehicle location systems. Portland OR: Center for Urban Studies, Portland State
University.
Strathman, J. G., Dueker, K. J., Kimpel, T. J., Gerhart, R. L., & Callas, S. (2002). Evaluation of
transit operations: Data applications of Tri-Met's automated bus dispatching system.
Transportation, 29, 321-345.
Strathman, J. G., Dueker, K. J., Kimpel, T. J., Gerhart, R. L., Turner, K., Taylor, P., et al. (2000).
Service reliability impacts of computer-aided dispatching and automatic location
technology: A Tri-Met case study. Transportation Quarterly, 54(3), 85-102.
Strathman, J. G., & Hopper, J. (1993). Empirical analysis of bus transit on-time performance.
Transportation Research Part A, 27(2), 93-100.

28
Tétreault, P., & El-Geneidy, A. (2010). Estimating bus run times for new limited-stop service
using archived AVL and APC data. Transportation Research Part A, 44(6), 390-402.
Vuchic, V. (2005). Urban transit: Operations, planning and economics. Indianapolis, IN: John
Wiley and Sons.