Embed Size (px)
Citation preview

© 2000-2016 New York Independent System Operator, Inc. All Rights Reserved. © 2000-2016 New York Independent System Operator, Inc. All Rights Reserved.
Limited Fuel Resource Optimization (LERO)
Cuong Nguyen Senior Market Technologies Research Engineer, Technology Development
New York Independent System Operator
Increasing Market and Planning Efficiency through Improved Software Federal Energy Regulatory Commission Technical Conference
Washington, DC June 27, 2016

© 2000-2016 New York Independent System Operator, Inc. All Rights Reserved. 2
Background • The Polar vortex of winter 2013-2014 revealed some market
efficiency problems when resources with limited fuel were not able to explicitly reflect their fuel supply with the standard bidding parameters available to them. Limited-fuel resources include pumped storage hydro, oil-fired
generators, and gas-fired generators on critical winter days. • The 2013, 2014 and 2015 State of the Market Report for the New
York ISO recommended allowing suppliers to submit inter-temporal offers that better reflect fuel supply constraints in the Day-Ahead market.

© 2000-2016 New York Independent System Operator, Inc. All Rights Reserved. 3
© 2000-2016 New York Independent System Operator, Inc. All Rights Reserved. 4
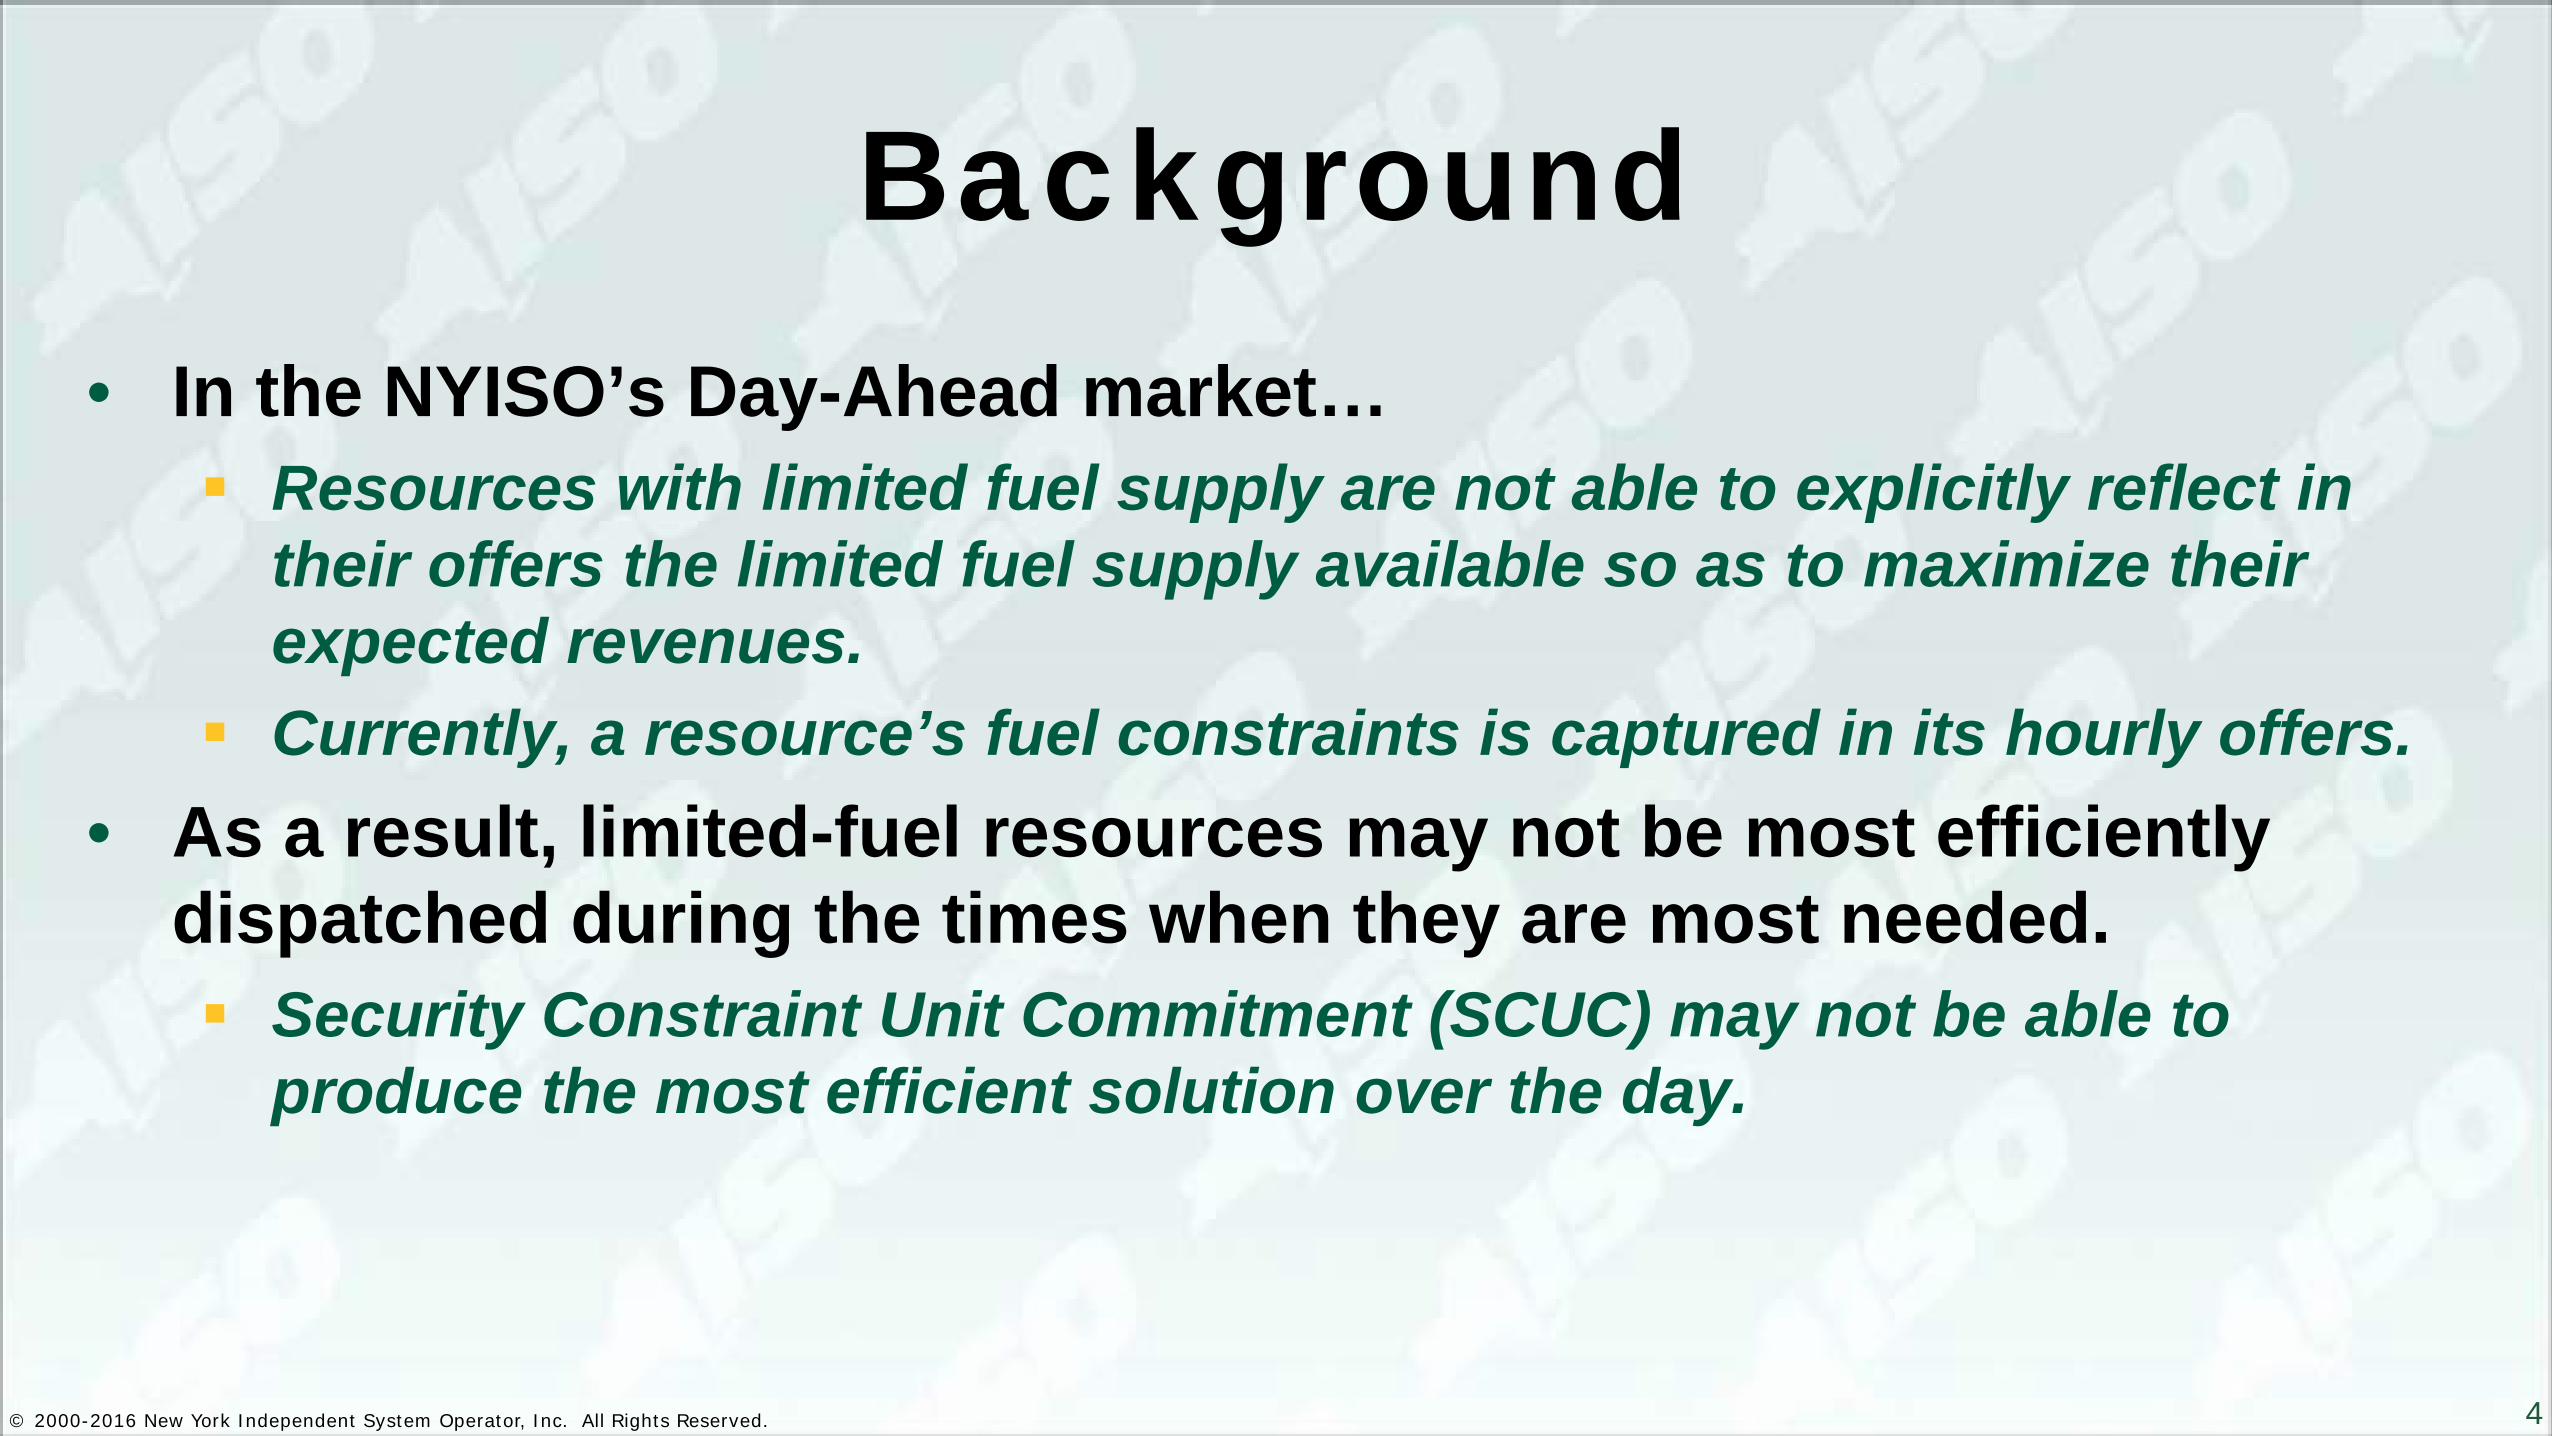
Background • In the NYISO’s Day-Ahead market…
Resources with limited fuel supply are not able to explicitly reflect in their offers the limited fuel supply available so as to maximize their expected revenues.
Currently, a resource’s fuel constraints is captured in its hourly offers. • As a result, limited-fuel resources may not be most efficiently
dispatched during the times when they are most needed. Security Constraint Unit Commitment (SCUC) may not be able to
produce the most efficient solution over the day.

© 2000-2016 New York Independent System Operator, Inc. All Rights Reserved. 5
Limited Fuel Resource Optimization (LERO)
• Day-Ahead Market optimization • LERO constraint targets Option 1: Total Energy Curve (TEC)
• Total energy output is modeled as a constraint • Require fuel to energy conversion to capture limited fuel input volume
Option 2: Fuel Cost & Efficiency Curve (FEC) • Explicitly impose fuel input constraint • Fully capture unit efficiency
The two options are not mutually exclusive

© 2000-2016 New York Independent System Operator, Inc. All Rights Reserved. 6
Three-Bus Examples
• Three bus model (two generator buses and a load bus) • Scheduling horizon is two hours • One unit (Gen 1) bidding with a fuel constraint

© 2000-2016 New York Independent System Operator, Inc. All Rights Reserved. 7
Option 1: Total Energy Curve Bidding (TEC)
• This design allows the Market Participant to submit an inter-temporal offer for a day or for a subset of hours during the day: Hourly three-part bids for a generator or each generator in a
portfolio A cost curve reflecting total energy capability in the
timeframe (MWh) and the cost to produce that energy ($/MWh) for the generator or portfolio

© 2000-2016 New York Independent System Operator, Inc. All Rights Reserved. 8
Option 1: TEC Problem Formulation

© 2000-2016 New York Independent System Operator, Inc. All Rights Reserved. 9
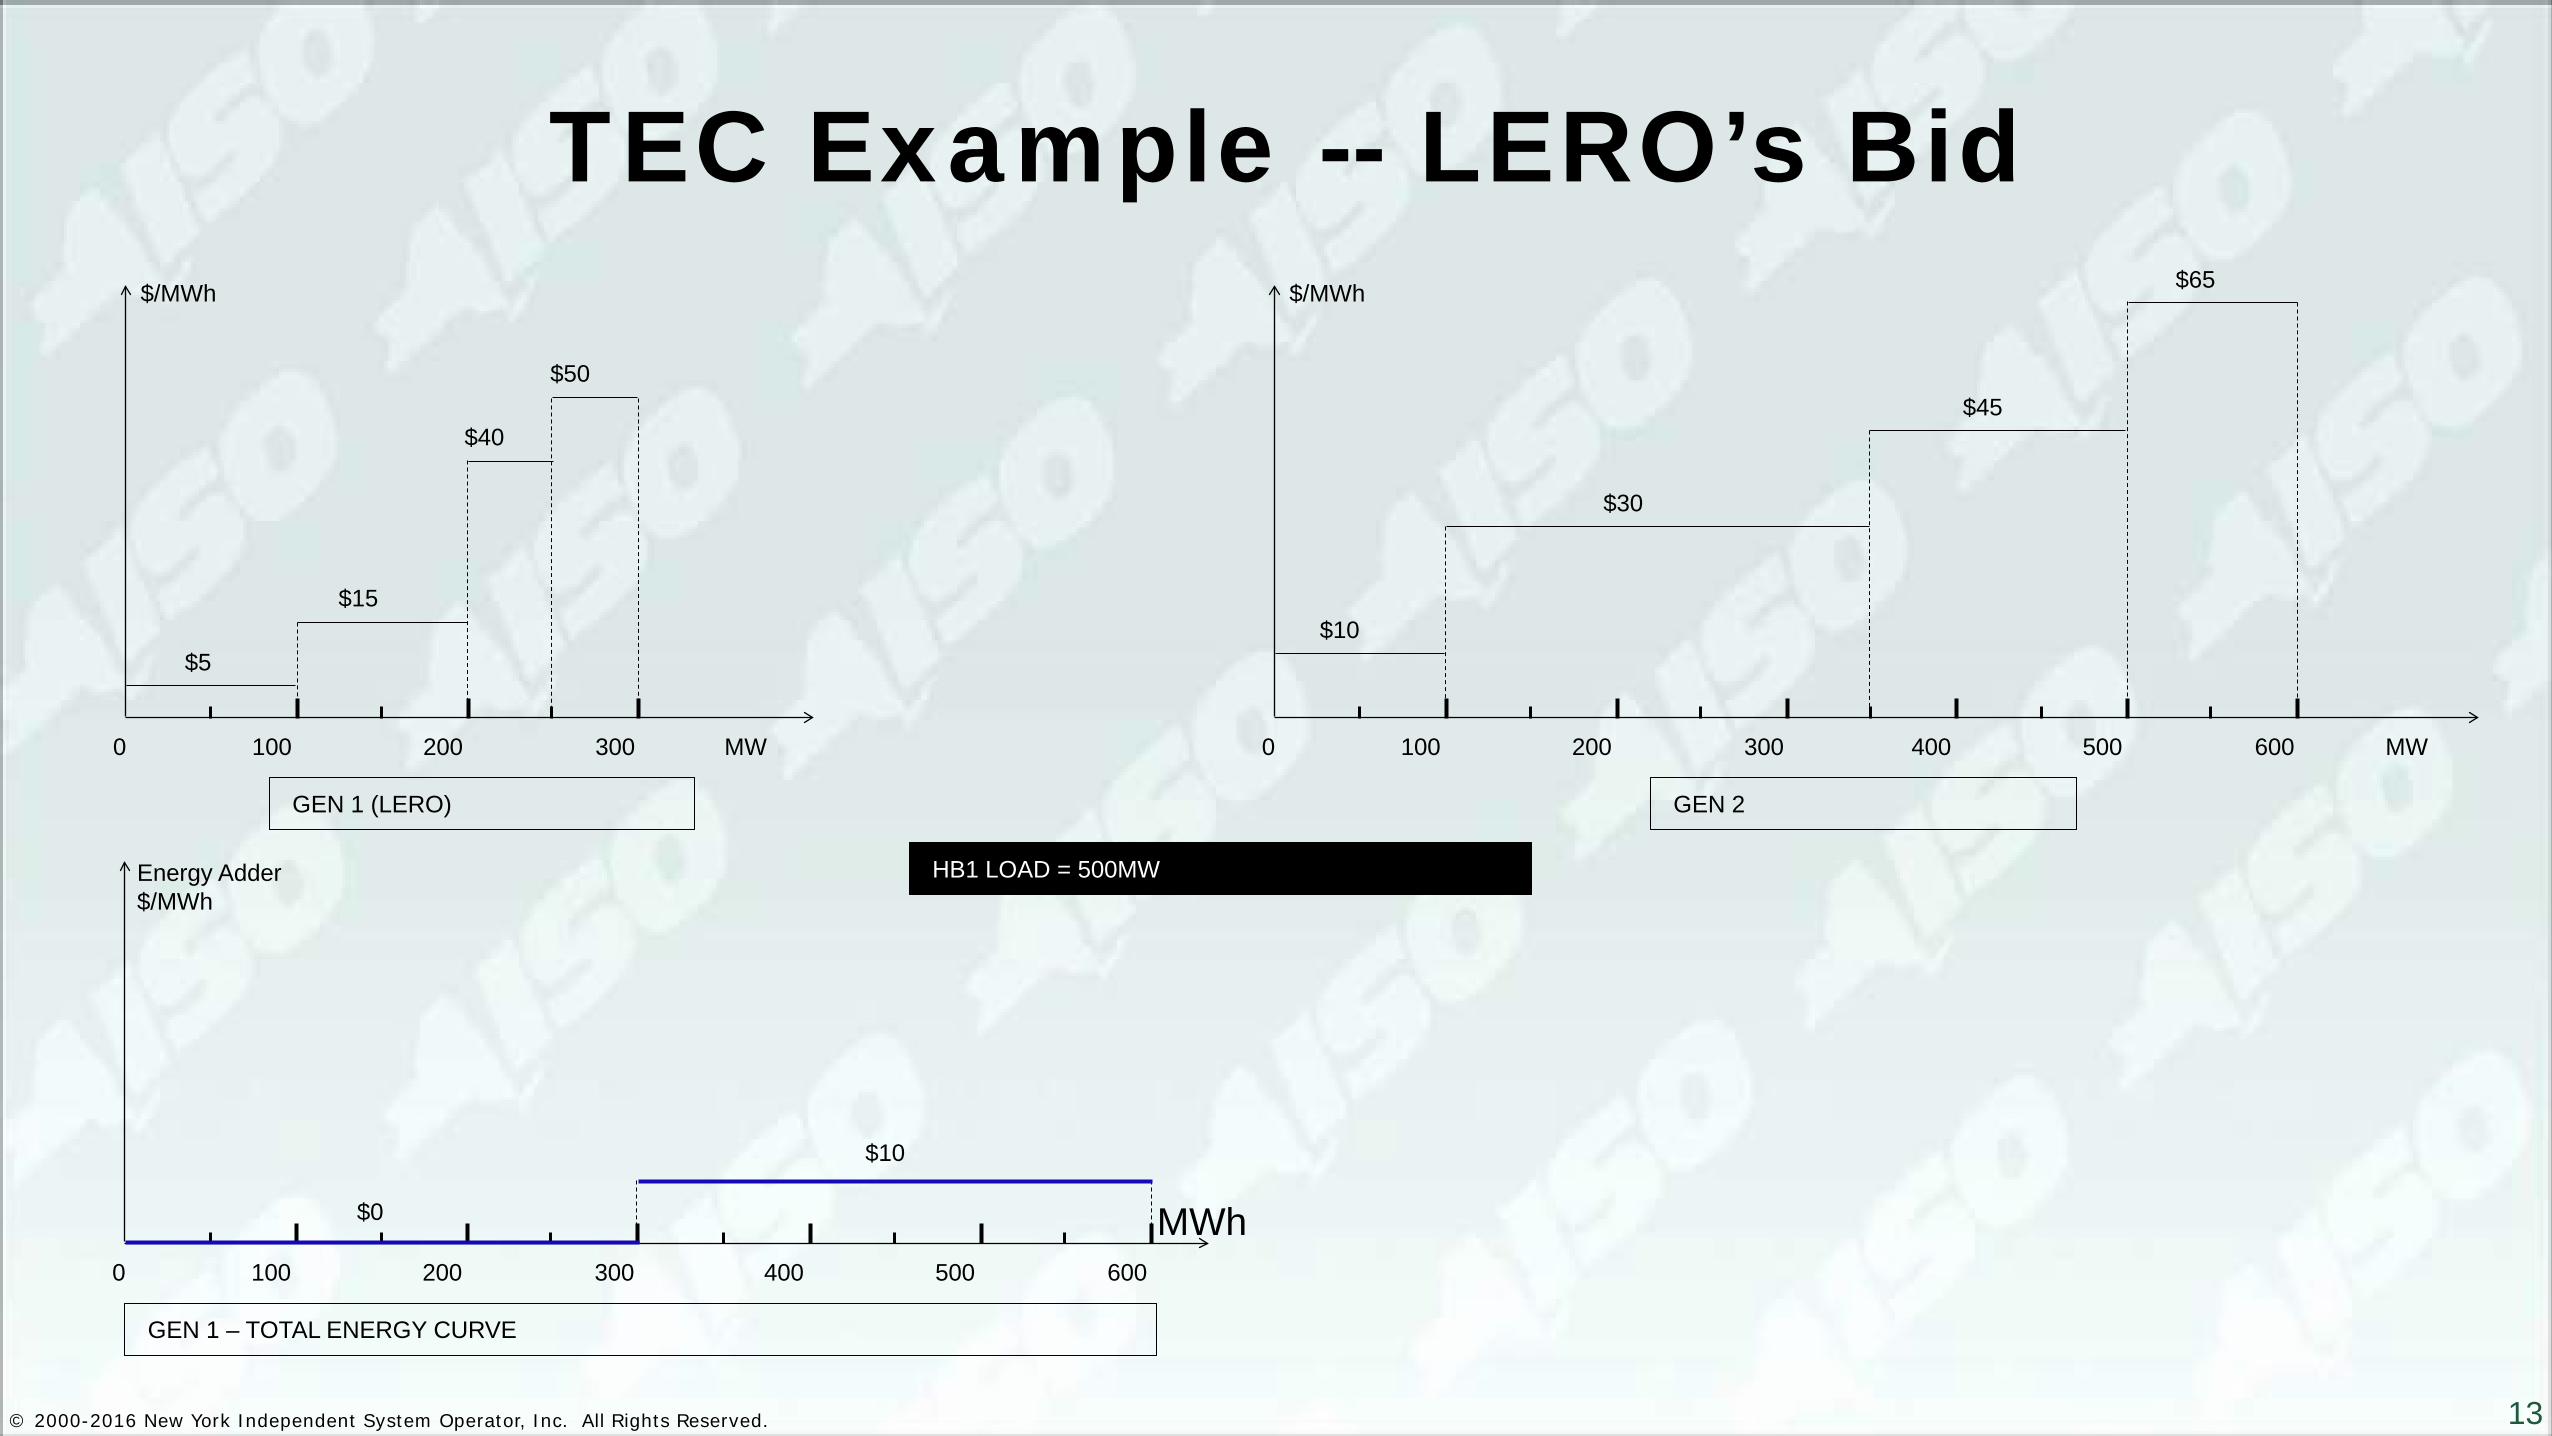
TEC Example
100 MW 0 200 300
$5
$15
$40
$50
$/MWh
GEN 1 (LERO)
100 0 200 300
$0
$10
$/MWh
GEN 1 – TOTAL ENERGY CURVE
400 500 600
MWh
100 MW 0 200 300
$10
$30
$45
$/MWh
400 500 600
$65
GEN 2
1
Hour
2
500
650 MW
LOAD

© 2000-2016 New York Independent System Operator, Inc. All Rights Reserved. 10
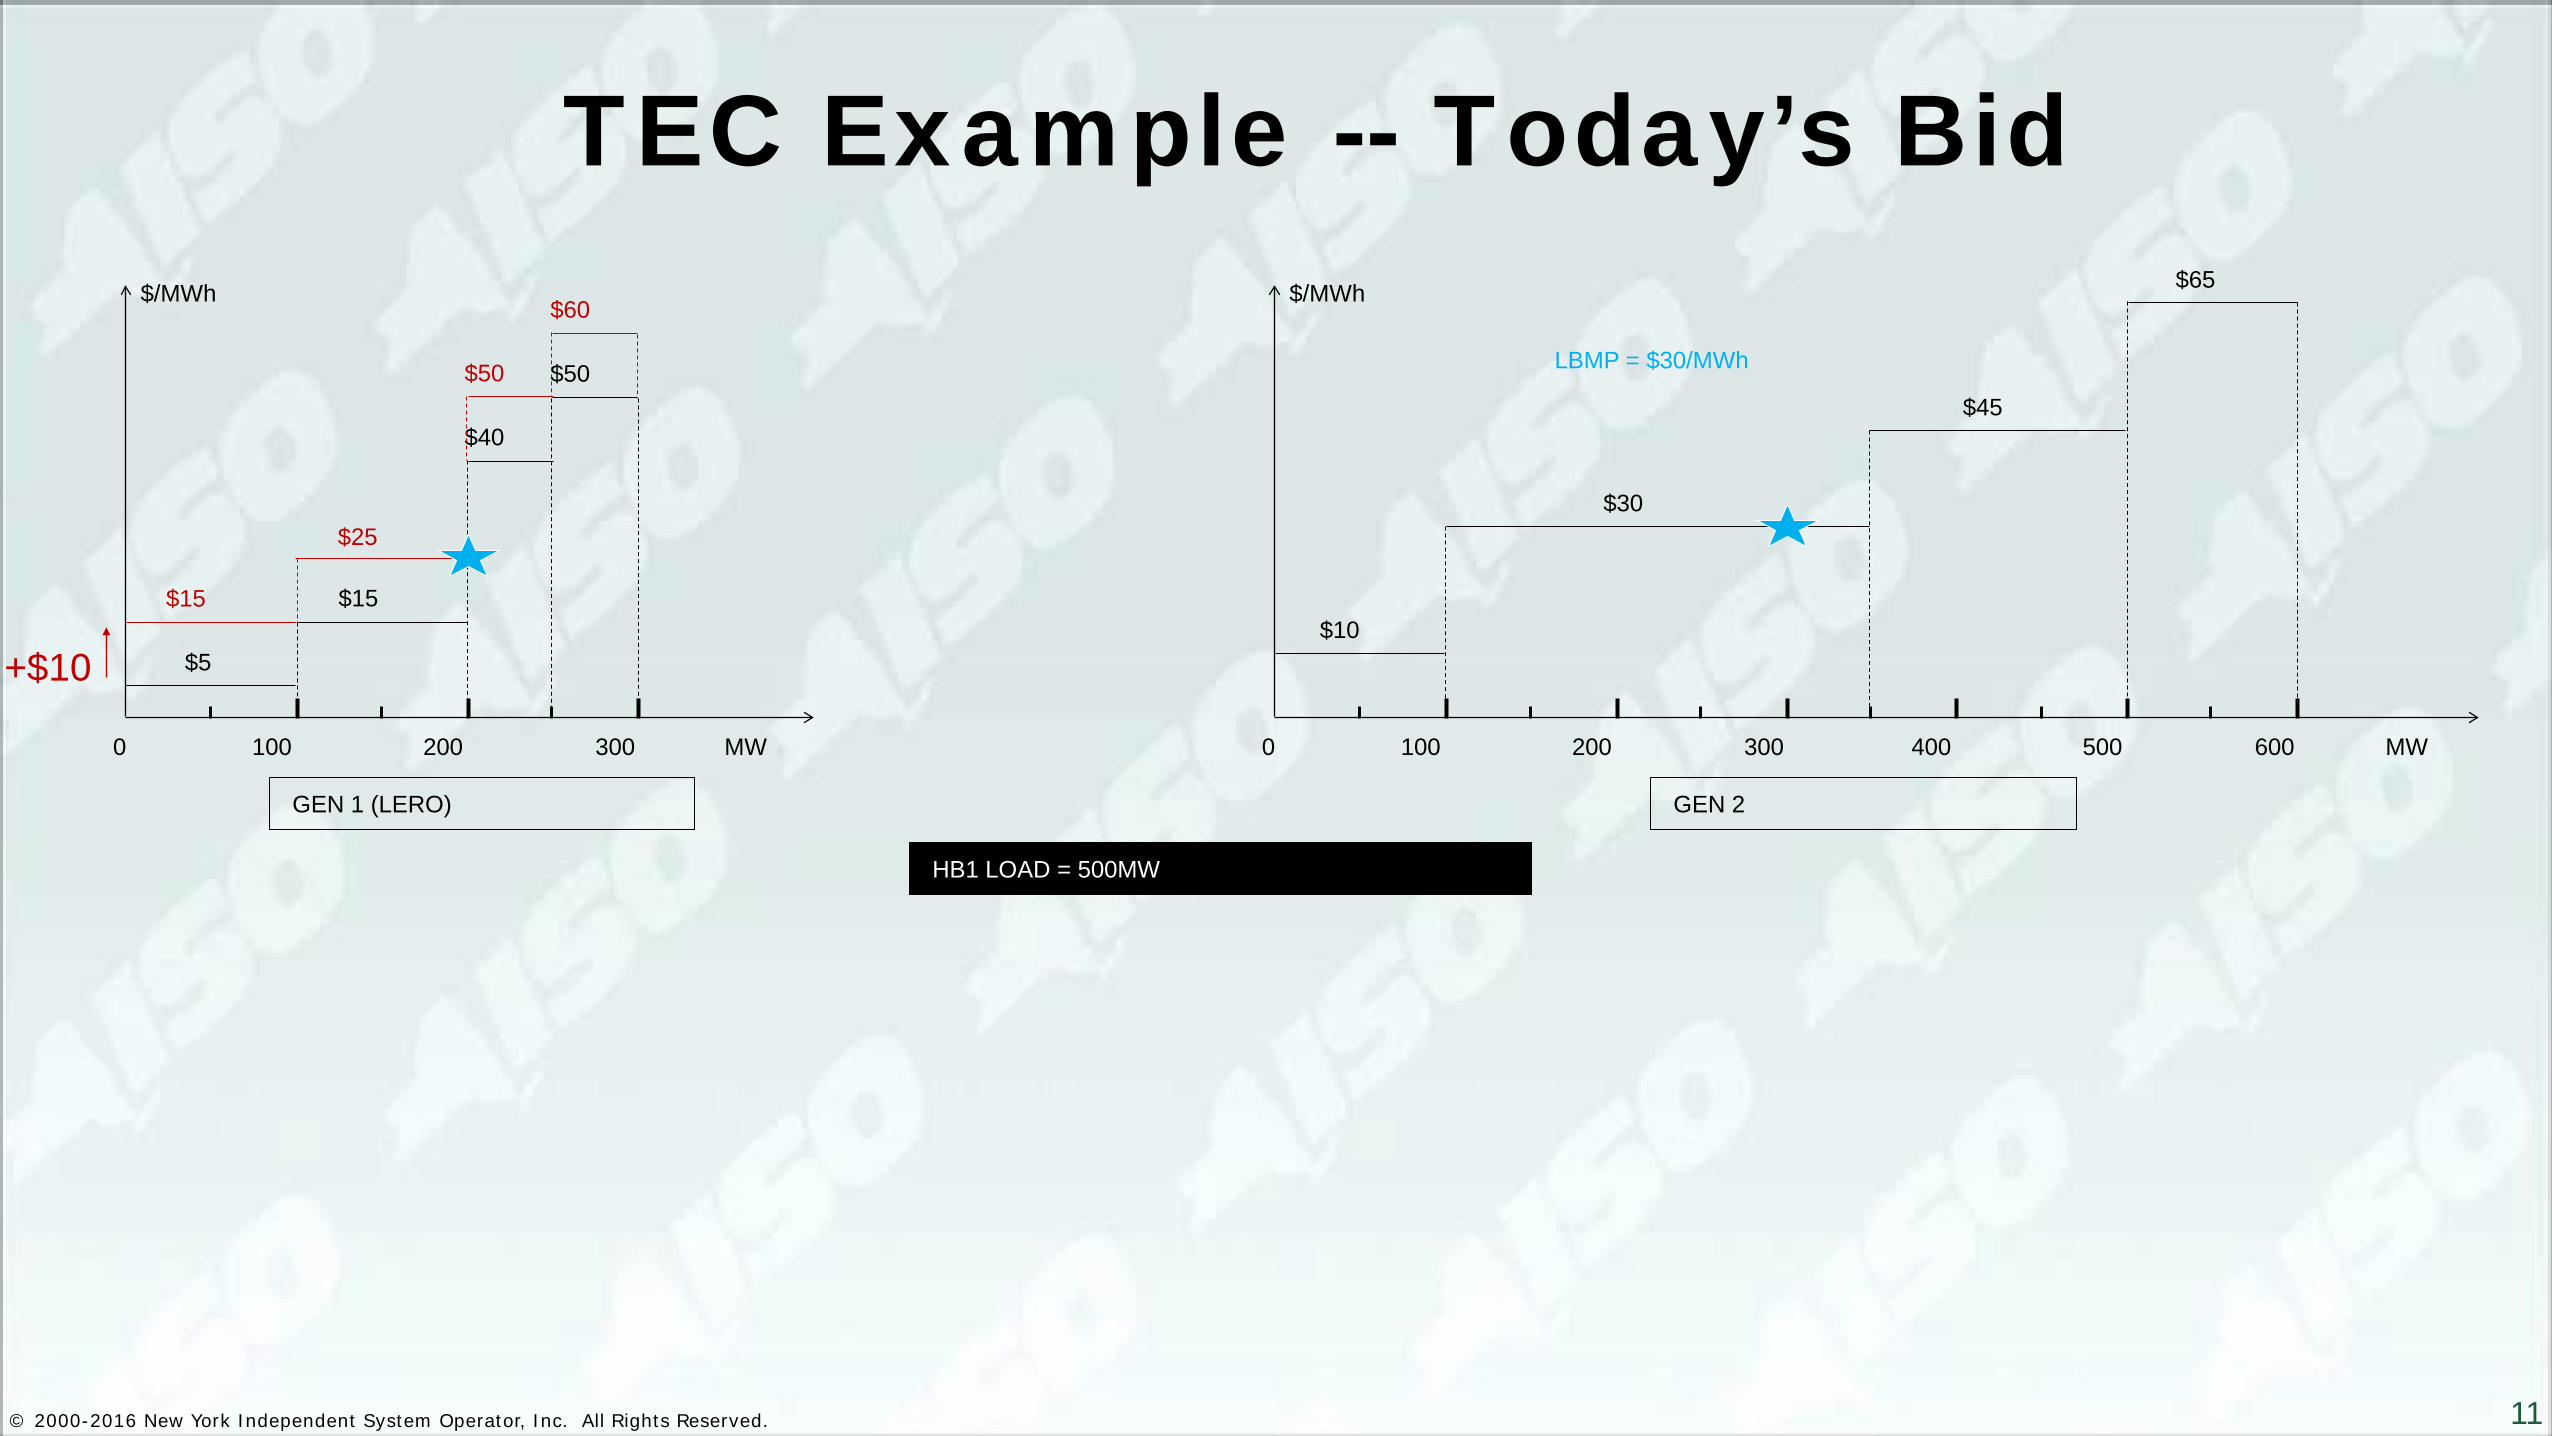
TEC Example -- Today’s Bid
100 MW 0 200 300
$5
$15
$40
$50 $50
$60 $/MWh
100 MW 0 200 300
$10
$30
$45
$/MWh
400 500 600
$65
GEN 1 (LERO) GEN 2
HB1 LOAD = 500MW
$15
$25
+$10
© 2000-2016 New York Independent System Operator, Inc. All Rights Reserved. 11
TEC Example -- Today’s Bid
100 MW 0 200 300
$5
$15
$40
$50 $50
$60 $/MWh
100 MW 0 200 300
$10
$30
$45
$/MWh
400 500 600
$65
GEN 1 (LERO) GEN 2
HB1 LOAD = 500MW
LBMP = $30/MWh
$15
$25
+$10

© 2000-2016 New York Independent System Operator, Inc. All Rights Reserved. 12
TEC Example -- Today’s Bid
100 MW 0 200 300
$5
$15
$40
$50
$/MWh
100 MW 0 200 300
$10
$30
$45
$/MWh
400 500 600
$65
GEN 1 (LERO) GEN 2
HB2 LOAD = 650MW
LBMP = $45/MWh
© 2000-2016 New York Independent System Operator, Inc. All Rights Reserved. 13
TEC Example -- LERO’s Bid
100 0 200 300
$0
$10
Energy Adder $/MWh
GEN 1 – TOTAL ENERGY CURVE
400 500 600
100 MW 0 200 300
$5
$15
$40
$50
$/MWh
100 MW 0 200 300
$10
$30
$45
$/MWh
400 500 600
$65
GEN 1 (LERO) GEN 2
HB1 LOAD = 500MW
MWh

© 2000-2016 New York Independent System Operator, Inc. All Rights Reserved. 14
TEC Example -- LERO’s Bid
100 0 200 300
$0
$10
Energy Adder $/MWh
GEN 1 – TOTAL ENERGY CURVE
400 500 600
100 MW 0 200 300
$5
$15
$40
$50
$/MWh
100 MW 0 200 300
$10
$30
$45
$/MWh
400 500 600
$65
GEN 1 (LERO) GEN 2
HB1 LOAD = 500MW
LBMP = $30/MWh
MWh

© 2000-2016 New York Independent System Operator, Inc. All Rights Reserved. 15
TEC Example -- LERO’s Bid
100 0 200 300
$0
$10
Energy Adder $/MWh
GEN 1 – TOTAL ENERGY CURVE
400 500 600
100 MW 0 200 300
$5
$15
$40
$50
$/MWh
100 MW 0 200 300
$10
$30
$45
$/MWh
400 500 600
$65
GEN 1 (LERO) GEN 2
HB2 LOAD = 650MW
LBMP = $45/MWh
MWh

© 2000-2016 New York Independent System Operator, Inc. All Rights Reserved. 16
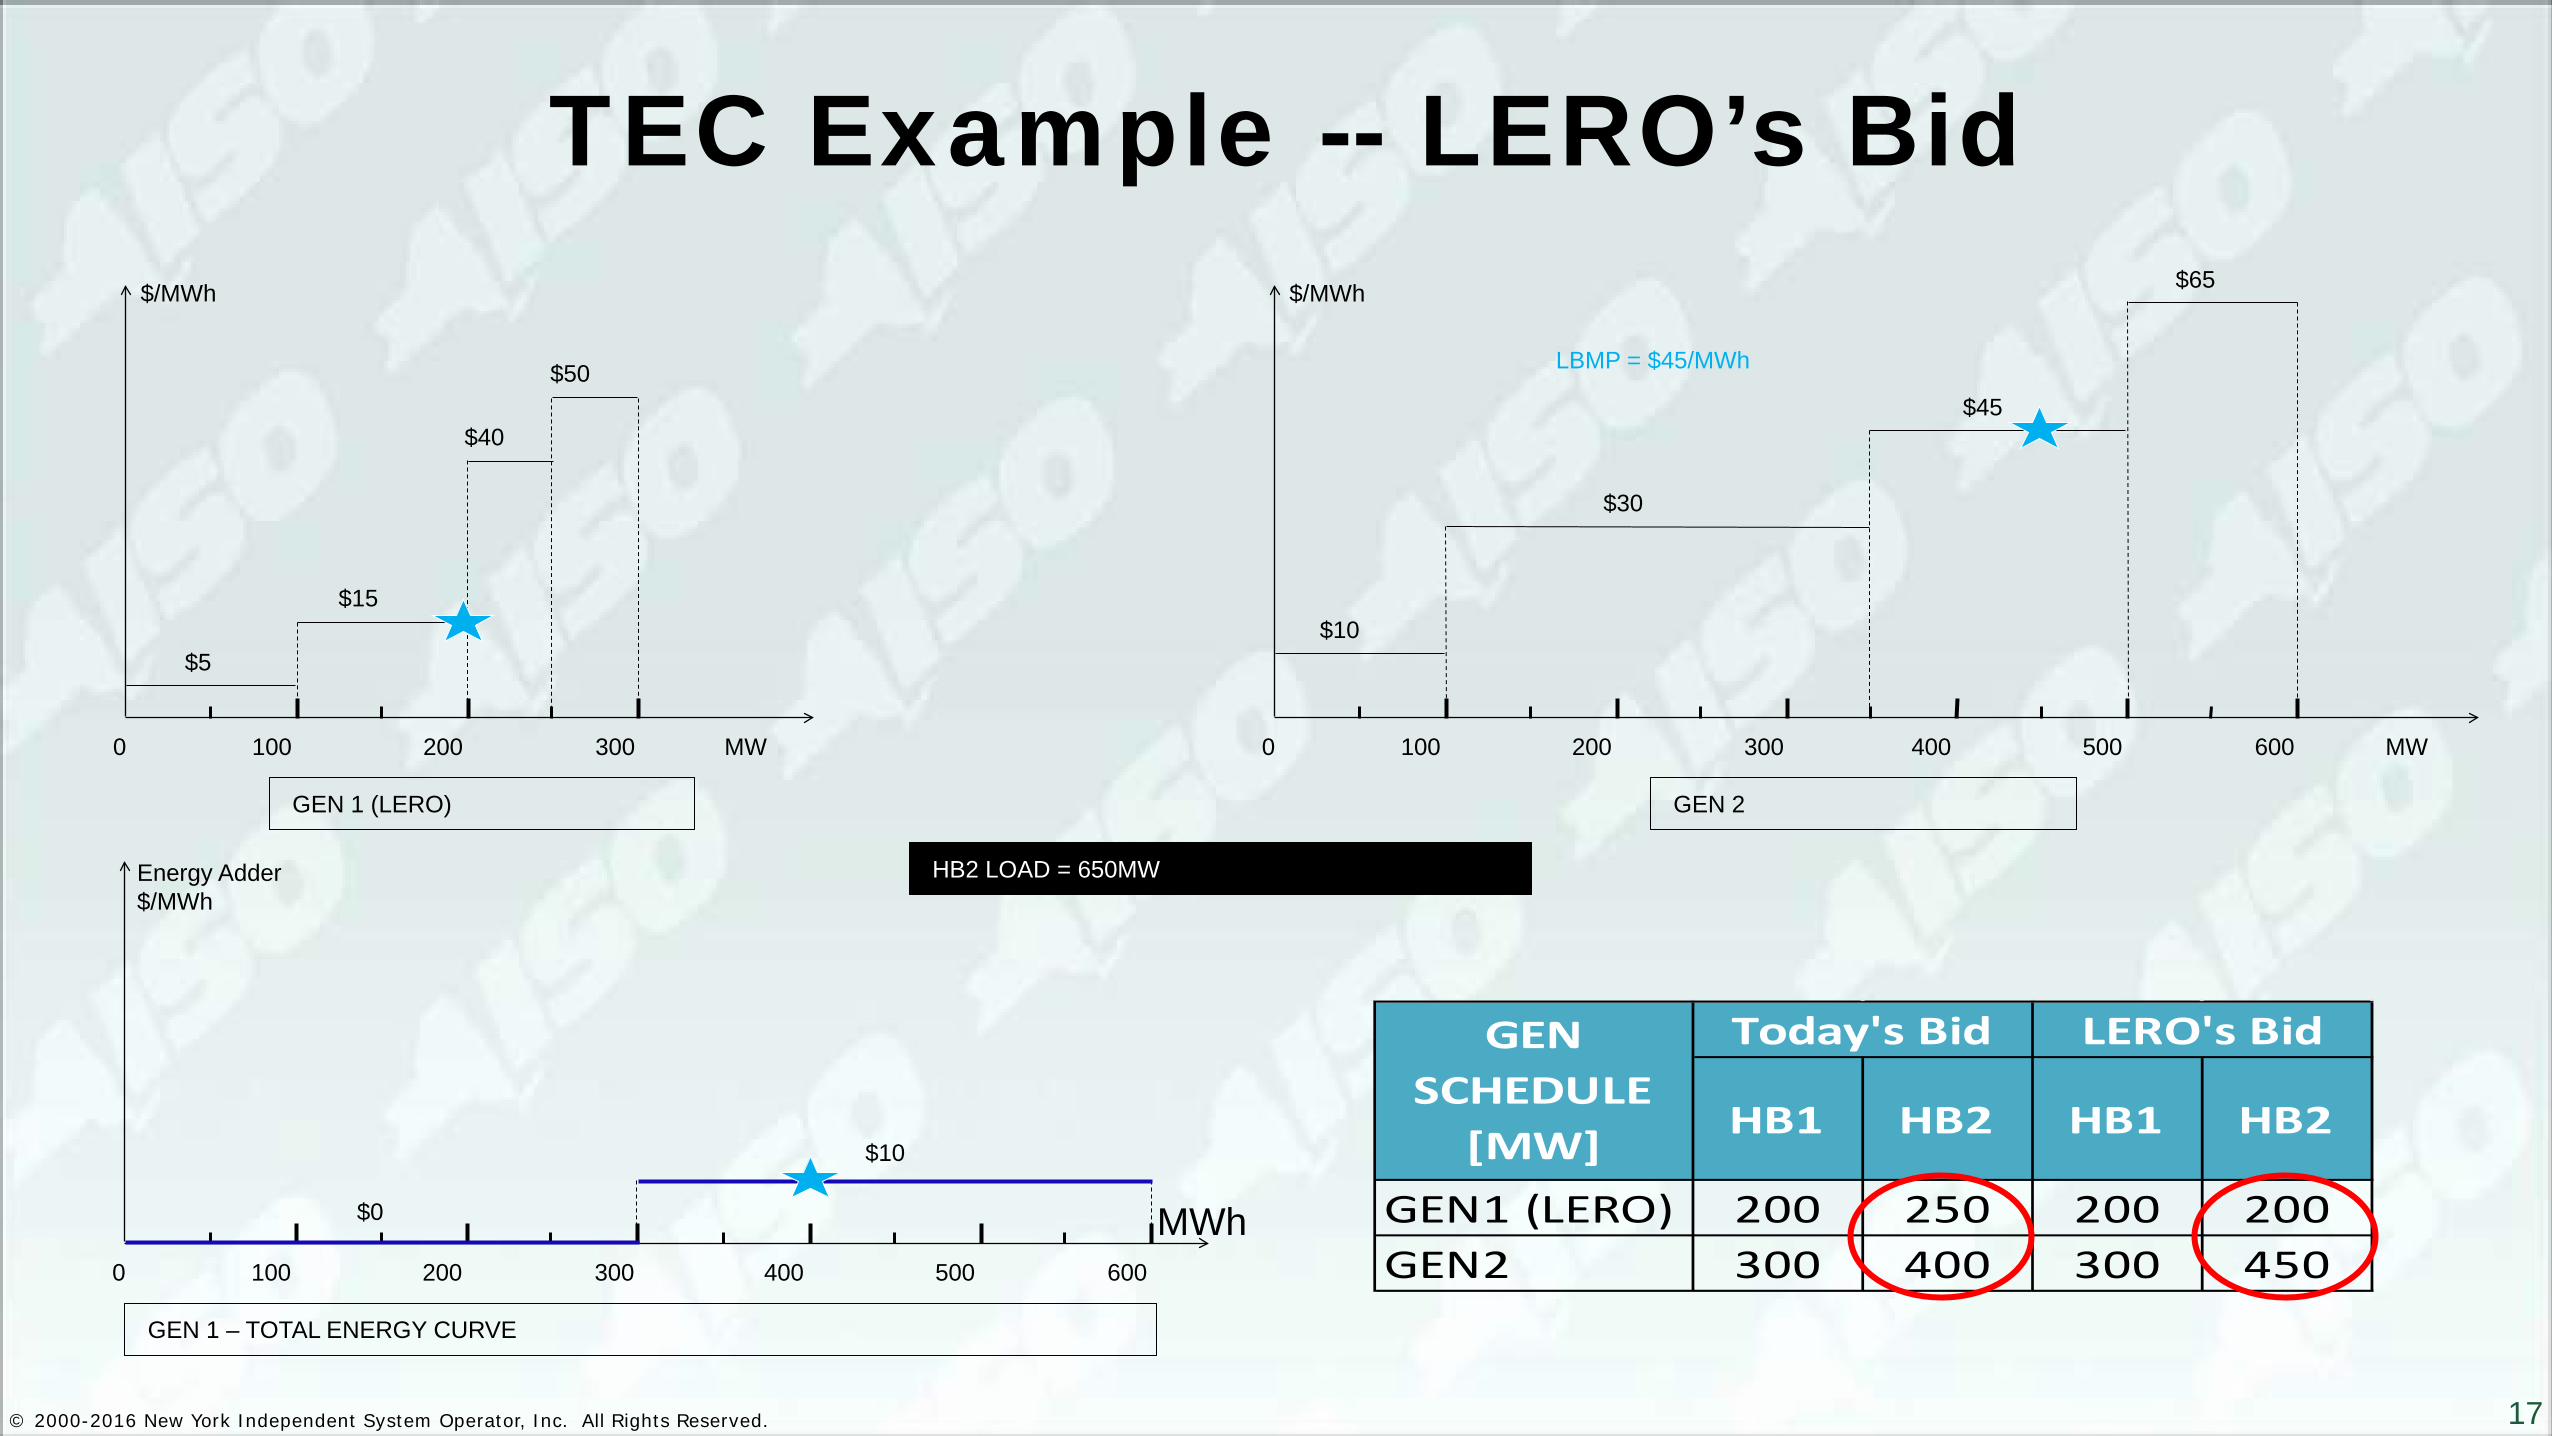
TEC Example -- LERO’s Bid
100 0 200 300
$0
$10
Energy Adder $/MWh
GEN 1 – TOTAL ENERGY CURVE
400 500 600
100 MW 0 200 300
$5
$15
$40
$50
$/MWh
100 MW 0 200 300
$10
$30
$45
$/MWh
400 500 600
$65
GEN 1 (LERO) GEN 2
HB2 LOAD = 650MW
LBMP = $45/MWh
MWh
HB1 HB2 HB1 HB2
GEN1 (LERO) 200 250 200 200GEN2 300 400 300 450
Today's BidGEN SCHEDULE
[MW]
LERO's Bid
© 2000-2016 New York Independent System Operator, Inc. All Rights Reserved. 17
TEC Example -- LERO’s Bid
100 0 200 300
$0
$10
Energy Adder $/MWh
GEN 1 – TOTAL ENERGY CURVE
400 500 600
100 MW 0 200 300
$5
$15
$40
$50
$/MWh
100 MW 0 200 300
$10
$30
$45
$/MWh
400 500 600
$65
GEN 1 (LERO) GEN 2
HB2 LOAD = 650MW
LBMP = $45/MWh
MWh
HB1 HB2 HB1 HB2
GEN1 (LERO) 200 250 200 200GEN2 300 400 300 450
Today's BidGEN SCHEDULE
[MW]
LERO's Bid

© 2000-2016 New York Independent System Operator, Inc. All Rights Reserved. 18
• Gen Schedule and LBMP: GEN1 activated the Total Energy Curve constraint GEN2 was marginal in both hours
• This example demonstrates how market efficiency and generator revenues can be
improved through a generator’s reflection of fuel cost adders in a Total Energy Curve rather than guessing when and where to place adders in hourly bids under the current bidding construct.
TEC Example -- Summary
Today's LERO's HB1 HB2 HB1 HB2
GEN1 (LERO) 200 250 200 200GEN2 300 400 300 450LBMP ($/MWh) 30 45 30 45
GEN SCHEDULE MW
Gen 1 Strategy Gen 1 Actual Production Cost
Total SystemProduction Cost
Gen 1 Net Revenue
Gen 2 Net Revenue2
Adder placed in HB1 hourly bids (current bid construct) 7,500$ 25,250$ 9,750$ 9,250$ Adder in Total Energy Curve(Fuel Constrained Bidding) 5,000$ 25,000$ 10,000$ 9,250$ Delta (2,500)$ (250)$ 250$ -$
© 2000-2016 New York Independent System Operator, Inc. All Rights Reserved. 19
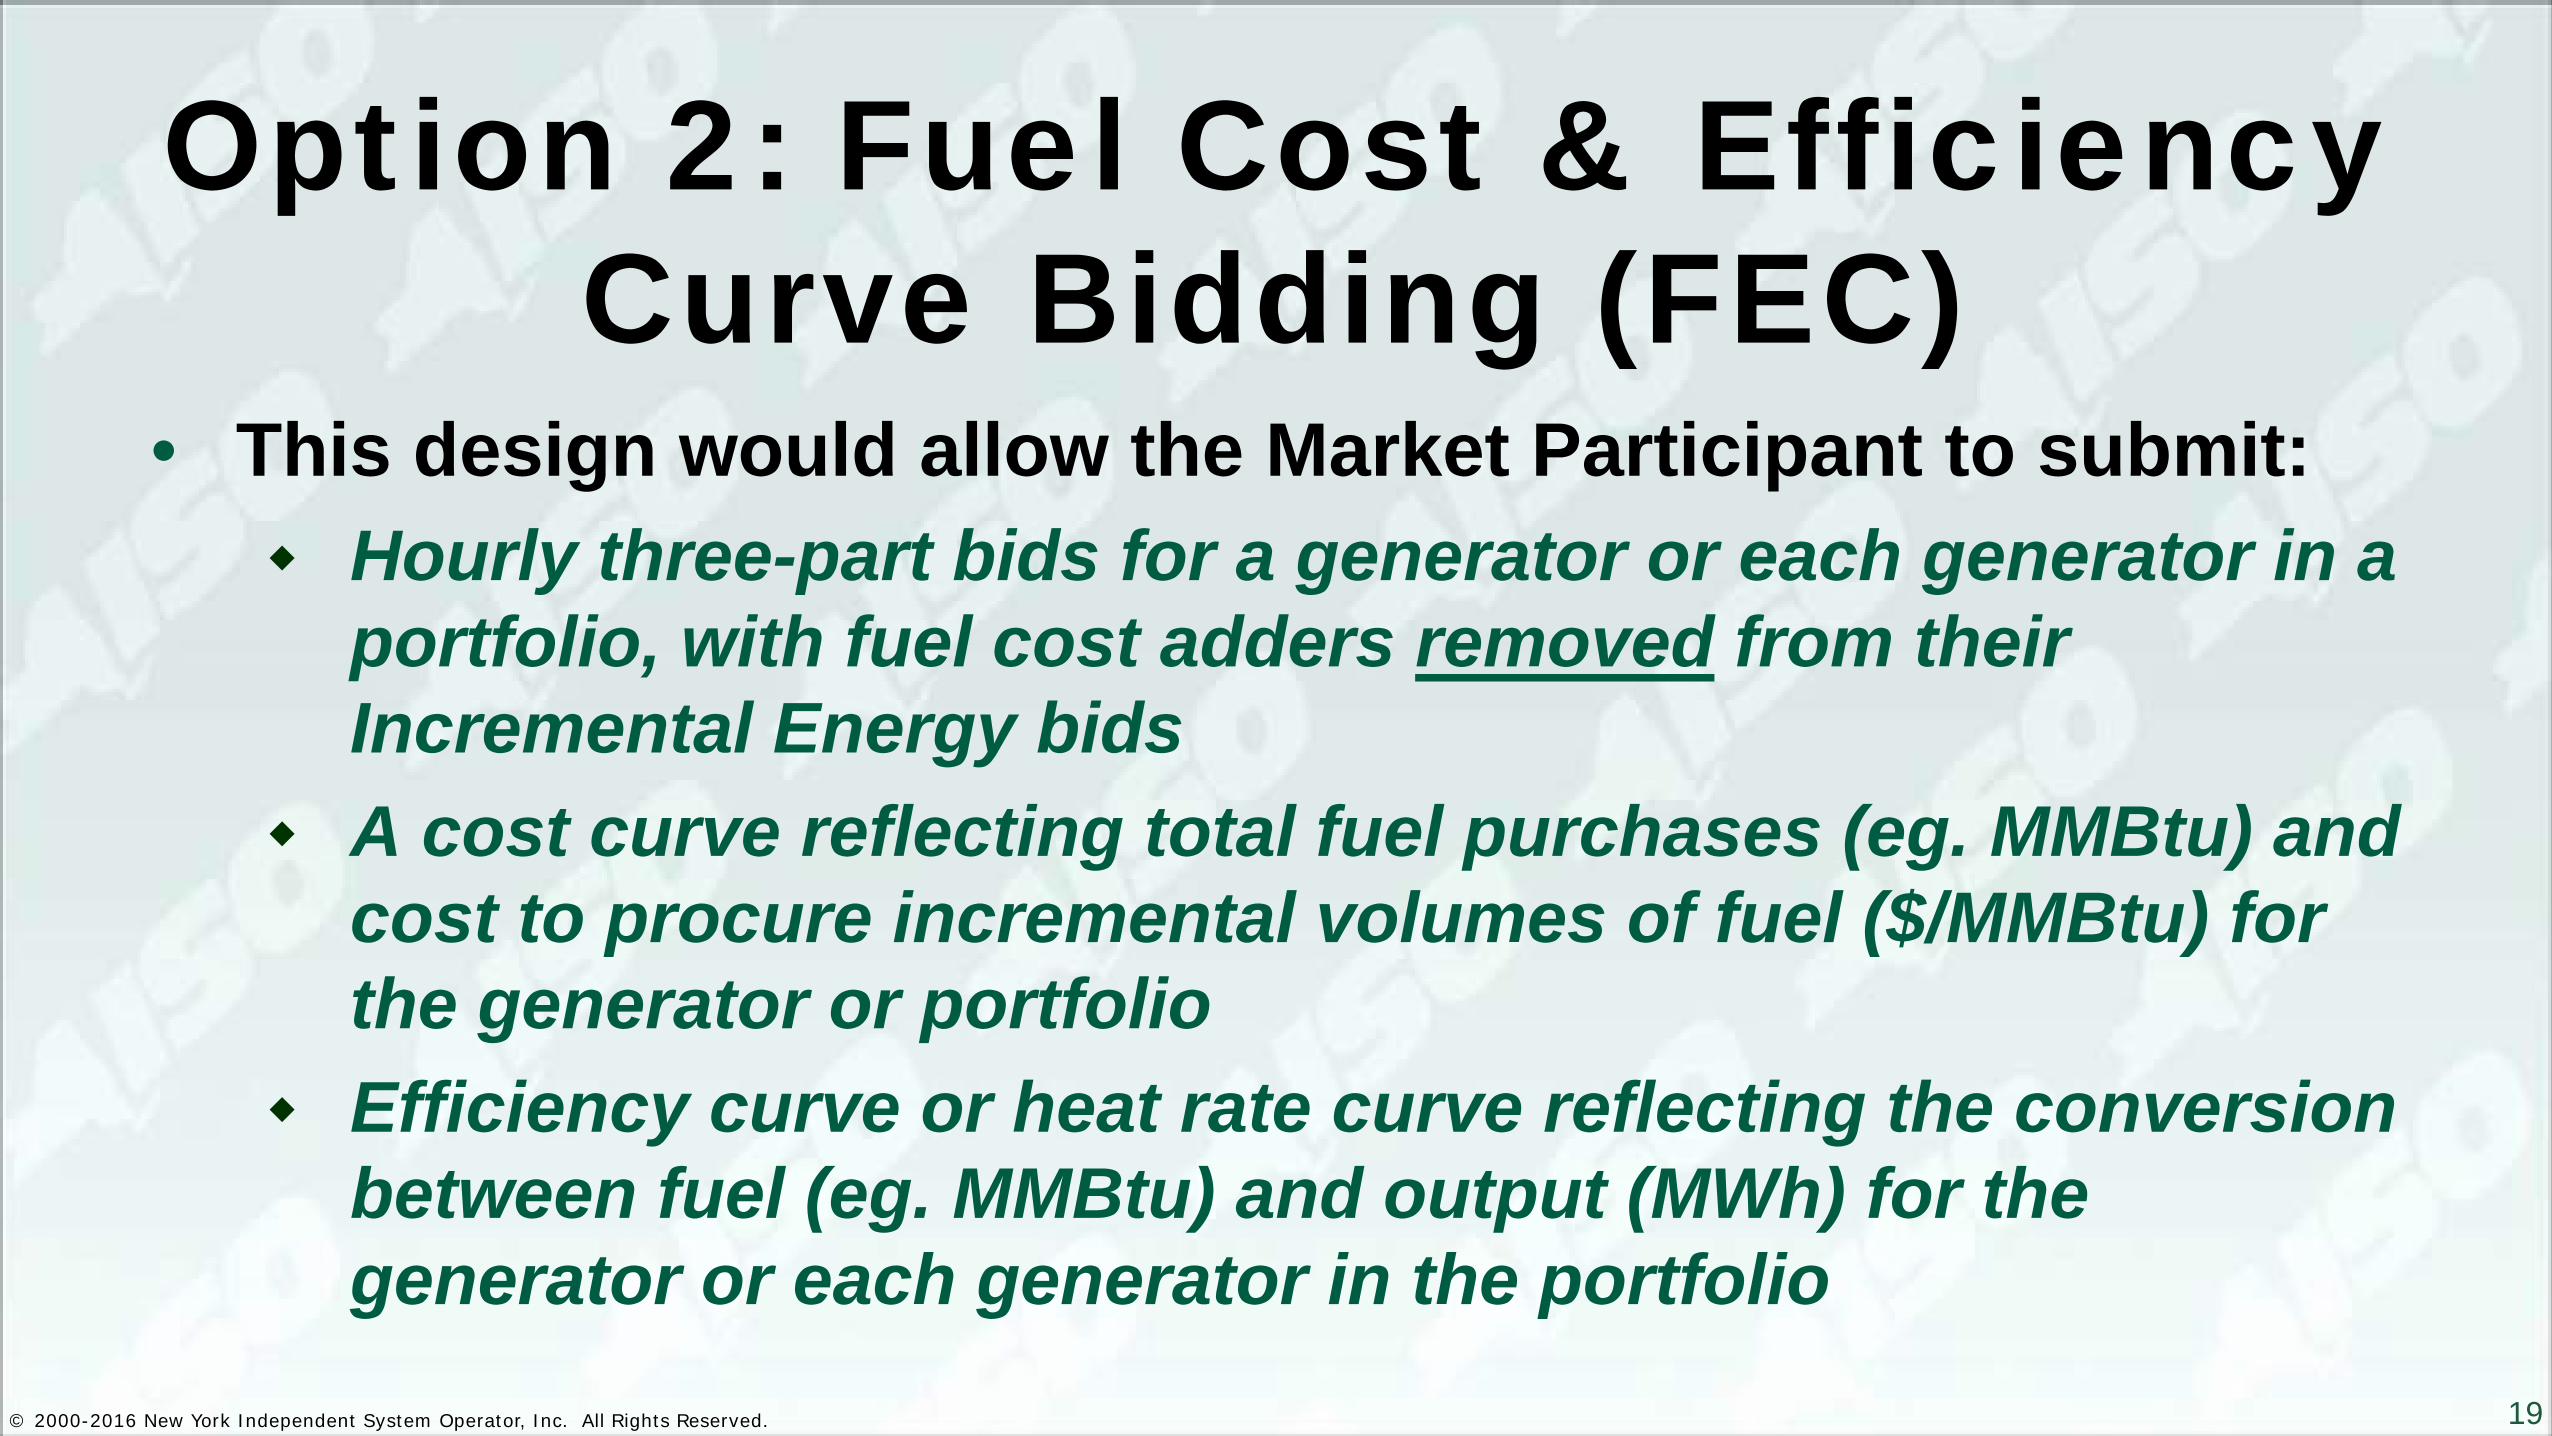
Option 2: Fuel Cost & Efficiency Curve Bidding (FEC)
• This design would allow the Market Participant to submit: Hourly three-part bids for a generator or each generator in a
portfolio, with fuel cost adders removed from their Incremental Energy bids
A cost curve reflecting total fuel purchases (eg. MMBtu) and cost to procure incremental volumes of fuel ($/MMBtu) for the generator or portfolio
Efficiency curve or heat rate curve reflecting the conversion between fuel (eg. MMBtu) and output (MWh) for the generator or each generator in the portfolio

© 2000-2016 New York Independent System Operator, Inc. All Rights Reserved. 20
Option 2: FEC Problem Formulation

© 2000-2016 New York Independent System Operator, Inc. All Rights Reserved. 21
FEC Example
100 MW 0 200 300
3,333 4,000
6,667
Incremental BTU/kWh
GEN 1 (LERO)
0 1,495 $0
$1.25
Natural Gas Cost Adder $/MMBtu
GEN 1 – FUEL COST CURVE 2,990
MMBtu
Fuel(Pmin) 430
MMBtu/h
7.5 $/MMBTU
50 MW430 MMBTU/h
3,225 $/h0 $
Mingen Cost
GEN1 fuel costNatural gas
GEN1 mingen
Fuel input at mingenMingen
Start-up Cost
GEN1 Conversion valuesBlock Index
Break Point, MW
Incremental Heat Rate, BTU/kWh
Incremental Energy Cost, $/MWh
Fuel consumption, MMBTU/h
Average Heat Rate, BTU/kWh
Efficiency, % Energy Output 1, MWh*
Energy Output 2, MWh**
IncrementalCost Adder, $/MWh
1 50 2,667 20 430 8,600 40% 174 348 3.33 2 100 3,333 25 597 5,967 57% 251 501 4.17 3 200 4,000 30 997 4,983 68% 300 600 5.00 4 300 6,667 50 1,663 5,544 62% 270 539 8.33
* Conversion energy at MMBTU1 fuel consumption** Conversion energy output at MMBTU2 fuel consumption
GEN1 Fuel Efficiency Curve
MMBTU1 MMBTU2
Note: • Base fuel cost is $7.5/MMBTU. Column “Incremental Energy Cost, $/MWh” shows equivalent energy bid • Total fuel available to the generator is 2,290 MBTU • If the unit consumes above1,495MMBTU, the unit will incur additional $1.25/MMBTU

© 2000-2016 New York Independent System Operator, Inc. All Rights Reserved. 22
FEC Example
100 MW 0 200 300
3,333 4,000
6,667
Incremental BTU/kWh
GEN 1 (LERO)
0 1,495 $0
$1.25
Natural Gas Cost Adder $/MMBtu
GEN 1 – FUEL COST CURVE 2,990
MMBtu
Fuel(Pmin) 430
MMBtu/h
7.5 $/MMBTU
50 MW430 MMBTU/h
3,225 $/h0 $
Mingen Cost
GEN1 fuel costNatural gas
GEN1 mingen
Fuel input at mingenMingen
Start-up Cost
100 0 200 300 GEN 1 – TOTAL ENERGY CURVE
400 500 600
Energy Adder $/MWh
GEN1 Conversion valuesBlock Index
Break Point, MW
Incremental Heat Rate, BTU/kWh
Incremental Energy Cost, $/MWh
Fuel consumption, MMBTU/h
Average Heat Rate, BTU/kWh
Efficiency, % Energy Output 1, MWh*
Energy Output 2, MWh**
IncrementalCost Adder, $/MWh
1 50 2,667 20 430 8,600 40% 174 348 3.33 2 100 3,333 25 597 5,967 57% 251 501 4.17 3 200 4,000 30 997 4,983 68% 300 600 5.00 4 300 6,667 50 1,663 5,544 62% 270 539 8.33
* Conversion energy at MMBTU1 fuel consumption** Conversion energy output at MMBTU2 fuel consumption
GEN1 Fuel Efficiency Curve
$0
$8.33
$5.00 MWh
MMBTU1 MMBTU2

© 2000-2016 New York Independent System Operator, Inc. All Rights Reserved. 23
FEC Example -- 68% Efficiency Conversion* • 68% Efficiency Conversion: This example shows a lower revenue for Gen 1 in HB1 where it is marginal.
Conversion at a lower power point ($5/MWh adder) than actual production ($8.33/MWh) resulted in a revenue loss for Gen 1. No change to gen schedule & prod cost.
Gen 1 Strategy Gen 1 Actual Production Cost
Total SystemProduction Cost
Gen 1 Net Revenue
Gen 2 Net Revenue
Adder in Total Energy Curve 18,490$ 25,490$ 5,260$ 500$ Adder in Fuel Cost and Efficiency Curve 18,490$ 25,490$ 6,093$ 500$ Delta -$ -$ 833$ -$
HB1 HB2 HB1 HB2Option 1's Bid Option 2's Bid
GEN1 (LERO) [MW] 250 200 250 200GEN2 [MW] 0 150 0 150LBMP ($/MWh) $55.00 $50.00 $58.33 $50.00
0
50
100
150
200
250
Gen S
ched
ule [M
W] &
LBM
P [$/
MW
h]
* Reference : http://www.nyiso.com/public/webdocs/markets_operations/committees/bic_miwg/meeting_materials/2016-03-
23/agenda%208%20Fuel%20Constrained%20Bidding%20%20MIWG%2032316.pdf

© 2000-2016 New York Independent System Operator, Inc. All Rights Reserved. 24
Conclusion • Both options reduce the risk of estimating where and when to
impose the energy/fuel cost adder • Option 1: Total Energy Curve (output constraint) accurately
optimizes the limited energy available to the generator(s) • Option 2: Fuel Cost & Efficiency Curve (input constraint)
accurately optimizes the limited fuel available to the generator(s) Option 2 will enable more complex future models such as emission
control and gas-electric coordination • If LERO generator/portfolio efficiency is uniform, Option 2 is
identical to Option 1

© 2000-2016 New York Independent System Operator, Inc. All Rights Reserved. 25
The Mission of the New York Independent System Operator, in collaboration with its stakeholders, is to serve the public interest and provide benefit to consumers by:
• Maintaining and enhancing regional reliability • Operating open, fair and competitive wholesale electricity markets • Planning the power system for the future • Providing factual information to policy makers, stakeholders and
investors in the power system
www.nyiso.com