Embed Size (px)
Citation preview
Limited Attention and the Allocation of Effort in Securities Trading
SHANE A. CORWIN and JAY F. COUGHENOUR*
ABSTRACT
While limited attention has been analyzed in a variety of economic and psychological settings, its impact on financial markets is not well understood. In this paper, we examine individual NYSE specialist portfolios and test whether liquidity provision is affected as specialists allocate their attention across stocks. Our results indicate that specialists allocate effort toward their most active stocks during periods of increased activity, resulting in less frequent price improvement and increased transaction costs for their remaining assigned stocks. Thus, the allocation of effort due to limited attention has a significant impact on liquidity provision in securities markets. *Shane Corwin is from the University of Notre Dame, Mendoza College of Business. Jay Coughenour is from the University of Delaware, Lerner College of Business and Economics. We thank Rob Stambaugh (the Editor) and an anonymous referee for their comments and suggestions. We also thank Rob Battalio, Tom Cosimano, Glen Dowell, Jeff Harris, Brian Hatch, George Korniotis, Alok Kumar, Paul Laux, Marc Lipson, Lin Peng, Natalia Piqueira, Scott Schaefer, Paul Schultz, Kumar Venkataraman, Wei Xiong, participants at the 2006 Western Finance Association meetings, and seminar participants at the University of Delaware, the University of Kansas, the University of Kentucky, the University of New Mexico, the University of Notre Dame, Texas Tech University, the University of Utah, and Villanova University for helpful comments. Coughenour gratefully acknowledges support through a University of Delaware GUR grant. Any errors are the responsibility of the authors.
1
Substantial evidence suggests that humans are limited in their ability to process information and to
perform multiple tasks simultaneously. Kahneman (1973) argues that this type of “limited attention”
requires individuals to allocate their cognitive resources across tasks, so that attention spent on one task
must reduce attention available for other tasks.1 In this paper, we test whether limited attention affects the
specialist’s ability to provide liquidity for securities listed on the New York Stock Exchange (NYSE).
Early work related to attention in the finance literature focuses on the information available to
investors. For example, Merton (1987) analyzes market equilibrium in a setting where investors know
about only a subset of securities.2 More recently, several theoretical and empirical studies examine the
effects of attention allocation on financial markets and investor behavior. Peng (2005) illustrates that
investors will optimally allocate their limited attention across sources of uncertainty to minimize total
portfolio uncertainty. Peng and Xiong (2006) show that investors with limited attention will resort to
simple decision rules, such as categorization, and these actions can explain well-documented patterns in
asset return covariation.3 Consistent with these theories, Huberman (2001), Huberman and Regev (2001),
and Barber and Odean (2007) provide evidence that investors tend to focus on familiar or attention-
grabbing stocks and that information may not be incorporated into prices until it attracts investor
attention. While this research provides indirect evidence of limited attention, direct tests are scarce
because it is difficult to measure attention and its allocation across tasks in financial market settings.
Market making on the NYSE provides an ideal setting for analyzing the effects of limited
attention for several reasons. First, the NYSE features individual specialists who are obligated to provide
liquidity for a well-defined set of securities. As a result, we can directly identify the set of securities
across which the specialist must divide his attention. Second, we can measure factors that necessitate the
allocation of attention across securities. We measure the degree of attention a specialist can provide to
any stock as an inverse function of the trading activity and absolute returns of all other stocks in the
specialist’s portfolio. Finally, because specialists provide an important source of liquidity through their
participation in trading, the effects of limited attention can be identified using various liquidity measures.
If limited attention forces a specialist to allocate effort across stocks, we expect his ability to provide

2
liquidity for a given stock to be negatively related to the attention requirements of other stocks in his
portfolio, all else constant. We refer to this as the Limited Attention Hypothesis.
The Limited Attention Hypothesis is based on the assumption that individual specialists face time
and processing constraints that limit their ability to monitor and process multiple orders simultaneously,
particularly during busy trading periods. While limited specialist attention can affect all stocks, we expect
the effects to be most evident for inactive securities for two reasons. First, specialists participate in a
larger fraction of trades and provide a greater proportion of liquidity for inactive securities (see Madhavan
and Sofianos (1998)). As a result, changes in specialist participation should be most apparent for these
securities. Second, cost-benefit models of attention allocation suggest that agents will allocate attention in
a manner that maximizes their total utility.4 Since specialists put more capital at risk when trading the
most active stocks and derive a large fraction of their profits from these stocks (see Sofianos (1995) and
Coughenour and Harris (2005)), we argue that they are less likely to divert attention from these securities.
We test the Limited Attention Hypothesis using intraday transaction data from TAQ combined
with trading floor location data from the NYSE’s specialist directories. Results from pooled time-series
and cross-sectional regressions indicate that the rate and magnitude of price improvement decrease and
bid-ask spreads increase as the specialist’s attention to other stocks at the trading panel increases. These
results hold after controlling for the stock’s own trading activity and return volatility, for firm fixed
effects, for time-of-day effects, and for market-wide variation in liquidity and attention. Further tests
indicate that the effects of limited attention are most evident for the least active stocks and are robust to
alternative specifications and econometric techniques. Together, our results indicate that limited attention
has a significant impact on liquidity provision in financial markets.
Our evidence is particularly notable given that several NYSE characteristics work to reduce the
effects of limited attention. NYSE specialists are highly regulated and their performance with respect to
liquidity provision is closely monitored. As a result, they have incentives to avoid attention problems.
During unusually busy periods, specialists can increase capacity by calling on “relief specialists” or
additional clerks. In addition, specialist firms appear to allocate stocks to trading panels in a manner that

3
reflects attention limits. The most active stocks generally trade apart from one another and with fewer
other securities, allowing specialists to maximize the attention paid to these stocks. Together, these
factors may mitigate the potential effects of an individual specialist’s limited attention. Nevertheless, we
document a significant relation between limited attention and liquidity provision.
Our empirical work is related to three recent studies of individual specialist portfolios. Battalio,
Ellul, and Jennings (2007) examine time-series changes in transaction costs, focusing specifically on
changes in floor location. They find that specialists form cost-reducing relationships with floor brokers
and that these relationships take time to develop following a reorganization of the trading floor. Our
results provide additional evidence that the location of a security on the trading floor can influence
liquidity provision. In cross-sectional analyses, Huang and Liu (2004) find that NYSE specialists
subsidize the illiquid stocks in their portfolio and Boulatov, Hatch, Johnson, and Lei (2007) find that
quote adjustment speeds depend upon the prominence of the stock within the specialist’s portfolio. While
our evidence is generally consistent with these two studies, we note that cross-sectional analyses of
limited attention are difficult to interpret given the endogenous relation between stock characteristics and
specialist portfolios. In contrast, our study focuses on the time-series covariation between liquidity
provision and the activity of other stocks handled by the same specialist. This allows us to minimize the
aforementioned endogeneity problem and to directly test whether variation in attention affects the
specialist’s ability to provide liquidity.
Although prior studies suggest that limited attention may influence investors’ demand for
liquidity in financial markets, our study provides the first direct evidence that limited attention influences
the supply of liquidity. Specifically, we find that liquidity provision is significantly affected by the limited
attention of market makers and the resulting allocation of effort across securities. These findings point to
a potential but unexplored benefit of recent NYSE initiatives to automate a larger fraction of trading.
Increased automation of trade executions may reduce capacity constraints and allow specialists to focus
on those trades for which they add the most value. However, our analysis does not permit us to draw
conclusions about the optimality of alternative market structures or to determine whether a reduction in

4
capacity constraints would result in lower transaction costs for the overall market. We argue only that
market maker attention is limited and that the resulting effects are significant enough to be considered
along with other costs and benefits of market design. While our tests are based on data from the NYSE,
our findings may apply to other markets where dealers allocate attention across multiple securities.
The remainder of the paper is organized as follows. In Section I we discuss related literature and
develop our main hypothesis. Section II describes the data and sample characteristics. In Section III we
provide the main empirical tests of the Limited Attention Hypothesis. Section IV describes additional
tests and robustness checks and Section V concludes.
I. Background and Motivation
A. The NYSE Trading Floor and the Role of the Specialist
Each security traded on the NYSE is handled by a single specialist who is responsible for making
a “fair and orderly market” in the security. However, individual specialists are typically responsible for
making markets in multiple securities. As of August 2002, there were seven active specialist firms on the
NYSE trading at 19 trading posts and 357 trading panels. The number of securities traded at an individual
specialist panel (including common and preferred stocks, warrants, trusts, and other structured products)
ranged from one to 63. Throughout the paper, we refer to the stocks at a single panel as an individual
specialist portfolio.5
The decision of assigning a security to an individual specialist involves input from the listing
firm, the specialist firm, and the Exchange. Initially, stocks are allocated to specialist firms in accordance
with the Exchange’s Allocation Policy and Procedures (see Corwin (2004)). During this process, the
specialist firm identifies the individual specialist who will be assigned to the stock. Once allocated,
reassignments of stocks across specialist firms are rare.6 However, reassignments of stocks within a
specialist firm are relatively common and specialist firms have some flexibility in how they organize
stocks across trading panels. Corwin (2004) finds that stock allocations to NYSE specialist firms reflect
both performance and nonperformance variables. Notably, since specialist performance influences future

5
stock allocations, specialists may be unwilling to set unusually wide quotes or to avoid participation in the
trading process for extended periods of time.
B. Market Making and the Limited Attention Hypothesis
A NYSE specialist can affect liquidity in several ways. First, the specialist is responsible for
posting bid and ask quotes. At their discretion, the specialist can choose to either post quotes that reflect
the liquidity in the limited order book or add liquidity by posting quotes that improve upon the limit book
price or depth. Traditional microstructure models suggest that a market maker will set bid and ask quotes
conditional on their level of inventory risk and the probability of informed trade.7 In addition, models of
limit order markets suggest that limit book dynamics will depend on order arrival rates and the patience of
traders (see Foucault, Kadan, and Kandel (2005) and Rosu (2006)). Notably, none of these models
account for the possibility that individual specialists may be subject to limited attention.
The specialist also has significant influence on liquidity through their role in executing trades at
prices better than the quotes. As described by Petersen and Fialkowski (1994), the specialist can generally
accomplish this in two ways. First, the specialist can “stop” a market order, guaranteeing a price at least
as good as the current quote. The specialist then attempts to fill the order at an improved price by
matching it with a subsequent incoming order. At worst, the stopped order will be executed at the
guaranteed price. Second, the specialist can participate in the trade directly by purchasing or selling from
their own inventory at a price better than the posted quotes. Both cases require specialist attention, though
only the second involves the direct participation of the specialist in the trade.
If specialists face attention limits, they may not be able to continuously incorporate information
or act as a source of liquidity for all securities in their portfolio. During busy periods, specialists may be
forced to allocate effort across the securities in their portfolio. If a specialist reduces the attention paid to
a particular security, it is likely to affect liquidity in two ways. First, the specialist is likely to minimize
their inventory and adverse selection risks by reducing or eliminating their participation in the posted bid-
ask quotes. Second, a specialist facing binding attention limits will be less able to improve liquidity by
6
participating in trades inside the quotes or by stopping orders. Together, these arguments suggest that the
specialist’s ability to provide liquidity will be negatively related to the attention requirements of other
stocks in his portfolio. We refer to this as the Limited Attention Hypothesis.
What factors determine how a specialist allocates effort? Given the intuition in Peng (2005), we
expect a constrained specialist to allocate effort toward those stocks that have the greatest impact on his
utility. In particular, we expect specialists to focus on those stocks that have the largest influence on their
portfolio profits and risk. Given that specialists place the most capital at risk when trading the largest,
most active securities, it is reasonable to expect that these securities have the greatest impact on specialist
risk. In addition, the largest, most active securities account for the vast majority of specialist profits. For
example, Coughenour and Harris (2005) find that roughly 82% of combined specialist revenue is derived
from the 100 most active NYSE stocks. Thus, both profit and risk considerations suggest that specialists
will allocate their attention toward the largest, most active stocks in their portfolio.
If specialists allocate attention toward the largest, most active securities, the attention devoted to
the less active securities in their portfolio must be reduced. This suggests that the effects of limited
attention should be most evident for small, inactive securities. The effects of limited attention may also
have a greater impact on inactive securities because specialists provide a larger fraction of liquidity for
these securities. Madhavan and Sofianos (1998), for example, report that specialists participate in 54% of
share volume in the least active decile of NYSE stocks, compared to only 15% in the most active decile.
Since small, inactive securities rely more on the specialist to supply liquidity, transaction costs for these
securities will be tied more directly to specialist actions. In contrast, transaction costs for active stocks are
more likely to reflect the actions of other traders and the liquidity in the limit order book.
II. Data and Sample Characteristics
To analyze the effects of limited attention within specialist portfolios, we must identify the NYSE
floor location of each security, each day. To accomplish this, we use daily NYSE Specialist Directories
from August 1, 2002 through October 31, 2002. For every NYSE-listed security, the directory identifies

7
the specialist firm assigned to the security, as well as the post and panel at which the security trades on
the NYSE floor. The number of securities listed in the directory (including all common and preferred
stocks, warrants, and structured products) ranges from 3,599 on August 1, 2002 to 3,609 on October 31,
2002.
To refine the sample, we combine the Specialist Directory data with additional information from
the Center for Research in Security Prices (CRSP). We start by identifying the sample of securities
included in both CRSP and the NYSE Specialist Directory for the full sample period from August 1
through October 31, 2002. This provides an initial sample of 2,515 securities. We then restrict the sample
to common stocks and ADRs (CRSP share code equal to 10, 11, 12, 30, or 31). This reduces the sample to
1,920 securities. Throughout the rest of the paper, we refer to these 1,920 securities as the “full sample,”
and we use this sample to define the characteristics of individual specialist portfolios.
For all liquidity analyses, we focus on the subset of stocks that meet an additional set of price and
trading restrictions. We remove stocks that experience a stock split during the sample period, stocks with
an average transaction price during the sample period of less than $3 or more than $200, stocks with an
average transaction price during any 30-minute period of less than $2, and stocks that trade in fewer than
800 of the 840 30-minute trading periods. These restrictions reduce the sample by 14, 125, 14, and 496
securities, respectively.8 We also remove 19 securities that either trade alone at a panel or have panel
attention, as defined below, equal to zero for more than 26 periods. The restricted sample used in the
regression analysis includes 1,252 NYSE-listed common stocks and ADRs.
For each security in the restricted sample, we estimate measures of price improvement and
execution costs at 30-minute intervals based on intraday trade and quote data from the NYSE’s TAQ
database. We define all liquidity and attention measures using only NYSE trades and quotes.9 For each
transaction, let t denote transaction time, p denote transaction price, a denote the ask price, b denote the
bid price, and m denote the bid-ask midpoint. To measure transaction costs, we define the quoted spread
(qst) as at – bt, the percentage quoted spread (pqst) as 100·qst/mt, the effective spread (est) as 2⏐pt – mt⏐,

8
and the percentage effective spread (pest) as 100·est/mt. We then aggregate by taking a trade-weighted
average across all trades during the 30-minute period.
Our hypothesis is motivated by the direct involvement of the specialist in the trading process.
Although spreads are affected by the actions of the specialist, they may also be influenced by the
placement of limit orders and the actions of other traders. To provide a more direct measure of the
specialist’s involvement in the trading process, we focus on trades that execute inside the quotes (or price-
improved trades). Coughenour and Harris (2005) find that specialists participate in 66% to 70% of trades
that occur inside the quotes, compared to only 28% to 30% of all trades. These results suggest that trades
occurring inside the quotes are more likely to reflect the direct involvement of the specialist in the trading
process and provide a useful means to assess the relation between limited attention and liquidity provision
by the specialist. We calculate both the magnitude and the rate of price improvement. For each trade, the
magnitude of price improvement equals the difference between the relevant quoted price and the
transaction price, stated as either a dollar amount or a percentage of the quote midpoint. Specifically, the
dollar magnitude of price improvement for a buy order equals at – pt and the percentage magnitude equals
(at – pt)/mt. Price improvement measures for sell orders are defined analogously based on the bid price.10
We then aggregate by taking a trade-weighted average across all trades during the 30-minute period. The
rate of price improvement equals the proportion of trades during the 30-minute period that occur inside
the bid and ask quotes.
The choice of a 30-minute aggregation period is largely driven by the nature of our hypothesis. A
30-minute interval should be fine enough to capture periods during which the specialist becomes time-
constrained and well-known intraday variation in trading activity and transaction costs (see, for example,
McInish and Wood (1992)). Aggregating over higher frequency periods (such as five-minute intervals)
would result in many zero-trade observations and noisier estimates of transaction costs for the less
actively traded stocks. Lower frequency aggregation periods (such as daily) would reduce the power of
our tests by smoothing over intraday periods of intense trading.
9
The Limited Attention Hypothesis suggests that specialists allocate effort away from the least
active securities and toward the most active securities. Following Coughenour and Harris (2005), we sort
our sample into three subsets based on trade frequency: the 100 most active, the next 400 mid-active, and
the remaining 752 least active securities. Specifically, we categorize stocks based on their median trade
frequency during the three-month pre-sample period from May through July, 2002. Throughout the paper
we conduct tests on the filtered sample of 1,252 securities and the trade activity subsamples.11
Table I provides summary statistics for the filtered sample of 1,252 securities and the three trade
activity subsamples. For each security, we first calculate the time-series mean of each variable. The table
then describes the cross-sectional distribution of these time-series means. Across the full sample (Panel
A), the average transaction price ranges from $3.15 to $121.73, with a mean of $26.58. The average firm
trades at least once in 837 of the 840 30-minute trading intervals, with an average volume of 65,000
shares or $1.89 million per period and an average trade size of 780 shares. Trading activity ranges from a
per period average of 5.8 trades and 1,700 shares to 329 trades and 1.2 million shares.
[INSERT TABLE I HERE]
On average, 36.3% of NYSE trades occur inside the quotes and the rate of price improvement
ranges from 15.2% to 54.8%. The average firm has a quoted bid-ask spread of 5.2 cents and an effective
spread of 3.8 cents, reflecting price improvement of 1.4 cents. The average percentage quoted spread is
26.7 basis points (bps) and the average percentage effective spread is 19.4 bps, reflecting price
improvement of 7.36 bps. The average magnitude of price improvement ranges from 0.41 to 5.57 cents
and from 1.59 to 47.63 bps.
The results for the three trade activity subsamples (Table I, Panel B) illustrate the substantial
cross-sectional variation in trading activity and liquidity. The most active stocks average 196 trades per
period, while the mid- and low-activity stocks average 89 and 26 trades per period, respectively.
Similarly, dollar volume drops from $11.1 million per period for the most active stocks, to $2.5 million
for the mid-activity stocks and $0.35 million for the least active stocks. The rate of price improvement
ranges from 35.9% for the least active stocks to 39.1% for the most active group. In addition, the
10
magnitude of price improvement ranges from 1.4 cents and 4.4 bps for the most active stocks to 1.5 cents
and 8.9 bps for the least active stocks. In comparison, percentage quoted spreads range from 14.2 bps for
the most active stocks to 33.2 bps for the least active stocks and percentage effective spreads range from
9.8 bps for the most active stocks to 24.3 bps for the least active stocks. The restriction of equal means
across trade activity categories is easily rejected for all variables at the 1% level.
Since our hypothesis centers on individual specialists, we provide summary statistics describing
the NYSE trading floor and the composition of individual specialist portfolios. Table II provides a
description of NYSE post and panel composition as of August 1, 2002. On this date, the trading floor
included 19 active trading posts and 357 panels. Using the full specialist directory, the mean and median
panel sizes are 10.1 and 9.0 securities, respectively, and panel size ranges from one to 63 securities. The
four securities that trade alone at a panel on August 1 are Nortel Networks, CIT Group, and the SPY and
QQQ exchange traded funds.12 Of the 3,599 securities in the directory at the start of the sample period,
15% change trading posts and 27.8% change trading panels at some point during the sample period. This
highlights the importance of identifying specialist portfolios on a daily basis.
[INSERT TABLE II HERE]
After excluding funds, REITs, units, trusts, and other structured products, we find that common
stocks and ADRs trade at 331 different panels, with an average panel size of 5.8 stocks. Notably, the
reduction in number of panels relative to the full specialist directory suggests that 26 panels trade no
common stocks or ADRs. The largest panel now includes 21 common stocks and there are 11 securities
traded at panels with no other common stocks. Of the 1,920 common stocks and ADRs in the sample,
17.6% change posts and 31.5% change panels at some point during the sample period.
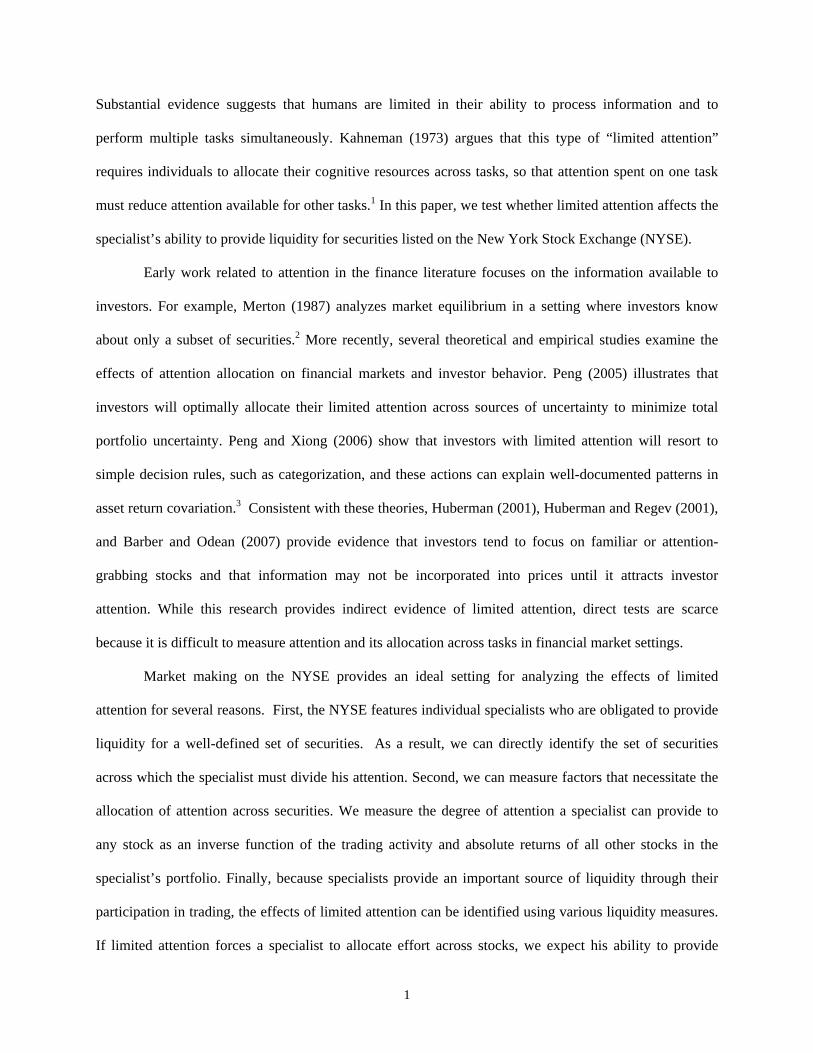
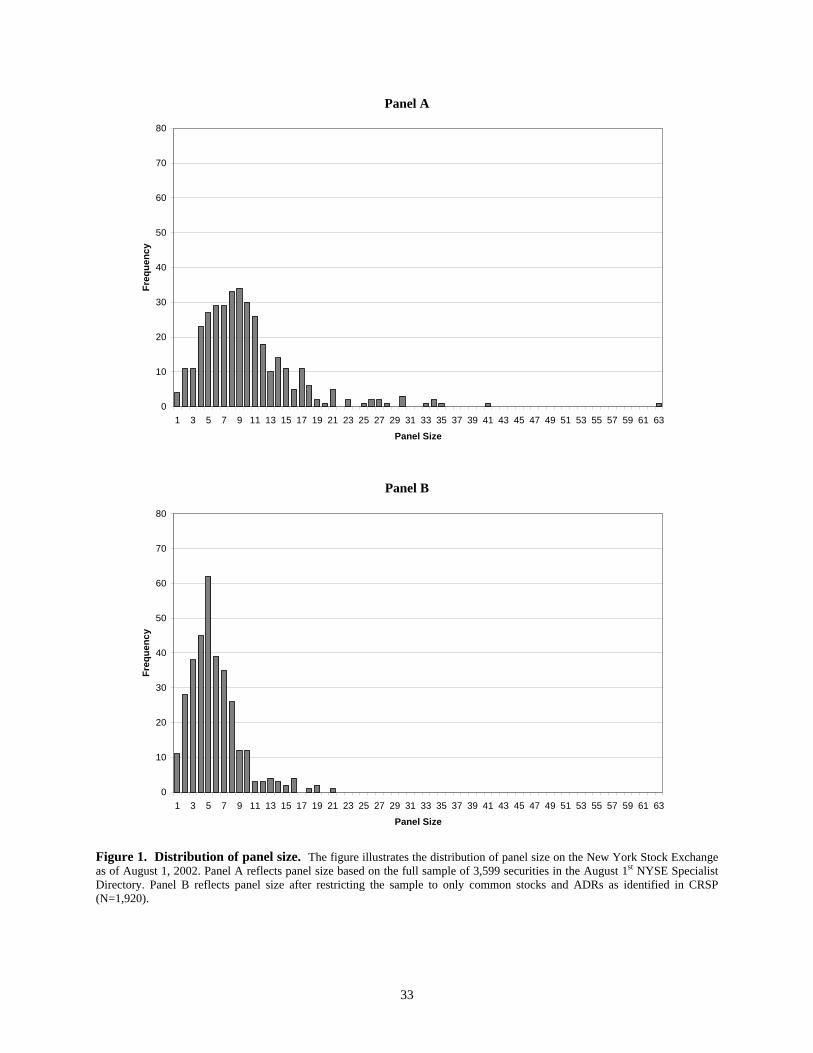
The full distribution of panel size is illustrated in more detail in Figure 1. As suggested in Table
II, the distribution of panel size in the full specialist directory (Panel A) is substantially skewed. The
mode of panel size is nine and there are approximately 25 to 35 panels at each panel size from five to 11.
However, there are also numerous panels with more than 20 securities. Restricting the sample to common

11
stocks and ADRs (Panel B) substantially reduces the skewness in panel size. The mode of panel size is
reduced to five and there is only one panel with more than 20 securities.
[INSERT FIGURE 1 HERE]
For completeness, Table II also describes panel size in the price and trade-restricted sample of
1,252 stocks. Of the 357 original panels, 312 trade at least one security from the restricted sample. The
average panel includes four sample stocks and the largest panel includes 12 sample stocks. Of the 1,252
stocks in this sample, 17.3% change posts and 32.4% change panels during the sample period.
If limited attention is an important market making consideration, we expect NYSE specialist
firms to assign their most active stocks to panels with few other securities. As an initial test of our
hypothesis, we therefore examine the relation between individual stock trade activity and panel
assignments on the NYSE floor. For each stock in our restricted sample, we calculate the average number
of securities at its panel, the stock’s average rank at its panel based on the number of trades, and the
stock’s average proportion of trades and dollar volume at its panel based on the full sample of 1,920
common stocks and ADRs. For comparison, we also provide a description of panel size using the full
specialist directory. To account for changes in panel composition over time, we estimate the rank and
percentage of trade activity each 30-minute period and calculate an average for each stock across all
periods.
Table III reports the cross-sectional means of panel characteristics for each of our three trade
activity categories. Including all securities in the specialist directory, the most active stocks trade on
panels with 7.9 securities, on average, while the least active stocks trade on panels with 13.0 securities.
Counting only common stocks and ADRs, the most active stocks have an average panel size of 4.5, while
the least active stocks have an average panel size of 8.0. Conclusions from panel ranks are similar. The
most active stocks have an average panel rank of 1.2 and the least active stocks have an average panel
rank of 3.8, where rank equals one if the stock is the most actively traded at the panel. We also find that
active stocks account for a significantly larger proportion of trading volume at the panel, representing
68.0% of dollar volume and 58.1% of trades, on average. In contrast, the least active stocks represent only

12
11.2% of panel dollar volume and 13.2% of panel trades, on average. The restriction of equal means
across trade activity groups is easily rejected for all variables at the 1% level.
[INSERT TABLE III HERE]
The evidence in Table III is consistent with the hypothesis that specialist firms tend to place their
most actively traded securities at smaller panels. We conclude that the observed allocation of stocks to
panels provides prima facie evidence that specialist firms recognize the marginal costs associated with
limited attention and effort allocation. In the following sections, we consider the significance of these
costs in light of the fact that they may be reduced by the allocation decisions of specialist firms.
III. Empirical Tests for Limited Attention and Effort Allocation
In this section we present our empirical tests for limited attention and effort allocation in
securities trading. To begin, we define the three attention measures used throughout our tests. We then
present our primary tests based on pooled time-series and cross-sectional regressions. In Section IV, we
provide additional analyses and robustness checks using both pooled regressions and firm-specific time-
series regressions.
A. The Measurement of Specialist Attention
The effectiveness of our tests rests on our ability to measure how a specialist allocates attention
across the stocks at his panel. To begin, we assert that the attention required for a given stock increases
with the number of transactions and the absolute return during the period. For each stock, we define three
estimates of required specialist attention. Our first measure is based on the number of transactions during
a given trading period. Although this measure has the advantage of simplicity, it ignores the possibility
that factors other than trade frequency may affect the required level of specialist attention.
To address this concern, we define a second measure based on the absolute return during the
period and a third measure that incorporates both the trade frequency and absolute return during the
period. One drawback of the third measure is that it requires an assumption about the relative importance
of trades and absolute returns in determining specialist attention requirements. To minimize the inherent
13
subjectivity in this measure, we standardize both trade frequency and absolute return by their respective
standard deviations computed across all observations in the pooled data. By doing so, we implicitly
assume that a period with trade frequency that is one standard deviation above zero requires the same
level of specialist attention as a period with absolute return that is one standard deviation above zero. For
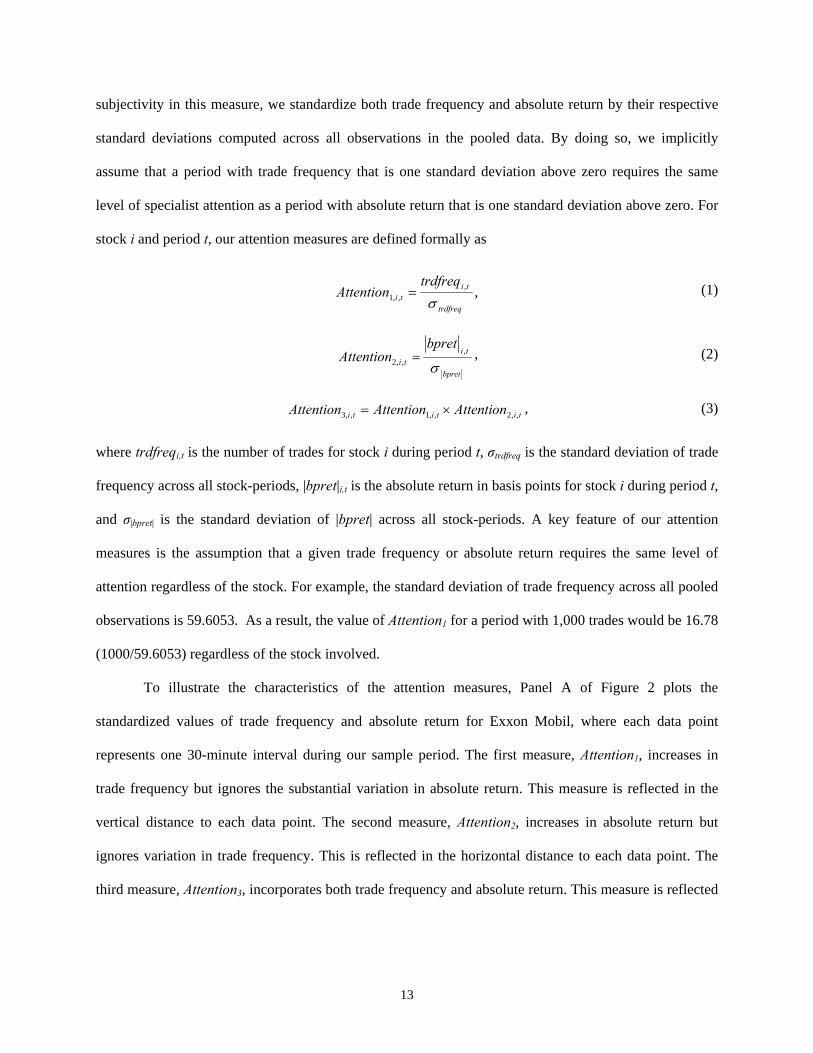
stock i and period t, our attention measures are defined formally as
,,,,1
trdfreq
titi
trdfreqAttention
σ= (1)
bpret
titi
bpretAttention
σ,
,,2 = , (2)
tititi AttentionAttentionAttention ,,2,,1,,3 ×= , (3)
where trdfreqi,t is the number of trades for stock i during period t, σtrdfreq is the standard deviation of trade
frequency across all stock-periods, |bpret|i,t is the absolute return in basis points for stock i during period t,
and σ|bpret| is the standard deviation of |bpret| across all stock-periods. A key feature of our attention
measures is the assumption that a given trade frequency or absolute return requires the same level of
attention regardless of the stock. For example, the standard deviation of trade frequency across all pooled
observations is 59.6053. As a result, the value of Attention1 for a period with 1,000 trades would be 16.78
(1000/59.6053) regardless of the stock involved.
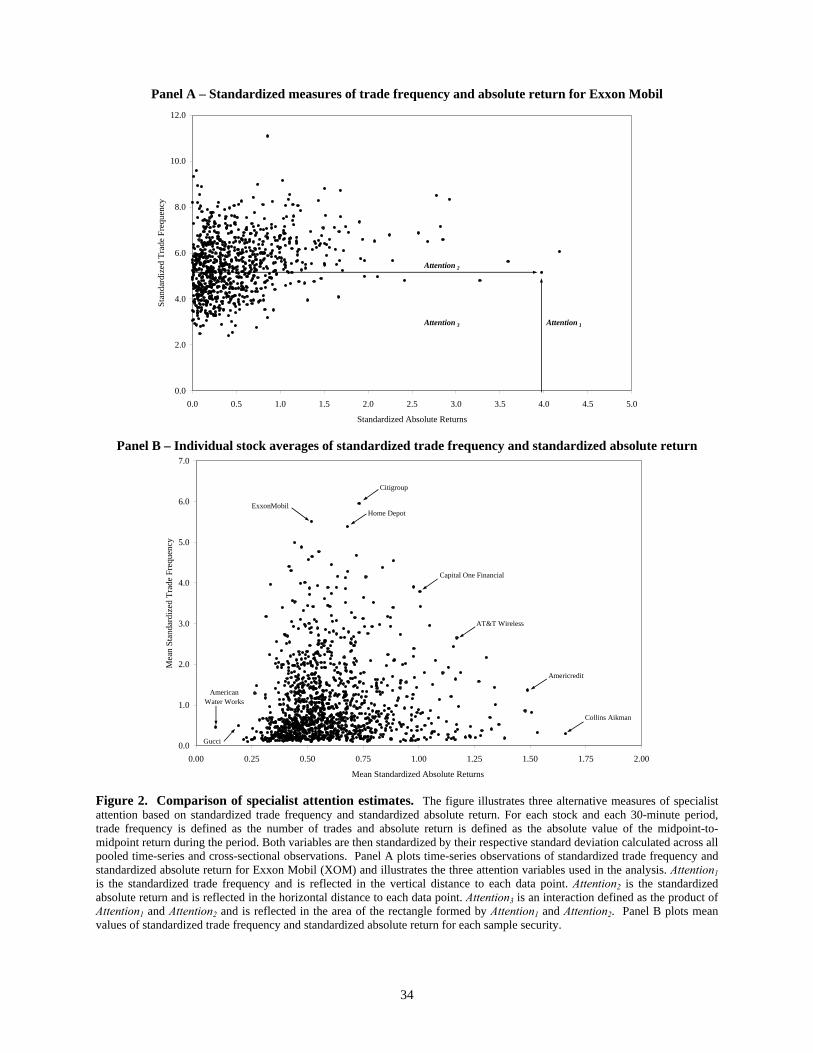
To illustrate the characteristics of the attention measures, Panel A of Figure 2 plots the
standardized values of trade frequency and absolute return for Exxon Mobil, where each data point
represents one 30-minute interval during our sample period. The first measure, Attention1, increases in
trade frequency but ignores the substantial variation in absolute return. This measure is reflected in the
vertical distance to each data point. The second measure, Attention2, increases in absolute return but
ignores variation in trade frequency. This is reflected in the horizontal distance to each data point. The
third measure, Attention3, incorporates both trade frequency and absolute return. This measure is reflected
14
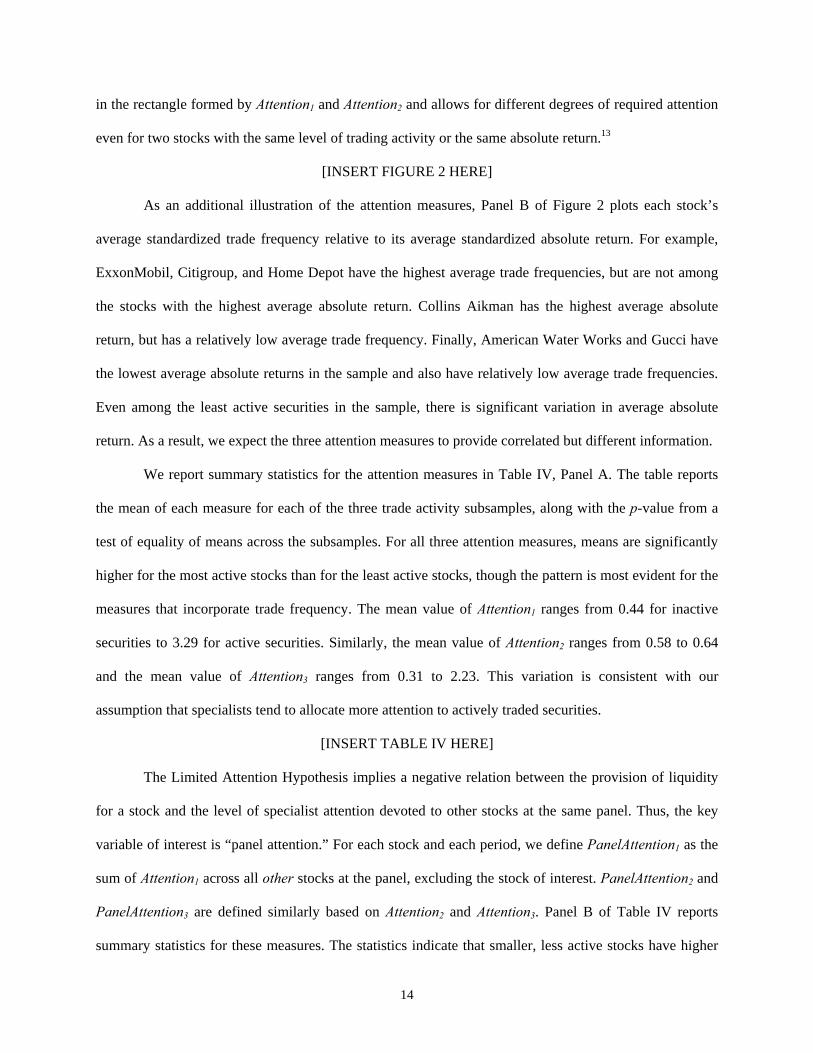
in the rectangle formed by Attention1 and Attention2 and allows for different degrees of required attention
even for two stocks with the same level of trading activity or the same absolute return.13
[INSERT FIGURE 2 HERE]
As an additional illustration of the attention measures, Panel B of Figure 2 plots each stock’s
average standardized trade frequency relative to its average standardized absolute return. For example,
ExxonMobil, Citigroup, and Home Depot have the highest average trade frequencies, but are not among
the stocks with the highest average absolute return. Collins Aikman has the highest average absolute
return, but has a relatively low average trade frequency. Finally, American Water Works and Gucci have
the lowest average absolute returns in the sample and also have relatively low average trade frequencies.
Even among the least active securities in the sample, there is significant variation in average absolute
return. As a result, we expect the three attention measures to provide correlated but different information.
We report summary statistics for the attention measures in Table IV, Panel A. The table reports
the mean of each measure for each of the three trade activity subsamples, along with the p-value from a
test of equality of means across the subsamples. For all three attention measures, means are significantly
higher for the most active stocks than for the least active stocks, though the pattern is most evident for the
measures that incorporate trade frequency. The mean value of Attention1 ranges from 0.44 for inactive
securities to 3.29 for active securities. Similarly, the mean value of Attention2 ranges from 0.58 to 0.64
and the mean value of Attention3 ranges from 0.31 to 2.23. This variation is consistent with our
assumption that specialists tend to allocate more attention to actively traded securities.
[INSERT TABLE IV HERE]
The Limited Attention Hypothesis implies a negative relation between the provision of liquidity
for a stock and the level of specialist attention devoted to other stocks at the same panel. Thus, the key
variable of interest is “panel attention.” For each stock and each period, we define PanelAttention1 as the
sum of Attention1 across all other stocks at the panel, excluding the stock of interest. PanelAttention2 and
PanelAttention3 are defined similarly based on Attention2 and Attention3. Panel B of Table IV reports
summary statistics for these measures. The statistics indicate that smaller, less active stocks have higher

15
panel attention measures. This is consistent with less active stocks being traded on larger panels.
Conversely, the most active stocks have the lowest levels of panel attention, reflecting the tendency to
place active securities on smaller panels.
To examine more directly whether the NYSE and specialist firms consider limited attention when
assigning stocks to panels, we compare the cross-sectional distribution of panel attention using the actual
NYSE stock assignments to the distribution that results from a random assignment of stocks to panels.
We begin by assigning stocks randomly to panels while maintaining the actual distribution of panel sizes
(as illustrated in Figure 1). Based on these stock assignments, we estimate panel attention measures for
each panel each period and calculate the cross-sectional standard deviation of panel attention each period.
We then calculate the average cross-sectional standard deviation across all time periods. We repeat this
process 1,000 times. For the panel attention measures that incorporate trading activity (Attention1 and
Attention3), the actual NYSE panel assignments result in a lower cross-sectional standard deviation than
any of the 1,000 random allocations (a p-value of <0.001). This suggests that stocks are indeed assigned
to panels in a manner that minimizes variation in attention across panels. For the attention measure based
solely on returns (Attention2), the p-value relative to the random allocations is 0.687. This result is not
surprising given the difficulty in predicting returns.
To assess the differences in the three panel attention measures, we estimate their time-series
correlation for each stock. The cross-sectional means of these correlations are reported in the last three
rows of Panel B. Overall, the correlations are weakest between Attention1 and Attention2 and strongest
between Attention2 and Attention3. The average correlation between Attention1 and Attention2 ranges from
0.32 for the most active stocks to 0.37 for the least active stocks. The average correlation between
Attention1 and Attention3 ranges from 0.58 to 0.63 and the average correlation between Attention2 and
Attention3 ranges from 0.80 to 0.83. In the regression analysis to follow, we provide results based on
several combinations of these attention variables.
16
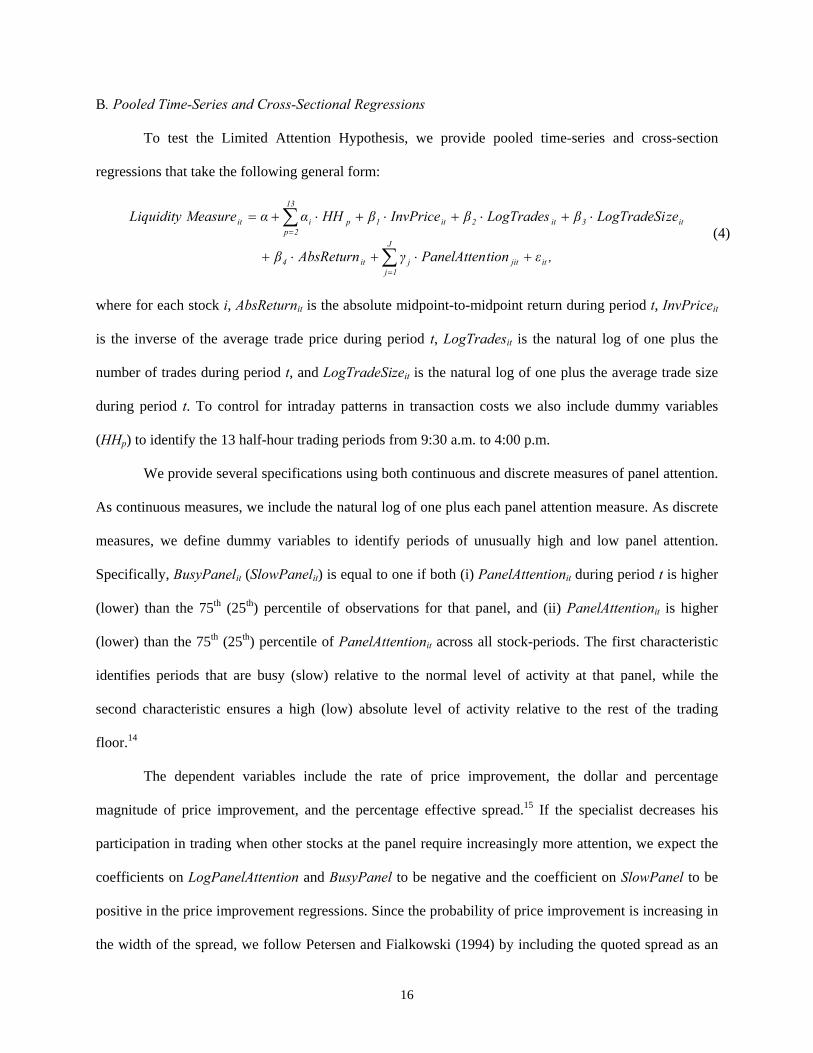
B. Pooled Time-Series and Cross-Sectional Regressions
To test the Limited Attention Hypothesis, we provide pooled time-series and cross-section
regressions that take the following general form:
,εtionPanelAttenγAbsReturnβ
zeLogTradeSiβLogTradesβInvPriceβHHααMeasureLiquidity
it
J
1jjitjit4
it3it2it1
13
2ppiit
+⋅+⋅+
⋅+⋅+⋅+⋅+=
∑
∑
=
= (4)
where for each stock i, AbsReturnit is the absolute midpoint-to-midpoint return during period t, InvPriceit
is the inverse of the average trade price during period t, LogTradesit is the natural log of one plus the
number of trades during period t, and LogTradeSizeit is the natural log of one plus the average trade size
during period t. To control for intraday patterns in transaction costs we also include dummy variables
(HHp) to identify the 13 half-hour trading periods from 9:30 a.m. to 4:00 p.m.
We provide several specifications using both continuous and discrete measures of panel attention.
As continuous measures, we include the natural log of one plus each panel attention measure. As discrete
measures, we define dummy variables to identify periods of unusually high and low panel attention.
Specifically, BusyPanelit (SlowPanelit) is equal to one if both (i) PanelAttentionit during period t is higher
(lower) than the 75th (25th) percentile of observations for that panel, and (ii) PanelAttentionit is higher
(lower) than the 75th (25th) percentile of PanelAttentionit across all stock-periods. The first characteristic
identifies periods that are busy (slow) relative to the normal level of activity at that panel, while the
second characteristic ensures a high (low) absolute level of activity relative to the rest of the trading
floor.14
The dependent variables include the rate of price improvement, the dollar and percentage
magnitude of price improvement, and the percentage effective spread.15 If the specialist decreases his
participation in trading when other stocks at the panel require increasingly more attention, we expect the
coefficients on LogPanelAttention and BusyPanel to be negative and the coefficient on SlowPanel to be
positive in the price improvement regressions. Since the probability of price improvement is increasing in
the width of the spread, we follow Petersen and Fialkowski (1994) by including the quoted spread as an

17
additional explanatory variable in the price improvement regressions. This allows us to focus on variation
in price improvement that is unrelated to variation in the quoted spread and the related placement of limit
orders.
For the effective spread regressions, the expected signs on our key variables are the opposite. If
transaction costs increase during periods of high panel attention, we expect the coefficients on BusyPanel
and LogPanelAttention to be positive in the spread regressions. In addition, if the specialist is able to
provide additional liquidity during periods when panel attention requirements are low, we expect the
coefficient on SlowPanel to be negative in the spread regressions.
Given the pooled nature of the data, we expect the error terms in the model to include a security-
specific component. To account for this, the model is estimated including one-way fixed effects. We
assume that the error terms follow the structure itiit u+=νε , where vi is a firm-specific fixed effect and
uit is the classical zero-mean error term.16
The regression results are provided in Table V. Models including the discrete measures of panel
attention are described in Panel A. All control variables have the expected signs and the restrictions that
firm fixed effects and time-of-day effects equal zero are easily rejected in all specifications. More
importantly, both the BusyPanel and SlowPanel coefficients are significant and of the correct sign in the
price improvement models, regardless of the measure of panel attention. The coefficients show that the
rate and magnitude of price improvement decrease (increase) when the attention required by other stocks
on the panel is unusually high (low). These results suggest that the specialist’s ability to provide liquidity
is negatively related to the attention requirements of other stocks at the panel, even after controlling for
own-stock trading activity. In addition, the effects of panel attention are evident not only when attention
requirements are unusually high, but also when attention requirements are unusually low.
[INSERT TABLE V HERE]
The results based on effective spreads provide similar conclusions. The coefficient on BusyPanel
is positive and significant for two of the three attention measures and the coefficient on SlowPanel is

18
negative and significant for all three attention measures. These results suggest that transaction costs
increase as the specialist allocates attention toward other securities at the same panel.
Panel B of Table V presents results based on continuous measures of panel attention. We provide
three specifications for each dependent variable. The first specification includes just PanelAttention1 and
reflects only the trading activity at the panel. The second specification includes both PanelAttention1 and
PanelAttention2. Finally, the third specification includes all three panel attention measures. Consistent
with the results in Panel A, the findings suggest that price improvement decreases and transaction costs
increase as the specialist allocates attention toward other securities at the panel. The coefficient on
PanelAttention1 is significantly negative in all price improvement regressions and significantly positive in
the effective spread regressions. The coefficient on PanelAttention2 is significant and of the correct sign
when included with PanelAttention1. However, this variable tends to decrease in significance when
included with PanelAttention3. This suggests that attention limits tend to be driven by the interaction of
absolute return and trading activity, rather than just absolute return alone. The one exception is in the final
effective spread regression, where both PanelAttention1 and PanelAttention2 are positive and significant,
but PanelAttention3 is negative and significant.
To examine the economic impact of limited attention, we estimate the predicted values of the
price improvement rate and percentage effective spread based on the regression coefficients in Table V
and the mean values of all explanatory variables. We also include the median firm fixed effect and the
dummy variable for intraday period 6 (12:30-1:00). In the regressions based on PanelAttention1, the
coefficient on the BusyPanel dummy variable (Panel A) suggests that price improvement is
approximately 2.40% lower and percentage effective spreads are approximately 1.75% higher during busy
periods than during slow periods. Similarly, coefficients based on PanelAttention3 suggest that price
improvement is 3.03% lower and effective spreads are 1.54% higher during busy than during slow
periods. The conclusions based on the continuous panel attention variables (Panel B) are similar. Here,
the results suggest that price improvement decreases by 5.62% and percentage effective spreads increase
by approximately 3.52% as PanelAttention1 goes from the 10th to the 90th percentile.

19
To put these costs in perspective, it is useful to characterize total NYSE trading activity. The
NYSE Fact Book reports that trading volume on the NYSE averaged approximately $40 billion per day
during 2002. Based on PanelAttention1, our data suggest that approximately 7.20% of this volume, or
$2.88 billion, was executed during busy periods. Given the 19.49 basis point average effective spread
during our sample period, a 3.0% change would imply a floor-wide increase in trading costs of
approximately $168 thousand per day or $42.1 million per year. While these cost estimates are only
approximate, they suggest that the potential floor-wide benefits from reductions in capacity constraints
(perhaps through the use of automatic execution systems) could be large.
C. Controls for Market-Wide Effects
The regressions reported above control for variation in own-stock characteristics that may affect
price improvement and execution costs. However, the results may also reflect a correlation between
individual security liquidity and market-wide effects. To control for this possibility, we extend the
analysis to control for market-wide measures of liquidity and attention. Incorporating market liquidity
provides a control for the commonality in liquidity documented by Chordia, Roll, and Subrahmanyam
(2000). Incorporating market attention allows us to test whether panel attention effects are driven
primarily by firm-specific or market-wide attention effects.
For each security and each intraday period, we define MarketAttention1, MarketAttention2, and
MarketAttention3 as the sum of Attention1, Attention2, and Attention3, respectively, across all sample
stocks that are not traded at the same panel as the security of interest. Similarly, for each liquidity
variable, we define the corresponding market measure as the trade-weighted average of that variable
across all sample stocks that are not traded at the same panel as the security of interest. To control for
both market liquidity and market attention simultaneously, we employ a two-stage regression procedure.
In the first stage, we remove systematic liquidity components using stock-specific time-series OLS
regressions, where the dependent variable is either a price improvement measure or the percentage
effective spread and the explanatory variable is the corresponding market liquidity measure. The residuals
20
from this regression reflect variation in stock liquidity that is unexplained by variation in market-wide
liquidity. In the second stage, we use these residuals as the dependent variable in pooled regressions
similar to equation (4), where the corresponding market attention measures are added as explanatory
variables. This two-stage procedure is used throughout Tables VI to VIII to control for market-wide
liquidity and attention effects.17
The results from the second-stage regression are reported in Table VI, Panel A.18 The results for
both the rate and magnitude of price improvement provide strong evidence in support of the Limited
Attention Hypothesis. The coefficient on PanelAttention1 is negative and significant in every price
improvement regression and the coefficient on PanelAttention3 is negative and significant in all
specifications in which it is included. Again, the coefficient on PanelAttention2 tends to be negative, but
loses significance when included with PanelAttention3. Overall, we conclude that both the magnitude and
rate of price improvement are significantly affected by the attention requirements of the other stocks
handled by the specialist, even after controlling for market-wide effects.
[INSERT TABLE VI HERE]
The results for effective spreads are mixed. The panel attention coefficients are insignificant in
the first two specifications. In the third specification, the coefficient is positive and significant for
PanelAttention1 and PanelAttention2, but negative and significant for PanelAttention3. Thus, while panel
attention requirements have strong effects on price improvement, the net effect on execution costs is
difficult to determine. However, in subsequent analyses, the effective spread evidence supports the
Limited Attention Hypothesis. We discuss these results in more detail below.
D. Expected vs. Unexpected Attention Requirements
The evidence in Table III suggests that panel assignments by NYSE specialist firms work to
reduce the effects of limited attention. Specifically, stocks expected to require high levels of attention are
assigned to small panels, while stocks with low expected attention requirements are assigned to larger
panels. If total expected attention requirements differ across panels and the ability to handle extreme
attention requirements is a skill that differs across specialists, we would also expect the most skilled

21
specialists to be assigned to the busiest panels. These arguments suggest that it may be variation in
unexpected rather than total attention requirements that drive differences in liquidity provision.
To test this hypothesis, we define the unexpected component of each panel attention measure. To
begin, we calculate Attention1, Attention2, and Attention3 for each stock-period during the three-month
pre-sample period from May through June, 2002. These pre-sample attention measures are defined as in
equations (1) through (3), where trade frequency and absolute return are standardized by their respective
pre-sample standard deviations across all pooled observations. We then define expected attention for each
stock as the median value of attention across all pre-sample periods. Next, for each stock during each 30-
minute period from August through October 2002, we define the unexpected components of Attention1,
Attention2, and Attention3 by subtracting the expected attention estimate from the in-sample attention
measures. Finally, for each stock-period, we define the unexpected component of each panel attention
measure by summing the unexpected attention components across all panel stocks, excluding the stock of
interest, and then demeaning the resulting variable to remove cross-stock differences in the level of
unexpected panel attention.19 We also define the corresponding unexpected market attention measures
using the same procedure and the set of all stocks not traded at the same panel as the stock of interest.
Throughout the remaining analyses, we provide results for both total and unexpected panel attention. The
conclusions are generally insensitive to the attention measure used.
Results from pooled regressions based on unexpected panel attention are provided in Table VI,
Panel B. Again, we control for market-wide effects using the two-stage regression procedure described in
Section III.C. The results are generally similar to those in Panel A. Both the rate and magnitude of price
improvement are significantly negatively related to unexpected panel attention based on Attention1 and
Attention3. As in Panel A, unexpected PanelAttention2 tends to lose significance when included with the
combined return and trade frequency variable (PanelAttention3). Together, the results in Table VI provide
strong evidence that the attention requirements of the specialist have a significant effect on both the rate
and magnitude of price improvement, even after controlling for market-wide effects. However, the results
for effective spreads would seem to suggest that these price improvement effects may not translate into

22
higher effective spreads. In additional tests to follow, we find that the negative relation between effective
spreads and panel attention is driven primarily by the subsample of active securities and periods of high
own-trading activity. In fact, evidence from the individual security time-series regressions described in
Section IV below provides strong support for a positive relation between effective spreads and panel
attention, consistent with the Limited Attention Hypothesis.20
IV. Additional Tests and Robustness Checks
In this section, we provide several additional tests to refine the analysis and test for robustness.
First, we test whether the overall results are stronger in the subsample of inactive securities, where limited
attention effects should be most pronounced. Second, we extend our pooled regressions to examine the
relation between liquidity provision and panel attention when own-stock trading activity is within normal
bounds. Finally, we provide an alternative test of the Limited Attention Hypothesis using stock-specific
OLS time-series regressions.
A. Active vs. Inactive Securities
As discussed above, we expect the effects of limited attention to be most evident for the least
active securities. To examine this hypothesis directly, we allow the coefficients on panel attention to
differ across active and inactive stocks. For the purposes of this regression, we define Active stocks as the
500 most active stocks in our sample (the high- and mid-activity groups). The remaining stocks (the low-
activity group) are defined as Inactive. To aid with interpretation, we include interactions for only one
panel attention measure at a time. All regressions include the full set of control variables described in
Section III.B, as well as the market liquidity and market attention variables described in Section III.C. To
conserve space, the coefficients on these control variables are not reported.
We report the coefficients on panel attention variables for active and inactive securities in Table
VII. For regressions based on total panel attention (Panel A), the panel attention coefficient for inactive
securities is of the correct sign and statistically significant in eight of the nine price improvement
regressions and is significantly larger (in absolute terms) than for active securities in seven of the nine
23
regressions. In the effective spread regressions, the coefficient on panel attention for inactive securities is
positive and significant based on Attention2 and Attention3, but insignificant for Attention1. Overall, these
results are consistent with the Limited Attention Hypothesis. In addition, the results for effective spreads
suggest that the negative relation between panel attention and effective spreads reported in Table VI may
reflect the inclusion of active securities.
[INSERT TABLE VII HERE]
The results are similar for regressions based on unexpected panel attention (Panel B). In this case,
the coefficient on panel attention for inactive securities is of the correct sign, statistically significant, and
significantly larger (in absolute terms) than the coefficient for active securities in seven of the nine price
improvement regressions. The relation between effective spreads and panel attention for inactive
securities is positive and significant when based on Attention2 and Attention3 (as in Panel A), but negative
and significant when based on Attention1. Overall, the results in Table VII are consistent with our
hypothesis that the effects of limited attention are most prominent for the least active NYSE stocks.
B. Controlling for Own-Stock Trading Activity
An important consideration in our tests is the potential correlation in order flow across stocks. For
example, Hasbrouck and Seppi (2001) report strong positive covariation in order flow across the 30
stocks in the Dow Jones Industrial Average. To isolate the effects of limited attention, we must be careful
to control for the effects of own-stock trading activity. The interaction between own-stock trading activity
and panel activity may also reveal something about the trading environment. For example, periods when
own-stock activity is high but panel activity is low (or normal) may reflect significant firm-specific
events. During these periods, spreads are likely to vary for reasons unrelated to limited attention effects.
Throughout the previous regressions, we control for own-stock trading activity by including own-
stock trading characteristics as explanatory variables. In this section, we provide an additional test to
control for own-stock trading. Specifically, we allow the effects of panel attention to differ across periods

24
when own-stock trading is low, normal, or high. We expect periods of normal own-trading activity to
provide the cleanest test of the Limited Attention Hypothesis.
To isolate periods of normal own-trading activity, we create three indicator variables that describe
the level of each stock’s trading activity in a given period relative to its own time-series mean and
standard deviation. Specifically, we set OwnHigh (OwnLow) equal to one when a stock’s trade frequency
in a given period is more than one standard deviation above (below) its time-series mean. All other
periods are defined as Normal. Using these indicator variables we modify our pooled regressions to allow
the coefficient on panel attention to vary with own-stock trading activity. Again, to aid with
interpretation, we include interactions for only one panel attention variable at a time.
The results, presented in Table VIII, provide strong evidence of a significant relation between
price improvement and panel attention during periods of normal own-trading. The coefficients on both
total panel attention (Panel A) and unexpected panel attention (Panel B) during normal own-trading
periods are negative and significant in eight of the nine price improvement regressions. These findings
confirm our general result that liquidity provision decreases with the level of attention allocated to other
stocks at the same panel and suggest that our results are not driven by a correlation between stock and
panel trading activity. The results for effective spreads are again mixed. However, the coefficients suggest
that the negative relation between effective spreads and panel attention observed in Table VI may be due
in part to high own-trading periods.
[INSERT TABLE VIII HERE]
C. Stock-Specific Time-Series Regressions
Although the pooled analysis should minimize the potential endogeneity bias associated with
NYSE stock allocation decisions, these effects may not be eliminated. As an additional check, we provide
a robustness test of the Limited Attention Hypothesis using stock-specific time-series regressions. These
OLS regressions eliminate cross-security effects and focus solely on the time-series relation between
panel attention and liquidity provision.
25
To test the Limited Attention Hypothesis in this setting, we examine the cross-sectional
distribution of the time-series regression coefficients. This is similar to the methodology used by Chordia
et al. (2000). The results are reported in Table IX. For each specification, we report the median panel
attention coefficient across all individual stock regressions along with the p-value from a sign test of
whether the cross-sectional median is significantly different from zero. We also report the percentage of
coefficients that are of the correct sign. Results for the control variables are generally consistent with
those from the pooled analysis and are not reported.
[INSERT TABLE IX HERE]
Panels A and B provide results from OLS regressions replicating the busy/slow dummy variable
analysis and the total panel attention analysis in Panels A and B of Table V, respectively. Panels C and D
provide results from OLS regressions replicating the total and unexpected attention analysis in Panels A
and B of Table VI. In all cases, the results provide strong evidence in support of the Limited Attention
Hypothesis. Both the rate and magnitude of price improvement are significantly negatively related to
panel attention, whether measured using busy period dummy variables or continuous measures of panel
attention. In addition, the results provide evidence of a significant positive relation between effective
spreads and panel attention, even after controlling for market-wide variation in liquidity and attention.
Overall, the results in Table IX provide strong evidence that both the magnitude and rate of price
improvement decrease and execution costs increase as the attention required by other stocks at the same
panel increases. These results also suggest that our pooled evidence is robust to potential endogeneity
concerns and to alternative estimation methods. Together with the results from Tables V through VIII,
these findings indicate that the specialist’s ability to provide liquidity is significantly affected by limited
attention and the allocation of effort across securities.
V. Summary and Conclusions
It is well known that human beings are limited in their ability to process information and to
perform multiple tasks simultaneously (see Kahneman (1973) and Pashler (1998) for reviews). Despite

26
the documented importance of limited attention in other settings, its impact on financial markets has only
recently attracted attention. Recent research provides evidence that, when faced with complicated
information, investors resort to simplified decision rules such as categorization. Theoretical studies also
suggest that limited attention on the part of investors may have significant effects on asset price behavior
and financial reporting decisions by firms. To date, however, empirical studies have been limited by the
absence of direct measures of attention and its allocation across securities.
This study provides the first direct evidence that limited attention influences the provision of
liquidity in financial markets. Since individual NYSE specialists are assigned a well-defined set of
securities, this setting provides an ideal framework for analyzing the allocation of limited attention across
securities. We show that the specialist’s ability to provide liquidity for a particular stock is significantly
affected by the attention requirements of other securities traded at the same location. Consistent with the
Limited Attention Hypothesis, our evidence indicates that market makers face attention limits and they
allocate their effort across securities during periods when attention constraints are binding. In the process,
their ability to act as an important source of liquidity is reduced for at least a subset of the securities in
their market making portfolio. Therefore, while the design of the NYSE may yield diversification and/or
subsidization benefits by allowing specialists to handle a portfolio of stocks, our paper identifies potential
costs associated with this organizational arrangement.
It is important to note that we do not argue that specialists actively impair liquidity during periods
when panel attention requirements are high. Instead, it is likely that the specialist is unable to act as an
additional source of liquidity during these periods, leaving spreads to be determined primarily by the
actions of other traders. During normal conditions, the specialist steps in to facilitate trade and to act as an
important source of liquidity. During busy periods, however, the specialist’s ability to provide this service
is limited.
This research has important implications for future theoretical work considering the influence of
limited attention on trading. While prior studies suggest that limited attention may affect the demand for
securities, we show that attention limits may also influence prices through the supply of liquidity. Our
27
paper also has implications for the allocation of stocks on the trading floor and contributes to the ongoing
debate over the merits of floor-based versus electronic trading. In particular, increased automation, such
as that currently being implemented on the NYSE, may relieve specialist capacity constraints and reduce
the necessity to allocate effort across stocks. While our tests are based on NYSE data our findings may be
applicable to any market in which dealer effort is allocated across multiple securities.

28
REFERENCES
Arbel, Avner, Steven Carvell, and Paul Strebel, 1983, Giraffes, institutions, and neglected firms,
Financial Analysts Journal May/June, 2-8.
Arbel, Avner, and Paul Strebel, 1982, The neglected and small firm effects, Financial Review 17, 201-
218.
Barber, Brad M., and Terrance Odean, 2007, All that glitters: The effect of attention and news on the
buying behavior of individual and institutional investors, forthcoming, Review of Financial Studies.
Barry, Christopher B., and Stephen J. Brown, 1984, Differential information and the small firm effect,
Journal of Financial Economics 13, 283-294.
Barry, Christopher B., and Stephen J. Brown, 1986, Limited information as a source of risk, Journal of
Portfolio Management 12, 66-72.
Battalio, Robert, Andrew Ellul, and Robert Jennings, 2007, Reputation effects in trading on the New
York Stock Exchange, Journal of Finance 62, 1243-1271.
Benveniste, Lawrence M., Alan J. Marcus, and William J. Wilhelm, 1992, What’s special about the
specialist? Journal of Financial Economics 32, 61-86.
Bessembinder, Hendrik, 2003, Issues in assessing trade execution costs, Journal of Financial Markets 6,
233-257.
Boulatov, Alex, Brian C. Hatch, Shane A. Johnson, and Adam Y. C. Lei, 2007, Dealer attention, the
speed of quote adjustments to information, and net dealer revenue, Working paper, Texas A&M
University.
Cao, Charles, Hyuk Choe, and Frank Hatheway, 1997, Does the specialist matter? Differential execution
costs and inter-security subsidization on the NYSE, Journal of Finance 52, 1615-1640.
Chordia, Tarun, Richard Roll, and Avanidhar Subrahmanyam, 2000, Commonality in liquidity, Journal of
Financial Economics 56, 3-28.
Copeland, Thomas E., and Dan Galai, 1993, Information effects and the bid-ask spread, Journal of
Finance 38, 1457-1469.
29
Corwin, Shane A., 1999, Differences in trading behavior across NYSE specialist firms, Journal of
Finance 54, 721-745.
Corwin, Shane A., 2004, Specialist performance and new listing allocations on the NYSE: An empirical
analysis, Journal of Financial Markets 7, 27-51.
Coughenour, Jay F., and Dan Deli, 2002, Liquidity provision and the organizational form of NYSE
specialist firms, Journal of Finance 56, 841-869.
Coughenour, Jay F., and Lawrence E. Harris, 2005, Specialist profits and the minimum price increment,
Working paper, University of Delaware.
Coughenour, Jay F., and Mohsen Saad, 2004, Common market makers and commonality in liquidity,
Journal of Financial Economics 73, 37-70.
Easley, David, and Maureen O’Hara, 1987, Price, trade size, and information in securities markets,
Journal of Financial Economics 19, 69-90.
Foucault, Thierry, Ohad Kadan, and Eugene Kandel, 2005, Limit order book as a market for liquidity,
Review of Financial Studies 18, 1171-1217.
Gabaix, Xavier, and David Laibson, 2005, Bounded rationality and directed cognition, Working paper,
MIT and NBER.
Gabaix, Xavier, David Laibson, Guillermo Moloche, and Stephen Weinberg, 2006, Information
acquisition: Experimental analysis of a boundedly rational model, American Economic Review 96,
1043-1068.
Gifford, Sharon, 2005, Limited attention as the bound on rationality, Contributions to Theoretical
Economics 5, 1108-1128.
Glosten, Lawrence R., 1989, Insider trading, liquidity, and the role of the monopolist specialist, Journal
of Business 62, 211-236.
Glosten, Lawrence R., and Paul R. Milgrom, 1985, Bid, ask, and transaction prices in a specialist market
with heterogeneously informed traders, Journal of Financial Economics 14, 71-100.
30
Hasbrouck, Joel, and Duane J. Seppi, 2001, Common factors in prices, order flows, and liquidity, Journal
of Financial Economics 59, 383-411.
Hasbrouck, Joel, and George Sofianos, 1993, The trades of market-makers: An analysis of NYSE
specialists, Journal of Finance 48, 1565-1594.
Hatch, Brian C., and Shane A. Johnson, 2002, The impact of specialist firm acquisitions on market
quality, Journal of Financial Economics 66, 139-167.
Hirshleifer, David, Sonya Seongyeon Lim, and Siew Hong Teoh, 2004, Disclosure to an audience with
limited attention, Working paper, Ohio State University.
Hirshleifer, David, and Siew Hong Teoh, 2003, Limited attention, information disclosure, and financial
reporting, Journal of Accounting and Economics 36, 337-386.
Ho, Thomas, and Hans R. Stoll, 1981, Optimal dealer pricing under transactions and return uncertainty,
Journal of Financial Economics 9, 47-73.
Huang, Roger D., and Jerry W. Liu, 2004, Do individual NYSE specialists subsidize illiquid stocks?
Working paper, University of Notre Dame.
Huberman, Gur, 2001, Familiarity breeds investment, Review of Financial Studies 14, 659-680.
Huberman, Gur, and Tomer Regev, 2001, Contagious speculation and a cure for cancer: A nonevent that
made market prices soar, Journal of Finance 56, 387-396.
Kahneman, Daniel, 1973, Attention and Effort (Prentice Hall, New Jersey).
Kavajecz, Kenneth A., 1999, A specialist’s quoted depth and the limit order book, Journal of Finance 54,
747-771.
Klein, Roger W., and Vijay S. Bawa, 1977, The effect of limited information and estimation risk on
optimal portfolio diversification, Journal of Financial Economics 5, 89-111.
Leach, J. Chris, and Ananth Madhavan, 1993, Price experimentation and security market structure,
Review of Financial Studies 6, 375-404.
Lee, Charles M. C., and Mark J. Ready, 1991, Inferring trade direction from intraday data, Journal of
Finance 46, 733-746.

31
Madhavan, Ananth, and Seymour Smidt, 1993, An analysis of daily changes in specialists’ inventories
and quotations, Journal of Finance 48, 1595-1628.
Madhavan, Ananth, and George Sofianos, 1998, An empirical analysis of NYSE specialist trading,
Journal of Financial Economics 48, 189-210.
McInish, Thomas H., and Robert A. Wood, 1992, An analysis of intraday patterns in bid-ask spreads for
NYSE stocks, Journal of Finance 47, 753-764.
Merton, Robert C., 1987, A simple model of capital market equilibrium with incomplete information,
Journal of Finance 42, 483-510.
O’Hara, Maureen, and George S. Oldfield, 1986, The microeconomics of market making, Journal of
Financial and Quantitative Analysis 21, 361-376.
Pashler, Harold E., 1998, The Psychology of Attention (MIT Press).
Peng, Lin, 2005, Learning with Information Capacity Constraints, Journal of Financial and Quantitative
Analysis 49, 307-329.
Peng, Lin, and Wei Xiong, 2006, Limited attention and asset prices, Journal of Financial Economics 80,
563-602.
Petersen, Mitchell A., and David Fialkowski, 1994, Posted versus effective spreads: Good prices or bad
quotes? Journal of Financial Economics 35, 269-292.
Radner, Roy, and Michael Rothschild, 1975, On the allocation of effort, Journal of Economic Theory 10,
358-376.
Rosu, Ioanid, 2006, A dynamic model of the limit order book, Working paper, University of Chicago.
Sargent, Thomas J., 1993, Bounded Rationality in Macroeconomics (Oxford University Press).
Schwartz, Robert A., 1993, Reshaping the Equity Markets: A Guide for the 1990s (Business One Irwin,
Homewood, IL).
Simon, Herbert A., 1955, A behavioral model of rational choice, Quarterly Journal of Economics 69, 99-
118.

32
Simon, Herbert A., 1979, Rational decision making in business organizations, American Economic
Review 69, 493-513.
Sofianos, George, 1995, Specialist gross trading revenues at the New York Stock Exchange, Working
paper, New York Stock Exchange (#95-01).
Stoll, Hans R., 1978, The supply of dealer services in securities markets, Journal of Finance 33, 1133-
1151.
33
0
10
20
30
40
50
60
70
80
1 3 5 7 9 11 13 15 17 19 21 23 25 27 29 31 33 35 37 39 41 43 45 47 49 51 53 55 57 59 61 63
Panel Size
Freq
uenc
y
0
10
20
30
40
50
60
70
80
1 3 5 7 9 11 13 15 17 19 21 23 25 27 29 31 33 35 37 39 41 43 45 47 49 51 53 55 57 59 61 63
Panel Size
Freq
uenc
y
Panel A
Panel B Figure 1. Distribution of panel size. The figure illustrates the distribution of panel size on the New York Stock Exchange as of August 1, 2002. Panel A reflects panel size based on the full sample of 3,599 securities in the August 1st NYSE Specialist Directory. Panel B reflects panel size after restricting the sample to only common stocks and ADRs as identified in CRSP (N=1,920).
34
0.0
1.0
2.0
3.0
4.0
5.0
6.0
7.0
0.00 0.25 0.50 0.75 1.00 1.25 1.50 1.75 2.00
Mean Standardized Absolute Returns
Mea
n St
anda
rdiz
ed T
rade
Fre
quen
cy
ExxonMobil
Collins Aikman
Citigroup
American Water Works
Gucci
Capital One Financial
Home Depot
Americredit
AT&T Wireless
0.0
2.0
4.0
6.0
8.0
10.0
12.0
0.0 0.5 1.0 1.5 2.0 2.5 3.0 3.5 4.0 4.5 5.0
Standardized Absolute Returns
Stan
dard
ized
Tra
de F
requ
ency
Attention 3 Attention 1
Attention 2
Panel A – Standardized measures of trade frequency and absolute return for Exxon Mobil
Panel B – Individual stock averages of standardized trade frequency and standardized absolute return
Figure 2. Comparison of specialist attention estimates. The figure illustrates three alternative measures of specialist attention based on standardized trade frequency and standardized absolute return. For each stock and each 30-minute period, trade frequency is defined as the number of trades and absolute return is defined as the absolute value of the midpoint-to-midpoint return during the period. Both variables are then standardized by their respective standard deviation calculated across all pooled time-series and cross-sectional observations. Panel A plots time-series observations of standardized trade frequency and standardized absolute return for Exxon Mobil (XOM) and illustrates the three attention variables used in the analysis. Attention1 is the standardized trade frequency and is reflected in the vertical distance to each data point. Attention2 is the standardized absolute return and is reflected in the horizontal distance to each data point. Attention3 is an interaction defined as the product of Attention1 and Attention2 and is reflected in the area of the rectangle formed by Attention1 and Attention2. Panel B plots mean values of standardized trade frequency and standardized absolute return for each sample security.

35
Table I Summary Statistics
The table reports summary statistics for the sample of 1,252 common stocks and ADRs listed on the NYSE from August 1 through October 31, 2002. All securities meet the following restrictions: (1) included in both CRSP and the NYSE Specialist Directory for the entire sample period, (2) no stock splits during the sample period, (3) an average transaction price greater than $3 and less than $200, (4) a minimum transaction price greater than $2, and (5) at least one trade in 800 of the 840 available 30-minute trading periods. Quoted spreads, effective spreads, and the magnitude of price improvement are defined as trade-weighted averages during each 30-minute period. The rate of price improvement is defined as the proportion of all trades that occur at prices inside the bid-ask quotes. For each security, variables are averaged across all intraday trading periods and we report the cross-sectional average of these individual stock means. Panel B reports cross-sectional means by trade activity category, where stocks are divided into three categories based on the average daily number of trades during the pre-sample period from May through July 2002: the 100 most active stocks, the next 400 stocks, and the least active 752 stocks. The p-value in Panel B is from a test of the restriction that means are equal across trade activity categories, based on analysis of variance.
Panel A: Full Sample Mean Median Min Max Half-hours traded 837.32 840.00 800.00 840.00 Price ($) 26.50 23.39 3.15 121.73 Dollar volume per half-hour ($millions) 1.93 0.54 0.02 42.01 Share volume per half-hour (thousands) 66.74 25.57 1.69 1332.34 Trades per half-hour 60.40 40.09 5.77 355.81 Trade size 788.28 605.84 196.55 6208.99 Absolute 30-min midpoint return (bps) 56.79 52.53 8.43 158.23 Rate of price improvement (% of trades) 36.26 36.22 15.22 54.84 Magnitude of price improvement (¢) 1.44 1.34 0.41 5.57 Magnitude of price improvement (bps) 7.36 5.71 1.59 47.63 Quoted spread (¢) 5.21 4.84 1.83 22.93 % Quoted spread (bps) 26.85 20.70 6.52 159.23 Effective spread (¢) 3.77 3.49 1.26 19.81 % Effective spread (bps) 19.49 14.90 4.38 114.41
Panel B: Trade Activity Subsamples
High Activity(N=100)
Mid Activity (N=400)
Low Activity (N=752) p-value
Half-hours traded 839.88 839.93 835.60 0.000 Price ($) 38.69 31.44 22.25 0.000 Dollar volume per half-hour ($millions) 11.46 2.51 0.35 0.000 Share volume per half-hour (thousands) 347.43 89.49 17.31 0.000 Trades per half-hour 198.65 90.29 26.11 0.000 Trade size 1704.81 940.73 585.31 0.000 Absolute 30-min midpoint return (bps) 61.78 58.54 55.20 0.000 Rate of price improvement (% of trades) 39.12 36.28 35.88 0.000 Magnitude of price improvement (¢) 1.35 1.28 1.52 0.000 Magnitude of price improvement (bps) 4.43 5.16 8.92 0.000 Quoted spread (¢) 4.47 4.48 5.69 0.000 % Quoted spread (bps) 14.21 17.82 33.34 0.000 Effective spread (¢) 3.12 3.20 4.17 0.000 % Effective spread (bps) 9.77 12.65 24.41 0.000
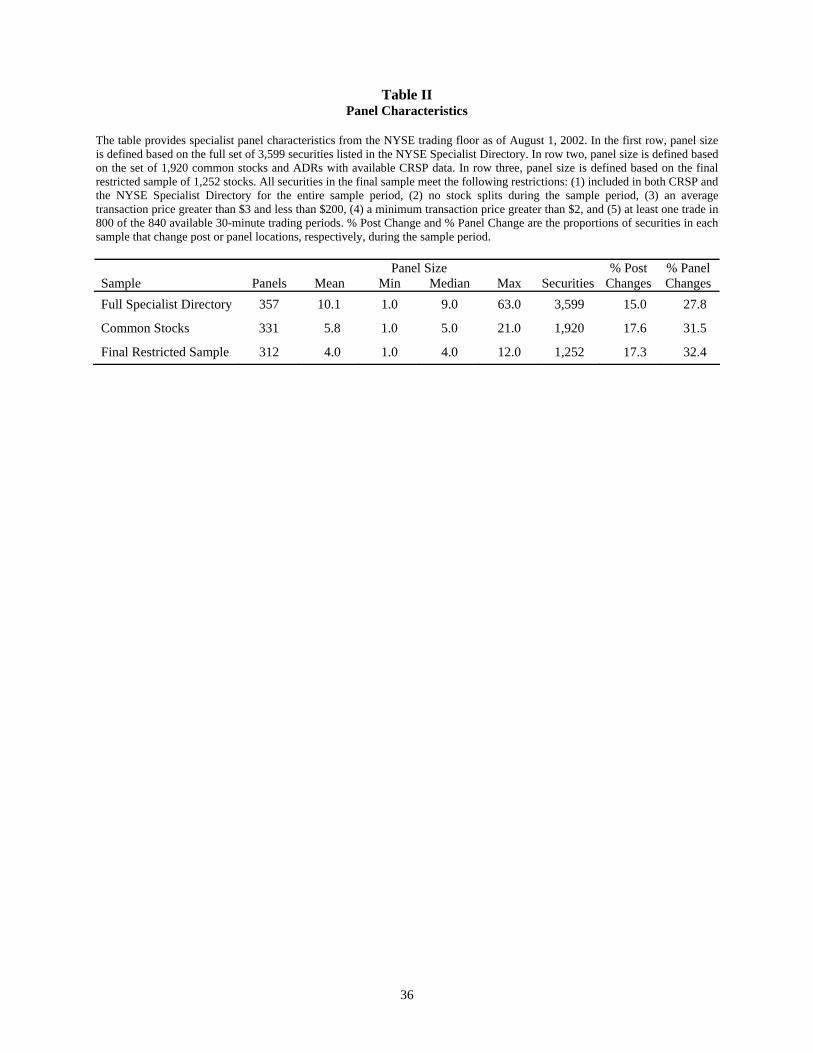
36
Table II Panel Characteristics
The table provides specialist panel characteristics from the NYSE trading floor as of August 1, 2002. In the first row, panel size is defined based on the full set of 3,599 securities listed in the NYSE Specialist Directory. In row two, panel size is defined based on the set of 1,920 common stocks and ADRs with available CRSP data. In row three, panel size is defined based on the final restricted sample of 1,252 stocks. All securities in the final sample meet the following restrictions: (1) included in both CRSP and the NYSE Specialist Directory for the entire sample period, (2) no stock splits during the sample period, (3) an average transaction price greater than $3 and less than $200, (4) a minimum transaction price greater than $2, and (5) at least one trade in 800 of the 840 available 30-minute trading periods. % Post Change and % Panel Change are the proportions of securities in each sample that change post or panel locations, respectively, during the sample period.
Panel Size Sample
Panels Mean Min Median Max
Securities
% Post Changes
% Panel Changes
Full Specialist Directory 357 10.1 1.0 9.0 63.0 3,599 15.0 27.8
Common Stocks 331 5.8 1.0 5.0 21.0 1,920 17.6 31.5
Final Restricted Sample 312 4.0 1.0 4.0 12.0 1,252 17.3 32.4

37
Table III Panel Size and Trading Characteristics by Trade Activity Category
The table provides average panel size and trading characteristics for the restricted sample of 1,252 common stocks and ADRs listed on the NYSE from August 1 through October 31, 2002. All securities meet the following restrictions: (1) included in both CRSP and the NYSE Specialist Directory for the entire sample period, (2) no stock splits during the sample period, (3) an average transaction price greater than $3 and less than $200, (4) a minimum transaction price greater than $2, and (5) at least one trade in 800 of the 840 available 30-minute trading periods. For each security, panel and trading characteristics are averaged across all intraday trading periods and we report the cross-sectional average of these individual stock means. Sample stocks are divided into three categories based on the average daily number of trades during the pre-sample period from May through July, 2002: the 100 most active stocks, the next 400 stocks, and the least active 752 stocks. Means are reported separately for each category. In the first row, panel size is defined based on the full set of 3,599 securities listed in the August 1st NYSE Specialist Directory. In rows two through five, panel size, panel rank, and market share are defined based on the sample of 1,920 common stocks and ADRs with available CRSP data. The p-value is from a test of the restriction that means are equal across trade activity categories, based on analysis of variance.
Trade Activity Category: High Activity
(N=100) Mid Activity
(N=400) Low Activity
(N=752)
p-value All Securities at Panel 7.90 9.48 12.96 0.000 All Common Stocks at Panel 4.48 5.88 8.01 0.000 Rank among Common Stocks at Panel 1.20 1.86 3.84 0.000 Share of Dollar Volume at Panel (%) 68.01 36.40 11.18 0.000 Share of Trades at Panel (%) 58.07 33.78 13.22 0.000
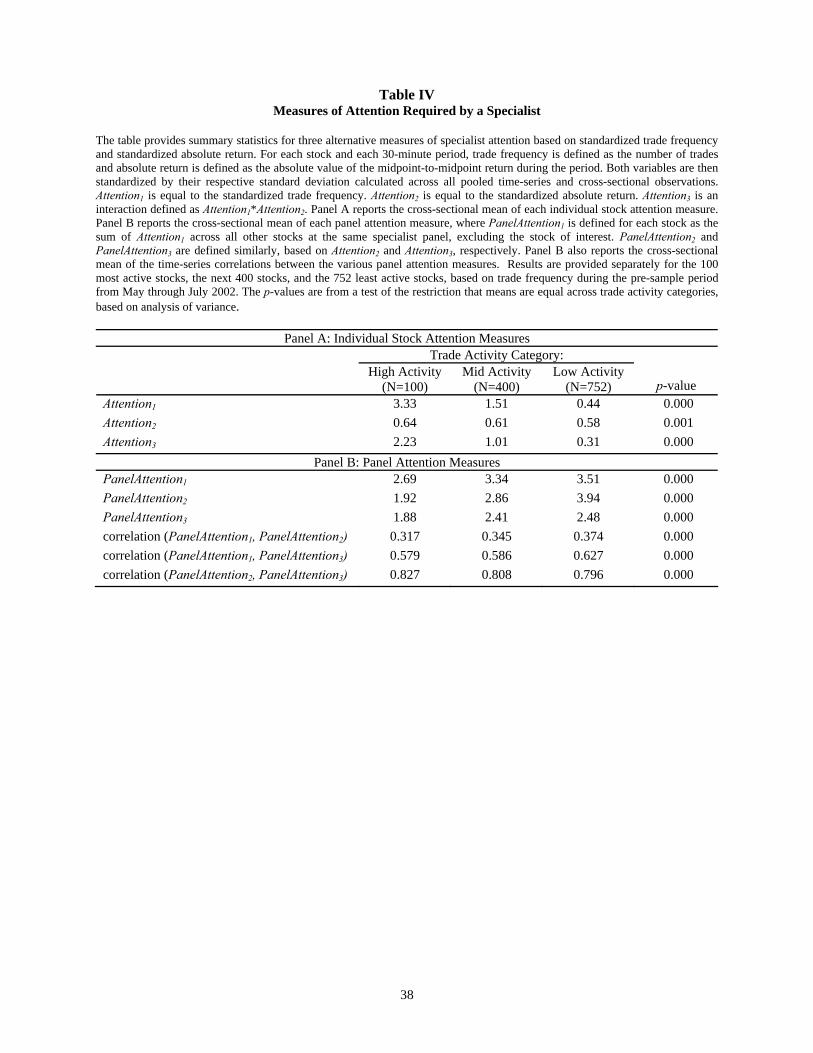
38
Table IV Measures of Attention Required by a Specialist
The table provides summary statistics for three alternative measures of specialist attention based on standardized trade frequency and standardized absolute return. For each stock and each 30-minute period, trade frequency is defined as the number of trades and absolute return is defined as the absolute value of the midpoint-to-midpoint return during the period. Both variables are then standardized by their respective standard deviation calculated across all pooled time-series and cross-sectional observations. Attention1 is equal to the standardized trade frequency. Attention2 is equal to the standardized absolute return. Attention3 is an interaction defined as Attention1*Attention2. Panel A reports the cross-sectional mean of each individual stock attention measure. Panel B reports the cross-sectional mean of each panel attention measure, where PanelAttention1 is defined for each stock as the sum of Attention1 across all other stocks at the same specialist panel, excluding the stock of interest. PanelAttention2 and PanelAttention3 are defined similarly, based on Attention2 and Attention3, respectively. Panel B also reports the cross-sectional mean of the time-series correlations between the various panel attention measures. Results are provided separately for the 100 most active stocks, the next 400 stocks, and the 752 least active stocks, based on trade frequency during the pre-sample period from May through July 2002. The p-values are from a test of the restriction that means are equal across trade activity categories, based on analysis of variance.
Panel A: Individual Stock Attention Measures
Trade Activity Category: High Activity
(N=100) Mid Activity
(N=400) Low Activity
(N=752)
p-value Attention1 3.33 1.51 0.44 0.000 Attention2 0.64 0.61 0.58 0.001 Attention3 2.23 1.01 0.31 0.000
Panel B: Panel Attention Measures PanelAttention1 2.69 3.34 3.51 0.000 PanelAttention2 1.92 2.86 3.94 0.000 PanelAttention3 1.88 2.41 2.48 0.000 correlation (PanelAttention1, PanelAttention2) 0.317 0.345 0.374 0.000 correlation (PanelAttention1, PanelAttention3) 0.579 0.586 0.627 0.000 correlation (PanelAttention2, PanelAttention3) 0.827 0.808 0.796 0.000
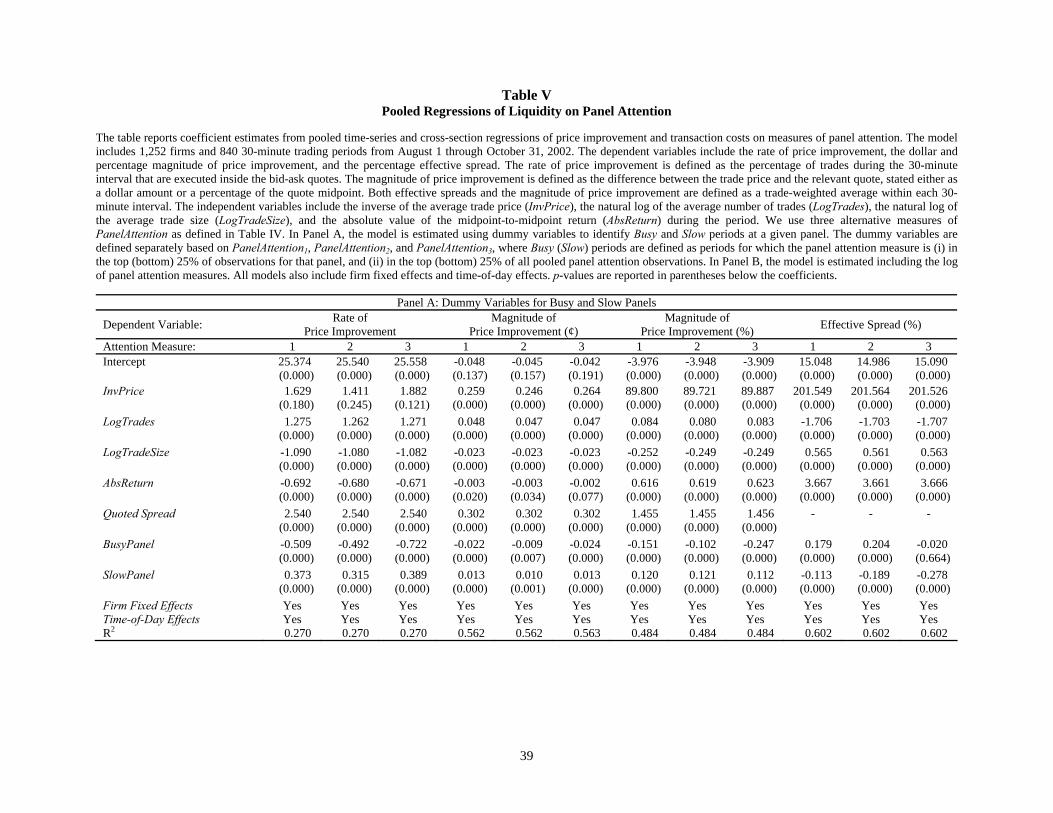
39
Table V Pooled Regressions of Liquidity on Panel Attention
The table reports coefficient estimates from pooled time-series and cross-section regressions of price improvement and transaction costs on measures of panel attention. The model includes 1,252 firms and 840 30-minute trading periods from August 1 through October 31, 2002. The dependent variables include the rate of price improvement, the dollar and percentage magnitude of price improvement, and the percentage effective spread. The rate of price improvement is defined as the percentage of trades during the 30-minute interval that are executed inside the bid-ask quotes. The magnitude of price improvement is defined as the difference between the trade price and the relevant quote, stated either as a dollar amount or a percentage of the quote midpoint. Both effective spreads and the magnitude of price improvement are defined as a trade-weighted average within each 30-minute interval. The independent variables include the inverse of the average trade price (InvPrice), the natural log of the average number of trades (LogTrades), the natural log of the average trade size (LogTradeSize), and the absolute value of the midpoint-to-midpoint return (AbsReturn) during the period. We use three alternative measures of PanelAttention as defined in Table IV. In Panel A, the model is estimated using dummy variables to identify Busy and Slow periods at a given panel. The dummy variables are defined separately based on PanelAttention1, PanelAttention2, and PanelAttention3, where Busy (Slow) periods are defined as periods for which the panel attention measure is (i) in the top (bottom) 25% of observations for that panel, and (ii) in the top (bottom) 25% of all pooled panel attention observations. In Panel B, the model is estimated including the log of panel attention measures. All models also include firm fixed effects and time-of-day effects. p-values are reported in parentheses below the coefficients.
Panel A: Dummy Variables for Busy and Slow Panels
Dependent Variable: Rate of Price Improvement
Magnitude of Price Improvement (¢)
Magnitude of Price Improvement (%) Effective Spread (%)
Attention Measure: 1 2 3 1 2 3 1 2 3 1 2 3 Intercept 25.374
(0.000) 25.540 (0.000)
25.558 (0.000)
-0.048 (0.137)
-0.045 (0.157)
-0.042 (0.191)
-3.976 (0.000)
-3.948 (0.000)
-3.909 (0.000)
15.048 (0.000)
14.986 (0.000)
15.090 (0.000)
InvPrice 1.629 (0.180)
1.411 (0.245)
1.882 (0.121)
0.259 (0.000)
0.246 (0.000)
0.264 (0.000)
89.800 (0.000)
89.721 (0.000)
89.887 (0.000)
201.549 (0.000)
201.564 (0.000)
201.526 (0.000)
LogTrades 1.275 (0.000)
1.262 (0.000)
1.271 (0.000)
0.048 (0.000)
0.047 (0.000)
0.047 (0.000)
0.084 (0.000)
0.080 (0.000)
0.083 (0.000)
-1.706 (0.000)
-1.703 (0.000)
-1.707 (0.000)
LogTradeSize -1.090 (0.000)
-1.080 (0.000)
-1.082 (0.000)
-0.023 (0.000)
-0.023 (0.000)
-0.023 (0.000)
-0.252 (0.000)
-0.249 (0.000)
-0.249 (0.000)
0.565 (0.000)
0.561 (0.000)
0.563 (0.000)
AbsReturn -0.692 (0.000)
-0.680 (0.000)
-0.671 (0.000)
-0.003 (0.020)
-0.003 (0.034)
-0.002 (0.077)
0.616 (0.000)
0.619 (0.000)
0.623 (0.000)
3.667 (0.000)
3.661 (0.000)
3.666 (0.000)
Quoted Spread 2.540 (0.000)
2.540 (0.000)
2.540 (0.000)
0.302 (0.000)
0.302 (0.000)
0.302 (0.000)
1.455 (0.000)
1.455 (0.000)
1.456 (0.000)
- - -
BusyPanel -0.509 (0.000)
-0.492 (0.000)
-0.722 (0.000)
-0.022 (0.000)
-0.009 (0.007)
-0.024 (0.000)
-0.151 (0.000)
-0.102 (0.000)
-0.247 (0.000)
0.179 (0.000)
0.204 (0.000)
-0.020 (0.664)
SlowPanel 0.373 (0.000)
0.315 (0.000)
0.389 (0.000)
0.013 (0.000)
0.010 (0.001)
0.013 (0.000)
0.120 (0.000)
0.121 (0.000)
0.112 (0.000)
-0.113 (0.000)
-0.189 (0.000)
-0.278 (0.000)
Firm Fixed Effects Yes Yes Yes Yes Yes Yes Yes Yes Yes Yes Yes Yes Time-of-Day Effects Yes Yes Yes Yes Yes Yes Yes Yes Yes Yes Yes Yes R2 0.270 0.270 0.270 0.562 0.562 0.563 0.484 0.484 0.484 0.602 0.602 0.602
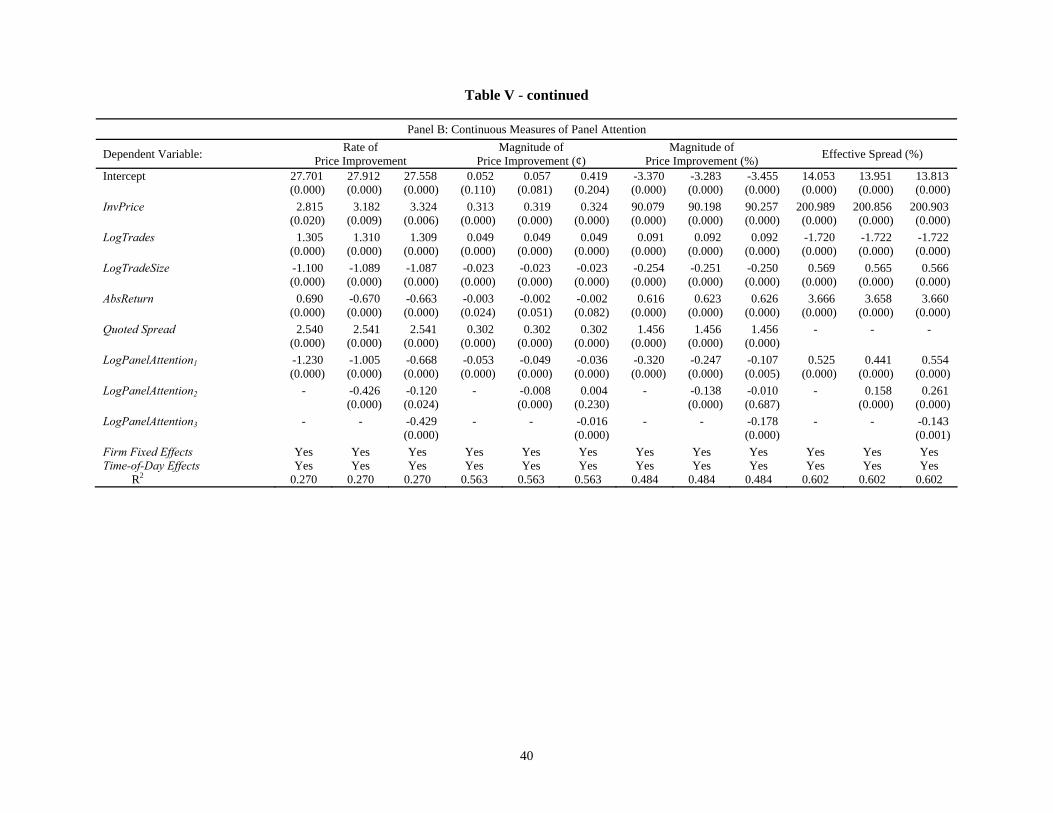
40
Table V - continued
Panel B: Continuous Measures of Panel Attention
Dependent Variable: Rate of Price Improvement
Magnitude of Price Improvement (¢)
Magnitude of Price Improvement (%) Effective Spread (%)
Intercept 27.701 (0.000)
27.912 (0.000)
27.558 (0.000)
0.052 (0.110)
0.057 (0.081)
0.419 (0.204)
-3.370 (0.000)
-3.283 (0.000)
-3.455 (0.000)
14.053 (0.000)
13.951 (0.000)
13.813 (0.000)
InvPrice 2.815 (0.020)
3.182 (0.009)
3.324 (0.006)
0.313 (0.000)
0.319 (0.000)
0.324 (0.000)
90.079 (0.000)
90.198 (0.000)
90.257 (0.000)
200.989 (0.000)
200.856 (0.000)
200.903 (0.000)
LogTrades 1.305 (0.000)
1.310 (0.000)
1.309 (0.000)
0.049 (0.000)
0.049 (0.000)
0.049 (0.000)
0.091 (0.000)
0.092 (0.000)
0.092 (0.000)
-1.720 (0.000)
-1.722 (0.000)
-1.722 (0.000)
LogTradeSize -1.100 (0.000)
-1.089 (0.000)
-1.087 (0.000)
-0.023 (0.000)
-0.023 (0.000)
-0.023 (0.000)
-0.254 (0.000)
-0.251 (0.000)
-0.250 (0.000)
0.569 (0.000)
0.565 (0.000)
0.566 (0.000)
AbsReturn 0.690 (0.000)
-0.670 (0.000)
-0.663 (0.000)
-0.003 (0.024)
-0.002 (0.051)
-0.002 (0.082)
0.616 (0.000)
0.623 (0.000)
0.626 (0.000)
3.666 (0.000)
3.658 (0.000)
3.660 (0.000)
Quoted Spread 2.540 (0.000)
2.541 (0.000)
2.541 (0.000)
0.302 (0.000)
0.302 (0.000)
0.302 (0.000)
1.456 (0.000)
1.456 (0.000)
1.456 (0.000)
- - -
LogPanelAttention1 -1.230 (0.000)
-1.005 (0.000)
-0.668 (0.000)
-0.053 (0.000)
-0.049 (0.000)
-0.036 (0.000)
-0.320 (0.000)
-0.247 (0.000)
-0.107 (0.005)
0.525 (0.000)
0.441 (0.000)
0.554 (0.000)
LogPanelAttention2 - -0.426 (0.000)
-0.120 (0.024)
- -0.008 (0.000)
0.004 (0.230)
- -0.138 (0.000)
-0.010 (0.687)
- 0.158 (0.000)
0.261 (0.000)
LogPanelAttention3 - - -0.429 (0.000)
- - -0.016 (0.000)
- - -0.178 (0.000)
- - -0.143 (0.001)
Firm Fixed Effects Yes Yes Yes Yes Yes Yes Yes Yes Yes Yes Yes Yes Time-of-Day Effects Yes Yes Yes Yes Yes Yes Yes Yes Yes Yes Yes Yes
R2 0.270 0.270 0.270 0.563 0.563 0.563 0.484 0.484 0.484 0.602 0.602 0.602

41
Table VI Pooled Regressions of Liquidity on Total and Unexpected Panel Attention Controlling for Market-Wide Effects
The table reports coefficient estimates from pooled time-series and cross-section regressions of price improvement and transaction costs on measures of panel attention after controlling for market-wide effects. The model includes 1,252 firms and 840 30-minute trading periods from August 1 through October 31, 2002. The dependent and independent variables are defined in Table V and we use three alternative measures of PanelAttention as defined in Table IV. For brevity, we do not report the coefficients on the control variables, as they do not change substantially from those reported on Table V. Panel attention is further separated into expected and unexpected components as described in Section III.D. Results for total panel attention are provided in Panel A and results for unexpected panel attention are provided in Panel B. We control for both market-wide liquidity and market-wide attention effects using a two-stage regression procedure. In the first stage, we remove systematic liquidity effects by regressing each dependent variable on a corresponding market measure, defined as the equally-weighted average of the variable across all stocks that are not traded at the same panel. The residuals from the first stage are then used as the dependent variable in a second-stage pooled regression which follows the specification from Table V and also controls for market attention, defined as the sum of individual stock attention across all stocks not traded at the same panel. All models include firm fixed effects and time-of-day effects. p-values are reported in parentheses below the coefficients.
Panel A: Total Panel Attention
Dependent Variable: Rate of Price Improvement
Magnitude of Price Improvement (¢)
Magnitude of Price Improvement (%) Effective Spread (%)
LogPanelAttention1 -1.014 (0.000)
-0.852 (0.000)
-0.588 (0.000)
-0.057(0.000)
-0.044 (0.000)
-0.040 (0.000)
-0.296 (0.000)
-0.214 (0.000)
-0.141 (0.000)
-0.028 (0.642)
0.031 (0.616)
0.208 (0.003)
LogPanelAttention2 - -0.276 (0.000)
-0.033 (0.535)
- -0.007 (0.002)
-0.002 (0.630)
- -0.052 (0.004)
0.009 (0.732)
- 0.030 (0.359)
0.173 (0.000)
LogPanelAttention3 - - -0.356 (0.000)
- - -0.008 (0.018)
- - -0.092 (0.000)
- - -0.217 (0.000)
Firm Fixed Effects Yes Yes Yes Yes Yes Yes Yes Yes Yes Yes Yes Yes Time-of-Day Effects Yes Yes Yes Yes Yes Yes Yes Yes Yes Yes Yes Yes R2 0.152 0.152 0.152 0.411 0.413 0.413 0.235 0.237 0.237 0.059 0.060 0.060
Panel B: Unexpected Panel Attention
Dependent Variable: Rate of Price Improvement
Magnitude of Price Improvement (¢)
Magnitude of Price Improvement (%) Effective Spread (%)
UnexpectedPanelAttention1 -0.151 (0.000)
-0.131 (0.000)
-0.073 (0.000)
-0.008 (0.000)
-0.007 (0.000)
-0.005 (0.000)
-0.052 (0.000)
-0.047 (0.000)
-0.035 (0.000)
-0.060 (0.000)
-0.054 (0.000)
-0.054 (0.002)
UnexpectedPanelAttention2 - -0.045 (0.000)
-0.019 (0.008)
- -0.001 (0.000)
-0.000 (0.522)
- -0.001 (0.808)
0.005 (0.153)
- 0.002 (0.665)
0.002 (0.736)
UnexpectedPanelAttention3 - - -0.056 (0.000)
- - -0.002 (0.000)
- - -0.012 (0.001)
- - 0.000 (0.961)
Firm Fixed Effects Yes Yes Yes Yes Yes Yes Yes Yes Yes Yes Yes Yes Time-of-Day Effects Yes Yes Yes Yes Yes Yes Yes Yes Yes Yes Yes Yes R2 0.152 0.152 0.152 0.411 0.412 0.412 0.235 0.237 0.237 0.059 0.060 0.060
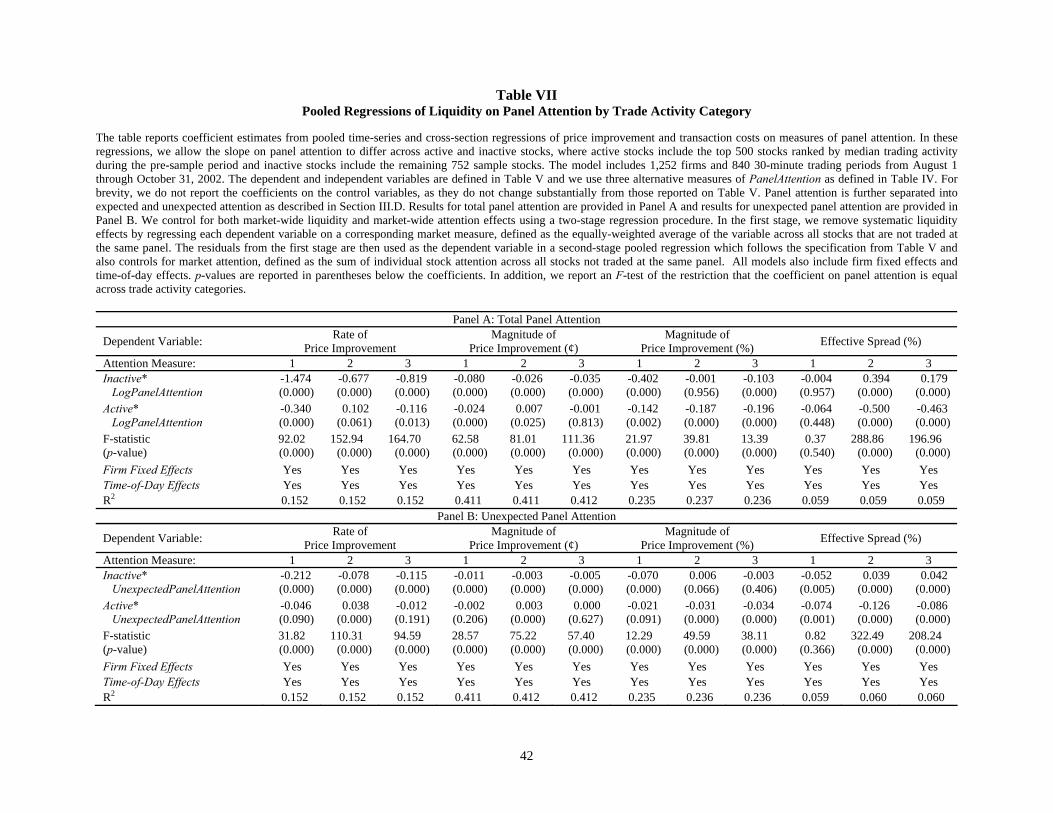
42
Table VII Pooled Regressions of Liquidity on Panel Attention by Trade Activity Category
The table reports coefficient estimates from pooled time-series and cross-section regressions of price improvement and transaction costs on measures of panel attention. In these regressions, we allow the slope on panel attention to differ across active and inactive stocks, where active stocks include the top 500 stocks ranked by median trading activity during the pre-sample period and inactive stocks include the remaining 752 sample stocks. The model includes 1,252 firms and 840 30-minute trading periods from August 1 through October 31, 2002. The dependent and independent variables are defined in Table V and we use three alternative measures of PanelAttention as defined in Table IV. For brevity, we do not report the coefficients on the control variables, as they do not change substantially from those reported on Table V. Panel attention is further separated into expected and unexpected attention as described in Section III.D. Results for total panel attention are provided in Panel A and results for unexpected panel attention are provided in Panel B. We control for both market-wide liquidity and market-wide attention effects using a two-stage regression procedure. In the first stage, we remove systematic liquidity effects by regressing each dependent variable on a corresponding market measure, defined as the equally-weighted average of the variable across all stocks that are not traded at the same panel. The residuals from the first stage are then used as the dependent variable in a second-stage pooled regression which follows the specification from Table V and also controls for market attention, defined as the sum of individual stock attention across all stocks not traded at the same panel. All models also include firm fixed effects and time-of-day effects. p-values are reported in parentheses below the coefficients. In addition, we report an F-test of the restriction that the coefficient on panel attention is equal across trade activity categories.
Panel A: Total Panel Attention
Dependent Variable: Rate of Price Improvement
Magnitude of Price Improvement (¢)
Magnitude of Price Improvement (%) Effective Spread (%)
Attention Measure: 1 2 3 1 2 3 1 2 3 1 2 3 Inactive* LogPanelAttention
-1.474 (0.000)
-0.677 (0.000)
-0.819 (0.000)
-0.080 (0.000)
-0.026 (0.000)
-0.035 (0.000)
-0.402 (0.000)
-0.001 (0.956)
-0.103 (0.000)
-0.004 (0.957)
0.394 (0.000)
0.179 (0.000)
Active* LogPanelAttention
-0.340 (0.000)
0.102 (0.061)
-0.116 (0.013)
-0.024 (0.000)
0.007 (0.025)
-0.001 (0.813)
-0.142 (0.002)
-0.187 (0.000)
-0.196 (0.000)
-0.064 (0.448)
-0.500 (0.000)
-0.463 (0.000)
F-statistic (p-value)
92.02 (0.000)
152.94 (0.000)
164.70 (0.000)
62.58 (0.000)
81.01 (0.000)
111.36 (0.000)
21.97 (0.000)
39.81 (0.000)
13.39 (0.000)
0.37 (0.540)
288.86 (0.000)
196.96 (0.000)
Firm Fixed Effects Yes Yes Yes Yes Yes Yes Yes Yes Yes Yes Yes Yes Time-of-Day Effects Yes Yes Yes Yes Yes Yes Yes Yes Yes Yes Yes Yes R2 0.152 0.152 0.152 0.411 0.411 0.412 0.235 0.237 0.236 0.059 0.059 0.059
Panel B: Unexpected Panel Attention
Dependent Variable: Rate of Price Improvement
Magnitude of Price Improvement (¢)
Magnitude of Price Improvement (%) Effective Spread (%)
Attention Measure: 1 2 3 1 2 3 1 2 3 1 2 3
Inactive* UnexpectedPanelAttention
-0.212 (0.000)
-0.078 (0.000)
-0.115 (0.000)
-0.011 (0.000)
-0.003 (0.000)
-0.005 (0.000)
-0.070 (0.000)
0.006 (0.066)
-0.003 (0.406)
-0.052 (0.005)
0.039 (0.000)
0.042 (0.000)
Active* UnexpectedPanelAttention
-0.046 (0.090)
0.038 (0.000)
-0.012 (0.191)
-0.002 (0.206)
0.003 (0.000)
0.000 (0.627)
-0.021 (0.091)
-0.031 (0.000)
-0.034 (0.000)
-0.074 (0.001)
-0.126 (0.000)
-0.086 (0.000)
F-statistic (p-value)
31.82 (0.000)
110.31 (0.000)
94.59 (0.000)
28.57 (0.000)
75.22 (0.000)
57.40 (0.000)
12.29 (0.000)
49.59 (0.000)
38.11 (0.000)
0.82 (0.366)
322.49 (0.000)
208.24 (0.000)
Firm Fixed Effects Yes Yes Yes Yes Yes Yes Yes Yes Yes Yes Yes Yes Time-of-Day Effects Yes Yes Yes Yes Yes Yes Yes Yes Yes Yes Yes Yes R2 0.152 0.152 0.152 0.411 0.412 0.412 0.235 0.236 0.236 0.059 0.060 0.060

43
Table VIII Pooled Regressions of Liquidity on Panel Attention by Own-Stock Trading Activity
The table reports coefficient estimates from pooled time-series and cross-section regressions of price improvement and transaction costs on measures of panel attention, allowing both the intercept and the slope on panel attention to differ based on the level of own-stock trading activity. To classify own-stock trading activity, we estimate the time-series mean and standard deviation of the number of trades for each stock. Periods of Low (High) own trading are then defined as periods where trading activity is more than one standard deviation below (above) the stock-specific mean. All other periods are defined as Normal. The model includes 1,252 firms and 840 30-minute trading periods from August 1 through October 31, 2002. The dependent and independent variables are defined in Table V and we use three alternative measures of PanelAttention as defined in Table IV. For brevity, we do not report the coefficients on the control variables, as they do not change substantially from those reported on Table V. Panel attention is further separated into expected and unexpected components as described in Section III.D. Results for total panel attention are provided in Panel A and results for unexpected panel attention are provided in Panel B. We control for both market-wide liquidity and market-wide attention effects using a two-stage regression procedure. In the first stage, we remove systematic liquidity effects by regressing each dependent variable on a corresponding market measure, defined as the equally-weighted average of the variable across all stocks that are not traded at the same panel. The residuals from the first stage are then used as the dependent variable in a second-stage pooled regression which follows the specification from Table V and also controls for market attention, defined as the sum of individual stock attention across all stocks not traded at the same panel. All models also include firm fixed effects and time-of-day effects. p-values are reported in parentheses below the coefficients.
Panel A: Total Panel Attention
Dependent Variable: Rate of Price Improvement
Magnitude of Price Improvement (¢)
Magnitude of Price Improvement (%) Effective Spread (%)
Attention Measure: 1 2 3 1 2 3 1 2 3 1 2 3
OwnLow* LogPanelAttention
-0.953 (0.000)
-0.379 (0.000)
-0.442 (0.000)
-0.003 (0.320)
0.015 (0.000)
0.002 (0.327)
-0.014 (0.497)
0.065 (0.000)
-0.007 (0.717)
-0.027 (0.694)
0.249 (0.000)
0.107 (0.027)
OwnNormal* LogPanelAttention
-1.007 (0.000)
-0.370 (0.000)
-0.518 (0.000)
-0.013 (0.000)
-0.006 (0.000)
-0.008 (0.000)
-0.069 (0.000)
-0.012 (0.161)
-0.037 (0.000)
-0.038 (0.530)
0.042 (0.199)
-0.096 (0.001)
OwnHigh* LogPanelAttention
-1.109 (0.000)
-0.395 (0.000)
-0.604 (0.000)
-0.013 (0.000)
-0.003 (0.242)
-0.006 (0.005)
-0.068 (0.003)
-0.031 (0.063)
-0.052 (0.002)
0.025 (0.705)
-0.080 (0.049)
-0.203 (0.000)
Firm Fixed Effects Yes Yes Yes Yes Yes Yes Yes Yes Yes Yes Yes Yes Time-of-Day Effects Yes Yes Yes Yes Yes Yes Yes Yes Yes Yes Yes Yes R2 0.152 0.152 0.152 0.411 0.409 0.409 0.234 0.239 0.237 0.059 0.059 0.059
Panel B: Unexpected Panel Attention
Dependent Variable: Rate of Price Improvement
Magnitude of Price Improvement (¢)
Magnitude of Price Improvement (%) Effective Spread (%)
Attention Measure: 1 2 3 1 2 3 1 2 3 1 2 3
OwnLow* UnexpectedPanelAttention
0.081 (0.080)
-0.019 (0.212)
-0.032 (0.055)
0.006 (0.040)
0.005 (0.000)
0.004 (0.000)
-0.005 (0.833)
0.011 (0.126)
-0.001 (0.858)
0.082 (0.035)
0.053 (0.000)
0.013 (0.366)
OwnNormal* UnexpectedPanelAttention
-0.175 (0.000)
-0.055 (0.000)
-0.081 (0.000)
-0.010 (0.000)
-0.003 (0.000)
-0.004 (0.000)
-0.062 (0.000)
-0.003 (0.404)
-0.016 (0.000)
-0.067 (0.000)
0.018 (0.001)
0.007 (0.223)
OwnHigh* UnexpectedPanelAttention
-0.192 (0.000)
-0.047 (0.000)
-0.078 (0.000)
-0.008 (0.000)
-0.001 (0.359)
-0.002 (0.001)
-0.041 (0.014)
-0.015 (0.012)
-0.019 (0.002)
-0.116 (0.000)
-0.132 (0.000)
-0.081 (0.000)
Firm Fixed Effects Yes Yes Yes Yes Yes Yes Yes Yes Yes Yes Yes Yes Time-of-Day Effects Yes Yes Yes Yes Yes Yes Yes Yes Yes Yes Yes Yes R2 0.152 0.152 0.152 0.411 0.412 0.412 0.235 0.236 0.236 0.059 0.060 0.060
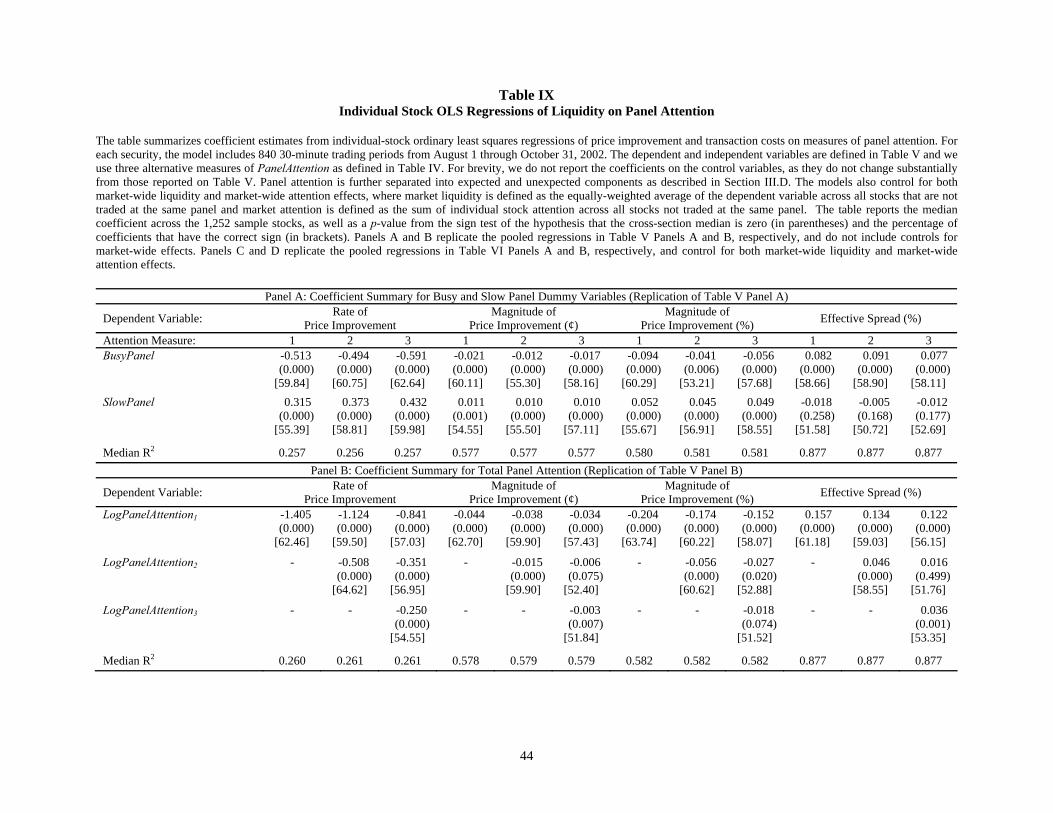
44
Table IX Individual Stock OLS Regressions of Liquidity on Panel Attention
The table summarizes coefficient estimates from individual-stock ordinary least squares regressions of price improvement and transaction costs on measures of panel attention. For each security, the model includes 840 30-minute trading periods from August 1 through October 31, 2002. The dependent and independent variables are defined in Table V and we use three alternative measures of PanelAttention as defined in Table IV. For brevity, we do not report the coefficients on the control variables, as they do not change substantially from those reported on Table V. Panel attention is further separated into expected and unexpected components as described in Section III.D. The models also control for both market-wide liquidity and market-wide attention effects, where market liquidity is defined as the equally-weighted average of the dependent variable across all stocks that are not traded at the same panel and market attention is defined as the sum of individual stock attention across all stocks not traded at the same panel. The table reports the median coefficient across the 1,252 sample stocks, as well as a p-value from the sign test of the hypothesis that the cross-section median is zero (in parentheses) and the percentage of coefficients that have the correct sign (in brackets). Panels A and B replicate the pooled regressions in Table V Panels A and B, respectively, and do not include controls for market-wide effects. Panels C and D replicate the pooled regressions in Table VI Panels A and B, respectively, and control for both market-wide liquidity and market-wide attention effects.
Panel A: Coefficient Summary for Busy and Slow Panel Dummy Variables (Replication of Table V Panel A)
Dependent Variable: Rate of Price Improvement
Magnitude of Price Improvement (¢)
Magnitude of Price Improvement (%) Effective Spread (%)
Attention Measure: 1 2 3 1 2 3 1 2 3 1 2 3 BusyPanel -0.513
(0.000) [59.84]
-0.494 (0.000)
[60.75]
-0.591 (0.000)
[62.64]
-0.021 (0.000)
[60.11]
-0.012 (0.000)
[55.30]
-0.017 (0.000)
[58.16]
-0.094 (0.000)
[60.29]
-0.041 (0.006)
[53.21]
-0.056 (0.000)
[57.68]
0.082 (0.000)
[58.66]
0.091 (0.000)
[58.90]
0.077 (0.000)
[58.11] SlowPanel 0.315
(0.000) [55.39]
0.373 (0.000)
[58.81]
0.432 (0.000)
[59.98]
0.011 (0.001)
[54.55]
0.010 (0.000)
[55.50]
0.010 (0.000)
[57.11]
0.052 (0.000)
[55.67]
0.045 (0.000)
[56.91]
0.049 (0.000)
[58.55]
-0.018 (0.258)
[51.58]
-0.005 (0.168)
[50.72]
-0.012 (0.177)
[52.69]
Median R2 0.257 0.256 0.257 0.577 0.577 0.577 0.580 0.581 0.581 0.877 0.877 0.877 Panel B: Coefficient Summary for Total Panel Attention (Replication of Table V Panel B)
Dependent Variable: Rate of Price Improvement
Magnitude of Price Improvement (¢)
Magnitude of Price Improvement (%) Effective Spread (%)
LogPanelAttention1 -1.405 (0.000)
[62.46]
-1.124 (0.000)
[59.50]
-0.841 (0.000)
[57.03]
-0.044 (0.000)
[62.70]
-0.038 (0.000)
[59.90]
-0.034 (0.000)
[57.43]
-0.204 (0.000)
[63.74]
-0.174 (0.000)
[60.22]
-0.152 (0.000)
[58.07]
0.157 (0.000)
[61.18]
0.134 (0.000)
[59.03]
0.122 (0.000)
[56.15]
LogPanelAttention2 - -0.508 (0.000)
[64.62]
-0.351 (0.000)
[56.95]
- -0.015 (0.000)
[59.90]
-0.006 (0.075)
[52.40]
- -0.056 (0.000)
[60.62]
-0.027 (0.020)
[52.88]
- 0.046 (0.000)
[58.55]
0.016 (0.499)
[51.76]
LogPanelAttention3 - - -0.250 (0.000)
[54.55]
- - -0.003 (0.007)
[51.84]
- - -0.018 (0.074)
[51.52]
- - 0.036 (0.001)
[53.35]
Median R2 0.260 0.261 0.261 0.578 0.579 0.579 0.582 0.582 0.582 0.877 0.877 0.877

45
Table IX – continued
Panel C: Coefficient Summary for Total Panel Attention after Controlling for Market Wide Effects (Replication of Table VI Panel A)
Dependent Variable: Rate of Price Improvement
Magnitude of Price Improvement (¢)
Magnitude of Price Improvement (%) Effective Spread (%)
LogPanelAttention1 -0.921 (0.000)
[59.03]
-0.709 (0.000)
[56.39]
-0.467 (0.001)
[53.83]
-0.031 (0.000)
[58.31]
-0.031 (0.000)
[57.19]
-0.024 (0.000)
[55.11]
-0.116 (0.000)
[56.95]
-0.089 (0.000)
[55.59]
-0.090 (0.000)
[54.79]
0.139 (0.000)
[57.91]
0.124 (0.000)
[56.95]
0.118 (0.000)
[55.35]
LogPanelAttention2 - -0.334 (0.000)
[59.19]
-0.180 (0.016)
[53.43]
- -0.006 (0.000)
[54.95]
0.000 (0.639)
[49.84]
- -0.019 (0.001)
[54.23]
-0.001 (0.883)
[50.16]
- 0.033 (0.000)
[54.95]
-0.006 (0.300)
[49.36]
LogPanelAttention3 - - -0.221 (0.000)
[54.55]
- - -0.005 (0.007)
[52.16]
- - -0.014 (0.086)
[51.36]
- - 0.032 (0.001)
[53.67]
Median R2 0.264 0.265 0.265 0.579 0.580 0.580 0.583 0.583 0.583 0.877 0.878 0.878 Panel D: Coefficient Summary for Unexpected Panel Attention after Controlling for Market-Wide Effects (Replication of Table VI Panel B)
Dependent Variable: Rate of Price Improvement
Magnitude of Price Improvement (¢)
Magnitude of Price Improvement (%) Effective Spread (%)
UnexpectedPanelAttention1 -0.187 (0.000)
[58.39]
-0.163 (0.000)
[56.63]
-0.114 (0.000)
[54.79]
-0.007 (0.000)
[57.67]
-0.007 (0.000)
[57.03]
-0.005 (0.000)
[54.39]
-0.026 (0.000)
[57.43]
-0.024 (0.000)
[56.95]
-0.016 (0.001)
[54.23]
0.028 (0.000)
[57.67]
0.022 (0.000)
[57.11]
0.018 (0.001)
[54.23]
UnexpectedPanelAttention2 - -0.071 (0.000)
[60.14]
-0.050 (0.000)
[56.07]
- -0.001 (0.000)
[54.63]
-0.001 (0.290)
[52.24]
- -0.005 (0.000)
[54.71]
-0.004 (0.109)
[52.88]
- 0.005 (0.002)
[54.55]
0.005 (0.753)
[52.24]
UnexpectedPanelAttention3 - - -0.025 (0.008)
[52.96]
- - -0.001 (0.033)
[52.00]
- - -0.005 (0.062)
[52.88]
- - 0.005 (0.023)
[52.56]
Median R2 0.262 0.263 0.264 0.579 0.581 0.581 0.582 0.584 0.584 0.877 0.877 0.878

46
1 See Kahneman (1973) and Pashler (1998) for detailed discussions of attention limits and attention allocation.
Limited attention is also related to the concept of “bounded rationality,” which has been applied extensively to other
economic questions. For a general discussion of bounded rationality, see Simon (1955, 1979) and Sargent (1993).
See Gifford (2005) for a discussion of limited attention as a bound on rationality.
2 In related work, Arbel and Strebel (1982) and Arbel, Carvell, and Strebel (1983) argue that investors will demand
higher expected returns for holding “neglected” or “generic” stocks. Similarly, Klein and Bawa (1977) and Barry
and Brown (1984, 1986) develop models in which the quality of available information differs across securities.
3 In a different setting, Hirshleifer and Teoh (2003) and Hirshleifer, Lim, and Teoh (2004) show that firms may alter
their financial reporting decisions in settings where investors are subject to limited attention. Limited attention has
also been applied in models of behavior within organizations. A common framework in these models is that of a
manager who must allocate limited effort across multiple projects (e.g., Radner and Rothschilde (1975) and Gifford
(2005)).
4 Gabaix and Laibson (2005) and Gabaix, Laibson, Moloche, and Weinberg (2006) develop a general cost-benefit
model of endogenous attention allocation and provide experimental evidence in support of this directed cognition
effect. See Peng (2005) for an application to financial markets.
5 We note that individual specialists share market-making risks and rewards by forming specialist firms. Prior
research finds that liquidity provision differs across specialist firms (see Cao, Choe, and Hatheway (1997) and
Corwin (1999)). Additionally, Coughenour and Deli (2002) and Coughenour and Saad (2004) find that transaction
cost differences and covariation in transaction costs can be partially explained by specialist firm characteristics.
Although firm-level effects may exist, we focus on whether individual specialists allocate attention across their set
of assigned stocks.
6 Schwartz (1993) notes that 11 stocks were reallocated across specialist firms due to poor performance following
October 1987. Stocks are also reassigned following specialist firm mergers. Corwin (2004) describes specialist
mergers and associated stock assignments from 1992 through 1998. Hatch and Johnson (2002) analyze the impact of
specialist mergers on market quality.
7 Models of inventory costs include Stoll (1978), Ho and Stoll (1981), and O’Hara and Oldfield (1986)). Models of
adverse selection costs include Copeland and Galai (1983), Glosten and Milgrom (1985), and Easley and O’Hara

47
(1987)). Prior research also suggests that the NYSE specialist can play a unique role in managing adverse selection
risks by averaging profits across time or across trades (Glosten (1989) and Leach and Madhavan (1993)) and by
forming relationships with floor traders (Benveniste, Marcus, and Wilhelm (1992)). Empirical studies of NYSE
specialist behavior generally support both inventory and adverse selection effects. See, for example, Hasbrouck and
Sofianos (1993), Madhavan and Smidt (1993), Madhavan and Sofianos (1998), and Kavajecz (1999).
8 To the extent that limited attention effects are most pronounced for the least active securities, these restrictions
should bias our tests against the Limited Attention Hypothesis. As a robustness test, we repeat the pooled regression
analysis including the 1,461 securities that trade in at least 630 (75%) of the intraday periods. As expected, the 219
added securities are very inactive and their transaction cost estimates are relatively noisy. For example, these stocks
average only five trades per half-hour period and have an average of 548 (of 840) periods with fewer than five
trades. In general, however, the conclusions are unchanged if this less restrictive sample is used.
9 We apply several standard filters to the trade and quote data. To calculate attention measures, we utilize only
NYSE trades that occur during regular trading hours, have a positive price and quantity traded, have normal
condition codes, and have trade correction codes less than two. To calculate liquidity measures, we exclude trades
for which the associated quotes have bid or offer depth that is nonpositive, a bid-ask spread that exceeds $5, a bid or
ask that differs by more than 25% from the preceding quote, or a bid or ask with mode other than 1, 2, 6, 10, or 12.
We also exclude the first trade each day, trades with condition codes denoting delayed execution, trades for which
the effective spread exceeds $5, and trades for which the price differs by more than 25% from the preceding price.
10 We determine trade direction based on the Lee and Ready (1991) algorithm with one modification. As suggested
by Bessembinder (2003), trades are compared to contemporaneous quotes rather than to quotes outstanding five
seconds prior to the trade. Using recent data, Bessembinder suggests that comparing trades to contemporaneous
quotes is optimal when determining trade direction and price improvement. To the extent that this algorithm results
in trade classification errors, these errors should be evident both inside and outside the quotes. As a robustness
check, we reestimate the rate of price improvement results using net price improvement, defined as the proportion of
trades inside the quotes minus the proportion of trades outside the quotes. The conclusions based on this alternative
measure are similar. On average, 0.9% of trades take place at prices less than the bid or greater than the ask.
11 Because trade activity categories are defined based on the pre-sample period, stocks included in the high (low)
trade activity category may not be the most (least) active stocks during the sample period. In a prior version of the
48
paper, we defined trade activity categories based on in-sample trading. Our conclusions are not sensitive to the
categorization method.
12 Both Nortel Networks and CIT Group trade at larger panels for most of the sample period. As of October 31,
2002, only three ETFs (SPY, QQQ, and DIA) and one common stock (OM Group) traded alone at a panel. OM
Group was moved to a single-stock panel on the last day of the sample period. None of these securities are included
in the subsequent regression analysis.
13 Attention3 will be highest when both trade frequency and absolute return are high. In previous versions of the
paper, we used an alternative attention measure defined as 22 returneed absolutstandardizreqed trade fstandardiz + . Unlike the
current Attention3, this alternative attention measure could be high if either trade frequency or absolute return is
high. The conclusions are similar if this alternative measure is used. The results are also similar if we define
Attention3 as the square root of (standardized trade frequency × standardized absolute return).
14 We include the latter restriction because, due to the nature of the stocks at the panel, some panels may always be
active or inactive relative to other panels on the NYSE trading floor. Results are qualitatively similar if we define
busy and slow periods using only (i). Based on the combined restrictions, 6.65% (6.04%) of total stock-period
observations are classified as busy (slow) based on PanelAttention1 and 8.64% (8.01%) of observations are
classified as busy (slow) based on PanelAttention2.
15 We report evidence throughout the paper based on the percentage effective spread. We also perform tests based on
the dollar quoted spread, the percentage quoted spread, and the dollar effective spread. Conclusions based on these
alternative measures are similar.
16 For completeness, we also estimate the models using random effects (not reported). A Hausman test easily rejects
the random effects specification for all models.
17 This two-stage procedure has three advantages over a single pooled regression. First, it is conservative in that all
systematic liquidity components are removed before analyzing panel attention effects. Second, it reduces
multicollinearity issues associated with including both market-wide liquidity and market-wide attention in the same
regression. Third, it avoids the problem of including an explanatory variable in the pooled regression that is a cross-
sectional average of the dependent variable. Nevertheless, the conclusions are unchanged if we instead estimate a
pooled regression that simultaneously includes both the market liquidity and market attention variables.
49
18 Throughout the remaining analyses, the coefficients on the control variables are similar to those in Table V. To
conserve space, these coefficients are not reported.
19 Demeaning panel attention removes cross-stock differences in the level of panel attention, allowing us to focus on
time-series effects. The conclusions are generally similar if we do not demean panel attention. Unlike total panel
attention, unexpected panel attention can be either positive or negative. As a result, we do not use a log specification
for unexpected panel attention. To remove the effects of extreme outliers, we winsorize unexpected attention at the
0.1 and 99.9 percentiles. The conclusions are generally unchanged if we winsorize at alternative levels.
20 Our panel attention measures are, by definition, highly correlated with market activity. To address this issue, we
repeat the analysis using a market spread estimate that is not constructed from our dependent or independent
variables. Specifically, we use the trade-weighted average spread on the SPDR (S&P500) exchange traded fund.
These regressions provide support for the Limited Attention Hypothesis.