Embed Size (px)
Citation preview

Limit of Detection
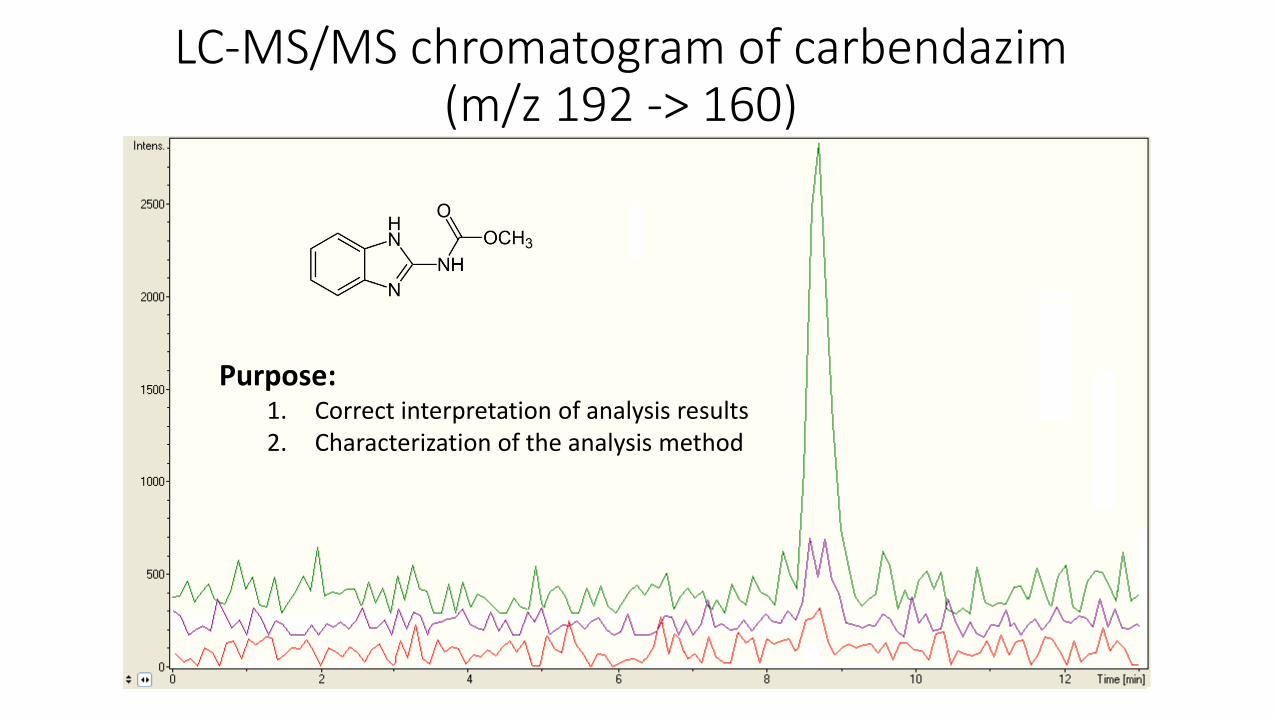
LC-MS/MS chromatogram of carbendazim(m/z 192 -> 160)
Purpose:1. Correct interpretation of analysis results2. Characterization of the analysis method
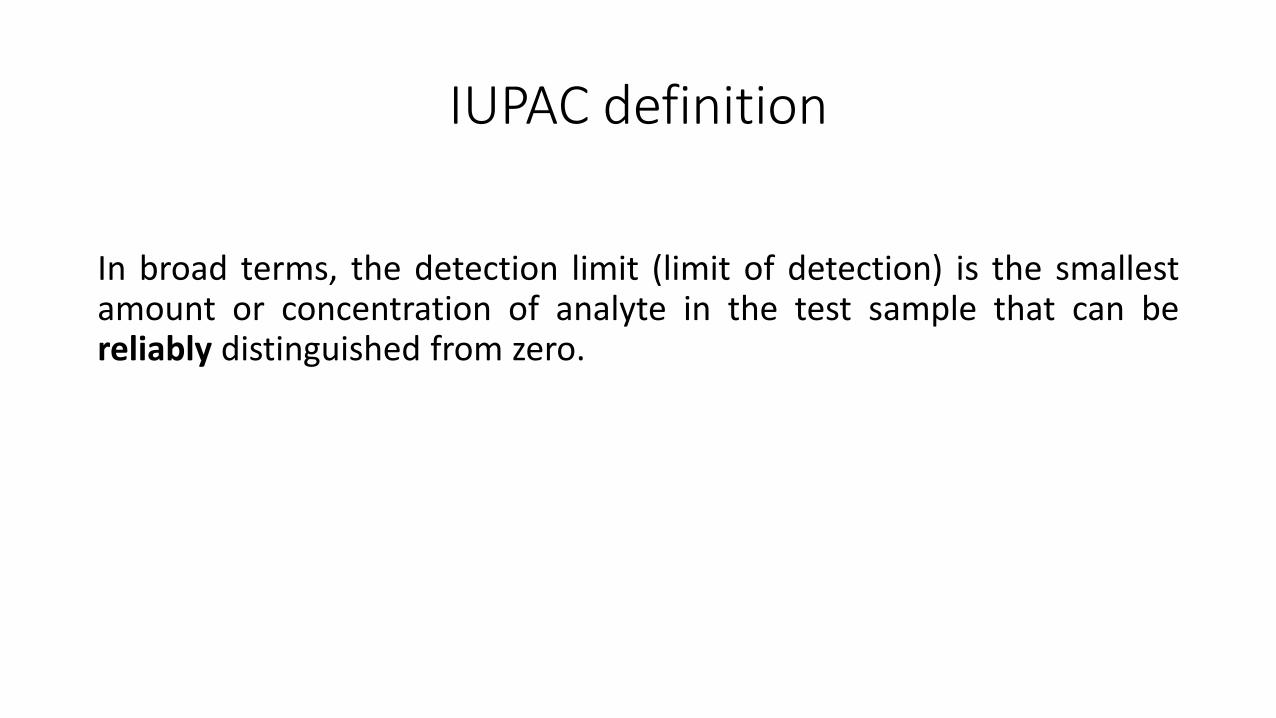
IUPAC definition
In broad terms, the detection limit (limit of detection) is the smallestamount or concentration of analyte in the test sample that can bereliably distinguished from zero.

Limit of Quantitation
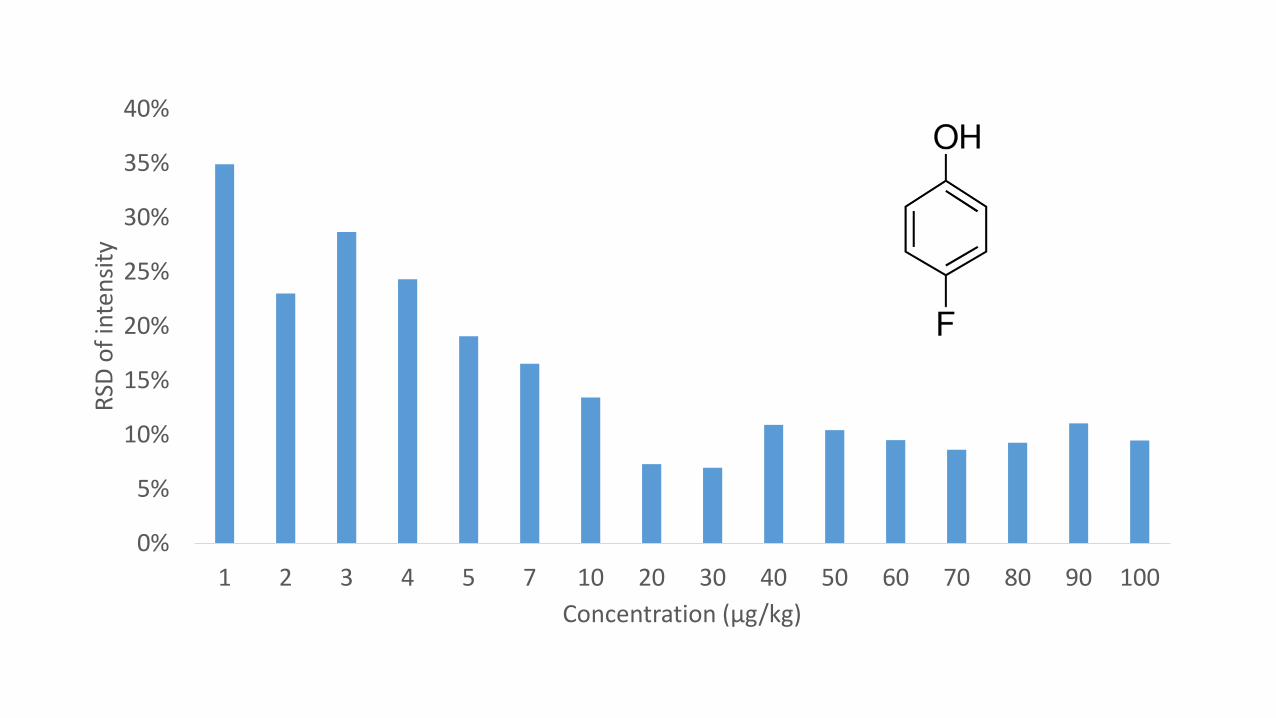
0%
5%
10%
15%
20%
25%
30%
35%
40%
1 2 3 4 5 7 10 20 30 40 50 60 70 80 90 100
RSD
of
inte
nsi
ty
Concentration (μg/kg)
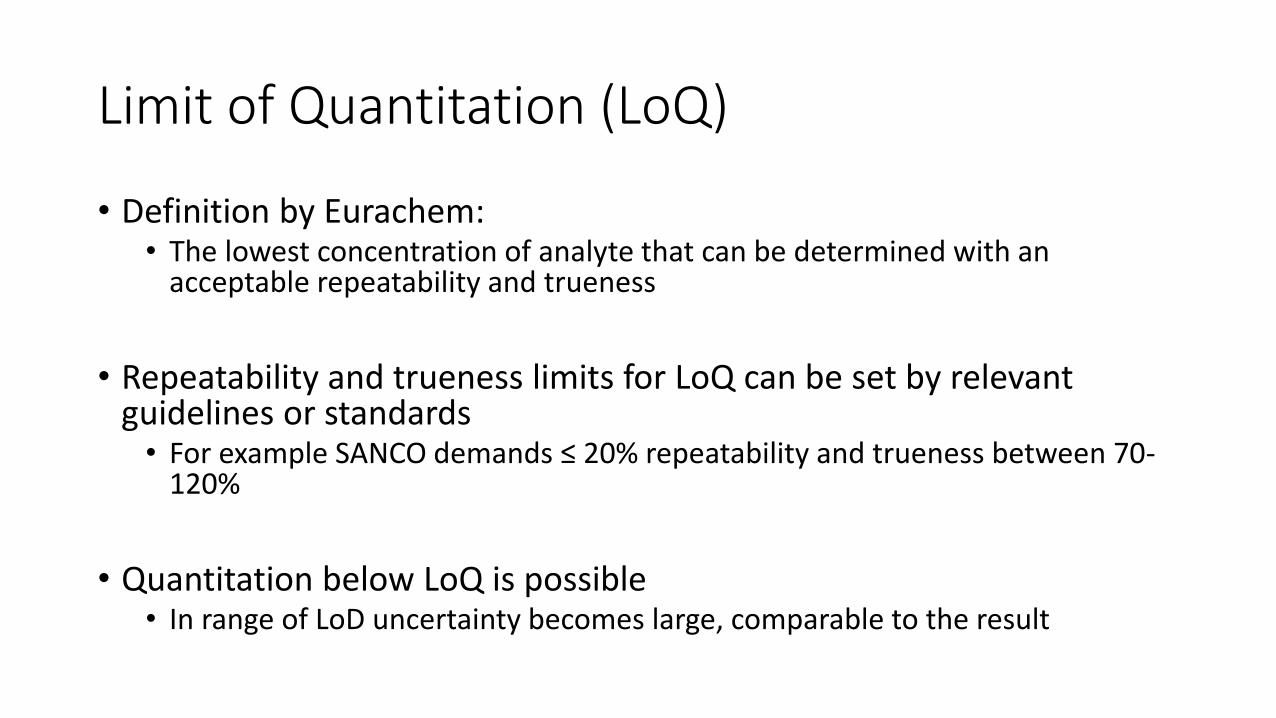
Limit of Quantitation (LoQ)
• Definition by Eurachem:• The lowest concentration of analyte that can be determined with an
acceptable repeatability and trueness
• Repeatability and trueness limits for LoQ can be set by relevant guidelines or standards• For example SANCO demands ≤ 20% repeatability and trueness between 70-
120%
• Quantitation below LoQ is possible• In range of LoD uncertainty becomes large, comparable to the result

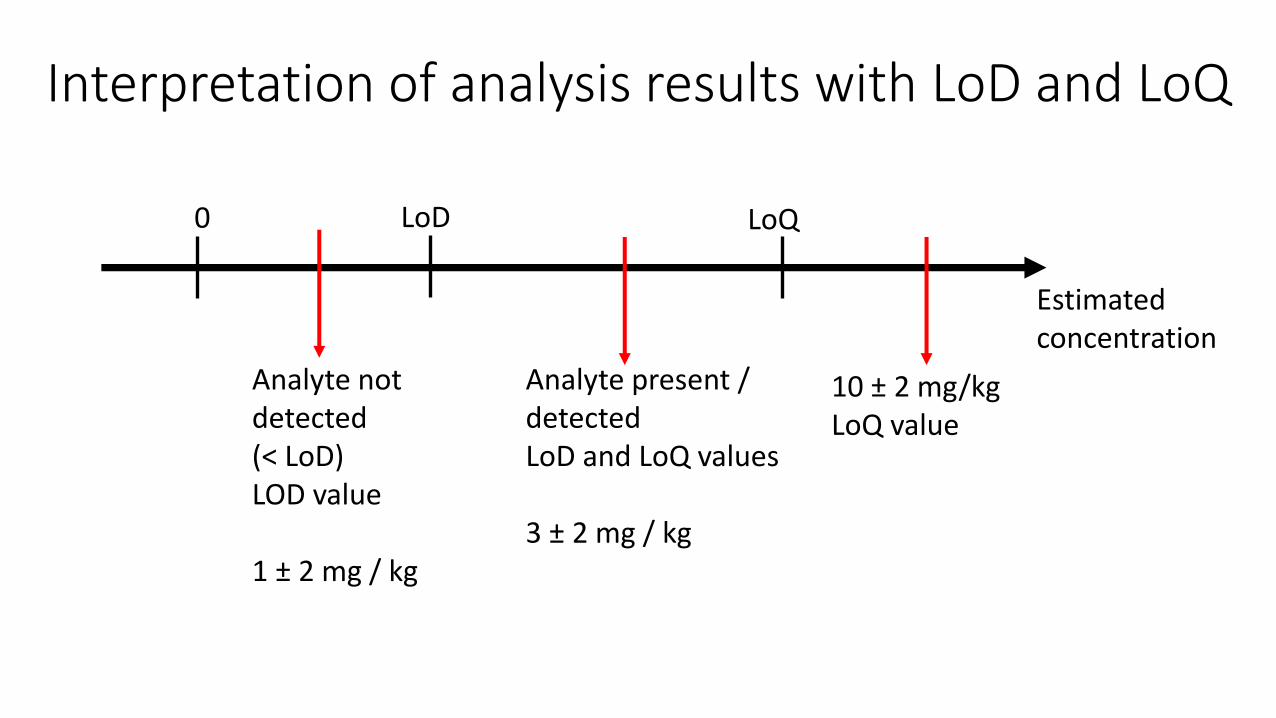
Interpretation of analysis results with LoD and LoQ
Interpretation of analysis results with LoD and LoQ
Estimated concentration
0 LoD LoQ
10 ± 2 mg/kgLoQ value
Analyte present / detectedLoD and LoQ values
3 ± 2 mg / kg
Analyte not detected(< LoD)LOD value
1 ± 2 mg / kg

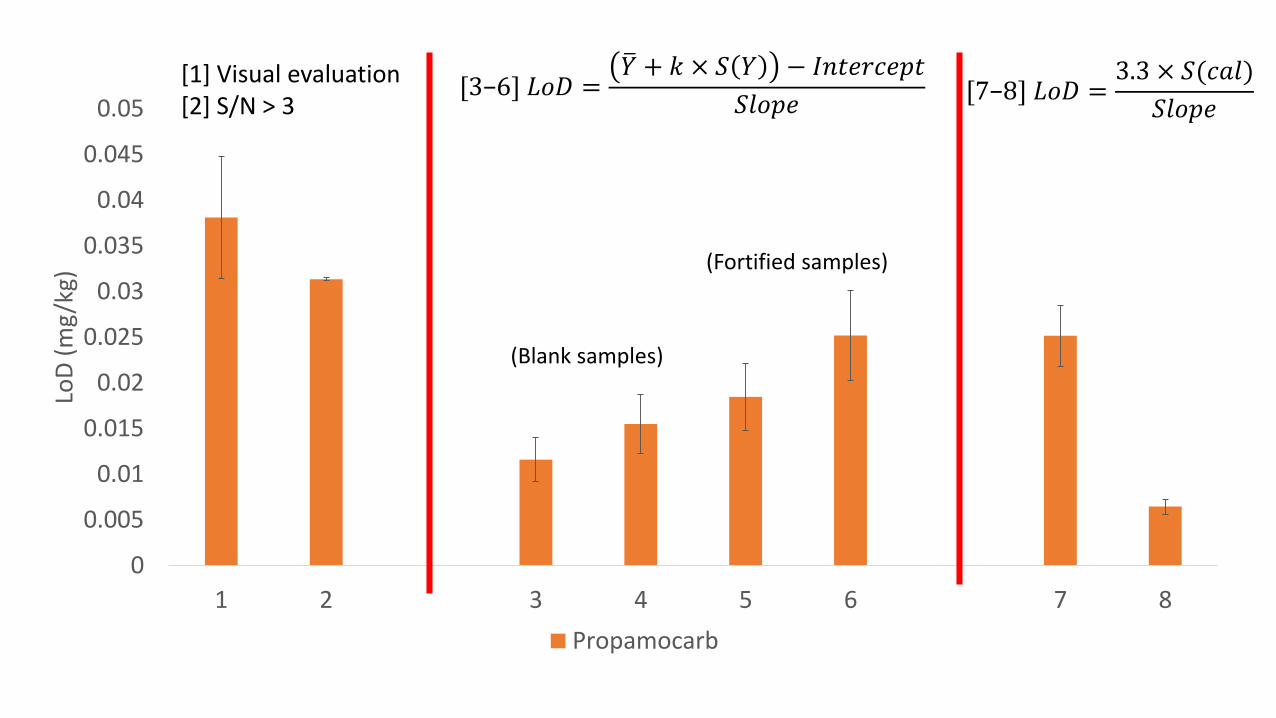
Different approaches to estimate LoD
Important aspects
• Guidelines give different approaches• E.g. FDA, IUPAC, Eurachem, NordVal, US EPA, etc.
• Not all approaches are fitting for all analytical methods
• Different approaches make different assumptions
0
0.005
0.01
0.015
0.02
0.025
0.03
0.035
0.04
0.045
0.05
1 2 3 4 5 6 7 8
LoD
(m
g/k
g)
Propamocarb
[1] Visual evaluation[2] S/N > 3
[7−8] 𝐿𝑜𝐷 =3.3 × 𝑆(𝑐𝑎𝑙)
𝑆𝑙𝑜𝑝𝑒[3−6] 𝐿𝑜𝐷 =
𝑌 + 𝑘 × 𝑆 𝑌 − 𝐼𝑛𝑡𝑒𝑟𝑐𝑒𝑝𝑡
𝑆𝑙𝑜𝑝𝑒
(Blank samples)
(Fortified samples)

Conclusions
• Results of different approaches are not comparable
• LoD depends on• Variance
• Slope and intercept
• Only an estimate of LoD can be found

Instrumental LoD and method LoD
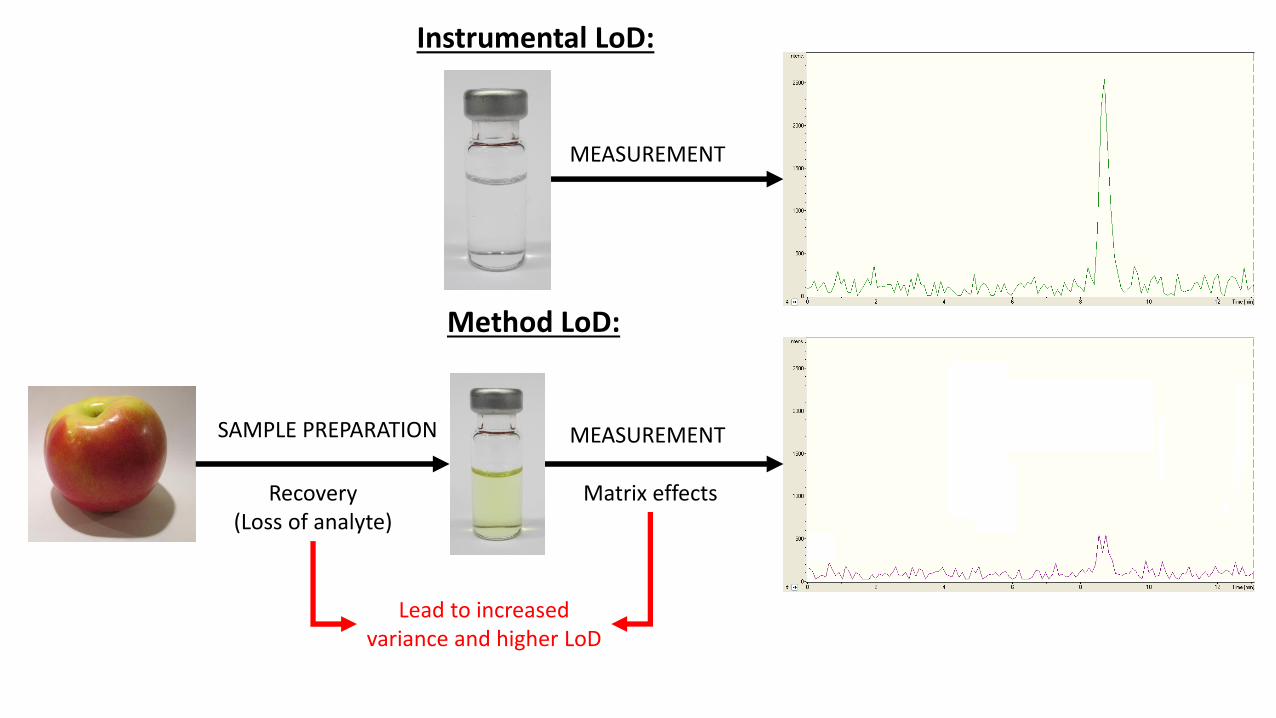
SAMPLE PREPARATION MEASUREMENT
Recovery (Loss of analyte)
Matrix effects
MEASUREMENT
Instrumental LoD:
Method LoD:
Lead to increased variance and higher LoD
Conclusion
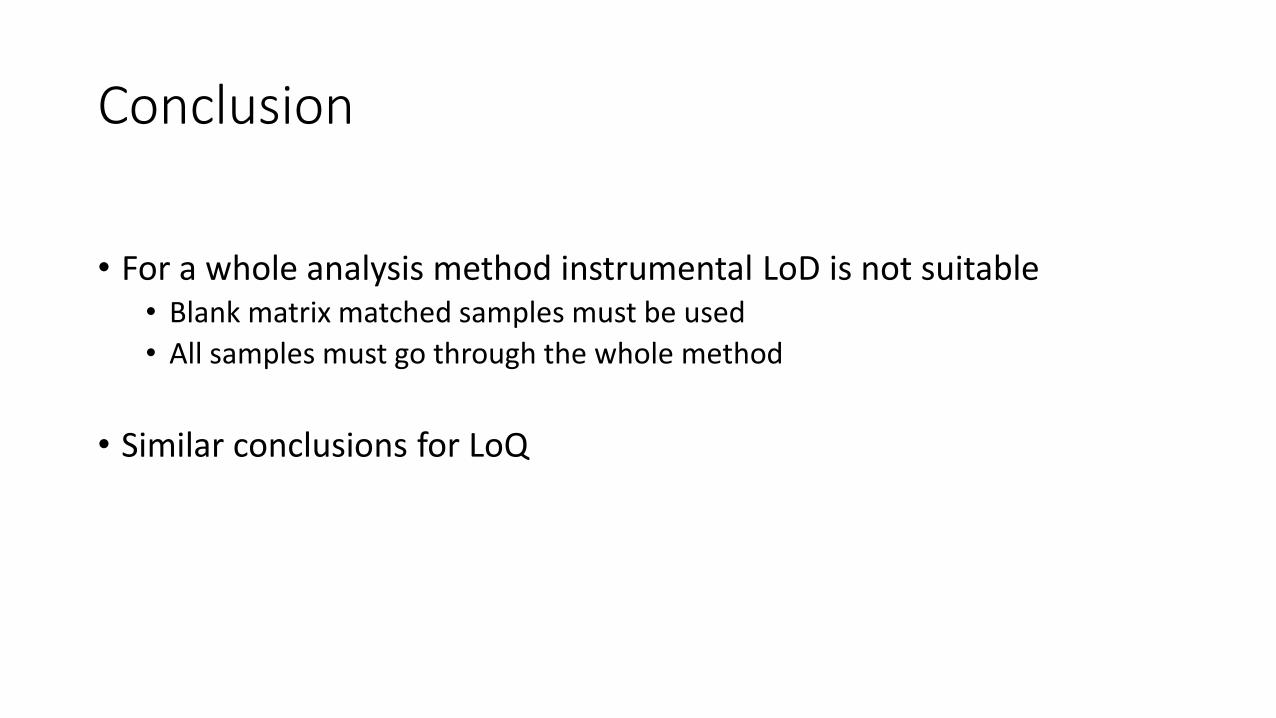
• For a whole analysis method instrumental LoD is not suitable• Blank matrix matched samples must be used
• All samples must go through the whole method
• Similar conclusions for LoQ
Decision limit (CCα) and detection capability (CCβ)
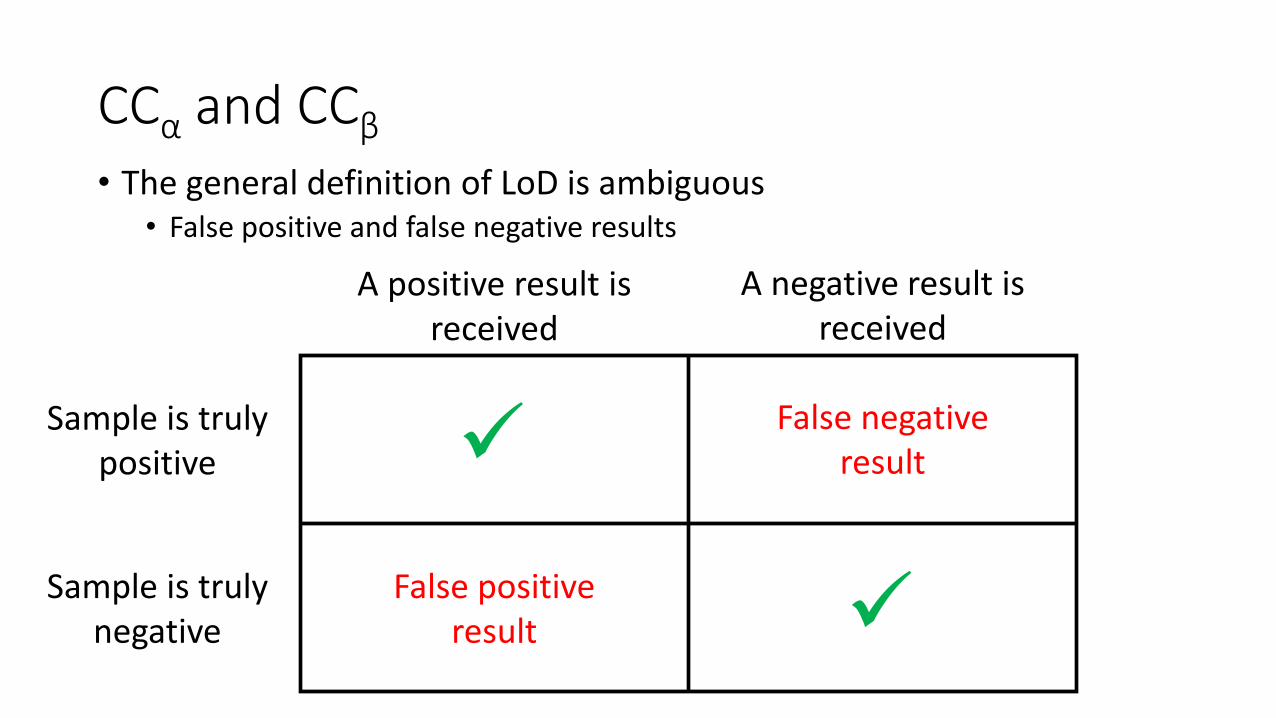
CCα and CCβ
• The general definition of LoD is ambiguous• False positive and false negative results
Sample is truly positive
Sample is truly negative
A positive result is received
A negative result is received
False negative result
False positive result
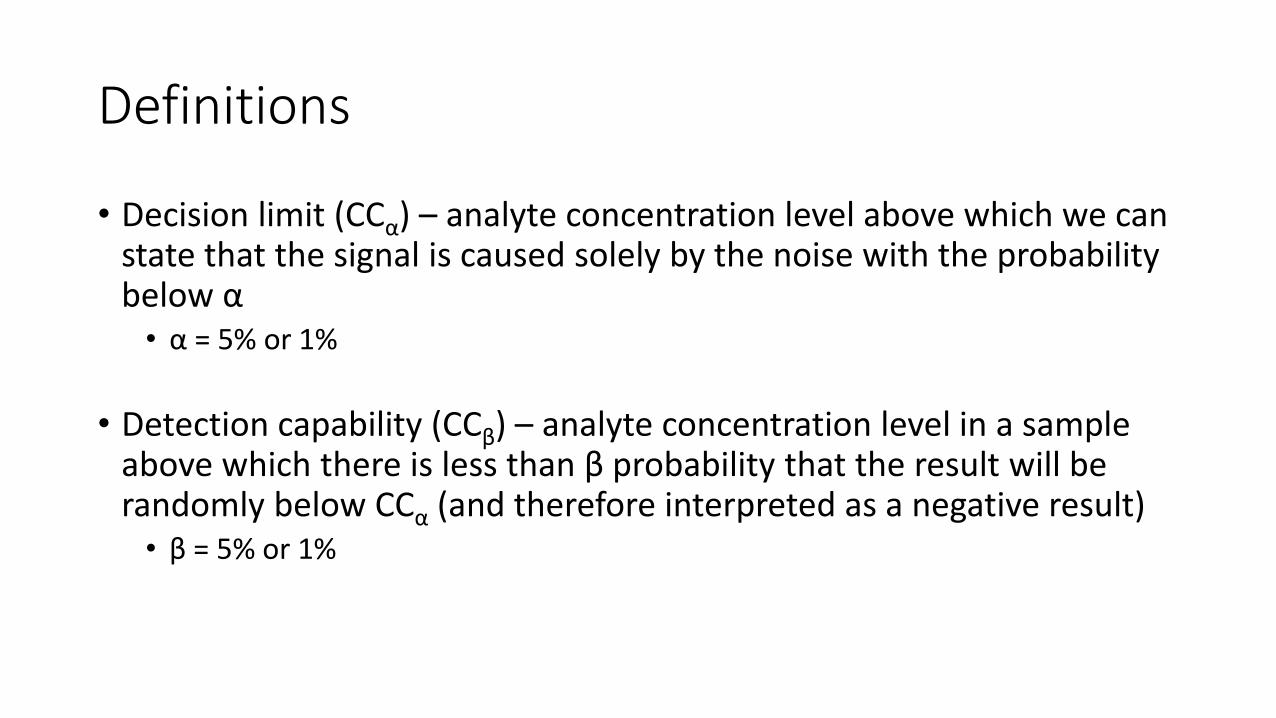
Definitions
• Decision limit (CCα) – analyte concentration level above which we can state that the signal is caused solely by the noise with the probability below α• α = 5% or 1%
• Detection capability (CCβ) – analyte concentration level in a sample above which there is less than β probability that the result will be randomly below CCα (and therefore interpreted as a negative result)• β = 5% or 1%
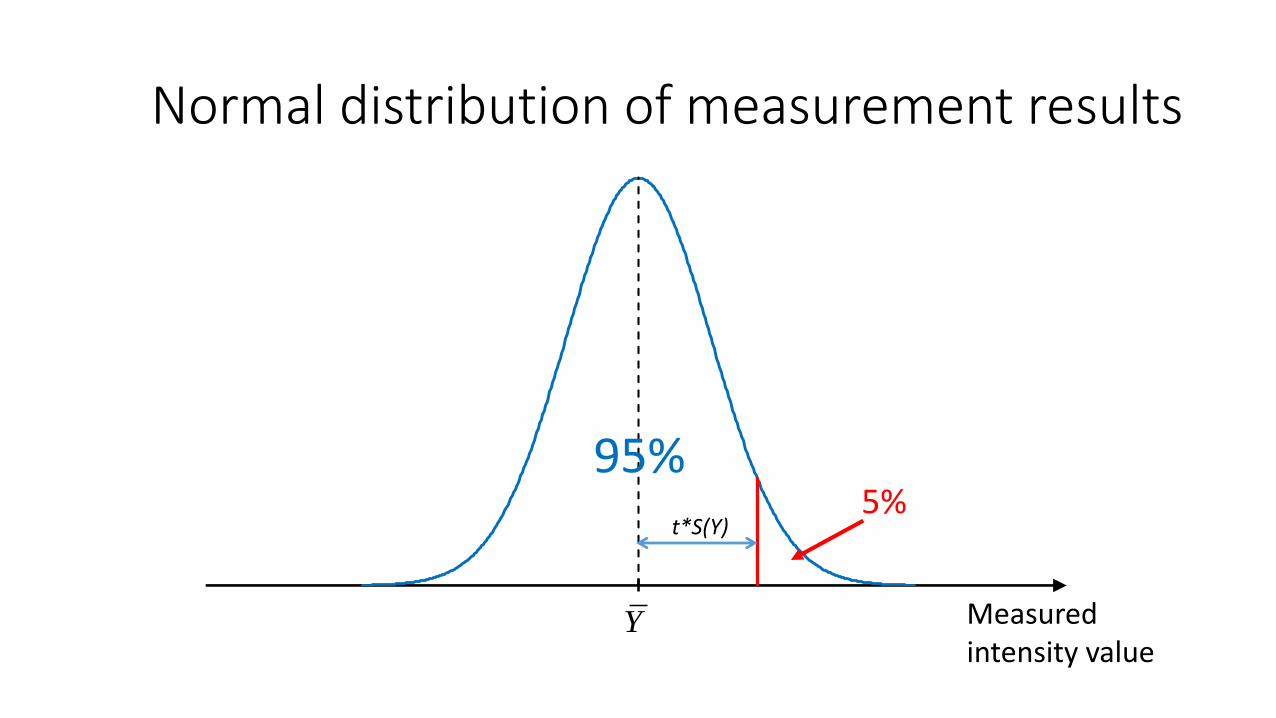
Measured intensity value
t*S(Y)
95%5%
Normal distribution of measurement results
Y
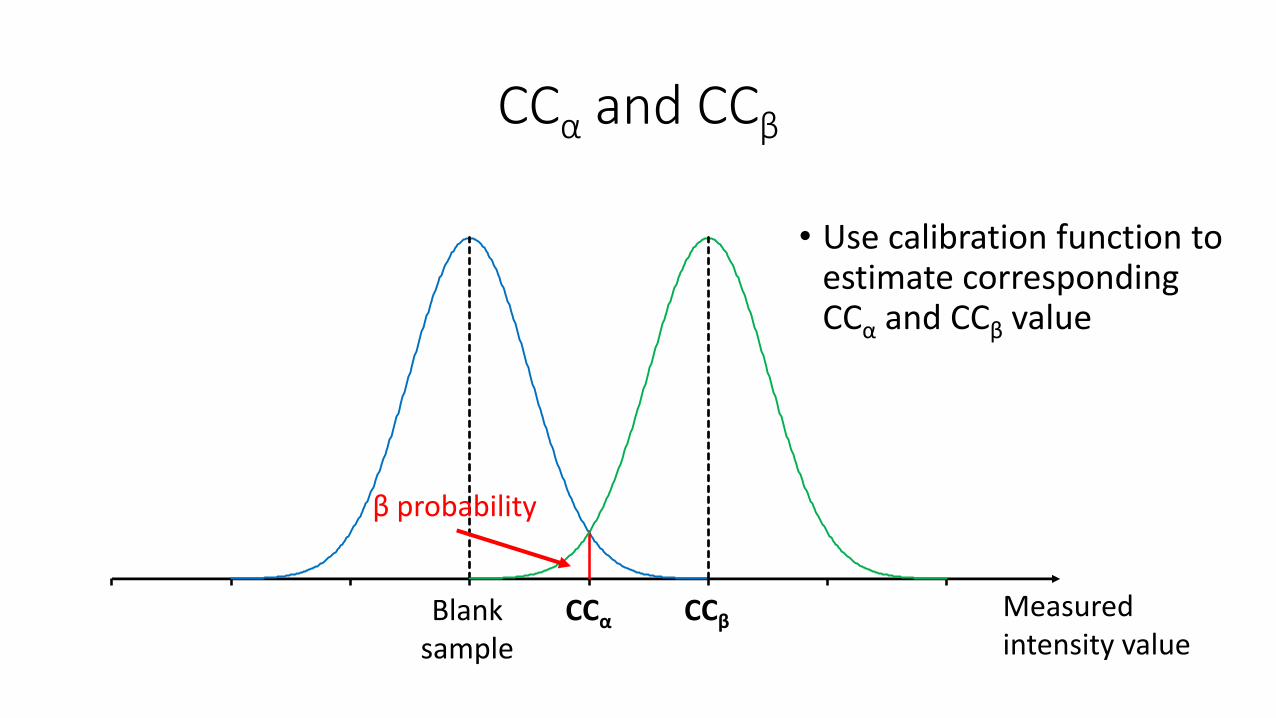
CCα and CCβ
α probability
Blank sample
Measured intensity value
CCα
β probability
CCβ
• Use calibration function to estimate corresponding CCα and CCβ value
Calculating CCα and CCβ
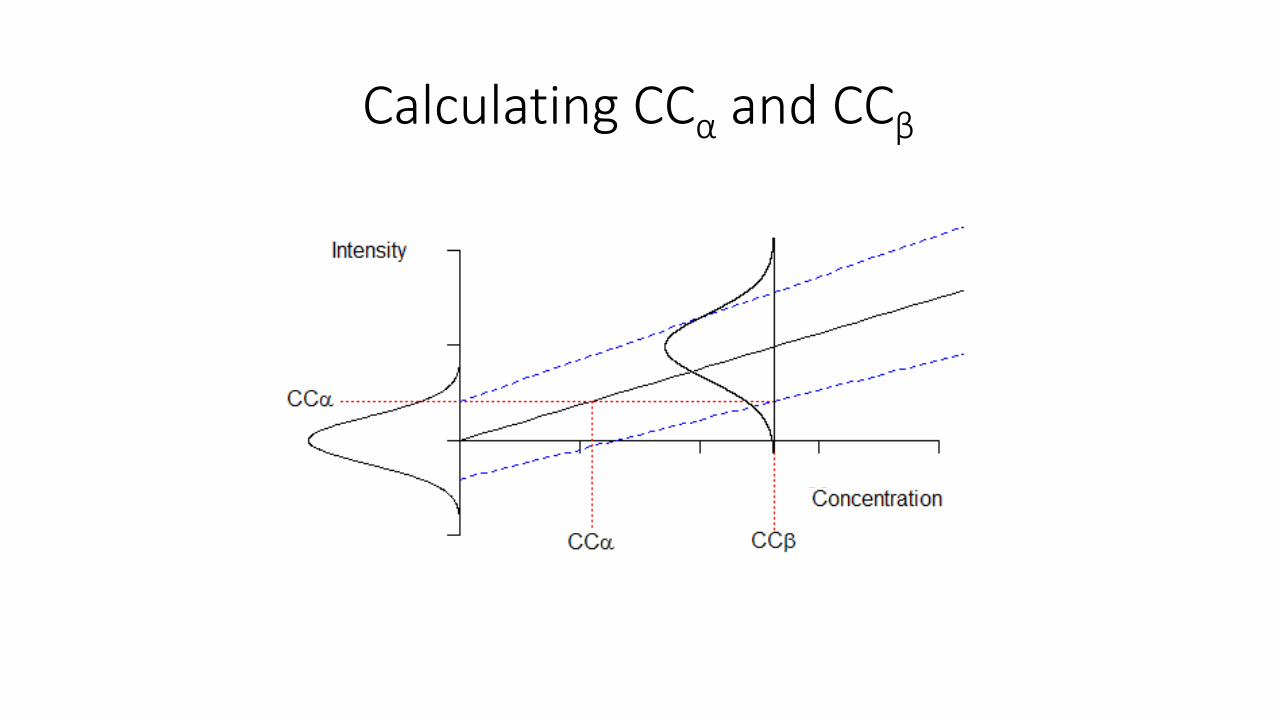
Calculating CCα and CCβ
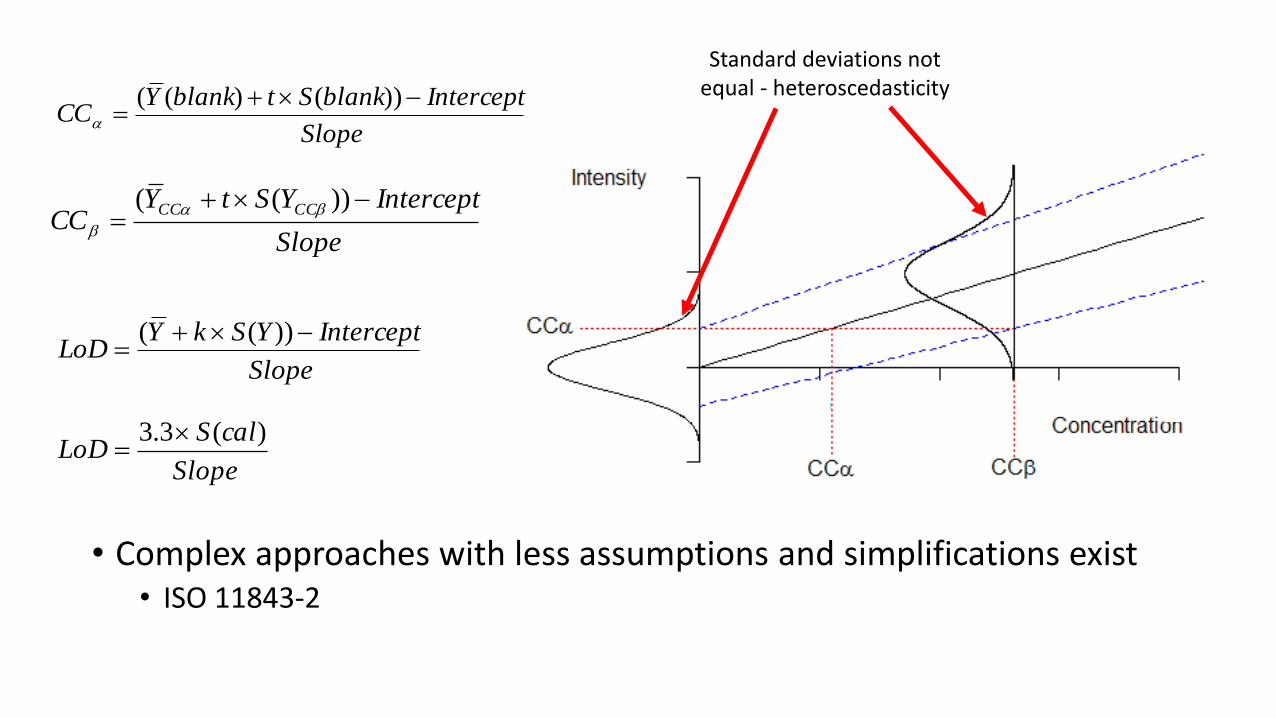
• Complex approaches with less assumptions and simplifications exist• ISO 11843-2
Slope
InterceptblankStblankYCC
))()((
Slope
InterceptYStYCC
CCCC
))((
Standard deviations not equal - heteroscedasticity
Slope
InterceptYSkYLoD
))((
Slope
calSLoD
)(3.3
Interpreting results with CCαand CCβ
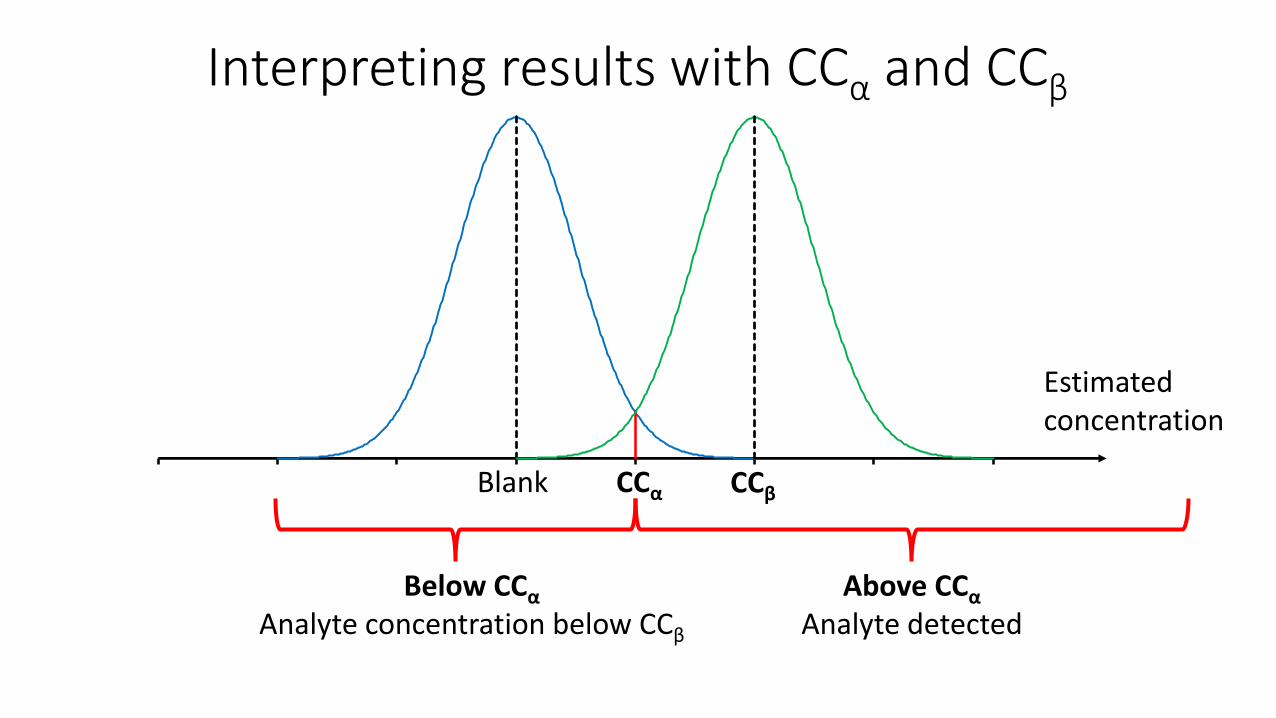
Interpreting results with CCα and CCβ
Blank CCα CCβ
Above CCα
Analyte detectedBelow CCα
Analyte concentration below CCβ
Estimated concentration
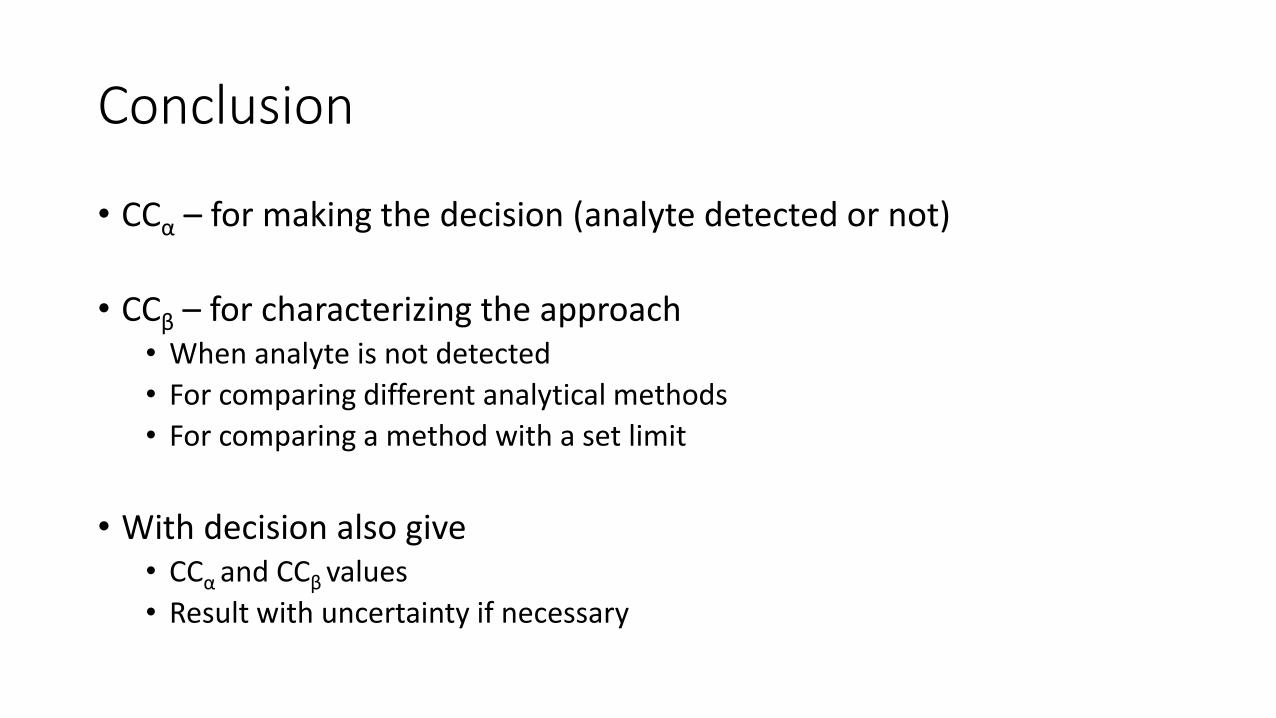
Conclusion
• CCα – for making the decision (analyte detected or not)
• CCβ – for characterizing the approach• When analyte is not detected
• For comparing different analytical methods
• For comparing a method with a set limit
• With decision also give• CCα and CCβ values
• Result with uncertainty if necessary
Important aspects of estimating LoD and CCα, CCβ
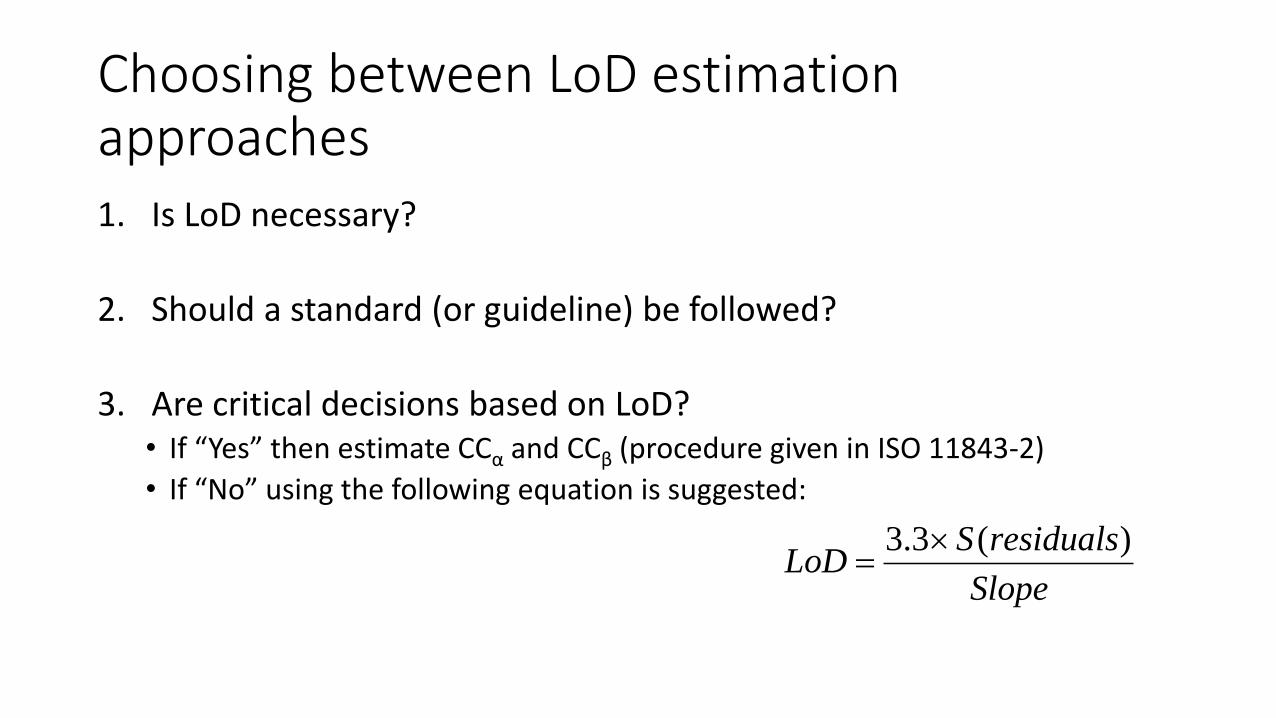
Choosing between LoD estimation approaches1. Is LoD necessary?
2. Should a standard (or guideline) be followed?
3. Are critical decisions based on LoD?• If “Yes” then estimate CCα and CCβ (procedure given in ISO 11843-2)
• If “No” using the following equation is suggested:
Slope
residualsSLoD
)(3.3
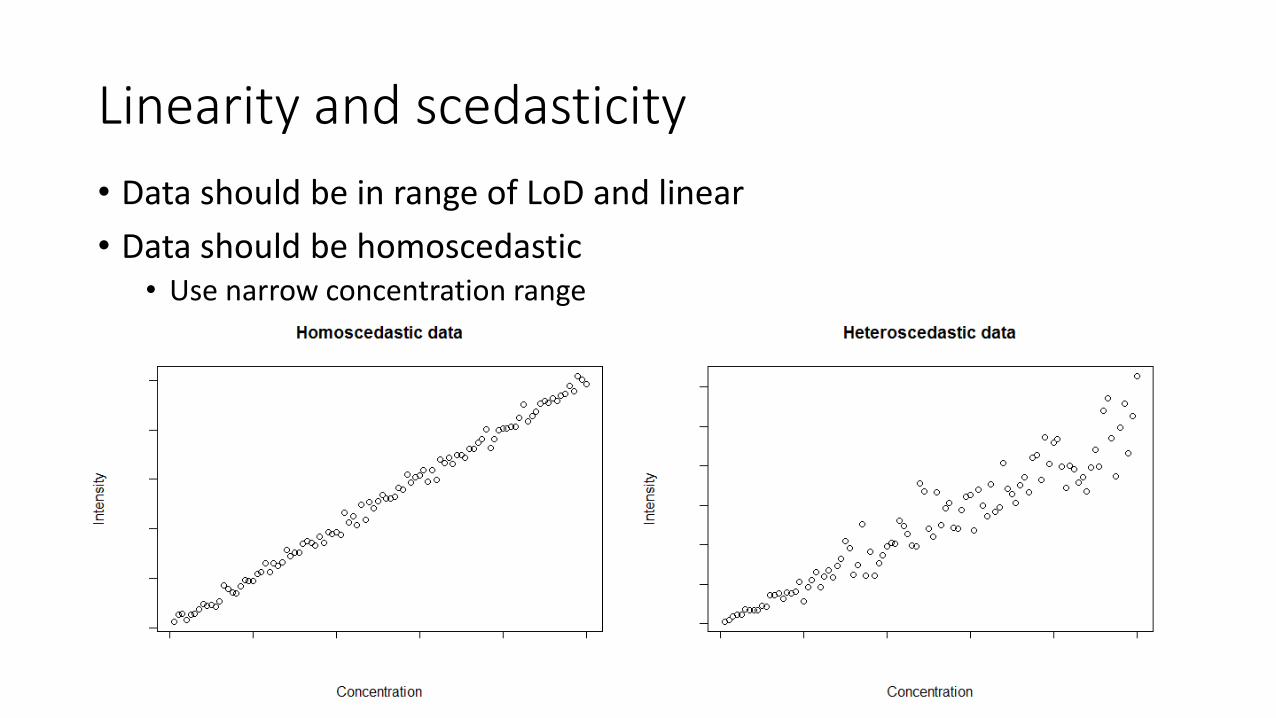
Linearity and scedasticity
• Data should be in range of LoD and linear
• Data should be homoscedastic• Use narrow concentration range
Other important aspects to consider when estimating LoD (CCα and CCβ)• LoD varies between measurement series and days
• Regular reevaluation is recommended
• Not all approaches are appropriate for all analytical methods• Integration of blank samples with LC-MS/MS
• Matrix matching of used samples
Different approaches to estimate LoQ
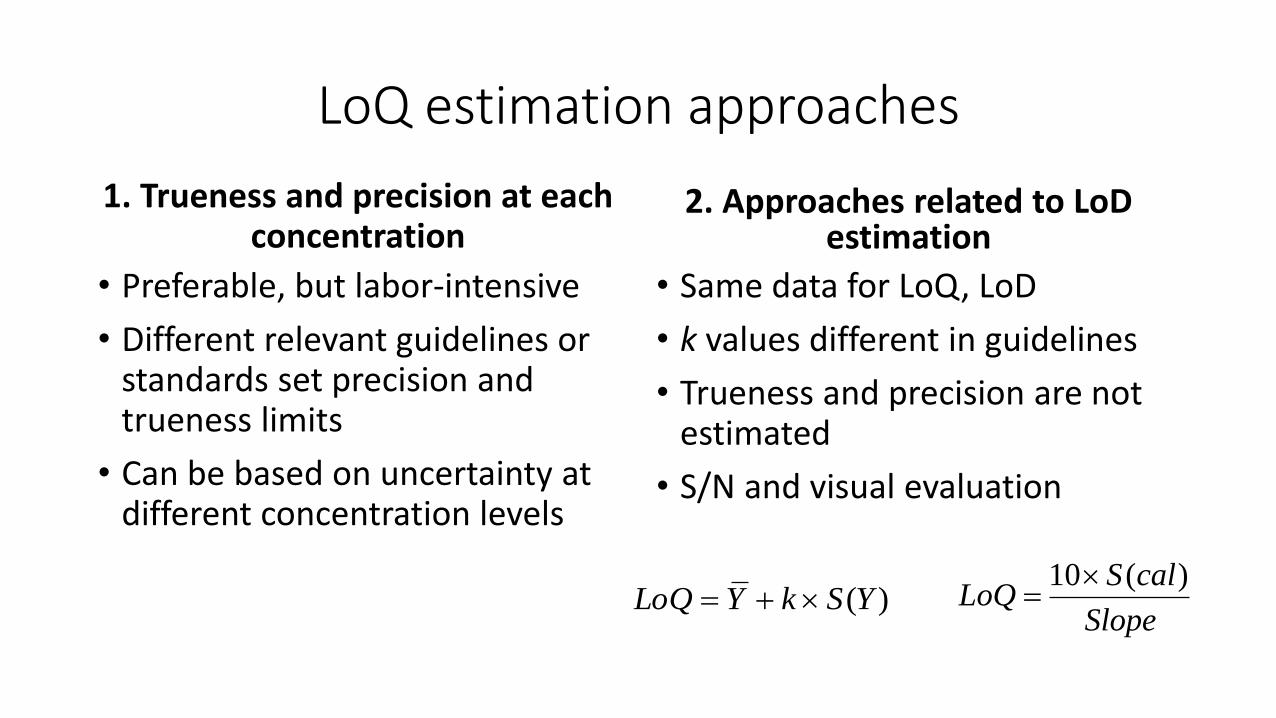
LoQ estimation approaches
1. Trueness and precision at each concentration
• Preferable, but labor-intensive
• Different relevant guidelines or standards set precision and trueness limits
• Can be based on uncertainty at different concentration levels
2. Approaches related to LoDestimation
• Same data for LoQ, LoD
• k values different in guidelines
• Trueness and precision are not estimated
• S/N and visual evaluation
Slope
calSLoQ
)(10)(YSkYLoQ
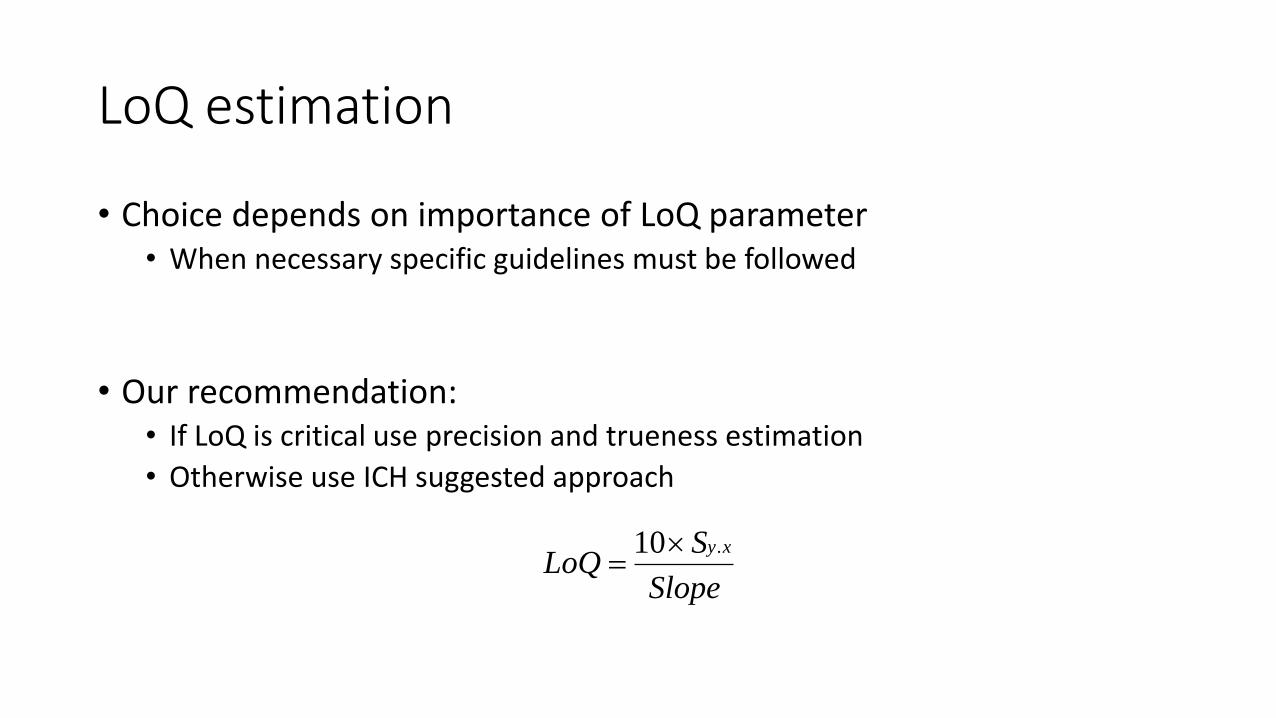
LoQ estimation
• Choice depends on importance of LoQ parameter• When necessary specific guidelines must be followed
• Our recommendation:• If LoQ is critical use precision and trueness estimation
• Otherwise use ICH suggested approach
Slope
SLoQ
xy.10
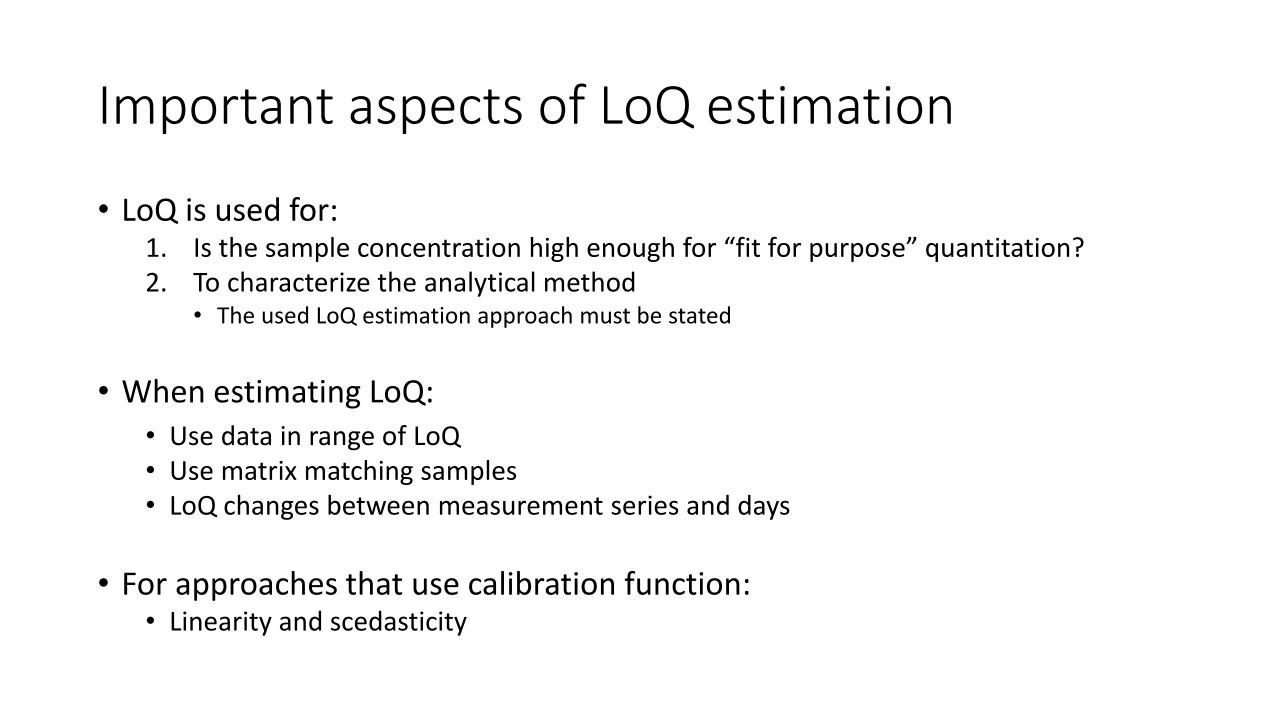
Important aspects of LoQ estimation
• LoQ is used for:1. Is the sample concentration high enough for “fit for purpose” quantitation?2. To characterize the analytical method
• The used LoQ estimation approach must be stated
• When estimating LoQ:• Use data in range of LoQ• Use matrix matching samples• LoQ changes between measurement series and days
• For approaches that use calibration function:• Linearity and scedasticity