Embed Size (px)
Citation preview

PATHOGEN INACTIVATION IN BIOSOLIDS WlTH
LIME AND FLY ASH ADDITION
BY
Chunhe Liu
Submitted in Partial Fulfilment of the Requirements for the Degree of
Master of Science Environmental Engineering
Department of Civil Engineering University of Manitoba

National Library Bibliothbge nationale du Caria
A uisitions and Acquisitions et ~blkgraphic Services seMces bibliographiques
385 WeMngm Street 395, rua Wdlingtori OttawaON K 1 A W 0th- ON K1A ON4 c.ndr canada
The author has granted a non- exclusive licence aliowing the National Library of Canada to reproduce, loan, distribute or se1 copies of this thesis in rnicroform, paper or electronic formats.
The author retains ownership of the copyright in this thesis. Neither the thesis nor substantid extracts from it may be printed or otherwise reproduced without the author's permission.
L'auteur a accordé une licence non exclusive permettant à la Bibliothèque nationale du Canada de reproduire, prêter, distribuer ou vendre des copies de cette thèse sous la forme de microfiche/film, de reproduction sur papier ou sur format électronique.
L'auteur conserve la propriété du droit d'auteur qui protège cette thèse. Ni la thèse ni des exûaiîs substantiels de celle-ci ne doivent être imprimés ou autrement reproduits sans son autorisation.

THF, UNIVERSITY OF MANiTOBA
FACULTY OF GRADUATE STUDIES +**++
COPYRIGHT PERMISSION PAGE
Pathogen Inactivation in Biosolids with Lime and Fly Ath Addition
Chunhe Liu
A ThesislPracticum submitted to the Faculty of Graduate Shidia of The University
of Manitoba in partial fulNlmcnt of the nquirements of the degree
of
Master of Science
CBUNHE LIU O 2000
Permission h n bccn gra teà to the Libnry of The University of Manitoba to lend or seil copier of this thcrillpracticum, to the National Library of Canada to microfilm tus thtalr/prictfcum and to knd or seU toples of the film, and to Dissertidons Abstrict3 International to publish i n abstract of this thesidpmcticum.
The author rescwes other publication rightr, and neither this thcsii/practicum nor exteorive extrictn from it may be printed or otherwise nproduced without the iuthor's written permission.
ABSTRACT
A laboratory study was conducted adding alkali to inactivate pathogens in anaerobically
digested, dewatered biosolids from North End Wastewater Pollution Control Center
(NEWPCC). Fecal coliform bacteria were used as indicator rnicroorganism in this study.
The indigenous fecal coliform density in the samples ranged fron~ 6.6 x 10⁶ to 2.1 x 10'
Colony Forming Unit (CFU)/g total solid (TS).
The results of bench scale work showed that lime addition followed by storing the
biosolids sarnples in airtight containers at room temperature (20-23 OC) was very effective
in inactivation of fecal coliform bacteria: 20gIkg TS (6. lgkg on wet weight basis) could
'reduce fecal colifonn (FC) density below 1000 CFU/g TS in 24 hours. The US.
Enviromental Protection Agency (US EPA) pathogen reduction critenon is FC density
less than 1000 Most Probable Number (MPN)/g TS (US EPA, 1993). When the lime dose
was increased to 30gfkg TS (9.5g/kg on wet weight basis), the inactivation time needed
was 2 hours. No fecal coliform regrowth was found at those doses af3er eight months of
storage.
The effect of fly ash addition on fecal coliform inactivation was also studied. Fly ash dose
required for inactivating fecal coliforms depends on the alkaline component of the fly
ash. The fly ash doses employed in this study wen 40-50 times that of lime.

The laboratory work also showed that expressing the alkali dose, for exarnple, as 20g/kg
TS or 5% on a wet-weight basis, was inconvenient since alkali dose requirement for
pathogen inactivation varies with biosolids composition (mainly, total solid or moisture
content). For example, addition of fly ash at dose of 6OOgkg TS at biosolids TS at 36%
or 1000gkg TS at biosolids TS at 27% TS gave sirnilar pathogen inactivation, that is, a
reduction of fecal colifom density below 1000 CFU/g TS in 18 hours. Similar biosolids
pH was achieved in both cases. It is more convenient to employ pH as the criterion for
pathogen inactivation via alkali addition than using alkali dose to estimate pathogen
inactivation. This study showed that when either lime or fly ash was used, and
independent of the biosolids TS concentration, fecal coliforms were inactivated when the
pH reached 9.5.
As a control, a storage test on biosolids without lime addition was also conducted. It was
îound that fecal colifonn organisms in biosolids were inactivated naturally by storing the
sample in an airtight container at room temperature (20 to 23 O C ) . This natural
inactivation started aftrr 17 to 28 days of storage and FC were not detected after 100 days
of storage. However, FC density in samples stored at -22 O C and 4 OC respectively had
no significant reduction in three months.
For biosolids to be Class A with respect to pathogen density, alkali treatment (approved
by the US EPA in 1993), requires that the pH of biosolids be raised above 12 for 72
hours, and that the temperature be higher than 52 O C for 12 of the 72 hours. To meet this
pH requirement, lime doses of 60 to 70 g k g TS were needed for biosolids containing

from 32 to 27% total solids. It was also found that using quick lime to increase the
temperature of biosolids to 52 OC had a major disadvantage. Treated biosolids with a high
pH of 12.5 will hinder their applicability to agricultural land. A quick lime dose of 170 to
130 g/kg TS was required to raise biosolids temperature from 35 to 52 OC for biosolids
with total solids ranging from 32 to 27%.
Both quick lime and fly ash addition changed the total solids concentration in biosolids.
Adding 1 g of quick lime increased TS in the biosolids by 1.32 g (as hydrated lime). At
.the same time, moisture content in biosolids was reduced by 0.32 g. Adding 1 g of fly ash
simply increased TS by 1 g.
iii

ACKNOWLEDGEMENT
This thesis would not have been accomplished without the support, encourage and help
from many unique individuals. Foremost, 1 would like to acknowledge my wife and my
son who accompanied me to Canada and faced every challenge of new culture.
1 would like to acknowledge the many people at the University of Manitoba,
Environmental Engineering Division for their help and support during the last three years.
These include: Ms. Judy Tingley for her expert lab knowledge and uncamy ability to get
things working; Mr. Grzegorz Bujoczek for his help and work in this study; Ms. Sarah
Wakelin, Ms. Indira Maharaj, Ms. Laura Wytrykush and Ms. Melanie Head for their help
on English and fnendship during the course of my study.
Of particular note, 1 would like to thank the courage, patience, knowledge and wisdom of
Dr. J.A. Oleszckiewicz for accepting and guiding me throughout my course of study.
Special recognition goes to The City of Winnipeg for fbnding provided for this project.


3.2.1.1 Multiple-Tube Fermentation(MTF) ............................. 23
........................................... 3.2.1.2 Membrane Filter (MF) 25
3.2.1.3 Standard Plate Count (SPC) ...................................... 26
................................................... 3.2.1.4 Sarnple Dilution 28
.............................................................. 3.2.2 pH Measurement 29
.................................................. 3.2.3 Temperature Measurement 29
.............................................................. 3.2.4 Total Solids Test 30
................................... 3.2.5 Alkali Addition and Packing Procedure 30
................................................................ Chapter 4 Results and Discussions 32
......................... 4.1 Fecal Coliform (FC) Inactivation in Dewatered Biosolids 32
...................................................... 4.1.1 Long-term Storage Test 33
4.1.2 Effect of Alkalis Addition on Fecd Coliforrns
. . Inactivation .................................................................... 37
4.1.2.1 The Effect o f Lime Addition on Fecal Coliform
. . Inactivation ........................................................ 37
4.1.2.2 The Effect of Fly Ash Addition on Fecal Coliform
. . ......................................................... Inactivation 40
4.1.2.3 The Relation Between Fecal Coliform Inactivation, Alkalis
...................................................... Dose and pH 40
4.1.3 Cornparison of the Results Obtained fiom Two Fecai Coliform Test
...................................................................... Methods -42
................................................... 4.2. pH Change in Dewatered Biosolids 44
............................................. 4.2.1 pH Change with Lime Addition 45
4.2.1.1 Theoretical and Practical pH Limitation ........................ 45
4.2.1.2 Lime Dose Requirement ......................................... 47
4.2.1.3 High pH Duration ................................................. 49
4.2.2 Fly Ash Addition and pH Change ........................................... 5 1
...... 4.2.3 The Impact of Biosolids TS on pH Obtained by Alkali Addition 54
4.3 Biosolids Temperature .................................................................. 57
4.3.1 Heat Capacity of Biosolids .................................................. 57
4.3.2 Lime Dose and Temperature Change ....................................... 59
............. 4.3.3 The Effect of Total Solids Content on Temperature Change 63
4.4 Total Solids Concentration Changes ................................................... 65
Chapter 5 Conclusions ............................................................................. -68
Chapter 6 Suggestions for Future Study .......................................................... 71
Chapter 7 Engineering Significance .............................................................. 72
........................................................................................... References. 73 0
Appendix A ..... Experimental Data
Appendix B ..... Abbreviations
vii

LIST OF FIGURES
Figure 2-1 Process for PSRP sludge ............................................................. 11 - Figure 3-1 Flow chart of the test of biosolids alkaline treatment ............................ 22
Figure 4-1 Reduction of fecal coliform bacteria during anaerobic storage of dewatered biosolids ........................................................................................ 34
Figure 4-2 Fecal coliform density change during biosolids stored at three different temperatures .................................................................................... 36
Figure 4-3 Fecal coliforrns density dropped to close to detection limit with lime dose of 20gfkg TS in six days ......................................................................... 38
Figure 4-4 Fecal coliforms density dropped to below detection limit with lime dose of 3 0 g k g TS in two houn ..................................................................... $39
'Figure 4-5 The change of fecal coliform density and pH of biosolids with different fly ash doses ............................................................................................. 41
Figure 4-6 Fecal colifon density obtained with MTF and SPC methods ................. A2
Figure 4-7 lncrease of pH versus lime dose ..................................................... 46
Figure 4-8 Biosolids pH versus lime dose ....................................................... 48
Figure 4-9 pH change in 83 days after lime addition .......................................... 50
Figure 4-10 pH change vs . fly ash dose ........................................................ -52
Figure 4-1 1 pH increase obtained by lime or fly ash addition ................................ 53
'Figure 4-12 Increase in pH versus time after addition of lime. fly ash or mixture of lime and fly ash ....................................................................................... 55
Figure 4-13 The influcnce of biosolids TS on the pH obtained with fly ash addition ..... 56
Figure 4-14 The effect of lime dose on temperature increase versus time .................. 58
Figure 4- 1 5 Measured linear relation between lime dose vs . biosolids temperature increase .......................................................................................... 60
Figure 4-16 Temperature increase with lime dose 135glkg on wet weight basis in biosolids with different initial TS ........................................................... -62
viii

Figure 4-17 TS change with lime addition. .. . . . . . . . . . . . . .. . . . . . . . . . . .. . . .. . . . . . . . . . . . . . . . .. ..... 64
Figure 4-1 8 The influence of initial TS of biosolids on the TS after fly ash addition.. . ... 66

Chapter 1
INTRODUCTION AND OBJECTIVES
Biosolids are a semi-solid end product of wastewater purification (Kiely, 1997). Disposa1
of this portion of waste is diffkult. Traditionally, most coastal cities, New York and
Sydney for exarnple, have taken the ocean as their route for sludge disposa1 routes.
However. after the Helsinki Agreement was signed, which called for elimination of
sludge ocean dumping by 1998, the ocean is no longer available for solid waste disposal.
For most inland communities, landfill was the cornmon destination of biosolids.
Gradually, however, the
quality of biosolids prioi
amendment,
wastewater treatment industry is being forced to improve the
to landfill and to produce biosolids that may be used as a soi1
Biosolids from municipal wastewater treatment plants often contain human and animal
pathogens. After the US Congress passed the Clean Water Act of 1977, the US
Environmental Protection Agency (US EPA) published the final rule for "Standards for
the Use and Disposal of Sewage Sludge" - the designation: 40 CFR 503 (US EPA, 1993).
The final rule contains specific pathogen reduction criteria for biosolids before they can
be applied on agricultural land, forest, public contact site, reclarnation site, or given away
.for home garden or lawn use. Biosolids are designated as Class A when such use is
allowed without any restrictions. Criteria for Class A biosolids includc density of fecal
coliform bacteria of less than 1000 most probable nurnber (MPN) per gram of total solids
(dry basis) or density of Salmonella spp. bacteria of less than 3 MPN per 4 g of total
solids. For Class B biosolids fecal coliform density can not exceed 2,000,000 MPN/g TS

(US EPA, 1993). Furthemore, the requirements of one of the following alternatives must
be met:
1. The biosolids must meet Process to Significantly Reduce Pathogens (PSRP) or
Process to Further Reduce Pathogens (PFRP) equivalency requirements.
2. An increase in biosolids temperature should be maintained for a prescribed
period of time. The equotion for detemining exposure times ruid temperatures
for achieving Class A pathogen control in dewatered biosolids with solids greater
than or equal to 7%:
1.317 x 10' D = t 2 50 OC, time 2 20 minutes (1 - 1) 10 0.14
where D is time in days and t is temperature in OC.
3. The pH of the biosolids is raised to greater than 12 for at least 72 hours, during
which time, the temperature of the biosolids should be greater than 52OC for at
least 12 hours. In addition, after the 72 hour period, the biosolids are to be air
dried to at least 50 percent total solids. This process is an alternative for chernical
stabilization.
4. The biosolids are analyzed for the presence of viruses (Plaque-forming units) and
viable helminth ova. The biosolids can be analyzed before or after the pathogen
~duct ion process. However, analyzing for vinises before pathogen reduction
requires that the operating parameters for the pathogen reduction process be
monitored. The biosolids must meet both of the following criteria to be regarded
as Class A:

The density of viruses at the time of use or disposal must be less than 1 Plaque-
forming units (PFU) per 4 gram of total solids.
The density of viable helminth ova at the time of use or disposa1 must be less than
1 per 4 gram of total solids.
The 49 CFR Part 503 regulations, for the first tirne, imposed limits on the densities of
pathogens in biosolids beneficially reused tluough land application. Dahab et al. (1998)
believe these nature based standards will eventually replace previous regulations, PSRPs
and PFRPs, which are technology based and have govemed land application of biosolids
in US since 1979. Presently, some of criteria in Part 503, such as fecal coliforms and . volatile solids reduction limits, were not based on scientific evaluation nor Rsk
assessment. Instead, the stabilization criteRa were developed based on what the
experienced wastewater treatment professionals believe are achievable by well designed
and operated mesophilic anaerobic and aerobic processes and other alternative processes
(Ho, 1997). That means there is a lot of work to do in the field of biosolids stabilization.
This study describes preliminary project work on pathogen inactivation in City of
Winnipeg biosolids. Presently, the City recycles 44,000 wet tons of biosolids per year on
land year around. Although very successful, the biosolids recycling prograrn (WinGro)
prograrn faces potential problems: expected regulatory changes in winter disposal,
biosolids quality and possibly limitations due to factors such as odour or public health
perception (Oleszkiewicz, 1999). The purpose of the research project was to look at a
low-cost alternative of the Winnipeg biosolids to Class A by meeting the following

criteria: pathogen reduction, further odour decrease, increased TS concentration, and
improved resistance to shear stress.
The objectives of this study were to investigate the effects of lime and fly ash addition on
pathogen inactivation. In particular, this investigation examined the changes in pH,
temperature and total solids concentration in biosolids and the relation between these
changes and pathogen inactivation. A bacterial group of pathogen indicator - fecal
coliforms was tested in this study. Also, this study did some work on the effects of
storage and freeze-thaw on pathogen inactivation.
In the preliminary study, which is the subject of this thesis, pH, total solids (TS),
temperature and fecal coliform population tests were conducted and analyzed in relation
to the variable doses of lime and . required to inactivate pathogens
scale in several municipalities.
By ash. The objective was to demonstrate that lime dose
was much less than that used commercially on a large
It was hypotherized that maintaining the dewatered
biosolids under airtight condition will maintain the pH and temperature at levels leading
to a PFRP product.
As a preliminary sîudy, laboratory experiments examined the effects of lime and fly ash
addition on pathogen inactivation. This study examined the relationship between several
. cnteria @H, temperature and TS) and alkaline agents (lime and fly ash) dose and the
minimum dose of alkaline agents required for inactivating fecal coliforms. As a control,
the inactivation rate of fecal coliforms during anaerobic storage without alkalis was also
investigated.

PATHOGEN DISINFECTION TECHNOLOCY
2.1 Brief Review of Disinfection Technologies
A pathogen is defined as a disease-causing organism. Table 2-1 lists some of the
important human pathogens known to be present in sewage and biosolids.
.Table 2-1 Important Types of Pathogens in Sewage and Biosolids and the Clinical Conditions They Can Cause in Human (Ho, 1997).
Main Classes Genus or Subgroup Species Clinical Conditions Produced of Pathogens or Types Bacteria Cam py lobacte 8+ Gastroenteritis
~~o t r id ium 3+ Gangrene, tetanus, food-poisoning Leptospira interrogant 3+ ~ i v e r & kidney infection
- .
Pseudononas 7+ Skin and wound infections, urinary
Satmonella Sheigella Vibrio Y ersinia
tract infections IO+ Typhoid, paratyphoid, gastroenteritis 4 D ysentery 3+ Cholera, gastroenterit is 2+ Gastroenteritis
Other bacteria (Escherichia, Gastroenteritis, urinary tract infections, Klebsielia, Proteus, etc) pneumonia, etc.
Viruses Adenoviruses 42+ Gastroenteritis, eye infections, respiratory infections
Caliciviruses including the 6+ Gastroenteritis Nonvalk agent Enterovinrses including 601 Gastroenteritis, colds, summer rash, coxasckie and echovhses cye infections, meningitis, etc. Hepatitis viruscs A, B & E 3+ Liver infections ~otaviruses 3+ Gastroenteritis
Protozoa Giardia lamblia Gastroenteritis Crytosporidium parvum Gastrocntcritis T O ~ O ~ ~ M O gondii Congenital malformations ~ n t h o e b a h&olytica ~ m e b i c dyaentery
Helminths Ancylostoma duodenale Anemia (hookwonn) Ascaris lumbricoides Ascariasis (roundworm) Taenia saginata (tapcworm) Toxocara (roundw orm) Trichuris (whipworm)
Taen iasis Abdominal pain Diarrhea, abdominal
Strongy loides (thrcadworm) Diarhca, abdominal pain Fungi Candida albicans Gasbantcritis cyc infections, vaginitis
Cneurnonia neofonnans pneumonia, mcningitis

to the reduction of pathogens to densities below the infective dose.
are commonly employed to achieve biosolids disinfection. These
Disinfection refers
Several processes 4
processes fa11 into three categories: biological processing, physical processing and
chemical processing.
2.1.1 Biological Processes
Digestion (aerobidanaerobic) and composting fa11 in this cûtegory. Digestion usually
refers to treatment of slurry biosolids (e.g. TS of 10%). Composting refers to dewatered
biosolids (e.g. TS of 30%). Both digestion and composting may be carried out in aerobic
or anaerobic conditions (Oleszkiewicz, Poggi, 1997). Here composting is taken as an . example to elucidate the mechanism of biological processes.
Composting is the biological decomposition and stabilization of organic substrate. under
conditions that allow developmeni of thermophilic temperatures as a result of
biologicaily produced heat to produce a final product that is stable, free of pathogens and
plant seeds, and can be beneficially applied to land (Haug 1993). The above definition
indicates the two major objectives that may be achieved by composting operation:
. stabilization of organic materials and destruction of pathogens. The simplified
biochemical reaction which takes place in aerobic composting (2-1) and anaerobic
composting (2-2) processes are:
brctcria
Organic matter + O2 + nutrients + new cells + CO2 + H20 + NH3 + heat +. . . (2- 1)
bacleria Organic matter + HzO + nutrients + new cells + CO2 + CH4 + NH3 + H2S + heat (2-2)

The pathogen destruction in cornposting may bc the result of toxic products (e.g.
ammonia and hydrogen sulfide) release, cornpetition with non-pathogenic organisms,
depletion of nutrients and high temperature attained, etc. (Finistei et al. 1987, Pereira-
Neto et al. 1987). *
US EPA (1993) lists composting in both PSRP and PFRP processes. To obtain a Class B
product, the temperature requirement is that biosolids be raised to 40°C or higher for five
days. For 4 houn during the five days, the temperature in the compost pile exceeds 55°C.
To meet Class A criteria, the biosolids temperature must be maintained at 55OC or higher
for three days (with-in vesse1 or static aerated pile) or for fifteen days (windrow).
-2.1.2 Physicûl Processes
Temperature and desiccation belong to this category. High temperature is the main
approach used in biosolids disinfection. As a matter of fact, five of seven PFRPs listed in
40 CFR Part 503 are related to high temperature. The mechanism of temperature
disinfection is by denaturing of the pathogen's cellular DNA.
Heat drying is application of both temperature and desiccation. In the heat drying
process, biosolids are drkd by direct or indirect contact with hot gases to reduce the
-moisture content of the biosolids to 10 percent or lower. Either the temperature of the
biosolids particles exceeds 80°C or the wet bulb temperature of the gas in contact with
the biosolids as it leaves the dryer exceeds 80°C. Reimers et al. (1998) reported that

- drying beds in the Southern United States have been found to inactivate pathogens at
moisture contents greater than 50%.
Irradiation (beta or gamma ray), pulse power, cavitation, electrostatics and applied-fields
are noted as other techniques in the literature on biosolids disinfection (Reimers 1997).
2.1.3 Chemical Processes
This category includes al1 disinfection methods implemented by adding chernical agents
into biosolids. Chemical agents include alkalis, acids, oxidants and other various
disinfectants. Table 2-2 lists the chemicals utilized in various disinfection processes.
Table 2-2 Chemical agents utilized in disinfection processes Alkaline Agents Acids Oxidants Disinfectants Lime SuIfhic Acid Ozone Ammonia Cernent Kiln Dust Phosphoric Acid Peroxide Nitrous Acid Portland Cernent Nitric Acid Chlorine Organic Acids Alkaline Fly Ash Amines Silicates Red Mud (Spent Bauxite) Adoptcd from Rcimcn et al. (1997) . Of al1 chemicals used, lime is the most common and has a long history of utilization in
disinfection. The mechMsrn of lime disinfection will be discussed separately in the
following section.
In a survey of biosolids stabilization technologies in southem Florida, lime pasteurization
and thermal drying emerged as the top ranked methods (Foess et al., 1994). The lime
stabilization system achieved its high ranking through low capital costs and favourable
* ratings for process reliability, flexibility, and operability.

2.2 Alkaline Disinfection
2.2.1 Current biosolids lime treatment 0
Lime stabilization has been utilized in wastewater treatment since the 1890s (WEF,
1998). Dry lime or post-lime (following dewatering step) stabilization at wastewater
trestment plants has been practised since the 1960s (Stone et al.. 1992).
The purpose of biosolids stabilization is twofold: to substantiall y reduce the number and
prevent regrowth of pathogenic organisms; and to substantially reduce the number of
odor-producing organisms (Lue-Hing et al. 1998). This paper will focus on pathogen
- inactivation by lime stabilization.
Lime is widely used in the wastewater industry. According to a survey conducted by US
EPA in 1988, more than 250 municipal wastewater treatment plants (WWTP) employed
lime to stabilize their biosolids (US EPA, 1989).
Christy (1990) reported lime addition to dewatered biosolids as a Process to Significantly
Reduce Pathogens (PSRP). Two full-scale process systems were discussed in his
- literature (Figure 2-1). In these systems, quicklime doses of 250 to 2000 @cg TS were
employed to treat biosolids with total solids (TS) mund 20%. These lime doses are
equivalent to 50 to 400 g/kg on a wet weight basis.

0
SY STEM A
Lime Dewatered Sludge
Screw Conveyor/Mixer
Heat Heat Heat Truck
Dewatered Sludge I
Screw A A
L !me
Conveyor/Mixcr
l- Mixer
v Heat v
Heat
I Et E t
SYSTEM B
Figure 2-1 Process for PSRP sludge
Hcat was supplicd to accelcrate the rcaction bctwecn lime and sludge. Some lime-sludge mixtures exhibit a
rate of reaction doubling for every 10 O C temperature raise. (Christ)', 1990)

Lue-Hing et al., (1998) believe lime doses of 13 to 40% as Ca(OH)2 are required for
producing Class B biosolids. These calcium hydroxide doses are equivalent to those of
quicklime (Cao) of 100 to 300 g/kg TS. They are much less than aforementioned doses.
The theoretical lime dose for obtaining Class A biosolids ranges from 3 10 to 280 g k g on
a wet weight basis for the biosolids with TS from 20% to 30% (1550 to 933 g k g TS).
Temperature requirement (70°C) is the main concern in the calculation of these doses.
However, temperature is not the only factor contributing to pathogen inactivation (see
3.2.3). Taking into account the pH increase, free ammonia concentration increase that is
caused by high pH value and other pathogen inactivation factors, the actual lime dose
required to achieve Class A biosolids requirements will much less than the theoretical
value.
Actual lime dose needed usually relies on a number of factors. The factors include: the
composition of biosolids, such as physical composition - solids and moisture ratio that . is usually expressed in total solids (TS) and chernical composition of both solids and
liquid. Some substances in biosolids may consume lime significantly. The following
simplified equations provide examples (WEF, 1999):
Bicarbonate: ca2+ + 2 HCOi cr CaCOl + H 2 0 + CO2 (2-3)
Phosphate: 2 ~ 0 : - + 6 FI'+ + 3 Ca0 .-. Ca3(PO&+ 3 HzO (2-4)
Carbon dioxide: CO2 + Ca0 - CaCOl (2-5)
Organic acid RCOOH + Ca0 - RCOOHCaOH (2-6)
Fats: "Fat" + Ca0 Ca0 fatty acids (2-7)
Since composition of biosolids is different fiom plant to plant, the lime dose needed to
meet a certain requirement must be determined by testing. One of the objectives of this
study was to find the lime dosage required for biosolids from North End Wastewater
Pollution Control Center (NEWPCC) to meet Class A standards.
2.2.2 Other alkaline agents
Besides lime, other alkalis are utilized in biosolids treatment. These alkaline agents
include: cernent kiln dust (CKD), lime kiln dust (LKD), portland cernent or fly ash.
In 1992, Bumham et ai. (1992) reported that the treatment of municipal wastewater
sludge cakes with 35% CKD or LKD alone, or with a small amount of quicklime (Cao).
would reduce the pathogenic microbial population in the sludge to below the USEPA's
Process to Further Reduce Pathogens (PFRP) standard. They tested biosolids fiom over
twenty cities and al1 of them achieved the PFRP criteria. The process is known as the N-
Viro process. The main characteristics of N-Viro processed biosolids are: pH of 12,
temperature of 52 to 62OC, moisture less than or solid greater than 50% and pathogen fiee 0
(Bufnham, 1998).
Oerke and Rogowski (1990) and Reimers et al. (1980) reported that the addition of
povolanic materials to dewatered biosolids could cause cementitious reactions. The final
products, after drying, are soil-like material of approximately 35 to 50% solid content.

However, the equivalency of the products to Class A or PFRP has not yet been proven
(WEA, 1999).
A case for using fly ash (FA) for biosolids treatment was reported by Byen and Jensen
(1990). In this process, By ash and biosolids cake were mixed at ratios of 2.0:l to 2 . 5 1 .
'The product achieved Class B requirements. Little information is available about fly ash
dose for biosolids disinfection. Fly rish composition (alkaline content) mainly detemines
the dose requirement. Fly ash is the residue from coal-fired thermal power plants.
Introducing FA into biosolids treatment provides an end-use for fly ash. Furtherrnore,
using FA could alter the physical propenies of biosolids - making it easy to dry and soi1
like (see 4.4). FA addition, on the other hand, may significantly increase the mass of
treated biosolids. Large FA doses may increase the costs of transportation for supply of
the FA and for disposa1 of the end product (WEF, 1995). However. this is not the real *
concem. A potential problem is that FA contains a variety of toxic elements which, under
certain conditions, can leach out and contaminate soils, surface waters and groundwater
resources (Egmen and Yurieri, 1998). Therefore, the possible environmental impacts
associated with fly ash application rnust be assessed.
2.2.3 Pathogen inactivation factors of alkali addition
Pathogen reduction aicurs when alkali is added to biosolids. No matter what alkali is
utilized, the theory behind the process of reducing pathogens is the same. To simpliQ the 9
discussion, only quicklime addition is discussed here.

The chernical reaction that occurs in the lime hydration is similar to that which takes
place in lime-biosolids reaction. The hydration reaction is expressed as:
Ca0 + H20 - Ca(OH)I + 65.2 KJ (2-8)
This is an exothermic reaction. Metcalf & Eddy (1991) believe that the heat produced in
the above reaction cm raise the temperature of the mixture above 50°C, sufficient to
inactivate helminth eggs. Calcium hydroxide, the product o f reaction 2-8, dissolves in
water and raises the pH of the mixture. 0
Ca(OHh - ca2+ + 2 OH' (2-9)
Reaction 2-9 suggests that both quick lime (Cao) and hydrated lime Ca(OH)2 may raise
the pH in biosolids. although only quick lime will raise the temperature. The practical
reactions that take place in biosolids after lime addition are more complex than those in
pure water. However, the factors that affect pathogen inactivation associated with lime
addition are fairly simple. These factors include high temperature and high pH
accompanied by high NH3(q1 concentration. 0
HighpH
pH is defined as the negative logarithrn of hydrogen ion concentration. The pH scale
extends fiom pH 0.0 (1M H') to pH 14.0 ( 1 . 0 ~ 1 ~ ' ~ M H*). Each pH unit represents a
tenfold change in hydrogen ion concentration. pH affects microbid growth dnunatically
because the rates of chernical reactions involved in biochernical process are ofien very
sensitive to the hydronium ion (~$33 concentration of the medium. In fact, the concept
-of pH itself was denved fiom a microbiological profess during beer brewing. Each

bacterial species has a
their growth optimum .
definite pH growth range. Most bacteria are neutrophiles that is
occurs between pH 5.5 and 8.0. Although microorganisms will
ofien grow over wide ranges of pH, there are limits to their tolerance. The disinfecting
mechanisrn of high pH includes three factors:
a. High pH may alter the ionization of nutrient molecules and thus reduce
the nutrients availability to the organism.
b. High pH can disrupt the pathogen's plasma membrane.
c. High pH inhibits the activity of enzymes and membrane transport
proteins.
0
Gould (1969) reported the sporicidal (kills spores) effect of high pH and also noted that
the sporicidal efficiency of hydroxide ions (OH-) was affected by temperature (Prescott
Reimers et al. (1997) found that the effect on pathogen inactivation of lime addition was
not only because of the hydroxide ions but also because of silicate components in lime.
This conclusion was derived fiom studies by comparing pathogen inactivation effects of
sodium hydroxide and calcium hydroxide.
High Temperature
Environmental temperature profoundly affects microorganisms. Microorganisms are
particularly susceptible because they are usually unicellular and also poikilothermic -
their temperature varies with that of the extemal environment. For these reasons,

microbial ce11 temperature directly reflects that of the cell's surroundings. In general, in a
certain range of temperature, the growth rate of microorganisms increases as the
temperature increases. Beyond a certain point M e r temperature increases may slow
d o m the growth, and sufficiently high temperatures are lethal to microorganisms.
Almost al1 human pathogens are mesophiles which have growth optima near 35OC and an - upper limit of about 45'C. High temperatures damage pathogens by denaturing enzymes,
transport carriers, and other proteins. Microbial membranes are also disrupted by heat;
the lipid bilayer simply melts apart (Prescott, 1996).
Generally speaking, the efficiency of thermal inactivation is time-dependent. Table 2-3
shows the tolerance of some common pathogens to temperature and time.
Table 2 - 3 Temperature and Time Required for Pathogen Destruction (Gotaas 1956) Destruction Temperature and Time
Or~anisms Tcmpcratuic ("C) Time (minute) Tcmpcraiurc Tirne (minute) - Salmonella typhosa 55 -60 30 60 20 Salmonella sp. 55 60 60 15 -20 Shigella sp. 55 60 Entamoeba histolytica cysts 45 few 55 few second Taenia 55 few Trichinella piralis l a m e 55 quickl y 60 few second Brucella abortis 62.5 3 55 60 Micrococcus pyogenes 50 10 Streptococcus pyogenes 54 10 Mycobacterium tuberculosis 66 15 - 20 67 Few Corynebacterim diphther iae 5 5 45 Necator americanus 45 50 Ascaris lumbricoides eggs 50 60 Escherichia coli 55 60 60 15 - 20

Ammonia
As one of the bio-activity products, ammonia is present in the biosolids solution.
Ammonia exists in biosolids in forms of either ammonium ion (NHd*) or ammonia
WHi). Relative concentrations of both forms are interrelated with the pH in biosolids
solution as indicated by Equation (2-1 0):
N ~ L + + OH- * NHs + H20 Ammonium ion Frcc Ammonia
Both ammonium ions and free ammonia interfere with the activity of bacteria, but the
latter is more toxic. Ammonia has the capacity to diffuse through the membrane, whrre it
draws off some of the cell's protons (H') to create the sarne son of equilibrium condition
with ammonium on the inside of the cell. This upsets the intemal pH balance, however,
and the ce11 draws in protons from the outside to maintain its acidity. This builds up a
positive charge, which the ce11 counteracts by releasing potassium (K') to maintain its
intemal charge balance. In sacrificing the potassium, however, the cell dies (Sprott,

Chapter 3
EXPERIMENTAL MATERIALS AND METHODS
3.1 Aparatus and Materials
3.1.1 Apparatus
3.1 -2 Materials
3.1 -2.1 Biosolids
Throughout the study, biosolids samples were collected from the North End Water 0
Pollution Control Center (NEWPCC), Winnipeg, Manitoba. Al1 samples were taken from
a tap on the transfer line from the centnfùge to the hopper. The samples were collected
fiom whichever centrifuge was running at the time of sampling. The sample was
anaerobic, two-stage HTR mesophilic digested, mechanicdly dewatered biosolids with a
Table 3-1 Apparatus used in this study Apparatus
Autoclaves
Balance AJ 1 O0 Baiance N6000 Commercial blender Hobart mixer Mume fùmace ' Oven Petri dishes with loose fitting lids Plastic cups with tight covers Plastic containers with tight covers
pH meter
Functions Glass wares sterilization. Petri dishes with fecal coliform cultures steriliation (before discarded). FC agar and chernicals weighing. Biosolids sarnples weighing. 10" sarnple dilution Preparation Biosolids sample and alkalis mixing. Volatile solids test Total solids test Fecal colifomis seeding Reactor for fecal coliform storage, alkali addition test Controlling reactor of above test, Temperature test. pH test for FC agar, biosolids sample.
pH range of 7.1-7.8, temperature of 35-36 OC , total solids (TS) of 25% - 36%, and fecal
coliform (FC) population of 6.6 x 10⁶ to 2.1 x 10' /g TS.
The biosolids sarnples used in this study were collected in 2OL plastic containers. Al1 the
containers were completely filled and covered. Once collected, the samples were
transported to the University of Manitoba and storcd in a cooling chamber at d°C. .
3.1.2.2 Alkaline Reagents
Laboratory grade quicklirne (Cao) used in this study was purchased from Fisher packed
in a 3kg glass bottle. Commercial grade quicklime was providcd by Mississippi Lime
Company sealed in 501b brown paper beg. Both laboratory grade and commercial grade
quicklime were pulverized (very fine).
Fly ash (FA) was supplied by Manitoba Hydro from its Brandon Generation Station. The
fly ash used in this study was dry, fine, with colors of grey or yellow brown. The pH of
the FA solution (2g FA in 20rnL deionized water) was about 11 -30 when measured ten
minutes afier the solution had been prepared.
3.2 Ex~erimental Methods
In the first phase of this study, fiom Febmary to May of 1999, the biosolids samples were
packed and sealed in 6 plastic containers to observe natural pathogen inactivation by
anaerobic storage at room temperature, 20-23 OC. In the following 10 months, samples
were collected fiom the containers at certain intervals and andysed for fecal coliform

density. At the same time, raw biosolids and biosolids with lime were tested for pH,
' temperature, and fecal coliform to establish suitable methods for further study.
The second phase started in May 1999. In this phase, the effect of varying doses of lime
or fly ash addition on fecal coliform inactivation was studied. The lime doses employed
were 20, 30, 60, 120, 180, 240, and 480 gram per kilogram of hisolids (dry weight)
respectively, and fly ash doses were 25, 50,300,600,900, 1200, 1500 and 1800 gram per
kilograrn of biosolids (dry weight), respectively. The test samples were fully packed in
250 ml airtight plastic cups and 2.5 kg airtight plastic containers. Each dose was packed
16 cups and one container. The samples were tested after 15,30 minutes, 1, 2, 24 and 48
hours. One cup of sarnple was wasted in each test. The sarnples were stored at room
temperature, and tested for pathogen re-growth and parameter @H, TS) variation.
Leachatc production was observed for six rnonths once a month for six months. Each
tirne tests were conducted, one cup of sarnple was wasted. AAer the routine tests, some
sarnples were air-dned at room temperature and examined for odor release and the
physical appearance of the end products. Figure 3-1 illustrates the general test procedure.
w
The third phase started in late September 1999. The objective of this phase was to
compare pathogen inactivation at different storage temperatures. Biosolids were packed
in containers and stored in a freezer (-22OC), a cool chamber (4*C), and a laboratory room
(20-23OC). Samples were tested for FC count and TS over time. This test was an anempt
to simulate winter storage of biosolids in Winnipeg.


The test rnethods and operation procedures employed in this study are described in this
section.
3.2.1 Fecal colifonn (FC) test
The standard test for the fecal coliform group may be carried out either by the multiple-
tube fermentation (MTF) technique. the presence-absence procedure. the membrane filter
technique (MF) or the enzymatic substrate coliform test.
3 -2.1.1 Multiple-tube Fermentation (MTF)
The MTF method is conunonly utilized for the FC test. The complete multiple-tube
fermentation
presumptive,
procedure for fecal coliform involves three test phases, identified as the
confirmed, and completed test (APHA, 1998). The presumptive test is 1
based on the ability of the coliform group to ferment lauryl sulfate broth with gas
formation within 48 hours at 35'C. In the confirmation phase, the culture grown in the
presumptive phase is incubated on selective medium, EC broth at 44.5 OC, to suppress the
growth of other organisms. The completed test is based on the ability of the cultures
grown in the confirmed test to again ferment the lauryl sulfate broth. The three-phase
procedure requires about five to six days to complete. In this study only two phases,
presumptive and confirmed, were employed.
0
In the presumptive test, test tubes containing 10 mL sterilized lauryl sulfate broth (see
Table 3-2) and an inverted Durham tube were prepared. These fermentation tubes were
arranged in rows of five (or three) each in a test tube rack. The tubes in the first row were

inoculated with 1 rnL 10" dilution sample (see dilution: 10" dilution). Afier mixing the
tubes with a vortex mixer, a 1w2 dilution was obtained. 1 mL of lu2 dilution was
transferred to tubes in the second row and mixed to prepare a 10" dilution. In this way,
al1 the required dilutions were prepared and inoculated. Al1 the tubes were incubated in a
. water bath at 35 f O.S0C for 24 hours. The tubes with gas formation were "positive". The
tubes without gas formation were incubated for another 24-hoursand checked again.. If
there was still no presence of gas in a tube, it was "negative". Otherwise, it was
"positive".
Table 3-2 Components of Lauryl Sulfate Broth 35.6 g Sodium Lauryl Sulfate O. l g Pancreatic Digest of Casein Lactose Dipotassium Phosphate Monopotassium Phosphate Sodium C hloride
Table 3-3 Components of E C Broth 37.0 g Pancreatic Digest of Casein 20.0g Lactose Bile Salts Mixture Dipotassium Dihydrogen Phosphate Potassium Dihydrogen Phosphate Sodium Chlorice
In the confirmed phase, positive tubes from the presumptive phase were subcultured with
a sterilized plastic stick into fermentation tubes with EC broth (see Table 3-3). These a
tubes were incubated in a water bath (or warm chamber) at 44.5 f 0.2 O C for 24 hours.
Gas production with giowth in an EC broth culture is considered a positive fecal coliform
reaction. Failure to produce gas (with little or no growth) constitutes a negative reaction.
By selecting the highest dilution that gave positive results in al1 five replicates (or three,
if three replicates were used) plus the two successively higher dilutions, or the lowest
three dilutions if no five replicates showed positive, fecal coliform density was estimated
by means of Most Probable Number (MPN) method according to the MPN chart (APHA,
1998).
Lauryl Sulfate Broth was prepared as followings: 35.6 g of the powder (Table 3-2) was
suspended in 1 L of deionized water. The broth was mixed with a magnetic stirrer unit.
The magnetic bar was autoclaved before use. The broth was dispensed into test tubes
. containing inverted Durhams and the tubes capped. They were autoclave at 12 1 O C for 12
minutes, then promptly cooled. The EC Broth was prepared using the same procedure
except for using 37 g EC Broth powder (Table 3-3).
3.2.1.2 Membrane Filter (MF)
MF is another commonly used method for the FC test. In the standard membrane filter
technique, a certain amount of sample is drawn through a cellulose acetate or glass filter
with openings of less than 0.45 micros (pm). The bacteria present in the sample will be
' retained upon the filter. The filter is h s e d with a sterile buffered solution, placed upon a
surface of M-FC media, packed in a petri-dish and incubated at 44S°C. Fecal colifom
will produce visible blue colonies that c m be counted. Each colony represents one
bacterium in the original sample. The membrane filter technique is highly reproducible,
cm be used to test relatively large volumes of liquid sarnple, and yields numerical results
more rapidly than the multiple tube fermentation procedure. However, it does not fit

testing of the biosolids sample since the particles of solids will clog the pores in the filter.
In this study, standard plate count (SPC) with modification was employed as an
alternative to MF.
- 3.2.1.3 Standard Plate Count (SPC)
The standard plate count (SPC) is universally used to determine the number of viable
bacteria. A sample is plated on solid medium to allow single bacterial cells to develop
into macroscopic colonies that can be cowited. Since microbial concentration may be
quite high, samples rnay require extensive dilution (serial dilution) before plating. From
the colony count, the volume platings and the dilution, the number of viable bacteria in
the sample is calculated. The spread plate method allows only surface colonies to grow
and may be subject to crowding, but is a simpler procedure. SPC is usually used to test
- for bacteria that form macroscopic colonies. An effective number of colonies range from
30 to 250. The modified procedure was as following:
The petri plate was prepared by following the manufacture's direction for M-FC medium
(Table 3-4) rehydration, which is slightly different from the procedure described in
Standard Method 9222 D. 52 gram M-FC powder agar was suspended in 1 liter of
autoclaved deionized water. It was mixed with magnetic mixer and heated to near
boiling. IrnL of 1% rosolic acid in 0.2 N sodium hydroxide was added. Heating was
'continued to boiling, promptly removed from heat, and cooled to below 50°C. Roughly
12 mL of agar were dispensed to petri plates and allowed to solidify. The prepared petri
plates were sealed in plastic bags to preventing moisture loss and stored in a refngerator

at 4OC. The plates were warmed up at room temperature (20-23OC) for 2 hours before
inoculation.
Table 3-4 Components of M-FC medium Pept~nC!~ (pancreatic digest of cascin65% and yeut exiract 35%) 10.0 g Peptones (pancrcatic digest o f casein 5076 and peptic digest of animal tissue 50%) 5.0 g Yeast extract 3.0 g Sodium c hloride 5.0 g Lactose 12.5 g Bile salts 1.5 g Aniline blue 0.1 g Agar 15.0 g - Reagent-grade water 1 L
Several sample dilutions (see sample dilution b) were prepared based on the estimated
fecal coliform density. The sample was mixed on a vortex mixer just before inoculation.
A certain volume, usually O. ImL, of diluted sample was transferred to Petri plate with a
volume adjustable pipette. The samples were spread over the entire surface of agar with a
sterilized bent glass rod. Each sample was inoculated in duplicate or triplicate. The plates
were then incubated upside-down in an incubator at 44.5k0.2 OC for 20 to 24 hours. Fecal
coliform density in the original sample was calculated fiom the nurnber of blue colonies
formed on the plates. Only the plates with colony numbea between 20 and 60 were taken
into account because of the large size of the FC colony. If no plates with the colony
number fell into the above range, the FC number was calculated on basis of al1 plates
with countable colonies. The FC densities were calculated using formula (3-1).
A x T D=
v x s

Where: D = original Bnsity of &cal colifomis (CFU/g TS) A = Average of colony forming unit counts in plates T = dilution rimes
O V = Dlurne seeded in each plate (ml) S = total Solids in biosolids sample
3.2.1.4 Sarnple Dilution
a) 1 O-' dilution
50g of biosolids were weighed and added to approximately 400g of peptone buffered
water (see Table 3-4). The mixture was rnixed in a commercial blender for 3 minutes.
The pH was adjusted to about 7 with 1N sulphuric acid if the pH of the sample was
higher than 8.0 and below 9.5, or with 6N acid if the pH was higher than 9.5 while 0
mixing. Peptone buffered water was added to the mixture to bring the test sample weight
to 500g.
b) Other dilutions
Al1 sarnple dilutions other than 10" were made by M e r diluting the 1 O-' dilution. 1mL
of well-mixed 10~' sample was transferred to a tube containing 9mL peptone buffered
water. The tubes were mixed on a vortex mixer, so that a lu2 dilution was obtained. 1mL
.of 10" dilution was transferred to a tube containing 9mL peptone bdfered water and
mixed to obtain a 105 dilution. This method was w d to prepare d l dilution.
c) Dilution water

The procedure to prepare peptone buffered dilution water was as follows: The powders
listed in Table 3-5 were suspend in 1 L autoclaved ionized water and mixed with a
magnetic stirrer unit with the use of an autoclaved magnetic bar.
Table 3-5 Component of Peptone Buffered Water Peptone 10 13 Sodium chloride NaCl 5 g Disodium hydrophosphate Na2HP04a 12H20 9 g Potassium di hydrogen phosphate KHzPOn 1.5 g
3.2.2 pH Measurement
Using the soil-paste pH rneasurement technique (Racz, 1997), the pH of biosolids was
measured with a Glass Body/ Universal Glass pH electrode as the indicating electrode. A
High Flow Rate Calomel electrode was used as the reference electrode, providing better
conductivity and response time in emulsions, slmies, suspension tested (Fisher, 1993).
3.2.3 Temperature Measurement
In order to observe the temperature change in the biosolids caused by lime addition, the
plastic reactors must be insulated to prevent heat release into air too quickly. Styrofoam
is a very good heat insulator that absorbs only a small amount of the heat produced in the
reaction. For this reason, the reacton were embedded in and covered with Styrofoarn in
this test.
0
In the temperature test, biosolids and lime were placed in a Hobart mixer layer-by-layer.
The matexial was then mixed at high speed for 45 seconds to avoid excessive heat los.

'The blended mixture of biosolids and lime were packed into insulated 2.5-kg plastic
containers as quickly as possible. A thermometer was placed in the center of each reactor.
Time and correlative thermometer readings were recorded at certain intervals.
3.2.4 Total Solids Test
The crucibles used for total solids and volatile solids were ignited at 550°C for 1 hou and
cooled
with a 0
before
down in a desiccator, then weighed in a crucible. Al1 weighing was completed
sensitive balance (0.lmg). The sample was mixed with a blade driven by a drill
subsarnpling. Approximately 10g of sample was transfened to the cnicible and
weighed. Al1 samples were nui in duplicate. nie samples were first dried in an oven at
7S°C for 12 hours and then continued drying at 103 to 105'C for 3 hours. The samples
were cooled in a desiccator to balance temperature, and weighed. Duplicate
determinations agreement was controlled within 5%. The total solids and moisture were
calculated with the following formula:
(A-B) x 100 I TS%=
C - B Where :
A = weight of dry residue + crucible, g B = weight of dry crucible, g, and C = weight of sample + crucible, g
3.2.5 Alkali Addition and Packing Procedure
A certain amount (usually 2 to 3 kg) of biosolids was weighed. The required quantity of
lime or fly ash was calculated according to equation (3-3) and then weighed. The alkalis 0

and biosolids were added to the Hobart mixing chamber. The mixture was then mixed for
2 minutes at a moderate rate. The sample was then manually mixed with a plastic shovel
to eliminate unblended zones. Finally, the sample was mixed for another minute.
Alkalis weight calculation: A = B x S x D (3-3) Where:
A = weight of alkali needed (g) B = rveight of biosolids (kg) S = percent of total solids in biosolids D = dose of alkali ( g k g TS)
The homogenous sample was packed in several 250 mL plastic cups. When sample
testing lasted more than a month, the sample was packed in both 250 mi, cups and in a
2.5 kg plastic container. The cups and container were covered with airtight caps. The
'250mL sarnples were tested for FC, pH, TS regularly. The sample in the big container
was used as a reference sample. Usually, only pH value of the sarnple in the large
container was measured. If pH of samples in the large container and srnaIl cups had a
difference of 0.5, the test results obtained from the small cups would not be accepted.
Chapter 4
RESULTS AND DISCUSSIONS
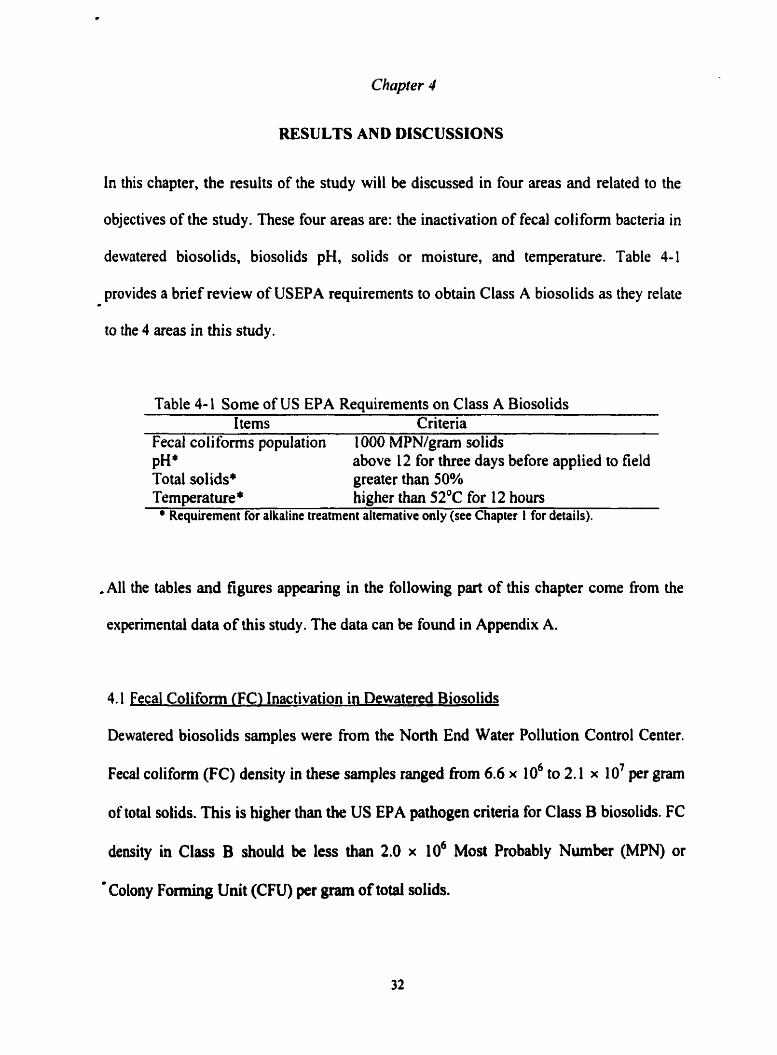
In this chapter, the results of the study will be discussed in four areas and related to the
objectives of the study. These four areas are: the inactivation of fecal coliform bacteria in
dewatered biosolids, biosolids pH, solids or moisture, and temperature. Table 4-1
provides a bief review of USEPA requirements to obtain Class A biosolids as they relate *
to the 4 areas in this study.
Table 4- 1 Some of US EPA Requirements on CIass A Biosolids 1 tems Criteria
Fecal colifomis population 1000 MPN/gram solids PH* above 12 for three days before appiied to field Total solids* greater than 50% Temperature* higher than 52°C for 12 hours
Requuement for alkaline treatment alternative only (see Chapter 1 for details).
.Al1 the tables and figures appearing in the following part of this chapter corne from the
experimental data of this study. The data can be found in Appendix A.
4.1 Fecal Coliform (FC) Inactivation in Dewatered Biosolids
Dewatered biosolids sarnples were fkom the North End Water Pollution Control Center.
Fecal coliform (FC) density in these samples ranged from 6.6 x 10⁶ to 2.1 x 10' per gram
of total solids. This is higher than the US EPA pathogen criteria for Class B biosolids. FC
density in Class B should be less than 2.0 x 10⁶ Most Probably Nurnber (MPN) or
-Colony Fomiing Unit (CFü) per gram of total solids.

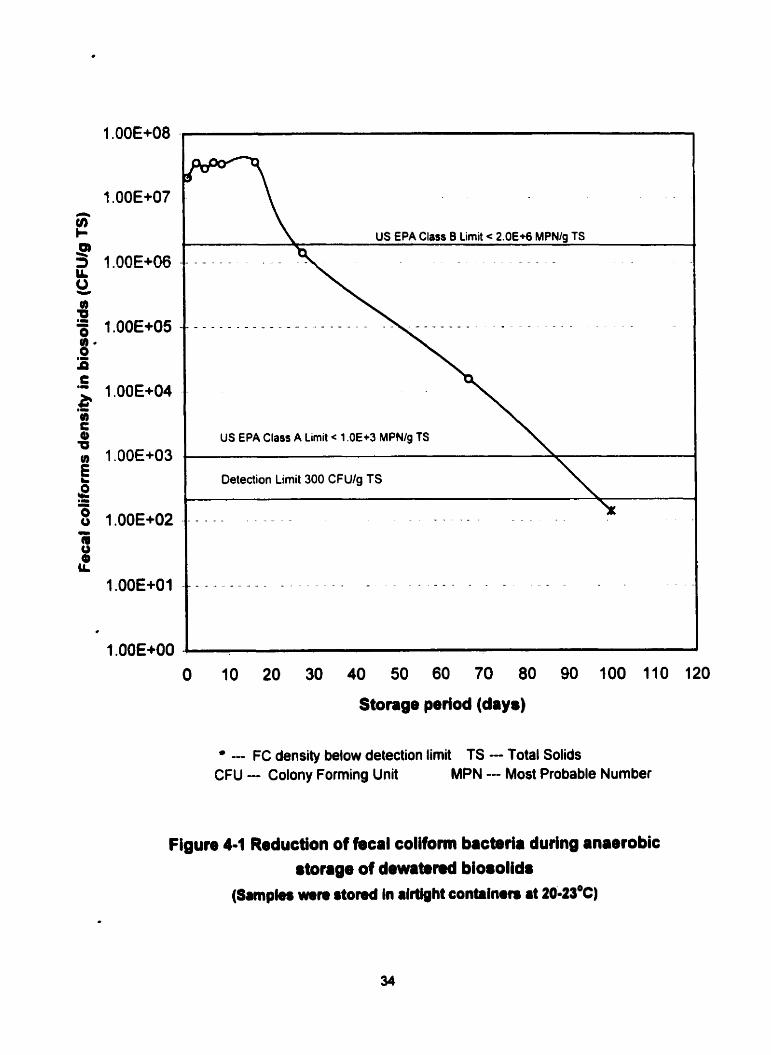
- 4.1.1 Long-terrn Storage Test
Biosolids sarnples (without alkali addition) were stored in closed, airtight containers at
room temperature (20 to 23'C) for o period of six months should gradua1 decrease in the
population of fecal colifomis.
Figure 4-1 shows that the density of FC increased from 2.1 x 10' to 3.6 x 10' during the
first two days of storage. The explanation for this increase could be that the biosolids had
Obeen stored in a cool chamber (4OC) for five days pnor to the start of storage testing.
During this period, some of fecal coliforms lost their activity. Once brought to the room
temperature, the fecal coliforms recovered and some may have started reproduçing. This
result supports the fact that, unlike virus pathogens that require marnmalian host cells for
replication. bactena can grow in biosolids when environmental conditions are favourable.
After the initial FC increase there was no significant change in FC population for 17
days. The decline of FC density took place between day 17 and day 28. By day 67, fecal œ
coli form densi ty dropped to 1 . 1 x 1 o3 CFU/g TS. On day 1 00, the fecal coli form level was
below the detection level of 300 CFU/g TS, but this did not mean that there was no fecal
coliform. The Presence Absence Test (P-A) perfonned after 180 days storage showed
positive results although fecal coliforms could not be detected with either the Multiple
Tube Fermentation (MTF) or the Standard Plates Count (SPC) test methods.
US €PA Class B Lirnit < 2.0€+6 MPNIg TS
US €PA Class
Detection Limit 300 CFUlg TS \
O 10 20 30 40 50 60 70 80 90 100 110 120
Storage period (dry.)
- FC density below detection limit TS - Total Solids CFU - Colony Forming Unit MPN - Most Probable Number
Figure 4-1 Reduction of fecal coliform brcbria during anaeiobic
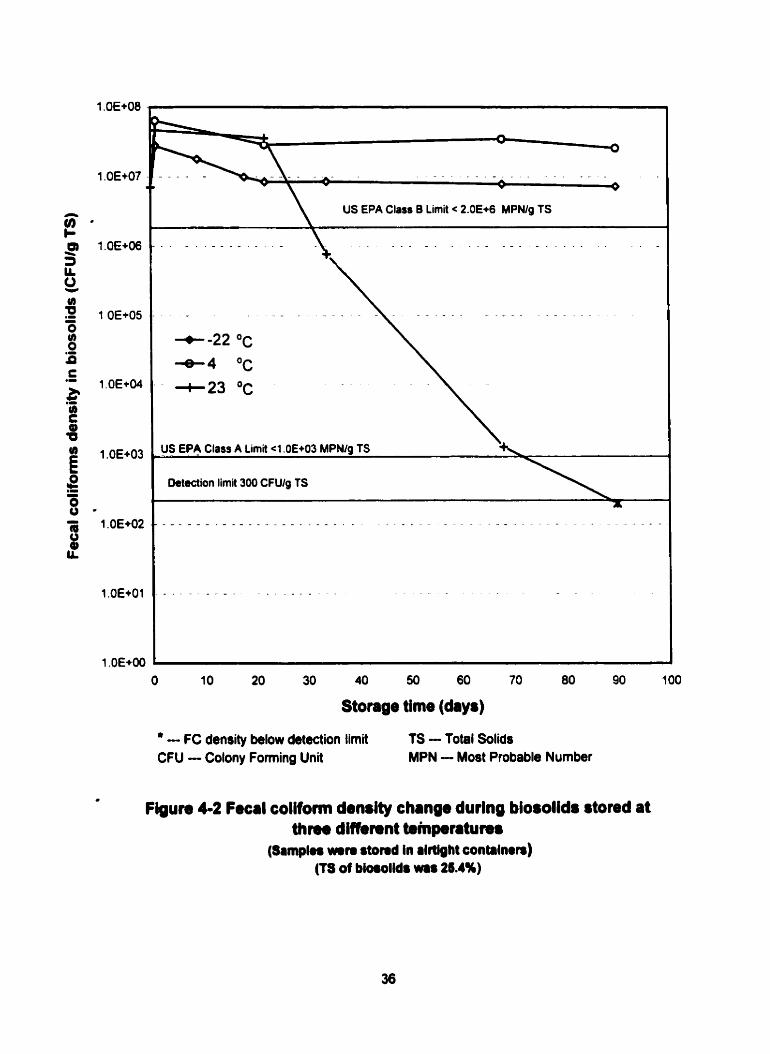
The long-tenn storage test was also conducted at low temperatures to simulate storage
condition in Winnipeg during winter. Two low temperatures: 4OC and -22°C were
ernployed in this test. Samples stored at 4OC were removed from the cool chamber and
left in room temperature for 4 hours before being tested for fecal coliforms. Samples
frozen at -22OC were removed from the freezer and lefi at room temperature for 24 hours
to thaw before being tested. As a control, a roorn-temperature (20-23OC) storage test was
conducted during the sarne period. Figure 4-2 shows the inactivation rates of fecal
coliform bactena in biosolids stored at 3 different temperatures. In the samples stored at *
4*C and -22OC, there was no significant decline in FC density after 90 days storage. This
indicates that although low temperature may affect some individual cells, it mainly slows
down the growth rate of bacteria. This, in tum, delays the transition to the death phase of
microbial growth. There was a significant FC count decline in samples stored at room
temperature. The decline may have resulted fiom substrate de privation and the build-up
of toxic wastes, such as ammonia and hydrogen sulfide (H2S). At low temperatures
bacteria consume substrate at a low rate. The substrate remaining in biosolids will
provide food for evennial bacterid growth when the temperature becomes favourable for
g r o h .
The practical significance of these finding is that storing dewatered biosolids in the field
during the winter will not inactivate pathogens because of the low temperatures in
W i ~ i p e g . However biosolids stored in a cool chamber (4OC) for several days can be used
in pathogen testing since the FC density does not significantly change over 90 days.
\ US EPA CIau B Limit c 2.0€+6 MPNlg TS
US €PA Class A Limit 4 .OE+03 MPNlg TS
Detedion limit 300 CFUlg TS
a
Stongr time (dayr)
* - FC density below detection limit TS - Total Solids CFU - Colony Foming Unit MPN - Most Probable Number
Figure 4-2 Focal colifom drnsity change durlng biosolids stored rt thme dHhnnt bhp.tatums
(Sam?(.. m m $tond in riitlght conblnon) (TS of bioaolld8 wis 26.4%)

4.1.2 Effect of alkalis addition on fecal colifonn inactivation
The alkalis used in this study included quick lime (Cao) and fly ash (FA). In this study,
commercial grade lime was mainly used except at the beginning (Febniary and March
1999) when laboratory grade lime (LGL) was used.
4.1.2.1 The effect of lime addition on fecal coliform inactivation
Quick lime addition was found to be very effective in inactivating fecal coliforms in O
biosolids. Room temperature (20-23°C) samples were tested for fecal coliforms. The
fecal coliform population was tested at certain intervals. Tests on biosolids with 3 1.8%
TS showed that 20g CaOkg TS (about 6.1 gram CaOfkg on wet weight basis) resulted in
significant inactivation of fecal coliforms. After six days, the FC count dropped to close
to the detection level of 300 CFU/g TS. Figure 4-3 shows that fecal colifonn inactivation
occurred mainly during the first 24 hours after lime addition. The FC density dropped
fiom 6 . 6 ~ 106 to 6x10~ CFU/g TS in this period. This indicates that it is possible io
inactivate fecal coliforms to meet Class A criteria with a small lime (Cao) dose of 2Oglkg - TS. In the next five days, the FC density decreased slightly, from 600 to 300 CFU/g TS
(see 4.1.2.3). These tests also showed that the inactivation rate increased as the Ca0
dosage increased. Figure 4-4 shows that 30gnun Ca0 kg TS (about 9.5 gram CaOfkg
biosolids on a wet-weight basis) reduced the FC count to below detection levels in 100
minutes. With lime dosage of 60, 120, 150,240 and 480gram CaO/kg TS (about 19 gram
CaO/kg on wet basis), fecal colifonn could not be detected fifieen minutes aîler lime
addition.

Tirna rCbr lime addition (houn) - FC density below âetection limit TS - Total Solids
CFU - Colony Forming Unit MPN - Most Probable Number
Figure 4-3 Fecal colifomis density dropped to close to detection level (one colony formed in one out of three
0
plates) with lime dose of 2Oglkg TS in six days (l'8 of bh0liek -8 31.8%)

- - - - - - - - - a A - - -
US €PA Class B Limit < 2.0€+06 MPNlg TS
+ Fecal coiiforrn density
US €PA Class A Limit <1 .OE+03 MPNlg TS
Detedion Limit 300 CFUlg TS
- FC density bdow detection limit TS - Total Solids CFU - Colony Foming Unit MPN - Mo8t Probable Number
Figure 4 4 Fecal coliforms density dropped to below detection limit and pH kept above 10 with lime
dose of 30glkg TS in two houn, (TS of btosollda~31 .a%)
iSamales wre rtond In rlrtiaht containen rt 2033'C)

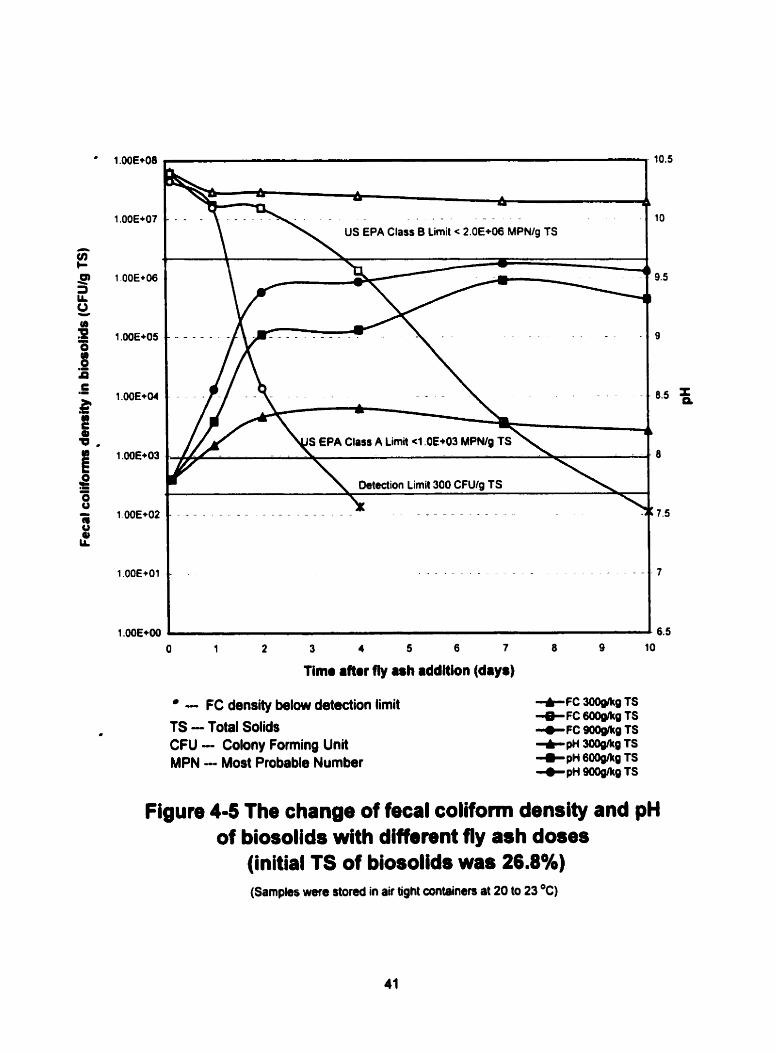
4.1.2.2 The effect of fly ash addition on fecal coliform inactivation
Fly ash (FA) provided by the Manitoba Hydm, Brandon Generating Station was applied
as an alkaline reagent in this study. FA has been found to be effective in inactivating
fecal coliforms in dewatered biosolids. The inactivation efficiency of FA depends on its
composition and the concentrations of elements, such as Ca, Na and K. In this study on
26.8% TS biosolids, a 900g FA kg TS dose reduced fecal coliforms density below
detection level of 300CFU/g TS in 4 days. A 600g FAIkg TS dose produced the same
reduction in 10 days. A 300g F A k g TS dose did not significantly reduce FC density in
10 days (Figure 4-5).
4.1.2.3 The relation between FC inactivation, alkali dosage and pH
The relation between pathogen inactivation rate and lime (or fly ash) dose has often been
discussed in the literature on pathogen inactivation with alkali addition (WEF, 1995 etc.).
The lime (or fly ash) dose required to reach a certain inactivation rate also varies with the
. TS of the biosolids. In general, biosolids with higher TS need a lower alkali dose than
biosolids with a lower TS to get the sarne inactivation effect. It was found that FC
inactivation occuned when the pH was 9.0. When pH is above 9.5, fecal coliforms will
be inactivated quickly. For example, the pH of biosolids with Ca0 dose of 20gkg dry
solid was 9.49 at beginning of lime addition and the FC density decreased one hour after
lime addition. AAer 24 hours, the FC density decreased fiom an initial 6.6~ 106 to 6.0~ 10*
CFU/g TS, which is below the US EPA standard for pathogens level in Class A biosolids.
Over the next 120 h o w (five days), the pH of biosolids dropped from 9.24 to 8.49 and
O
. - - - -
US €PA Class 6 Limit < 2.OE+û6 MPNIg TS
Oetection Limit 300 CFUlg TS
- - - - - - - - - - - . - - - - -
O 1 2 3 4 5 6 7 8 9 10
T ime rftw fîy rsh addition (daya)
- FC density below detection limit TS - Total Solids CFU - Colony Foming Unit MPN - Most Probable Number
Figure 4-5 The change of fecal coliform density and pH of biosolids with different fly ash doses
(initial TS of biosolids was 26.8%) (Sampks were stored in air tight containers at 20 to 23 O C )

the rate of FC inactivation slowed as the pH decreased (see Figure 4-5). There was no
significant FC density change in this period. To illustrate the relation between fecal
coliform inactivation and the pH of biosolids, data obtained from the fly ash test were
-used here because the pH value increases more slowly after fly ash addition than for
quick lime addition (see section 4.2.2). In Table 4-2 and Figure 4-5, it can be seen that
there was no fecal coliform inactivation whcn the pH rvas below 9.0 (300g dose 311 doys,
600g dose day 1 and day 2). Fecal colifom inactivation took place when the pH was
around 9 (600g dose from day 2 to day 7, and 900g dose between day 1 and day2). When
the pH was about 9.5, fecal colifoms were inactivated to below the detection level of 300
CFUlg TS, which happened between day 7 to day 10 at a dose of 600g1kg TS, or between
day 2 and day 4 with dose of 9OOgkg TS (Figure 4-5).
Table 4-2 FC inactivation and DH
1 D& 4 1 I I L L L
1 2.50~10' 1 8.40 1 1.33~10~ [ 9.06 1 undetectable 1 9.47 1
1
1 ai 7 1 L
1 2.00~10' 1 8.27 1 3.60~10' 1 9.48 [ undetectable 1 9.62 1 ai 10 11.98~10' 1 8.21 1 undetectable 1 9.32 1 undetectable 1 9.56 1
ln terms of CFU/g TS
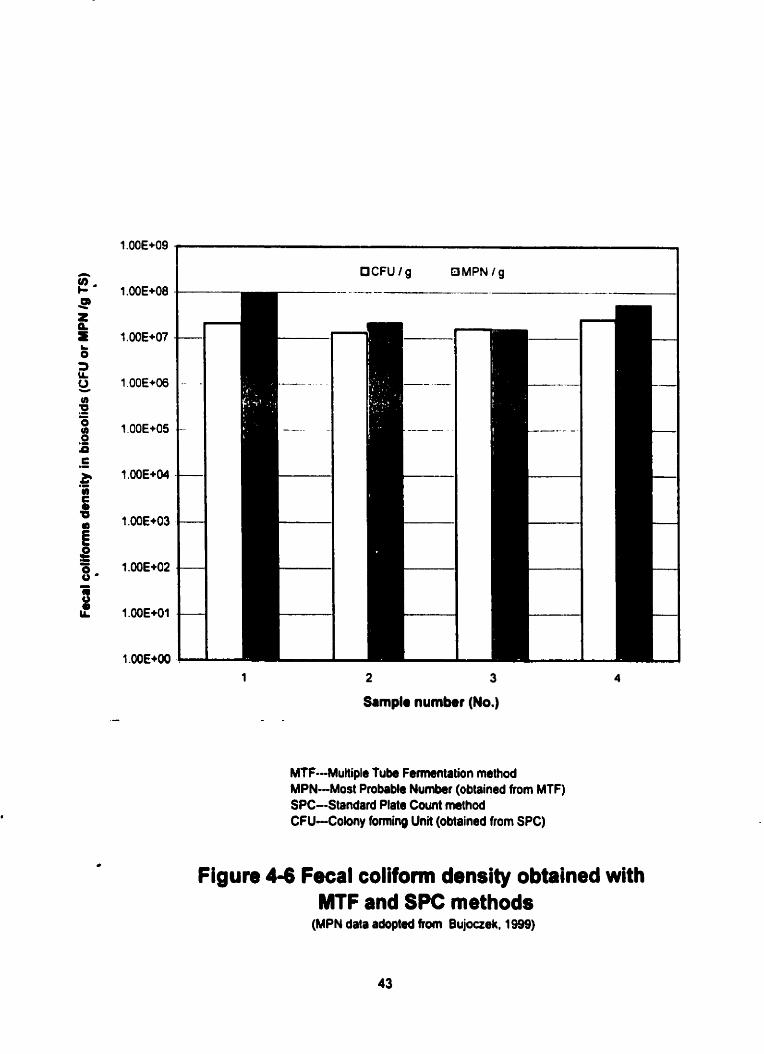
4.1.3 Cornparison of the results obtained fiom two fecal colifonn test methods
Time
Day 1
900g fly ash /kg TS
'As stated in Chapter 4, the Standard Plates Count (SPC) and the Multiple Tubes
FC count* 1.50~10'
600g fly ash /kg TS
Fermentation (MTF) methods, were employed in this study to measw fecd colifoms.
PH 8.56
FC count* -
1 .70x1Or
300g fly ash /kg TS
The objective was to try to find a FC test method to replace the Membrane Filter (MF)
pH 8.29
FC count* 2.91~10'
pH 8 ,O9
OCFU l g OMPN / g
Sampla numbet (No.)
MTF--Multiple Tube Femntation method MPN-Most Probable Number (obtained from MTF) SPC--Standard Plate Count method CFU-Colony forming Unit (obtained from SPC)
Figure 4-6 Fecal colifonn density obtained with MTF and SPC methods
(MPN data adoptd hom Bujouek, 1999)

0
method. An alterative method should give quick numerical results, d i k e MTF that
requires 48 to 96 hours and gives statistical results. The alterative rnethod should also
avoid the problem of MF method (filter plugging). A quick result was the main reason for
wanting to adopt the SPC method in this study. If SPC c m give results that agree with the
obtained fiom MTF, which is the standard method for FC test in the examination of water
and wastewater (APHA el. 1998). then it cm be used in future studies. For this rçason, the
test results on the same sarnples using the two methods were compared. Figure 4-6
- indicates the difference between CFU from SPC and MPN fiom MTF was in one log
range. Although the data presented in this paper were based on CFU, al1 the data were
confirmed by the MTF method when FCU were below 1000 or under the detection level.
In al1 the cases tested, both methods always gave identical results, that is MTF showed
negative whenever SPC could not detect FC and vice versa.
4.2 pH Change in Dewatercd Biosolids
As shown in section 4.1.2.3, fecal coliform inactivation had a close relation to the pH of
the biosolids. The relationship between alkali dose and biosolids pH will be discussed in
this section.
The pH of biosolid sarnples fiom the NEWPCC ranged from 7.1 to 7.8. Samples stored in
closed containers filled up to the top showed very little pH change during long term
storage. Tests showed that the pH of biosolids in completely filled containers were higher
than that of biosolids in containea with some gas head space in them. The pH of the top
layer could dmpped to about 6 when there was 6m head space in the upper part of the
0

containers This pH drop might have occurred as a result fiom the microorganisrns'
activity on the biosolids swfûce where air (oxygen) was available. Moulds appeared and
the biosolids' color changed, usually, accompanied by a pH drop. O
4.2.1 pH Change with Lime Addition
Adjing lime to biosolids increasrd pH in proportion to the lime dose added up to a
certain level, beyond which pH was independent of lime dose (Figure 4-6). The highest
pH value was attained by lime addition was approximately 12.5. The increase in pH value
was the result of the reaction between the lime and the water in the biosolids. The dose of
lime required to reach a certain pH was affected by the composition of biosolids, for
. example the total solids (TS) to moisture ratio.
4.2.1.1 Theoretical and practical pH limitation
There is a limit to the pH that can be obtained by lime addition. This limit is determined
by the slight solubility of final product produced in the reaction between lime and water.
Here we need to review two chernical equations that appeared in chapter 2.
Ca0 + H20 * Ca(OH)2 (4- 1
Ca(OH)* ca2+ + 2 OHœ (4-2)
The reactants are quick lime and water, and the end product is calcium hydroxide which
when dissolved in water has a solubility product constant, KSp, of 1.4 x 10" at 25 OC. That
is,
[ ~ a * ] OH^^ = 1.4 x 1 0' (4-3
Here
[~a*] = I/I [OH-] (4-4)

O 50 100 150 200 250 300 350 400 450
Lime dose (glkg TS)
Initial TS of biosolids was 26.8%
Trend line of proportional part: Y = O.OSl7X + 8.2305
R~ = 0.9685
Figure 4-7 Increase of pH vanus lime dooe (B~O~OIMI and Ilma m m mixod foi 3 min and aian
packml in rirtight plaltic cup. pH wu m u u n d 30 min a h r Iim addition)

By replacing [~a*] in Formula 4-3 with Formula 4-4, the concentration of hydroxide ion
cm be calculated: .
[OH-] = 1.41 x 10'* moleslL
pH = -log [OH-] = 12.15
The reactions occurring in dewatered biosolids are much more complicated than those
taking placc in watcr alonc. It is difficult to develop precise reaction equations witli
biosolids because of its complex composition and heterogeneity. However, the reaction
between lime and water is the most predorninant reaction. As a result, the maximum pH
attainable in biosolids by lime addition is approxirnately 12.5 as nponed by some
researchen (Christy, 1990, and Bumham, 1992).
Since th is limitation of pH exists, extra lime addition will not increase the pH
significantly and therefore will have little effect on FC inactivation.
4.2.1.2 Lime dose requirernent
The dose required to reach maximum pH in biosolids is affected by the composition of
the biosolids. First, the most important factor is the TS content. The higher the percentage
of TS (the lower percentage of water) in biosolids the less lime is needed since the pH
nflects the concentration of hydroxide ions in the liquid portion of the biosolids.
Secondly, the components of the TS exert a significant influence on the dose
requirement. Calculations based on Equation 4-1 and 4-2 shows that only 0.39 g of lime
is needed to attain a pH of 12.5 for one liter of pure water. In these laboratory
experiments, a pH of 12.33 was observed by dissolving 0.4 g of laboratory grade lime in
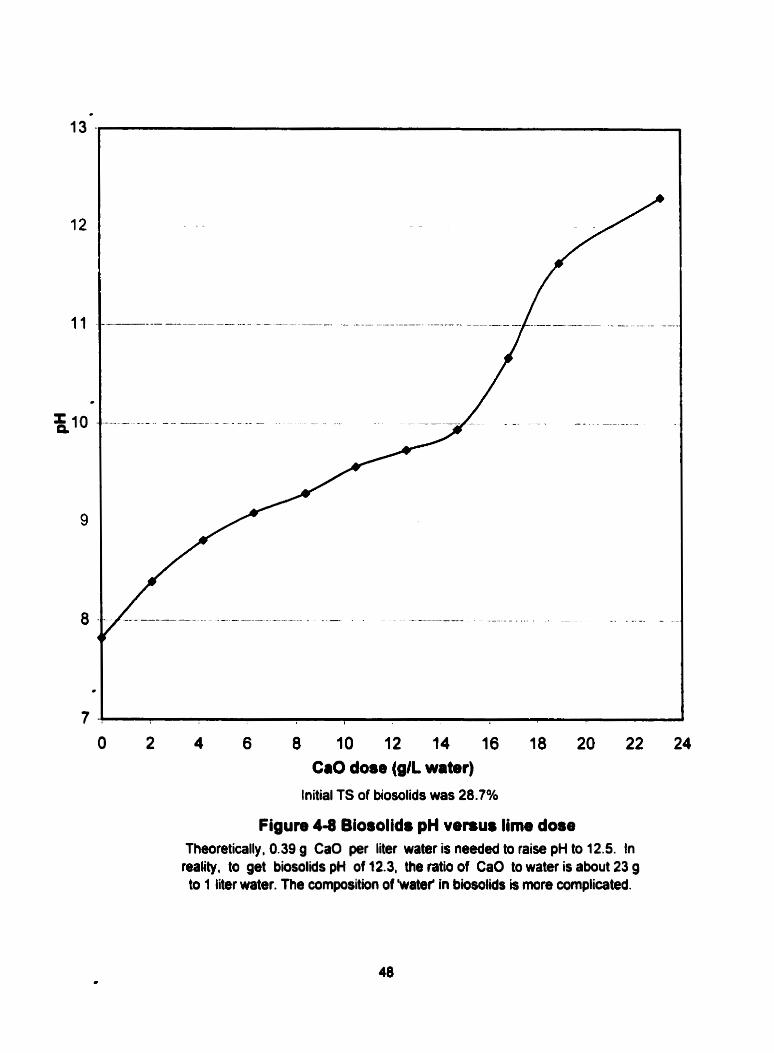
O 2 4 6 8 10 12 14 16 18 20 22 24 Ca0 dose (glL water)
Initial TS of biosolids was 28.7%
Figure 4 8 Biosolids pH v e n u s lime dose Theoretically. 0.39 g Ca0 per liter water is needed to raise pH to 12.5. In
reality, to get biosolids pH of 12.3, the ratio of Ca0 to water is about 23 g to 1 liter water. The composition of 'watef in biosolids is more complicated.
. deionized water (pH 5.5 1) at a temperature of 2 1 O C . To reach the sarne pH in biosolids,
however, the minimum lime dose required was approximately 23g lime per liter of water,
equivalent to 57g limekg TS (Figure 4-8).
Furthemore, the curve s h o w in Figure 4-8 has an obvious inflcction point at 15 g/L. pH
9.9. The pH increased gradually with an increase in lime dose before this inflection point.
and then, the slope of the c w e increased. This finding suggests that there are
components in biosolids that consume the OH- ions produced by calcium hydroxide
@ hydration. These components may include phosphate, carbonate, etc. (see 2.2.1) which
give the liquid in the biosolids some buffering capacity. The relationship between pH and
lime dose in biosolids cannot be explained by the reaction between the lime and water
alone.
4.2.1.3 High pH duration
Figure 4-9 gives the maximum pH values obtained with lime different lime dosages of
and changes in pH with time. The USEPA requirement for Class A biosolids is that the
.pH above be kept 12 for at least 72 hours. A lime dose of 60g per kg total solids is the
minimum dose to meet this requirement for the biosolids having an original pH of 7.12
and a 3 1.8% TS content. Samples with a higher lime dose might keep the pH high for an
even longer period. Over a 180 day test period, samples at different lime dosages gave
the following pH values:
Pathogen inactivation is enhanced over a long period when the pH remains high.
Landfilling treated biosolids with a high pH is not hamiful. However, aikaline residw is a
O
49

-- + Oglkg TS -- - - - - - - - - -
O 1 O 20 30 40 50 60 70 80
Timo aWr limo addition (days)
Figure 4-9 pH change in 83 days after lime addition Samples were packed in airtight plastic cups and placad at 20 to 23 O C
Initial 1 S of biosolids was 31.8%
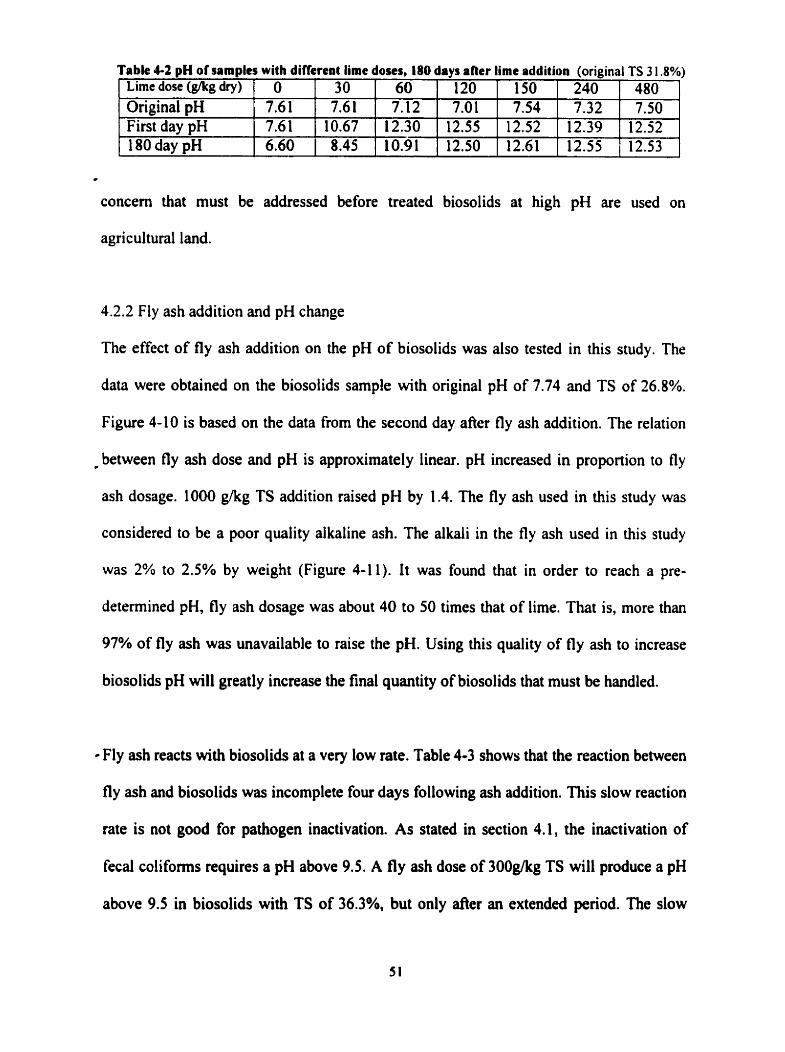
Table 4-2 pH of samples with different lime doses, 180 days aRer lime addition (original TS 3 1.8%) 1 Lime dose (gkg dry) 1 O 1 30 1 60 1 1 2 0 I l 5 0 1 2 4 0 1 4 8 0 1
--
- concem that must be addressed before treated biosolids at high pH are used on
Original pH First day pH 180 day pH
agricultural land.
4.2.2 Fly ash addition and pH change
The effect of fly ash addition on the pH of biosolids was also tested in this study. The
data were obtained on the biosolids sample with original pH of 7.74 and TS of 26.8%.
Figure 4-10 is based on the data from the second day after fly ash addition. The relation
- between fly ash dose and pH is approximately linear. pH increased in proportion to fly
ash dosage. 1000 g/kg TS addition raised pH by 1.4. The fly ash used in this study was
considered to be a poor quality alkaline ash. The alkali in the fly ash used in this study
was 2% to 2.5% by weight (Figure 4-1 1). It was found that in order to reach a pre-
determined pH, fly ash dosage was about 40 to 50 times that of lime. That is, more than
97% of fly ash was unavailahle to raise the pH. Using this quality of fly ash to increase
biosolids pH will greatly increase the final quantity of biosolids that must be handled.
Fly ash reacts with biosolids at a very low rate. Table 4-3 shows that the teaction between
fly ash and biosolids was incomplete four days following ash addition. This slow reaction
rate is not good for pathogen inactivation. As stated in section 4.1, the inactivation of
fecal colifoms requires a pH above 9.5. A fly ash dose of 300gkg TS will produce a pH
above 9.5 in biosolids with TS of 36.3%, but only &et an extended period. The slow
L
7.61 1 7.61 7.12 12.30 10.91
7.61 6.60
10.67 8.45
7.01 12.55 12.50
7.54 12.52 12.61
7.32 12.39 12.55
7.50 12.52 12.53

Figure 4-10 pH change va. fiy arh dose (initial TS of biooolidr war 26.8%)

Figure 4-1 1 pH increase obtained by lime or fly ash addition (initial TS of biorolidr was 26.8%)
To obtain the sarne pH increase fly ash dose required was 40 to 50 times of lime dose

Table 4-3 pH with different fly ash dose vs duration (original TS=36.3%)
Fly ash dose 1 Dayl 1 Day2 1 Day3 1 Day5 1Day100I
release of hydroxide ions from fly ash hinders pathogen inactivation. In this study, the
effect of adding a small amount of lime with the fly ash was tested. As a result, the
highest pH occurred in two hours. Figure 4-12 shows that pH increases slowly when only
fly ash is added and that lime addition accelerates fly ash hydration.
4.2.3 The impact of biosolids TS on pH and alkali addition
.The pH increase in biosolids is a result of the reaction between Ca0 and moisture in the
biosolids. The moisture content of biosolids is a decisive factor in determining pH at
various alkali dosages. That is, whenever lime (or fly ash) dose is cited in this paper, total
solids (or moisture) percentage of biosolids is also reported. Figure 4-13 shows that in
order to attain the sarne pH in biosolids with a higher moisture content (lower TS) a
higher alkali dose is needed. In other words, at identical alkali dosages, biosolids with a
lower moisture (higher TS) will mach a higher pH than biosolids with a higher moisture
content.
O

O 2 4 6 8 1 O 12 14 16 18 20
Tirne rfbr rlkrli addition (houn)
Figun 4-12 Incnue in pH venus tirne rfbr addition of lime, fly arh or mixture of lime and fly rsh

O 300 600 900 1 200 1500 1800 2100
Fly arh dose (g/kg TS)
Figure 4-13 The influence of biooolids TS on the pH obtained with fly ash addition
At the same alkali dose, biosotidb with higher TS can obtain higher pH value than that with b e r 1 S.

4.3 Biosolids temperature
The dewatered biosolids samples utilized in this study were collected at NEWPCC and 0
had an initial temperature around 35OC. This temperature was relatively constant since
the temperature dunng anaerobic digestion, which preceded dewatering, was constantly
at 37'C.
4.3.1 Heat capacity of biosolids - The reaction expressed by Equation 4-1 is an exothermic reaction. Equation 4-2, on the
other hand, is an endothennic one. Since the latter reaction proceeds to a very limited
-extent (Kspl.4 x IO"), its effect on the temperature change in biosolids can be ignored.
Table 4.4 s r n e r i z e s the theoretical heat formation reaction 4- 1.
Table 4-4 Theoretical heat production in lime and water reac tion Compound State Heat of formation (KJ/mole)
Ca0 Crystal -635.1 Hz0 Liquid -285.8
Ca(OW2 Crystal -986.1 Heat produced 65.2
( Calculadon bascd on Gillcspic, 1986)
4-5 Highest Temperature Change with Diffcrcnt Lime Dosc (biosolids TS of 36%) [ Limedose 1 Theoretical heat 1 Expccted 1 Actual
(gkg wet sludge)
90 120 135 150 180 210 .
Took no consideration about heat toss and hcat causing calcium hydmxidc temperature change
production ( K J ) 104.5 139.3 156.7 174.2 209.0 243.8
temkraturee rix for I L water CC)
25.0 33.3 37.5 41.6 50.0 58.3
temperature rise in biosolids (OC)
29.0 35.8 40.5 47.5 56.5 65 .O

+ 90gkg + 120glkg + 150glkg -1C 180glkg + 21 OgJkg
Ca0 dose in terms of g/kg on wet weight basis
- - "
O 20 40 60 00 100 120 140 160 180 200 220 240 260 280 300
O Time rfbr lima addition (rninutm)
Figure 4-14 The effect of lime dose on temperature increase versus time (initial TS of biosolids was 36%)
Biosolids and lime were mixed for 45 seconds and packed in plastic containers insulateâ with Styrofoam. The room temperature was 23 O C .

According to Table 4-4, one gram (0.0 18 mole) of quick lime reacting with water
produces approximately 1.164 KJ heat that raises the temperature of 1 L water by O.X°C.
This calculation does not take the temperature raising of calcium hydroxide into account.
The heat capacity of water is 75.4 J K" mole-' (Gillespie et al. 1986) or 4.1 84 J K" g".
*
Tsble 4-5 gives the maximum biosolids temperature changes obtained by lime addition
and also provides the corresponding theoretical temperature changes for water. However,
the test did not consider the temperature variation of caused by calcium hydroxide nor the
heat absorbed by surroundings. The temperature obtained in practice is higher than the
theoretical temperature expected. Roediger (1987) mentioned this phenornenon. WEF
(1999), on the other hand, gave a contradictory explanation. Based on these data we can
deduce that the heat capacity of biosolids is lower than that of water. More exactly, the
*heat capacity of the solid portion in biosolids is lower than that of water. The
approximately heat capacity of biosolids is 3.75 ~ ~ ' ' ~ r a r n - ' , 90% of that of water which is
4.1 84 J IClgrarn-'. Based on this, the heat capacity of the solid portion of biosolids is 2.98
J K " ~ " .
4.3.2 Lime dose and temperature change
Five different lime doses were employed in temperature testing. The original temperature
of both biosolids and calcium oxide was 23 O C . The temperature variation with time and
- with lime dose is shown in Figure 4-14. The highest temperature obtained was found to
depend on the lime dose as well as the original temperature of the biosolids. At room
temperature, 90gAcg biosolids on wet weight basis (250gkg TS for a biosolids sample

Lime dose (glkg on wet weight basis) Figure 4-16 Measured linear relation between Ilme dose vs biosolidr
tempentum increase The peak temperature increases were measured in 2 to 3 hours after
lime addition. The linear relation ktween increase of temperature and lime dose :
y = 0.3248~ - 1.8604 (coefficient of coirelation for the trendline ~ ~ = 0 . 9 9 )

0
with TS of 36%) was needed to raise biosolids temperature to the US EPA temperature
criteria, greater than 52 OC and a pH above 12. Meeting the temperature duration
requirement (keeping the temperature above 52 OC for 12 hours), was found to be totally
dependent on insulation.
Since the operation temperature in fieldwork varies seasonûlly, it is fairly conrenient to
estimate the required lime dose by establishing the relationship between lime addition
and temperature change. Figure 4- 15 shows that the increase of temperature (AT) vs. lime
doses (on wet weight basis) is linear. Roughly, 3.1 gram of lime per kilograni of
biosolids (on wet weight basis) is needed to raise the temperature of the mixture by 1°C,
this is show by the reciprocal of the slope of the trend line (Y = 0.3248X - 1.8604). The
loss of heat in the test procedure (mixing and packing) was very limited - about 6.6
U/kg biosolids (on wet weight basis), this heat loss can be estimated from the
intersection of the trend line at X axis (1.8604 gram limekg biosolids on wet weight
basis). The dewatered biosolids at NEWPCC were usually at a temperature of about 35
O C afler dewatering. At this temperature, 43 g of lime per kilograrn biosolids on wet
weigh bais would be needed to raise the temperature of the dewatered biosolids to 52OC.
The equivalent lime doses on dry weight basis ranges fiom 140 to170 g k g TS for
biosolids TS in the range from 33% to 25%. At the above lime doses, a pH of 12 in
biosoiids is assured,
Lime dose not only detemines the extent of the temperature rise but also determines the
rate of temperature rise. The higher the lime dose, the fastet the temperature increases

50 1 O0 150 200 250 300 350
T ime after lime addition (minutes)
Figure 4-16 Temperature incnase with lime dom 135glkg on wet weight basis
in biosolids with diffemnt initial f S

(Table 4-6). The rate of temperature increase reflects the lime hydration rate. The actual
lime hydration rate may be greater than that listed in the table, as the mixing in the
. temperature test may have been insufficient (only 45 seconds) (see Chapter 3).
Table 4-6 Higher lime dose may results in higher biosolids temperature achieved faster 1 Lime dose [ Peak temperature 1 Time after lime addition
4.3.3 The effect of total solids content on temperature change
. The percentage of total solids in biosolids effects the extent of temperature rise at a
certain lime dose addition because the heat capacity of biosolids varies with its TS
content. However, the results of tests on four sarnples at different TS (27%, 28%, 3 1%,
36%) but with the same lime dose (135 glkg on wet weight basis) showed that there was
little difference among the peak temperature changes (Figure 4-16). In fact, this result
can be expected considering the change in heat capacity of sludge as the TS content
varies from 27% to 36%. The conesponding difference in heat capacity for biosolids in
this concentration range is 0.1 1 J K'~ ' ' which, as a result, would produce a temperature
change of only 0.8 OC. This small difference may be masked by larger heat releases to air
caused by heat conduction fiom the insulator or other operational factors. For this
reason, the effect of biosolids TS concentration on temperature change can be ignored in
the TS range studied. This conclusion simplifies the calculation of lime dosage required
to raise biosolids temperature. Calculation of lime dose on a per wet biosolids (on wet
(g/kg on wei wcight basis)
210 180 150 120 90
The original TS of Ihc smplt was 36%
( O c )
90 .O 81.7 72.5 60.5 54.0
(g/kg dry solid)
583 500 418 333 250
(minutes)
90 i or 130 150 200

O 50 100 150 200 250 300 350 400 450 500 550
Lime dosa (@kg TS)
Figum 4-11 TS change with lime addition

weight basis) is practical for fieldwork applications. For scientific purposes, both per wet
biosolids and per dry TS bûsis should be used.
4.4 Total Soiids Concentration Changes
The total solids concentration of the dewatered biosolids from NEWPCC ranges from 25
to 36%. The TS are usually higher in summer and lower in winter. It is believed that TS
' above 50% could be detrimental to the survival of microorganisms (Al-Azawi, 1985 aiid
Ahmed et al., 1995). Solid testing in of this study showed that both quicklime and fly ash
addition caused an increase in biosolids TS. But the method of increase was different.
Quick lime addition resulted in the increase of TS in biosolids. This function occurred in
two phases. The first phase was water removal. As Formula 4-1 shows, lime reacts with
water to remove water from the biosolids. Theoretically, 1 g of Ca0 removes 0.32 g of
water. In the second phase Ca(OH)2 increases the solid content in the biosolids. 1 g Ca0
addition adds 1.32 g calcium hydroxide to the biosolids (Christy, 1990). Figure 4-17 0
shows the cornparison between TS calculated according to the chernical reaction formula
and test TS results which were obtained on biosolids samples having an initial TS of
3 1-8%.
Fly ash addition increases the final TS of treated biosolids. Unlike lime addition, TS
increase with fly ash addition results mainly fiom the addition of solids in the fly ash.
Water removed by Ca(OH)2 formation is very limited with this material because the
alkaline components in fly ash are very low. Based on these characteristics, the TS 0
increases are predictable for both lime and fly ash addition.

O 300 600 900 1200 1800 2100
Fly r ih dore (@kg TS)
Figure 4-18 The influence of initial TS of biosolids on the TS a b r fly aah addition

0 Table 4-8 Lime and fly ash dose needed for the solids to reach 50% TS level
To meet the minimum US EPA Class A limit in alkali-treated biosolids of 50% TS, the
- corresponding alkali dosages at different biosolids TS concentration are listed in Table 4-
8. The results indicate that it is not feasible to quick dry biosolids to above 50% TS with
lime addition. First, it would be too costly using lime. For exarnple, starting with a
biosolids TS of 32% , a dose of 686gIkg biosolids TS lime dose is needed to increase the
TS to 50% level. This high dose may result in the temperature of biosolids increasing
70°C theoretically and pH above 12.5. This increase is unnecessary since a temperature
increase of only about 20°C is needed with the 150 gkg TS dose and pH above 12 with
60 g/kg TS. Secondly, the biosolids treated with such high lime dose may not be suitable
'as a soil amendment because of its high pH and stone-like formation when it is dry.
Quick drying with fly ash is another alternative. At the same biosolids TS concentration
as cited in the above exarnple, 1125 glkg biosolids (on dry weight basis) fly ash dose is
needed. In this case, the pH of biosolids will be 10.5 which is enough to reduce the FC
density to less than 1000 MPN/g dry solid. Furthemore, when the biosolids dry, it is soil-
like. Figure 4- 18 shows the effect of fly ash addition on the final TS of treated biosolids.
Original TS (%) 25
gk3 Ts 1 giùg wet sludge Lime 1219
Fly ash 2000
Lime 305
Fly ash 500

Chapt er 5
CONCLUSIONS
O
1. The minimum quicklime (Cao) dose for inactivating fecal coliform (FC) bacteria to
less than IOOOMPNIg TS (US EPA Class A biosolids criteria) was found to be 20
g!kg TS when the s m p l e s were packed in closed cups and kept at the r o m
temperature for 24 hours. FC inactivation time was shortened to 2 hours when
quicklime dose was increased to 30 glkg. These conclusions are based sample TS of
3 1.8%.
2. The inactivation dose was dependent on the total solid concentration in the biosolids.
The higher the TS of the biosolids the lower the aikali dose was needed to inactivate O
FC, and vice versa.
3. The inactivation of fecal colifoms was related to the pH of the biosolids. It was
found that the fecal coliform inactivation pH was about 9.0. At pH of 9.5, fecal
colifons would be inactivated in one day. If the pH increased to about 10.5, the fecal
coliform inactivation time to below the detection limit was 2 h. A pH above 12 would
result in fecal coliform inactivation in 15 minutes.
4. The pH of treated biosolids has an approximate linear relation with lime dose. This
linear relation is affecteci by the total solid concentration of the biosolids. To obtain a 0
specific pH, biosolids with a lower total solid percentage need a higher lime dose and
vice versa. The lime dose requirement can be predicted based on the linear relation.
To obtain a pH above 12, a quicklime dose of 60 to 70 @kg TS is needed for
biosolids in the 32 to 27% TS range.

5. Fly ash (fiom the Brandon Generating Station) used in this study contained 2 to 2.5%
alkaii components. The fly ash dose required for fecal coliform inactivation ranged
from 600 to 900 g/kg TS (sarnples TS at 26.8%). This high dose caused the quantity
of treated biosolids to increase by 60 to 90%. At present, the fly ash used in this study
is not suggested to be used in biosolids disinfection in City of Winnipeg because
further risk evaiuation over heavy metals and toxic materiai shouid bc: conducted. 0
6. Adding quick lime to increase the temperature of biosolids is questionable from the
economically. Approximately 3. lg of quicklime is required to raise the temperature
of biosolids by 1 OC for biosolids in the 27% to 36% range. The lime dose for
increasing the temperature from 35 to 52 O C is 43g/kg wet biosolids, which is
equivalent to 170 to 130 g/kg TS for biosolids at 25 to 33 %TS. Lime doses in this
range are five times that for fecal coliform inactivation and double those required to
raise the pH above 12.
7. The TS content of lime or fiy ash treated biosolids can be predicted as follows: 1 g of *
Ca0 addition will remove 0.32 g of water and increase 1.32 g of solids in biosolids. 1
g of added fly ash increases the TS in biosolids by 1 g.
8. The lime doses for fecal coliform inactivation, pH above 12 and temperature above
52OC found in this study were far lower than those previously reported. Test
conditions were important. Suficient mixing is required to produce a homogeneous
mixture; ainight reacton to avoid pH drop and ammonia nlease and Styrofoam
insulation to reduce heat loss.
.9. An estimated muai cost of lime use by City of Winnipeg is approximately $93,100
per year. The cost estimation is based on following:

Quantity of raw biosolids: 44,000 wet ton Average TS of biosolids: 27% Quicklime dose: 70glkg TS Pice of quicklime: $1 1 2/ton

Chapter 6
SUGGESTIONS FOR FUTURE STUDY
This study was conducted in bench scale. The reactors used were 250mL and
2500mL. The results obtained in this study need to be confirmed by larger pilot scaie
studies.
Air drying studies on lime treated biosolids to observe pH change. If pH drops during
drying, checking for pathogen re-growth will be necessary. If pH does not decrease
significantly, dry biosolids should be blended with farmland soi1 to check for pH
changes.
Constmct a computer program (model) based on the data obtained from this study to
predict the effectiveness of the lime treatment process. The data in this program
should include initial and final pH, TS, FC density, and temperature of biosolids as
well as estimation of the operating costs.
Studying fecal colifomis test methods. Conduct the studies by comparing MTF and
SPC at different FC densities. lmprove the procedure for SPC, such as seeding
volume of sample, sample dilution method.
Investigate the optimum combination dose of lime and fly ash addition for which
pathogen inactivation, pH, temperature, and total solids requirements are met
economicallv.

Chapter 7
ENGINEENNG SIGNIFICANCE
An increased understanding of the concept of pathogen inactivation with low lime dosage
was accomplished. Fecal coliform density dropped from 2 x 10' to 600 CFUIg TS with a
iime dose of 30 g/kg TS in one day. No pathogen regrowth was detected in the foiiowing
- six months when stored in closed containers at room temperature. Pathogen inactivation
met the US EPA Class A requirement for fecal coliform density. The lime dose employed
in this study was much lower than the doses that were reported in previous literatures for
PSRF'.
Low lime dose inactivation has two main advantages: one economical and the other
technical. First, low lime dose inactivation reduces the cost of lime and the related
operational costs. Secondly, low Lime dose results in low alkaline residual in biosolids,
Owhich will improve the applicability or even the marketability of treated biosolids.
Sufficient mixing, insulated equipment (mixer and hopper) and close operational control
are the key points of low lime inactivation. These factors reduce heat loss and ammonia
release as well as retain a high pH.
In Winnipeg, storing biosolids at natural temperature during winter does little towards
pathogen inactivation. The potential problem of wînter storage may cause leachate
release. In this study, the quantity of leachate nleased d u h g storage was about 10% of m
the mass of biosolids.

Ahrned, A. U. and Sorensen, D. L., (1977) "Autoheating and Pathogen Destruction
During Storage of Dewatered Biosolids with Minimal Mixing", J. Water
Environment Research, F e b r u q , 78
Ahrned, A. U. & Sorensem, D. L., (1995) "Kinetics of Pathogen destruction during
storage of dewatered biosolids", Water Environment Research 67, 145 O
-41-Azawi, S. K. A. (1 986) "Bacteriologic Analysis of Stored Aerobic Sewage Sludge",
Agricultural Wastes 16, 77
APHA, (1998) "Standard Methods for the Examination of Water and Waste Water" 20"
ed., 9-48,49.
Bumham, J. C., Hatfield, N., B e ~ e t t , G.F., and Logan, T. J., (1992) "Use of' Kiln Dust 0
with Quicklime for Effective Municipal Sludge Pasteurkation and stabilization
with the N-Viro Soi1 Process" Innovations and Uses for Lime, ASTM STP 1 135,
D. D.
Bujoczek, G. (1 999) FC Laboratory Record, University of Manitoba, Department of Civil
Engineering

Christy, R. W. (1990) Sludge disposa1 using lime, Water Environment and Technology,
v.2, n.4, 56-6 1
*
Dahab, M.F. et al. (1998) Microbiological Stabilization of Biosolids by Anaerobic
Digestion, University of Nebnska, 4
Egmen, E and Yurteri, C., (1998) Regulatory Leaching Tests for Fly ash: A case Study,
Waste Management & Research, vol. 14.
Feliciano, D. V. (1982) Sludge on Land, J. Water Pollution Control Fed.. 54, 1259
Finstein, M. S. (1987) Analysis of EPA Guidance on Composting Sludge-part III.
Biocycle, March, 38-44 O
Fisher Scientific, (1993) Fisher Catalogue,
Foess, W. G. et al. (1 994) Evaluating Biosolids Stabilization Technologies, Water
Environment & Technology, April
Gillespie, R. J. et al. (1986) Chemistry, Allyn and Bacon, Inc., Boston, 271-533.
*
Gotaas, H. B. (1956) Composting-Sanitary disposal and reclamation of solid wastes.,
World Health Organization, No. 3 1, Geneva,.

Gould, G. W. et al. (1969) The Bacterial Spore, Academic Press, London, 639, 565
Haug, R. T. (1993) The practical handbook of compost engineering. Lewis Publishers,
Boca Raton, Florida, 1 p.
Ho, T. (1997) Joint project defines sewage biosolids stabilization criteria. Env. Sci. &
Engin., Nov., 34-35 0
Kiely, G. (1 997) Environmental Engineering, The McGraw-Hill Companies, London,
574 p.
Lue-Hing, C., et al. (1992) Eds., Municipal Sewage Sludge Management: Processing,
Utilization and Disposal, Technomic Publishing Co., Inc., Lancaster, Pa.
Lue-Hing, C., et al. (1998) Eds, Municipal Sewage Sludge Management: A Reference *
Text on Processing, Utilization and Disposal., Technomic Publishing Co., Inc.,
Lancaster, Pa. 320-333
Metcalf & Eddy (1991) Wastewater Engineering, Treatment, Disposal, and Reuse,
Imin/McGraw-Hill, NY, 8 1 2 p.
Oleszkiewicz, J. A. (1998) Top-Soi1 fiom Biosolids - Grant Application: City of
Winnipeg, University of Manitoba, 1 p. 0

Pereria-Neto, J. T. et al. (1987) Pathogen swival in a refuse and sludge forced aeration
O compost system. CheE Symposium, Series No.96,373-391
Prescon, L. M. et al. (1996) Microbiology 3rd edition, Wm. C. Brown Publishers , 125-
127
Rûcz, G. J. (1997) Laboratory Manuai for Chemicai Analysis of Soil, University of
Manitoba, Department of Soil Science, 2 p.
' Reimers, R. S., et al. (1997) Disinfection of Pathogens by Biosolids Processing, US EPA
Region VI, Biosolids Stabilization and Disinfection-What are our concems,
Water Environment Federation, Alexandria, VA (Dallas, TX), 1 - 4.
Reimers, R. S. et al. (1998) Current/ Future Advances in Biosolids Disinfection
Processing, WEF Symposium Biosolids Disinfection - Current and Future Trends
Session 56.4 p.
0
Roediger, H. (1987) Using Quicklirne - Hygienization and Solidification of Dewatered
Sludge, Operations Form, April
Spron, D. (1985) Ammonia/Potassium Exchange in Methanogenic Bacteria, Science
Dimension, May.

Stone, L.A., et al. (1992) The Historical Development of Alkaline Stabilization. Paper
presented at Water Environ. Fed. Spec. Conf., Future Dir. Munic. Sludge
(Biosolids) Manage.: Where We Are and Where We're Going, Portland, Oreg.
* US EPA (1 993) Standards for the Use or Disposal of Sewage Sludge. Fed. Resgist.
US EPA (1989) 1988 Needs S w e y of Municipal Wastewater Treatment Facilities, US
EPA 430109-89-001. Cincinnati, Ohio, US EPA
Walker, Jr. et al. (1992) Eds., American Society for Testing and Materials, Philadelphia,
128-141.
0
WEF, ( 1995) Wastewater Residuals Stubilization, Water Environment Federation,
Alexandria, Va., 1 55- 1 89.
WEF (1998) Design of Municipal Wastewater Plants 4th, WEF Manual of Practice 8
ASCE Manual and Report on Engineering Practice No. 76.22- 1 87

APPENDIX A
EXPERIMENTAL DATA

Sample pick up on Monday, May 14,1999 fmm NEWPCC,Winnipeg Original TS 31.8%
With no lime addition FC Colony Count with O. 1 ml of sample
With 20cr/ka TS lime addition FC Colonv Count with O. 1 ml of sarn~le " - L
Time of Sampling 1 Sample Dilutions r
date 1 time 1 stoted 1 1 O 1 IO* 1 i o a 1 10- 1 1 O= L I 1 L
8-Jun 15:15 O 1 206,238 16,12 1 4 . 4 0 ~ 1 0 ~ 1
8-Jun 16:15 Ihour 1 121. 120 7 . 8
1 undra*ld 1 undatocîed
86day 1 0,O 191 day 1 0, 0
10-Aug 24-NOV
,.
-

With 120glkg TS lime addition FC Colony Count with 0.1 ml of sample Time of Sampling Sample Dilutions
date time stored 1 O IV 1 O' 1 O' i O"
23-May 15:25 O too many 56,45 -
6, 7 23-May
' 1540 15 min 0, 2 0. 0
23-May 16:25 1 hout 0, 0 23-May 17:25 2 hour O, O 14-Jun 22day 0,O 23-Jul 63day 0,O 1 O-Aug 82day 0.0 24-Nov 187dav 0.0 1
CF Ulg TS
1 . 5 9 ~ 1 O'
With 15Ogîkg TS lime addition FC Colony Count with 0.1 ml of sample FC
c~urg TS
2.53x10r
und~teaad undrteded
1
undrtactct undetedeâ
undetecteâ
unûetsdoâ undotactad
Tirne of Sampling 1 Sample Dilutions date
' 25-May 1
25-May 25-May 25-May 14-Jun
L
23-Jul t O-Aug 24-Nov
tirne 13:OO 13:15 14:OO 15:00
storsd 1 t O 10- 1 i O=
O 15 min 1 hour 2 hout 20 day 59 day 80day 185 day
t r 1 i O=
96.67 0, O 0, 0 O, O 0, O 0, O 0,O 0, 0
- 11. 5 too mrny

With 240glkg TS lime addition FC Colony Count with 0.1 ml of sample
Wth 480glkg TS lime addition FC Colony Count with 0.1 ml of sarnple
Tirne of Sampling date
I
2-Jun 2-Jun 2-Jun 3-Jun 14-Jun
1
23-Jul . 1 O-Aug
I
24-Nov
L Time of Sampling
FC c~utg r s
I 2.98~10' 3 . 1 4 ~ 1 0 ~
1
undstected , undetected undetedsd
undetected
undcteded undetscted
Sample Dilutions time 1 stored
FC CFUlg TS
t -64x1 o7 undetactecl
undetected
undeteded
undetactcd
undstedsd
undetected undetected
O 15min lhour 1 day 10 day 49 day 68 day 170 day
date I
2-Jun 2-Jun 2-Jun 3-.iun
I
14-3un 23-Jul 1 O-Aug 24-Nov
2
Sample Dilutions
1 O
0: 1 13:OO 13:15 14:OO 13:OO
c 11:15 1130 12:15 i i : 1s
10
0, 0 0, 0 0,o olo 0, 0 0,o 0, 0
0, 0 0,o O, 0 0 ,o O,O 0, 0
- O
15min Ihour 1day 11 day 51 day 70day 172 day
10- 1 1 O= IO' -
98, f O t 1
1 O'
too many 11,7
10
52,52
0 too many
1 O

Sampk pick up on Wednesday, June 23,1999 from NEWPCC,Wlnnlpeg Original TS 26.8%
With 300 gikg TS fly ash addition FC Colony Count with O. 1 ml of sample h Time of Samdina I Samole Dilutions 1 FC 1
- - 1-JuI -
C
2 day too many tw many 83,78 8,7 2 . 8 9 ~ 1 0 ~
3-Jul 4 day too many too many 64,69 2 .48~1 o7 6-Jul 7 day too many 55,54 2.01xto7
9-Jul tOday - too many 55,51 1.98xi 0'
With 600 alka TS fiv ash addition
CFUI~ TS
6.42~10' ' 3 . 0 1 ~ 1 0 ~
- - - - 1
r .I I r -
FC Colonv Count with O. 1 ml of sam~le
date 1 time 29-Jun 1 30-Jun 1
With 900 u/ka TS flv ash addition FC Colony Count with 0.1 ml of sample
. - - - " - , - - , - I
i O'
too many taa many
10'
too many tao many
stoted O day 1 day
FC CFUI(I TS
6.04~10'
1 .75x107
1 .55x107
1 .34x10a
3 .64~1 o3 undebded
1 -
1 O
tao many
Time of Sampling
- 1 O'
162, 182 101, 85
Sample Dilutions date
29-3un 30-Jun 1 -Jul 3-Jul 6-Jul
FC c~urg rs 4.48~10'
i . s i ~ i o ~ 1 .36x104
undeteciad u n d ~ t r d d undetected
i O"
23, 24 7, 7
IO
too many tao many
11,9,9 O I 0 , O
L
Time of Sampling
time
Sample Dilutions date
29-Jun 30-Jun 1 -Jul 3-Jul
stored O day 1 day 2 day 4 day 7day
9-Jul 1
IO
too many 40,34,36
0,0,0
time [ stored O day 1 day ,
2 day 4 day
I
6-Jul 1
9-JuI
1 oz 17, 15 3, 4
10day
10. 1 10. 1 1 O'
7 day 1 0. O 10day 1 0,O
too many too many ' too many too many
2, 1 0, 0
i O'
too many too many
3,3
too many too many too rnany
35,37 0, 0
i O'
too many too rnany
& O
167,157 69.61 43,40
1,4
1 O-
' 123,116 30,30
1 O"
9 , i O 5, 4

Sampk pick up on Wednrdry, Slptmrnbr 29,1999 from NEWPCC,Winnipeg Oltginal TS 25.4%
Se~t . 29 FC test CFU count
Fmars rtonge CFU count Oct 1. 1999 after 1 dav freeze
dilution volume (ml)
plate 1 date 2
Oct. 9, 1999 after 9 dav freeze
dilution L
volume (ml) plate 1 'date 2
1 O= 0.2
uncountabîe uncountabie
dilution volume (ml)
I
plate 1 date 2
Oct. 22. 1999 after 22 dav freeze
1 O' o. 1
many rnanv
1 o4
Oct. 18,1999 after 18 day freeze
0.2 38 33
1 o5
0.2 many manv
O. 1 18 14
0.2 2 3
1 O" O* 1
75 69
1 o4
. dilution volume(rnl)
1
plate 1 'plate 2
0.1 1 O
0.2 13 15
1 O"
0.2
1 o6 1
dilution
o. 1 8 8
0.2 1 O
1 o5 o. 1
48 42
0.2
1 O' 0.2
o. 1 O O
0.2 10 8
1 os
o. 1 1 0'
o. 1
1
. , o. 1 6 5
0.2
1 o5 0.2
0
O. 1
1
0.2 7
o. 1 31 22
O. 1 2
volume (ml)
plate 1 1
plate 2
0.2 5 3-
o. 1 0.2 o. 1 22 21

Nov. 3, 1999 after 34 dav freeze
Dec. 29, 1999 after 90 dav freeze
- - - -
1 I
Dec. 7, 1999 after 68 day freeze
volume (ml)
plate 1 date 2
dilution volume (ml)
plate 1 date 2
Cool stonge CF U count Oct 1. 1999 after 1 dav stored at 4OC
0.2 46 41
dilution L
v o l u ~ (ml)
plate 1 r
date 2
O. 1 22 18
0.2 0.2 O. 1 0.1 many manv
1 o3
dilution vo~urna (ml)
1
plate 1 L
date 2
0.2
1 O=
Oct 22, 1999 atîer 22 day stored at 4OC
1 O' 0.1
many man^
0.2
0.2 40 41
1 o5
1 O' O. 1
man y manv
1 O'
dilution 1 O'
O. 1 20 18
0.2
0.2 36
1 o5 I
0.2 uncounlrbk uncounîabk
los 1 o6 - E r - m - 0.2 O. 1 volume (mi)
plate 1 many plate 2 many
0.1
o. 1 15
0.2
1 os 0.1
many manv
11 7
56- 48-
3 8 ~ 15
o. 1
0.2 34 32
1 o6 l
1 O O O
O. 1 9 5
0.2 1 O
0.1

Nov. 3, 1999 aller 34 day stored at 4OC
Dec. 7. 1999 after 68 dav stored at 4OC
dilution volume (ml) plate 1 plate 2
Dec. 29, 1999 atter 90 dav stored at 4OC
#
1 o3
dilution volume (ml) plate 1 . plate 2
Room ternpntun stonge CFU count Oct 1, 1999 after 1 day stored at 23OC
0.2 unauntable unmuntabb
dilution 1
volurne (ml)
plate 1 2
O. 1 uncauntobls unwuntabîa
1 0'
Oct 22. 1999 after 22 dav stored at 23OC
0.2 many manv
1 o5
-
O. 1 77 72
0.2 20 18
1 o3 1 o5
1 o3
dilution 'voiunn (mi) plate 1 plate 2
O. 1
0.2 uncountabb uncountable
1 O' 0.2
22 20
0.2 uncountabb unaunûabb
.
o. 1 uncaunlable uncountabk
0.2 many many
0.1
O. 1 uncountabk
ycountabb
1 O'
1 O' 1 os
0.1 73 69
0.2 many many
1 o5
0.2 many rnany
O* 2 25 23
J
1 o6
dilution volume (ml) plate 1 plate 2
O. 1 67 63
0.2
o. 1 many many
0.1 9
13
0.2
-
1 os
O. 1
O. 1
0.2 1 o4
o. 1 0.2 many many
1 os o. 1
93 90
0.2 22 19
o. 1 9 8

Nov. 3. 1999 after 34 dav stored at 23OC
Dec. 29. 1999 aRer 90 dav stored at 23OC
dilution volume (mi) plate 1 plate 2
Dac. 7. 1 999 afier 68 day stored at 23OC dilution volume (ml)
1
plate 1 'plate 2
1 O= 1 O'
dilution volume (ml) plate 1 plate 2
0.2 41 38
0.2 5 4
1 os .
1
O. 1 20 20
O,? 3 1
0.2 O O
10
FC derrsity was below 300 CFU/g TS
O. 1
O , O
0.2 9 7
10
0.1 3 2
1 o2
0.2 O O
0.2 1 O
1 o3
o. 1 O O
1 o2
O. 1 O O
0.2 O O
0.2 O O
1 o3 4
o. 1
o. 1 O O
0.2 O* 1 !

Sample wrs pickoâ up on Turrdry, Fob.9,1988 from NEWPCC, Winnipeg
Tot81 roiid8 and volatile solid8 to8t cnrsible+ after afier
Time crusible biosolids oven furnace TS VS
12-Feb 83.96 89.81 85.39 84.62 24.44 53.85 90.77 97.53 92.46 91.59 25.00 51.48
Averaqe 24.59 52.30
Average 25.18 50.54 Oay 60 25.09 26.96 25.56 25.32 25.13 51.06
A v e r a g e 24.83 50.76 Day 163. 24.5031 36.5194 27.7209 26.1952 26.78 47.41
21-Ju~ 24,1932 35.2945 27.0052 25.6805 25.33 47.11
24.9287 41 .go97 29.032 27.0772 24.16 47.64 24.0547 34.0114 26.4993 25.3332 24.55 47.70
Average 25.21 47.47 ' At the end of the test, 62 g teachate was obtained from 1925 g sample.

Sample wrs picked up on Friday Feb.23,1989 fmm NEWPCC, Winnipeg
Total solids and volatile rolids tast crucible+ after afier
Tirne crucible biosolids oven furnace TS VS W.(@ M m M.(@ wt.(g) ‘!40 %
Day 46 27.46 28.91 27.87 27.67 28.28 48.78 9-Apr 25.09 29.36 26.29 25.72 28.10 47.50
23.48 26.41 24.31 23.91 28.33 48.19 24.24 26.25 24.8 24.54 27.86 46.42 24.1 27.1 1 24.95 24.55 28.24 47.06 26.23 28.38 26.84 26.56 28.37 45.90
Aveage 47.31
Sample with 135glkg wet (478.7glkg TS) Total solid8 and volatile solids teat with difieront lime dose
28-Jun crucible+ after after lime dose crucible biosolids oven furnace TS VS 9/kg wet wt- (g) W. (9) wt- (g) W. (9) % %
135 27.452 38.5689 31.9898 31 .O737 40.82 20.19 135 25.0794 40.4226 31.374 30.0966 41.03 20.29
40.92 20.24 -

Sample wrs pkkad up on Fildry, Mamh 5,1899 ftom NEWPCC, Winnipeg
Total rolidr and volatile 8oîid8 toat cruci ble+ after after
Time crucible biosolids oven fumace TS VS wt. (9) W. (g) wt. (g) W. (g) O/o Oh
Day 4 15.99 21.95 17.7 16.88 28.69 47.95 8-Mar 17.77 21.51 18.81 18.32 27.81 47.12
17.25 19.17 17.8 17.55 28.65 45.46 15.46 18.35 16.28 15.9 28.27 46.34
Avera e 28.36 46.72 4 10-Mar 1 7.2468 19.386 17 .a601 l7.574l 28.67 46.63
14.7057 16.4073 15.192 14.9666 28.58 46.35 16.161 1 18.1924 16.7576 16.4775 29.36 46.96
. 2 8 . 7 3 46.56

Sample w r picked up on Monday, May 10,1899 from NEWPCC, Winnipeg
Total solid8 and volatile 8olid8 test crucible+ after afier
Time crucible biosolids oven furnace TS VS (9) W. (9) M. (g) M. (g) % %
Day 1 24.3654 25.9967 24.9567 24.7566 36.25 33.84 22.7737 24.4999 23.3985 23.1 878 25.9637 27.6368 26.5698 26.3652 24.2674 25.8645 24.8436 24.6501 25.8527 27.1 55 26.3266 26.1674 23.6673 24.9233 24.1243 23.9692 26.7974 28.0595 27.256 27.102 23.9676 25.2664 24.4402 24.281 3
Average
Total 8olide and volatile solid8 teat with diffenrrt lime dose 15-Jun crucible+ after afier
limedose crucible biosolids oven furnace TS VS
1 S changes in aie temperature test with 135ghg wet (372.1 glkg dry) O
Total aollda and volritik 8oltd8 tnt wtth difhnnt lima dœe 284un crucible+ after after
lime dose crucible b i l i d s oven fumace TS VS g k g wet W. (g) wt. (9) M. (g) w t (g) % %
135 25.0895 36,8297 30.7026 29.6438 47.81 15.30

Total solids and volatile solide test wHh different f y rsh dose 29-Jun crucible+ after after
fly ash crucible biosolids oven furnace TS VS

Srmplr war p k k d up on Mondry, May 14,1999 from NEWPCC, Winnipeg
Total solids and volatile solida te8t crucible+ after after
Time crucible biosolids oven furnace TS VS
Before 25.5802 28.9294 26.6422 26.2447 31 -71 37.43 stored in 25.7555 27.0993 26.1806 26.0218 31.64 37.35
cool 26.1659 28.2585 26.8308 26.582 31.77 37.42 chamber 23.5581 25.6863 24.2363 23.9795 31.84 37.86
24.8864 27.144 25.6031 25.3331 31.75 37.67 Avera e 31.73 37.52
a 1 31.68 37.70 19-May 26.229 29.5627 27.289 26.8943 31 .$O 37.23 Avera e 31.74 37.47 3 20-May 22.7743 27.7465 24.3437 23.7507 31.56 37.78 Average 31.51 37.67
-
Day 16 23.4733 33.7203 26.7055 25.5291 31.54 36.40 3-Jun 24.2339 33.3967 27.0907 26.0509 31.18 36.40
Average 31.36 36.40 Day 27 27.4521 37.7153 30.7971 29.633 32.59 34.80
TS changes with different lime doses Sample with 20 glkg TS
Total solids and volatile 80lid8 tmt crucible+ after afîer
0 Tme crucible biosolids oven fumace TS VS W. (9) M. (g) wt* (g) wt. (SI) % %
Day 7 24.1002 36.6121 28.0032 26.6471 31 . l 9 34.75
A v v 4 4 34.78 Day 117 25.099 34.7483 28.0282 27.0502 30.36 33.39 16-Sep 26.0989 35.1474 28.8285 27.91 77 30.17 33.37
Averaae 30.26 33.38

Sample with 30 glkg TS Total solids and volatile aolids test
crucible+ after after Ti me crucible biosolids oven furnace TS VS
(8) (g) W. (g) M. (g) % % Day 1 24.3655 27.0394 25.2384 24.922 32.64 36.25
Average 32.62 36.17 -
Day 16 26.797 32.8218 28.7522 28.0573 32.25 35.85 23.967 33.1 193 26.9648 25.8887 32.75 35.9
Average 32.50 35.88 Day 27 24.3653 36.1921 X I 6 9 2 26.848 32.16 34.73
22.773 33.8961 26.3715 25.131 32.35 34.47 Average 32.26 34.60 0
22.969 39.0041 28.1 508 26.3056 32.32 35.61 Average 32.41 35.56
Sample with 60 glkg TS Total solids and volatils sollds test
crucible+ aïter aiter Time crucible biosolids oven fumace TS VS
(9) (g) (9) (SI) Oh YO Dayl 25.8531 29.1495 26.9637 26.5741 33.69 35.08
21 -May 23.6676 26.2054 24.5225 24.2203 33.69 35.35 Average 33.69 35.22 Dayl4 26.09-9
-
3-Jun 23.2997 29.4238 25.3904 24.6551 34.14 35.1 7 Average 34.15 35.71 1
14-Jun 24.2674 36.3129 28.291 1 26.9338 33.40 33.73 Average 33.38 33.70 Day25 27.4522 43.221 5 32.7931 30.951 2 33.87 34.49 16-Sep 25.0789 41.9197 30.7851 28.8161 33.88 34.51
Average 33.88 34.50

Sample with 120 glkg TS Total solidr and volatile solid8 test
crucible+ after afîer Time crucible biosolids oven fumace TS VS
(9) (g) (g) (g) % 940 Day 23 25.8521 35.0723 29.0731 28.0957 34.93 30.35
Average 35.02 30.22 Day 117 23.473 40.5072 29.4634 27.5727 35.17 31.56 t 6-Sep 24.2339 38.3984 29.2727 27.6962 35.57 31 .29
Average 35.37 31.42
Sample with 150 g/kg TS Total rolidr and volatile aolidr test
cruci ble+ after after Time crucible biosolids aven furnace TS VS
wt. (9) (a wt. (g) W. (g) Y0 % Day 21 23.5679 33.7785 27.2443 26.2067 36.01 28.22 14-Jun 25.5799 39.71 3 30.6382 29.2013 35.79 28.41
Average 35.90 28.32 - Day 115 24.1 42.6823 30.8392 28.8554 36.27 29.44 16-Sep 26.229 43.8146 32.5844 30.7086 36.14 29.52
Averaae 36.20 29.48
Sample with 240 glkg TS Total rolids and volrtik solids tmt
crucible+ after alter Time cruci ble biosolids oven furnace TS VS
W. (9) W. (g) M. (9) (9) % % Day 2 25.0795 30.5162 27.1883 26.6704 38.79 24.56 3-Jun 22.575 35.6524 27.6378 26.4042 38.71 24.37
38.75 24.47 Day 12 25.7558 34.7509 29.1642 28.3625 37.89 23.52 14-Jun 26.1662 38.5463 30.9041 29.8032 38.27 23.24 0
Day106 24.3653 42.0169 31.216 29.574 38.81 23.97 l6-Sep 22.7735 38.6721 28.9898 27.4777 39.1 O 24.32
Average 38.95 24.15
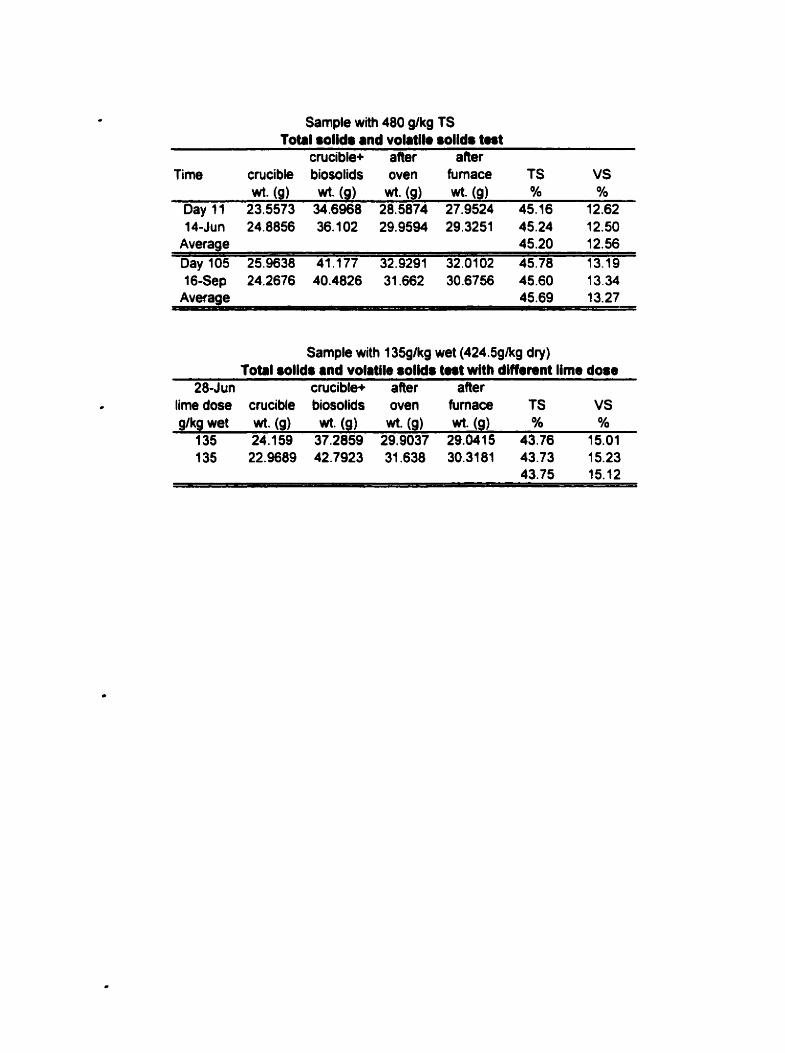
Sample with 480 glkg TS Total solida and volatile rolldm to8t
crucible+ after a fier Time crucible biosolids oven furnace TS VS
(9) (g) M. (g) wt- (g) % % Day 11 23.5573 34.6968 28.5874 27.9524 45.16 12.62 14-Jun 24.8856 36.1 02 29.9594 29.3251 45.24 12.50
Average 45.20 12.56 Day 105 25.9638 41.477 32.9291 32.0102 45.78 13.19 16-Sep 24.2676 40.4826 31 562 30.6756 45.60 1 3.34
Average 45.69 13.27
Sample with 135glkg wet (424.5gIkg dry) Total solidr and volatile rolldr tmt with diffemnt lime doue
28-Jun crucible+ after after lime dose crucible biosolids oven furnace TS VS glkg wet wt. (g) wt. (g) wt. (g) wt. (g) % %
135 24.1 59 37.2859 29.9037 29.041 5 43.76 15.01 135 22.9689 42.7923 31.638 30.3181 43.73 15.23
43.75 15.12

Sample wam picked up on Wednesday, June 23,1999 from NEWPCC, Winnipeg
1 otal aolids and volatile solids tast crucible+ after aiter
Time crucible biosolids oven furnace TS VS (9) (9) M. (g) W. (9) % %
Before 23.568 39.4024 27.81 O7 25.8609 26.79 45.96 put in 25.5799 40.1 127 29.4823 27.6878 cool 25.7553 41 .go28 30.083 28.0998
chamber 26.1656 39.41 39 29.7205 28.0942 23.5577 43.561 7 28.9234 26.4599 24.8857 39.4741 28.798 27.0091 23.4255 36.221 1 26.8684 25.2985 25.5378 38.7534 29.0742 27.4604
Average
Sample with 60 glkg TS of laboratory lime, commercial lime or fiy ash
Total 8olid8 and volatile 8olids test crucible+ after after
Time crucible biosolids oven furnace TS VS 25-Jun wt. (g) wt. (g) wt. (g) wt. (g) Oh % lab. 25.8525 37.4578 29.2131 27.8062 28.96 41.86 lime 23.6671 37.5159 27.6538 25.9855 28.79 41.85
Average 28.87 41.86 corn. 26.7971 39.776 30.5426 28.979 28.86 41.75 lime 23.9677 40.9852 28.8703 26.8166 28.81 41.89
Avera e 28.83 41.82 8 27.92 42.93 1
23.2996 36.0297 26.8567 25.3255 27.94 43.05 Average 27.93 42.99
Sample with 135g/kg wet (503.7g/kg dry) Total aolids and volatile rollds tmt wlth diffennt lima do80
28-Jun crucible+ after aiter lime dose crucible biosolids oven furnace TS VS gkg wet wt. (9) wt. (g) W. (g) W. (g) % %
135 23.473 39.7663 29.9284 28.7731 39.62 17 .90

Total urlldr and volatile solidr t n t with difiennt fly r rh dore 29-Jun crucible+ after atter
fly ash crucible biosolids oven fumace TS VS

Sample w u plcked up on Wednrdry, Sept.29,1889 fiom NEWPCC, Winnipeg
Total 8olidr and volatile 80l id~ teat crucible+ after after
Tirne crucible biosolids oven furnace TS VS 29-Sep (g) W. (9) (g) W. (g) Y0 %
Before 25.0866 35.8239 27.81 35 26.3456 25.40 53.83 put in 24.3485 40.1122 28.3573 26.1892 25.43 54.08 cool 25.8527 44.8705 30.6747 28.0854 25.36 53.70
Average 25.39 53.87
Total solids and volatile solidr test crucible+ after a ft er
Time crucible biosolids oven furnace TS VS oct. 7 (9) (a M. (g) (g) % Y0
4OC 24.6687 40.2679 28.6564 26.5287 25.56 53.36 stored 25.6523 43.1673 30.0996 27.7327 25.39 53.22
24.4204 32.8t 59 26.5846 25.4307 25.78 53.32 Averaae 25.58 53.30
Total aolids and volrtik aolidm tut crucible+ after after
Time crucible biosolids oven furnace TS VS Dec. 7 (9) (g) W. (g) W. (g) % %
4 OC 24.3492 36.8973 27.5652 25.8716 25.63 52.66 stored 25.0872 38.5829 28.5387 26.7244 25.57 52.57
Average 25.60 52.61 thaw with 24.1008 36.8758 27.5264 25.6951 26.81 53.46 leachate 24.16 43.9983 29.3404 26.5525 26.1 1 53.82 Average 26.46 53,64 thaw no 23.5689 39.6482 28.2585 25.7579 29.1 7 53.32 kachate 25.8534 37.5676 29.2174 27.4285 28.72 53.1 8 Average 28.94 53.25
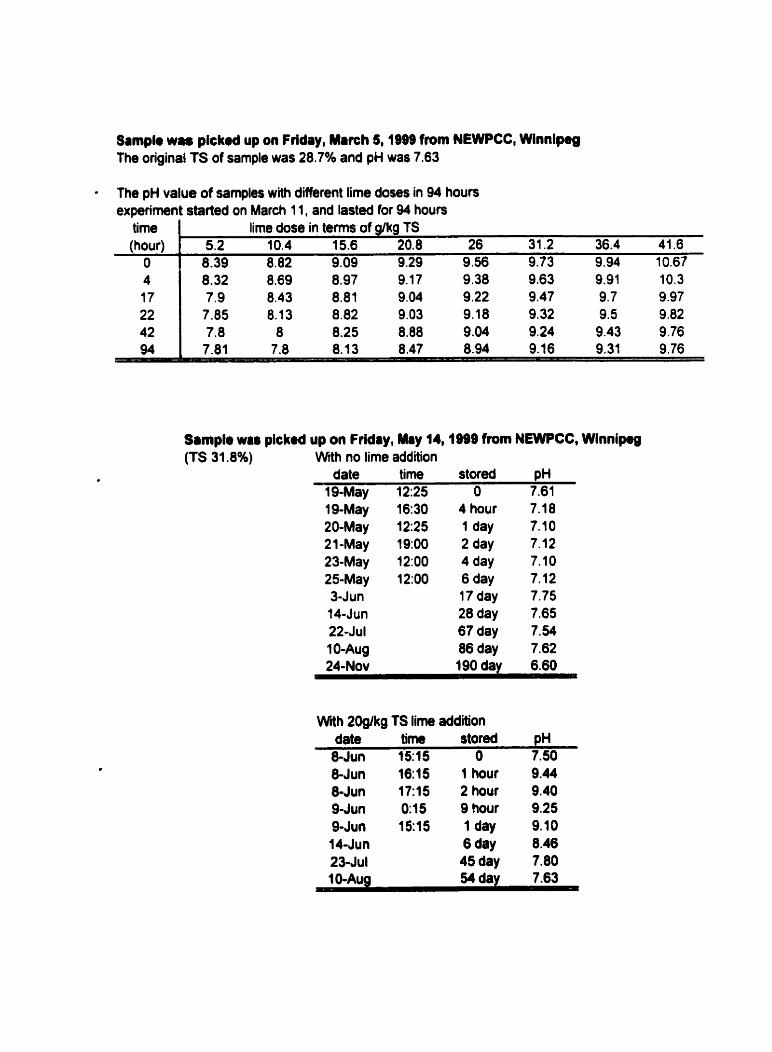
Sampk w u p k k d up on Friday, Mamh 6,1999 fmm NEWPCC, Winnipeg The original TS of sample was 28.7% and pH was 7.63
The pH v; ex perirnei
time (hour)
O 4 17 22 42 94
ue of samples with different lime doses in 94 hours : started on March 11, and lasted for 94 hours
lime dose in ternis of glkg TS 5.2 10.4 15.6 20.8 26 31.2 36.4 41.6 8.39 8.82 9.09 9.29 9.56 9.73 9.94 10.67 8.32 8.69 8.97 9.17 9.38 9.63 9.91 10.3 7.9 8.43 8.81 9.04 9.22 9.47 9.7 9.97 7.85 8.1 3 8.82 9.03 9.18 9.32 9.5 9.82 7.8 8 8.25 8.88 9.04 9.24 9.43 9.76 7.81 7.8 8.13 8.47 8.94 9.16 9.31 9.76
Sample w u plckrd up on Fridry, May 14,1919 fmm NEWPCC, Winnipeg (TS 31.8%) Wtth no lime addition
date time stored PH 19-May 12:25 O 7.61
16:30 4 hour 12:25 1 day 19:00 2 day 12:OO 4day 12:OO 6 day
17 day 28 day 67 day 86 day 190 day
With 20glkg TS lime addition date t i m stored pH
8-Jun 1515 O 7.50 8-Jun 1615 1 hout 9.44 8-Jun 17:15 2 hour 9.40 9-3un 0:lS 9 hour 9.25 9-Jun 15:15 1 day 9.10 14-Jun 6day 8.46 23-Jul 45day 7.80

With 30gJkg TS lime addition date time stored PH
19-May 12:25 O 7.61 19-May 12:40 15 10.67 19-May 13:25 60 10.65 19-May 14:37 120 10.47 19-May 16:25 240 10.40 20-May 12:25 2d 10.02 21-May 19:OO 3d 10.10 3-Jun 17d 9.60 14-Jun 28d 9.70 23-JuI 676 9.48 10-Aug 86d 9.44 24-NOV 191d 8.45
With 60gJkg TS lime addition date tirne stored PH
21-May 1525 O 7.12 21-May 1340 15min 12.30 21-May 16:25 1 hour 12.23 21-May l7:25 2 hour 12.25 22-May 17:30 1 day 12.42 23-May 0:00 2day 12.08 3-3 un 15day 11.60 14-Jun 26day 11.11 23-Jul 65day 11.28 1 O-Aug 84day 11.21 24-Nov 189day 10.97
With 120glicg TS lime addition date tirne stored
23-May 14:35 O 23-May 14:SO 15 min 23-May 1535 1 hour 23-May 16:35 2 hour 14-Jun 22 day 23-Jul 61 day 1 O-Aug 82 day 24-Nov 187 day

With 150glkg TS lime addition date time stored
25-May 13:OO O 25-May 13:15 15 25-May 14:15 60 25-May 15:15 120 14-Jun 20d 23-Jul 59d 10- AU^ 80d 24-NOV 186d
Wth 240gkg TS lime addition date tirne sotred
2-Jun 13:OO O
W~th 480g1kg TS lime addition date tirne stored
4-3un t l :15 O 4-Jun 1 l:3O 15 min 4-Jun 12:15 1 hour 5Jun 11:55 1 day 14-Jun 10 day 23Jul 49 day 1 O-Aug 68 day
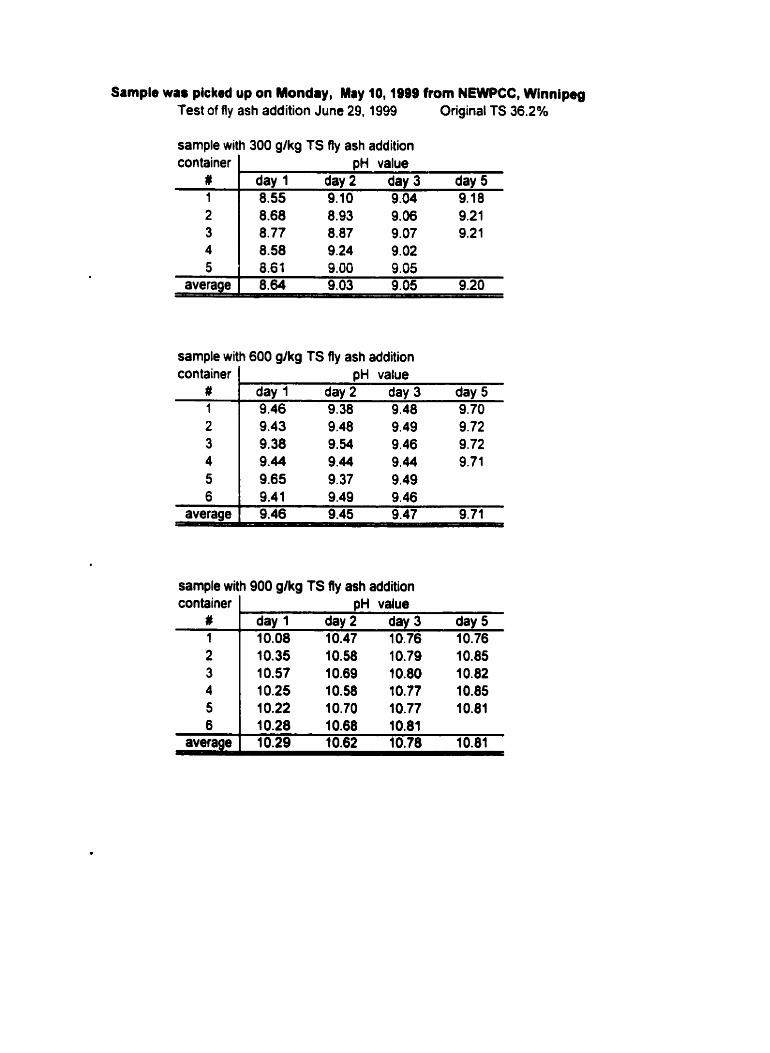
Sample was plcked up on Monday, May 10,1989 from NEWPCC, Winnipeg Test of fly ash addition June 29, 1999 Original TS 36.20h
sample with 300 glkg TS fly ash addition
sample with 600 glkg TS fly ash addition
container # 1
container #
pH value L
day 1 day 2 day 3 day 5 8.55 9.10 9.04 9.18
OH value T - - - - - - -
day 1 day 2 day 3 day 5 9.46 9.38 9.48 9.70
sample with 900 glkg TS fly ash addition container 1 DH value
average I 10.29 10.62 10.78 10.81
# 1
day 1 day 2 day 3 day 5 10.08 10.47 10.76 10.76

sample with 1200 glkg TS fly ash addition . container 1 DH value
sample with 1500 glkg TS fly ash addition
# 1
day 1 day 2 day 3 day 5 1 1 .O5 11.15 11.13 11.11
average 1 1 1.15 11.32 11.38 11.38
container # 1
sample with 1800 glkg TS fly ash addition
pH value day 1 day 2 day 3 day 5 11.27 11.27 11.33 11.31
container # 1 2 3 4 5 6
average
pH value day 1 day 2 day 3 day 5 11.58 11.38 11.44 11.46 11.50 11.70 11.40 11.40 11.30 11.67 11.49 11.14 11.11 11.46 11.40 11.22 11.07 11,49 11.47 11.27 11.25 11.45 11.45 11.30 11.53 11.44 11.30
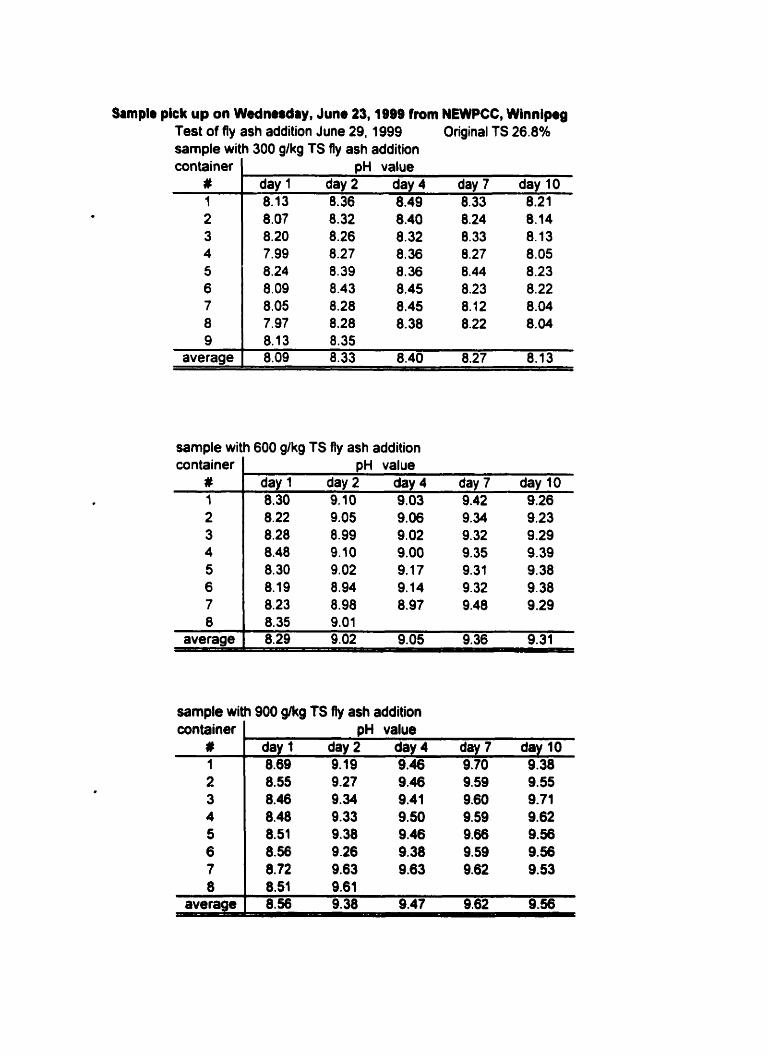
Samplr pick up on Wednerdiy, June 23,1B99 from NEWPCC, Winnipeg Test of fly ash addition June 29, 1999 Original TS 26.8% sample with 300 glkg TS fly ash addition container
# 1 2 3 4 5 6 7 8 9
container #
pH value day 1 day 2 day 4 day 7 day 10 8.13 8.36 8.49 8.33 8.21
DH value day 1 day 2 day 4 day 7 day 10 8.30 9.10 9.03 9.42 9.26
average 8.29 9.02 9.05 9.36 9.31
average 1 8.56 9.38 9.47 9.62 9.56
sample with 900 Mg TS fly ash addition container
# 1
L pH value day1 day2 day4 day7 day10 8.69 9.19 9.46 9.70 9.38

sarnple with 1200 g/kg TS fly ash addition
sample with 1500 glkg TS fly ash addition container 1 pH value
sample with 1800 gikg TS fiy ash addition
# 1
&y 1 day 2 day 4 day 7 day 10 9.47 9.99 10.18 10.24 10.30
container # 1
l pH value day 1 day 2 day 4 day 7 day 10 9.51 10.36 10.22 10.47 10.27

Sample was pickd up on Wsdnerdry, Junr 23,1999 fiom NCWPCC, Winnipeg Initial Total Solids 26.8%
Test of lime, fly ash or lime and fly ash addition Aug 1 1, 1999 pH value of sample with 259 lime + 5009 fly ash Ikg TS addition container 1 1 1 -Aug 1 1 -Aug 1 1 Aug 12-Aug 8-Oct
# 1 2 3
average
average 1 7.33 10.00 9.69 9.66 7.85
17:lO 17:40 21:OO day 1 day 59 7.33 10.65 10.68 10.64 10.54 7.33 10.53 10.69 10.67 7.33 10.58 10.56 10.69 10.56 7.33 10.59 10.64 10.67 10.55
-
pH value of sample with 259 limehg TS addition container
# 1 2 3
average 1 7.33 8.27 8.47 9.08 1 O. 15
1 1 -Aug 1 1 -Aug 1 1 -Au9 12-Aug 8-0ct 17:35 18:05 21:05 day 1 day 59 7.33 10.01 9.70 9.65 7.87 7.33 10.00 9.68 9.68 7.84 7.33 9.98 9.68 9.65 7.85
pH value of sample with 5009 fly ashlkg TS addition container
# 1 2 3
1 1 -Aug 1 1 -Aug 1 1 -Aug 12-Aug 8-0ct 16:45 17:15 20:55 day 1 day 59 7.33 8.26 8.55 9.03 10.06 7.33 8.25 8.40 9.1 1 10.2 7.33 8.29 8.45 Q.11 10.2

Sarnplr war plcked up on Mondiy, May 10,1999 from NEWPCC, Winnipeg original TS 36.28% r o m temperature 23OC Temperature Test with comercial lime
Temperature of biosolids after lime addition Time Lime doses glkg biosolids (on wet weight basis)
It73un 90 120 150 180 210

cont'd original TS 36.28% room temperature 23OC Temperature Test with comercial lime
Temperature of biosotids after lime addition Time Cime doses g/kg biosolids (on wet weight basis)

Sample was picked up on Monday, May 10,1999 ftom NEWPCC, Winnipeg original TS 35.56% room temperature 25OC Temperature Test with laboratory lime Temperature of biosolids after lime addition f ime Lime doses glkg biosolids (on wet weight basis)
2 2 3 ~ 1 150 180 21 O 12: 35 25.0
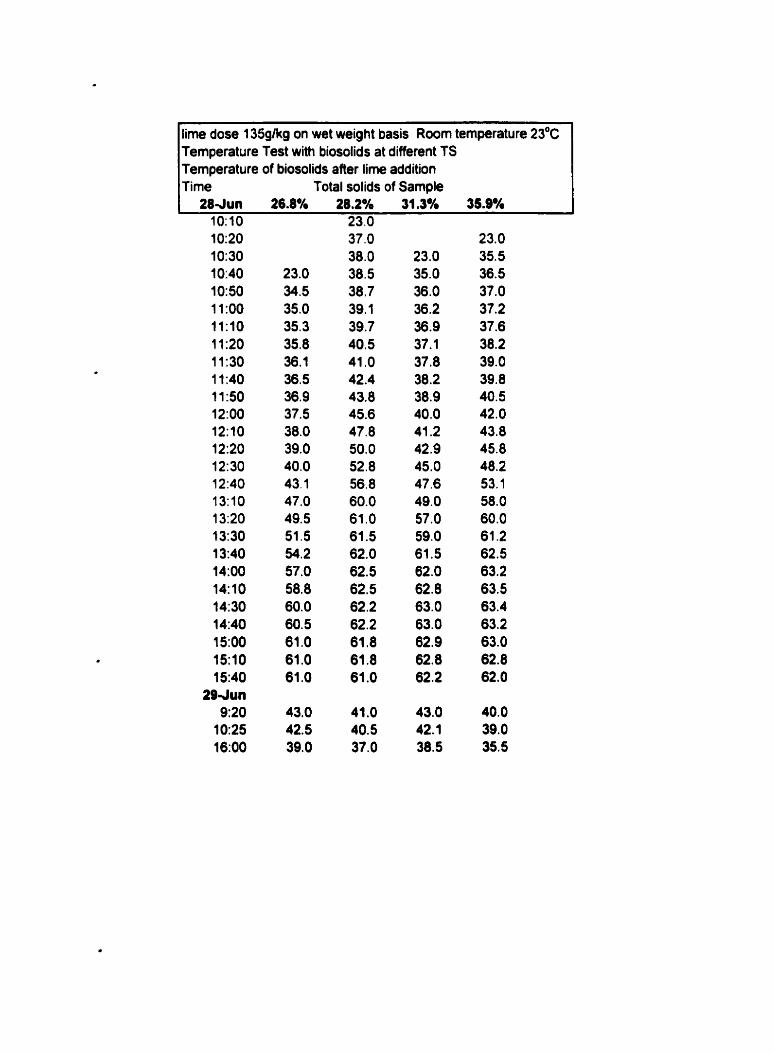
lime dose 135glkg on wet weight basis Room temperature 23OC Temperature Test with biosolids at different f S Temperature of biosolids after lime addition Ti me Total solids of Sarnple
10:20 1 O:3O 1 O:4O 1050 1 l:oo 1 t:10 11:20 1 l:3O 1 l:4O 1150 12:oo 12:lO 12:20 1 2: 30 l2:4O 13:lO 1320 l3:3O l3:4O l4:OO 14:lO 14: 30 l4AO l5:OO 1510 1 5:40
28 Jun 9:20
lO:25 l6:OO

APPENDIX B
ABBREVIATIONS
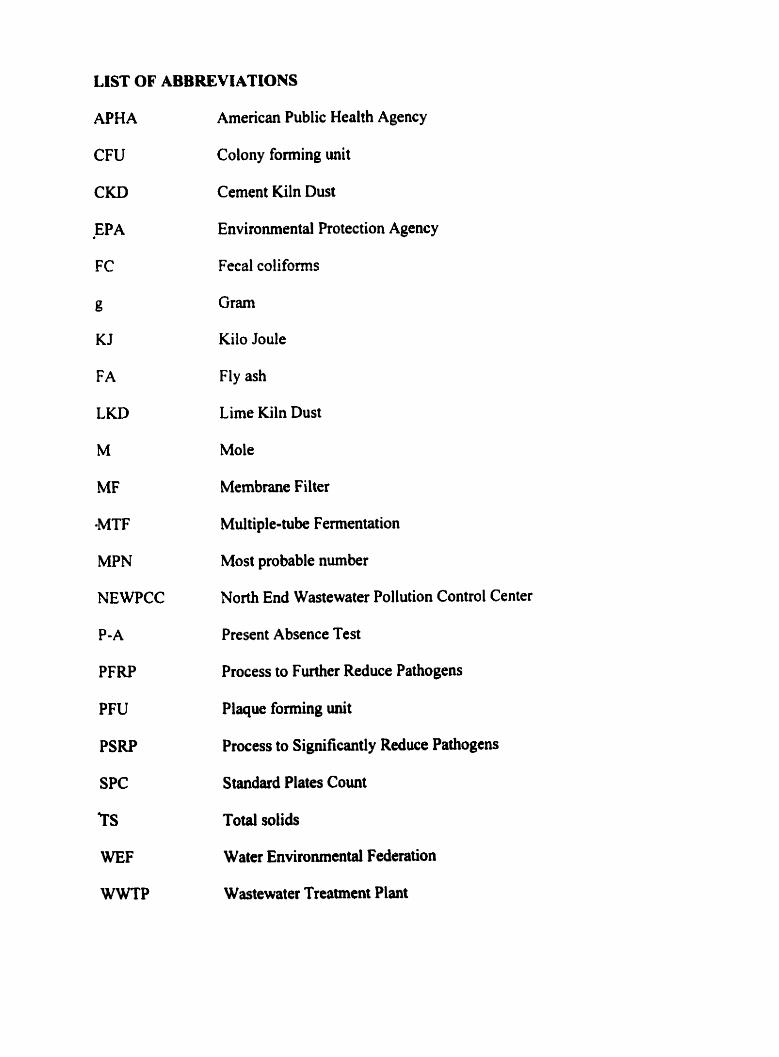
LIST OF ABBREVIATIONS
APWA
CFU
CKD
EP A
FC
g
KJ
FA
LKD
M
MF
-MTF
MPN
NEWPCC
P-A
PFRP
PFU
PSRP
SPC
Ts
WEF
WWTP
American Public Health Agency
Colony forming unit
Cernent Kiln Dust
Environmental Protection Agency
Fecal coliforms
Gram
Kilo Joule
Fly ash
Lime Kiln Dust
Mole
Membrane Filter
Multiple-tube Fermentation
Most probable nwnber
North End Wastewater Pollution Control Center
Present Absence Test
Process to Further Reduce Pathogens
Plaque forming unit
Process to Signi ficantl y Reduce Pathogens
Standard Plates Count
Total solids
Water Environmental Federation
W astewat er Treatment Plant


![VARIABILITY IN LIME-MUD FEED RATE INDUCED IN THE LIME … · in the lime kiln [3]. Furthermore, perfor-mance variations in the lime-mud filter are known to influence reburned lime](https://img.pdfslide.us/doc/110x75/5e24a26d6df10c05af5ee33b/variability-in-lime-mud-feed-rate-induced-in-the-lime-in-the-lime-kiln-3-furthermore.jpg)