Embed Size (px)
Citation preview
123
3.1 Introduction
Light interactions with biological tissues and fluids can be categorized into two large classes of biological media: (1) strongly scattering (opaque) with skin, brain, vessel walls, eye sclera, blood, and lymph, and (2) weakly scattering (transparent) with cornea, crystalline lens, vitreous humor, and aqueous humor of the front chamber of the eye.1–7 Light interactions with tissues of the first class can be described as a model of multiple scattering of scalar or vector waves in a randomly nonuniform medium with absorption. Interactions with tissues of the second class can be described as a model of single (or low-step) scattering of an ordered isotro-pic or anisotropic medium with closely packed scatterers made from material with absorptive properties. The surrounding medium could also be considered to have refractive and absorptive properties.
The transparency of tissues reaches its maximum in the near infrared (NIR), which is associated with the fact that living tissues do not contain strong intrinsic chromophores that can absorb radiation within this spectral range.1–7 Light penetrates into a tissue over several centimeters, which is important for the transillumination of thick human organs (brain, breast, etc.). However, in spite of scattering decay with the increase in wavelength, tissues are still characterized by rather strong scattering of NIR radiation. This prevents one from obtaining clear images of localized inhomogeneities arising in tissues
3Light–Tissue Interactions
3.1 Introduction ......................................................................................1233.2 Light Interactions with a Strongly Scattering Tissue ..................125
Continuous-Wave Light • Short Light Pulses • Diffuse Photon-Density Waves
3.3 Polarized Light Interaction .............................................................131Tissue Structure and Anisotropy • Polarized Light Description • Single Scattering and Quasi-Ordered Tissues • Vector Radiative Transfer Theory
3.4 Optothermal Interactions ...............................................................143Temperature Rise and Tissue Damage • Optothermal and Optoacoustic Effects • Acoustooptical Interactions • Sonoluminescence
3.5 Refractive Index and Controlling of Light Interaction with Tissue .........................................................................................151
3.6 Fluorescence ......................................................................................155Fundamentals and Methods • Multiphoton Fluorescence
3.7 Vibrational Energy States Excitation .............................................1573.8 Speckles Formation ..........................................................................1573.9 Dynamic Light Scattering ...............................................................159
Quasi-Elastic Light Scattering • Diffusion-Wave Spectroscopy3.10 Conclusion .........................................................................................161Acknowledgments ........................................................................................161References ......................................................................................................162
Valery V. TuchinSaratov State UniversityandRussian Academy of ScienceandUniversity of Oulu
Copyrighted 3.4
Copyrighted 3.4 Material
OMaterial
Optothermal InteractionsMaterial
ptothermal InteractionsTemperature Rise and Tissue DamageMaterial
Temperature Rise and Tissue Damageand Optoacoustic Effects
Material
and Optoacoustic EffectsInteractions
Material Interactions
efractive Index and Controlling of Light Interaction
Material efractive Index and Controlling of Light Interaction
with Tissue
Material with Tissue.........................................................................................
Material .........................................................................................
Fluorescence
Material Fluorescence ......................................................................................
Material ......................................................................................Fundamentals and Methods
Material Fundamentals and Methods- ibrational Energy States Excitation- ibrational Energy States ExcitationTaylor
ibrational Energy States ExcitationTaylor
ibrational Energy States Excitationeckles FormationTaylor
eckles Formation ..........................................................................Taylor
..........................................................................ynamic Light Scattering
Taylor ynamic Light Scattering ...............................................................
Taylor ...............................................................
Quasi-Elastic Light Scattering
Taylor Quasi-Elastic Light Scattering •
Taylor • D
Taylor D
Taylor iffusion-Wave Spectroscopy
Taylor iffusion-Wave Spectroscopy
.........................................................................................
Taylor .................................................................................................................................................................................
Taylor ........................................................................................& ........................................................................................& ........................................................................................
......................................................................................................& ......................................................................................................Francis
FrancisLight interactions with biological tissues and fluids can be categorized into two large classes of biological
FrancisLight interactions with biological tissues and fluids can be categorized into two large classes of biological media: (1) strongly scattering (opaque) with skin, brain, vessel walls, eye sclera, blood, and lymph, and (2)
Francismedia: (1) strongly scattering (opaque) with skin, brain, vessel walls, eye sclera, blood, and lymph, and (2) weakly scattering (transparent) with cornea, crystalline lens, vitreous humor, and aqueous humor of the front
Francisweakly scattering (transparent) with cornea, crystalline lens, vitreous humor, and aqueous humor of the front
Biomedical Photonics Handbook: Fundamentals, Devices, and Techniques124
due to various pathologies, such as tumor formation, local increase in blood volume caused by a hemor-rhage, or the growth of microvessels. Therefore, attention in optical tomography and spectroscopy is focused on the development of methods for the selection of image-carrying photons or the detection of photons providing information regarding optical parameters of the scattering medium.
Methods of noninvasive optical diagnosis and spectroscopy of tissues involve two radiation regimes: continuous wave (CW) and time-resolved regimes.1–7 Time-resolved interactions are real-ized when tissue is exposed to short laser pulses and the subsequent scattered broadened pulses are recorded (time-domain method) or by irradiation with modulated light where the depth of modula-tion of the scattered light intensity and the corresponding phase shift in the modulation frequencies are recorded (frequency-domain or phase method). The time-resolved regimes are based on the exci-tation of the photon-density wave spectrum in a strongly scattering medium, which can be described in the framework of the nonstationary radiation transfer theory (RTT). The CW regime is described by the stationary RTT.
Many optical medical technologies employ laser radiation and fiber optics; therefore, coherence of light is very important for the analysis of light interaction with tissues and cell ensembles.2–5,7–12 This problem may be considered in terms of the loss of coherence due to the scattering of light in a randomly nonuniform medium with multiple scattering and/or the change in the statistics of speckles in the scat-tered field. The coherence of light is of fundamental importance for the selection of photons that have experienced no or a small number of scattering events, as well as for the generation of speckle-modulated fields from scattering phase objects with single and multiple scattering. Such approaches are important for coherent tomography, diffractometry, holography, photon-correlation spectroscopy, laser Doppler anemometry, and speckle-interferometry of tissues and biological flows. The use of optical sources with a short coherence length opens up new opportunities in coherent interferometry and tomography of tis-sues, organs, and blood flows, providing a specific gating of ballistic or quasi-ballistic photons.
The vector nature of light waves is important for light–tissue interaction, because in a s cattering medium it is manifested as the polarization ability of an initially unpolarized incident light or the change in the character of a polarization state of an initially polarized light propagating in a medium. Similar to c oherence properties of a l ight beam reflected from or transmitted through a b iological object, the polarization properties of light can be used to select photons coming from different depths in an object.3,5,7
Quasi-elastic light scattering (QELS) as applied to monitoring of dynamic systems (chaotic or directed movements of tissue components or cells) is based mainly on the correlation or spectral analysis of the temporal fluctuations of the scattered light intensity.3,5,7–10 QELS spectroscopy, also known as light-beating spectroscopy or correlation spectroscopy, is widely used for various biomedical applications, particularly for blood or lymph flow measurement and cataract diagnostics. For the study of optically thick tissue where multiple scattering prevails and photon migration (diffusion) within tissue is important for deter-mining the characteristics of fluctuations in intensity, diffusion-wave spectroscopy (DWS) is available.
Raman scattering is the basis for Raman vibrational spectroscopy. It is a great tool for studying the structure and dynamic function of biological molecules and has been used extensively for the monitor-ing and diagnosis of diseases like cataract, atherosclerotic lesions in coronary arteries, precancerous and cancerous lesions in human soft issues, and bone and teeth pathologies.13–15
Light-induced fluorescence is also a powerful noninvasive method for the recognition and monitor-ing of tissue pathology.7,16–18 Autofluorescence, fluorescence of introduced markers, time-resolved, laser-scan, and multiphoton fluorescence have been used to study human tissues and cells in situ.
Light-induced thermal effects in tissues are important for diagnostics, phototherapy, and laser surgery.5,7,12,19–24 Optothermal (OT) spectroscopy, based on the detection of time-dependent heat generation induced in a t issue by pulsed or intensity-modulated optical radiation, is widely used in biomedicine. Among a variety of OT methods, optoacoustic (OA) and photoacoustic (PA) techniques are of great importance. They allow the estimation of optical, thermal, and acoustic properties of the tissue that depend on the peculiarities of tissue structure.
Copyrighted
tation of the photon-density wave spectrum in a strongly scattering medium, which can be described Copyrighted
tation of the photon-density wave spectrum in a strongly scattering medium, which can be described in the framework of the nonstationary radiation transfer theory (RTT). The CW regime is described
Copyrighted
in the framework of the nonstationary radiation transfer theory (RTT). The CW regime is described by the stationary RTT.
Copyrighted
by the stationary RTT.Many optical medical technologies employ laser radiation and fiber optics; therefore, coherence of
Copyrighted
Many optical medical technologies employ laser radiation and fiber optics; therefore, coherence of light is very important for the analysis of light interaction with tissues and cell ensembles.
Copyrighted
light is very important for the analysis of light interaction with tissues and cell ensembles.problem may be considered in terms of the loss of coherence due to the scattering of light in a randomly
Copyrighted
problem may be considered in terms of the loss of coherence due to the scattering of light in a randomly nonuniform medium with multiple scattering and/or the change in the statistics of speckles in the scat
Copyrighted nonuniform medium with multiple scattering and/or the change in the statistics of speckles in the scattered field. The coherence of light is of fundamental importance for the selection of photons that have
Copyrighted tered field. The coherence of light is of fundamental importance for the selection of photons that have experienced no or a small number of scattering events, as well as for the generation of speckle-modulated
Copyrighted experienced no or a small number of scattering events, as well as for the generation of speckle-modulated fields from scattering phase objects with single and multiple scattering. Such approaches are important
Copyrighted fields from scattering phase objects with single and multiple scattering. Such approaches are important Material
fields from scattering phase objects with single and multiple scattering. Such approaches are important Material
fields from scattering phase objects with single and multiple scattering. Such approaches are important for coherent tomography, diffractometry, holography, photon-correlation spectroscopy, laser Doppler
Material
for coherent tomography, diffractometry, holography, photon-correlation spectroscopy, laser Doppler anemometry, and speckle-interferometry of tissues and biological flows. The use of optical sources with
Material
anemometry, and speckle-interferometry of tissues and biological flows. The use of optical sources with a short coherence length opens up new opportunities in coherent interferometry and tomography of tis
Material a short coherence length opens up new opportunities in coherent interferometry and tomography of tissues, organs, and blood flows, providing a specific gating of ballistic or quasi-ballistic photons.
Material sues, organs, and blood flows, providing a specific gating of ballistic or quasi-ballistic photons.
The vector nature of light waves is important for light–tissue interaction, because in a s cattering
Material The vector nature of light waves is important for light–tissue interaction, because in a s cattering medium it is manifested as the polarization ability of an initially unpolarized incident light or the
Material medium it is manifested as the polarization ability of an initially unpolarized incident light or the - medium it is manifested as the polarization ability of an initially unpolarized incident light or the - medium it is manifested as the polarization ability of an initially unpolarized incident light or the change in the character of a polarization state of an initially polarized light propagating in a medium. - change in the character of a polarization state of an initially polarized light propagating in a medium. Taylor
change in the character of a polarization state of an initially polarized light propagating in a medium. Taylor
change in the character of a polarization state of an initially polarized light propagating in a medium. Similar to c oherence properties of a l ight beam reflected from or transmitted through a b iological
Taylor
Similar to c oherence properties of a l ight beam reflected from or transmitted through a b iological object, the polarization properties of light can be used to select photons coming from different depths
Taylor object, the polarization properties of light can be used to select photons coming from different depths
Quasi-elastic light scattering (QELS) as applied to monitoring of dynamic systems (chaotic or directed
Taylor Quasi-elastic light scattering (QELS) as applied to monitoring of dynamic systems (chaotic or directed movements of tissue components or cells) is based mainly on the correlation or spectral analysis of the
Taylor movements of tissue components or cells) is based mainly on the correlation or spectral analysis of the & movements of tissue components or cells) is based mainly on the correlation or spectral analysis of the & movements of tissue components or cells) is based mainly on the correlation or spectral analysis of the QELS spectroscopy, also known as light-beating
& QELS spectroscopy, also known as light-beating Francis
QELS spectroscopy, also known as light-beating Francis
QELS spectroscopy, also known as light-beating spectroscopy or correlation spectroscopy, is widely used for various biomedical applications, particularly Francis
spectroscopy or correlation spectroscopy, is widely used for various biomedical applications, particularly for blood or lymph flow measurement and cataract diagnostics. For the study of optically thick tissue
Francisfor blood or lymph flow measurement and cataract diagnostics. For the study of optically thick tissue
Franciswhere multiple scattering prevails and photon migration (diffusion) within tissue is important for deter
Franciswhere multiple scattering prevails and photon migration (diffusion) within tissue is important for determining the characteristics of fluctuations in intensity, diffusion-wave spectroscopy (DWS) is available.
Francismining the characteristics of fluctuations in intensity, diffusion-wave spectroscopy (DWS) is available.Raman scattering is the basis for Raman vibrational spectroscopy. It is a great tool for studying the
FrancisRaman scattering is the basis for Raman vibrational spectroscopy. It is a great tool for studying the structure and dynamic function of biological molecules and has been used extensively for the monitor
Francisstructure and dynamic function of biological molecules and has been used extensively for the monitor
Light–Tissue Interactions 125
For thermal phototherapy and surgery, much higher light intensities are needed than for diagnostic purposes. Important factors that need to be considered are controllable temperature rise, and thermal and/or thermomechanical damage (coagulation, vaporization, vacuolization, pyrolysis, ablation) of a tissue.12,20–24
3.2 Light Interactions with a Strongly Scattering Tissue
3.2.1 Continuous-Wave Light
Biological tissues are optically inhomogeneous and absorbing media whose average refractive index is higher than that of air. This is the cause of the partial reflection of the radiation at the tissue/air interface (Fresnel reflection), while the remaining part penetrates the tissue. Multiple scattering and absorption are responsible for light beam broadening and eventual decay as it travels through a tissue, whereas bulk scattering is a major cause for the dispersion of a large fraction of radiation in the backward direction. Cellular organelles such as mitochondria, thin fibrillar structures of connective tissues, melanin gran-ules, and red blood cells are the main scatterers in living tissues.1–7
Absorbed light is converted to heat or radiated in the form of fluorescence; it is also consumed in photobiochemical reactions. The absorption spectrum depends on the type of predominant absorption centers and water content of tissues (see Figure 2.16). Absolute values of absorption coefficients for typi-cal tissues lie in the range 10−2–104 cm−1.1–7 In the ultraviolet (UV) and infrared (IR) (λ ≥ 2 μm) spectral regions, light is readily absorbed, which accounts for the small contribution of scattering and inability of radiation to penetrate deep into tissues (only across one or more cell layers). In the wavelength range 600–1600 nm, scattering prevails over absorption and the intensity of the reflected radiation increases to 35%–70% of the total incident light (due to backscattering).
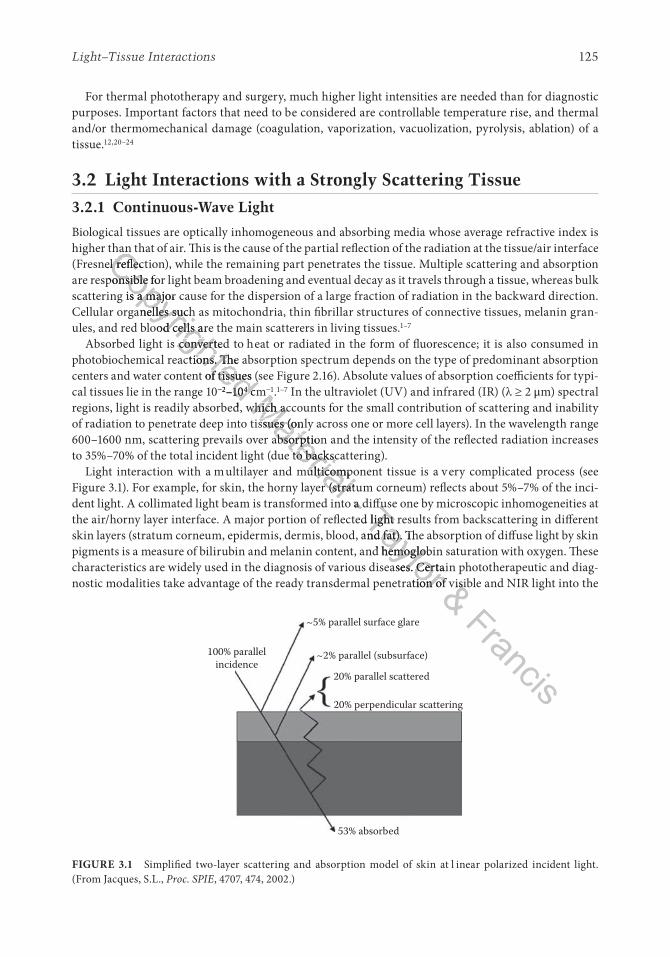
Light interaction with a multilayer and multicomponent tissue is a v ery complicated process (see Figure 3.1). For example, for skin, the horny layer (stratum corneum) reflects about 5%–7% of the inci-dent light. A collimated light beam is transformed into a diffuse one by microscopic inhomogeneities at the air/horny layer interface. A major portion of reflected light results from backscattering in different skin layers (stratum corneum, epidermis, dermis, blood, and fat). The absorption of diffuse light by skin pigments is a measure of bilirubin and melanin content, and hemoglobin saturation with oxygen. These characteristics are widely used in the diagnosis of various diseases. Certain phototherapeutic and diag-nostic modalities take advantage of the ready transdermal penetration of visible and NIR light into the
100% parallelincidence
~5% parallel surface glare
20% parallel scattered
20% perpendicular scattering
53% absorbed
~2% parallel (subsurface)
FIGURE 3.1 Simplified two-layer scattering and absorption model of skin at l inear polarized incident light. (From Jacques, S.L., Proc. SPIE, 4707, 474, 2002.)
Copyrighted
higher than that of air. This is the cause of the partial reflection of the radiation at the tissue/air interface Copyrighted
higher than that of air. This is the cause of the partial reflection of the radiation at the tissue/air interface (Fresnel reflection), while the remaining part penetrates the tissue. Multiple scattering and absorption Copyrighted
(Fresnel reflection), while the remaining part penetrates the tissue. Multiple scattering and absorption are responsible for light beam broadening and eventual decay as it travels through a tissue, whereas bulk
Copyrighted
are responsible for light beam broadening and eventual decay as it travels through a tissue, whereas bulk scattering is a major cause for the dispersion of a large fraction of radiation in the backward direction.
Copyrighted
scattering is a major cause for the dispersion of a large fraction of radiation in the backward direction. Cellular organelles such as mitochondria, thin fibrillar structures of connective tissues, melanin gran
Copyrighted
Cellular organelles such as mitochondria, thin fibrillar structures of connective tissues, melanin granules, and red blood cells are the main scatterers in living tissues.
Copyrighted
ules, and red blood cells are the main scatterers in living tissues.Absorbed light is converted to heat or radiated in the form of fluorescence; it is also consumed in
Copyrighted Absorbed light is converted to heat or radiated in the form of fluorescence; it is also consumed in
photobiochemical reactions. The absorption spectrum depends on the type of predominant absorption
Copyrighted photobiochemical reactions. The absorption spectrum depends on the type of predominant absorption centers and water content of tissues (see Figure 2.16). Absolute values of absorption coefficients for typi
Copyrighted centers and water content of tissues (see Figure 2.16). Absolute values of absorption coefficients for typical tissues lie in the range 10
Copyrighted cal tissues lie in the range 10−2
Copyrighted −2–10
Copyrighted –104
Copyrighted 4 cm
Copyrighted cmregions, light is readily absorbed, which accounts for the small contribution of scattering and inability
Copyrighted regions, light is readily absorbed, which accounts for the small contribution of scattering and inability Material
regions, light is readily absorbed, which accounts for the small contribution of scattering and inability Material
regions, light is readily absorbed, which accounts for the small contribution of scattering and inability Material
of radiation to penetrate deep into tissues (only across one or more cell layers). In the wavelength range Material
of radiation to penetrate deep into tissues (only across one or more cell layers). In the wavelength range 600–1600 nm, scattering prevails over absorption and the intensity of the reflected radiation increases
Material 600–1600 nm, scattering prevails over absorption and the intensity of the reflected radiation increases to 35%–70% of the total incident light (due to backscattering).
Material to 35%–70% of the total incident light (due to backscattering).
Light interaction with a multilayer and multicomponent tissue is a v ery complicated process (see
Material Light interaction with a multilayer and multicomponent tissue is a v ery complicated process (see
Figure 3.1). For example, for skin, the horny layer (stratum corneum) reflects about 5%–7% of the inci
Material Figure 3.1). For example, for skin, the horny layer (stratum corneum) reflects about 5%–7% of the incident light. A collimated light beam is transformed into a diffuse one by microscopic inhomogeneities at
Material dent light. A collimated light beam is transformed into a diffuse one by microscopic inhomogeneities at - dent light. A collimated light beam is transformed into a diffuse one by microscopic inhomogeneities at - dent light. A collimated light beam is transformed into a diffuse one by microscopic inhomogeneities at the air/horny layer interface. A major portion of reflected light results from backscattering in different
- the air/horny layer interface. A major portion of reflected light results from backscattering in different Taylor
dent light. A collimated light beam is transformed into a diffuse one by microscopic inhomogeneities at Taylor
dent light. A collimated light beam is transformed into a diffuse one by microscopic inhomogeneities at the air/horny layer interface. A major portion of reflected light results from backscattering in different Taylor
the air/horny layer interface. A major portion of reflected light results from backscattering in different skin layers (stratum corneum, epidermis, dermis, blood, and fat). The absorption of diffuse light by skin
Taylor skin layers (stratum corneum, epidermis, dermis, blood, and fat). The absorption of diffuse light by skin
Taylor pigments is a measure of bilirubin and melanin content, and hemoglobin saturation with oxygen. These
Taylor pigments is a measure of bilirubin and melanin content, and hemoglobin saturation with oxygen. These characteristics are widely used in the diagnosis of various diseases. Certain phototherapeutic and diag
Taylor characteristics are widely used in the diagnosis of various diseases. Certain phototherapeutic and diag
Taylor nostic modalities take advantage of the ready transdermal penetration of visible and NIR light into the
Taylor nostic modalities take advantage of the ready transdermal penetration of visible and NIR light into the & nostic modalities take advantage of the ready transdermal penetration of visible and NIR light into the & nostic modalities take advantage of the ready transdermal penetration of visible and NIR light into the
Francis
Biomedical Photonics Handbook: Fundamentals, Devices, and Techniques126
body in the wavelength region corresponding to the so-called therapeutic or diagnostic window, which has a few broad and narrow bands within 600–1600 nm.
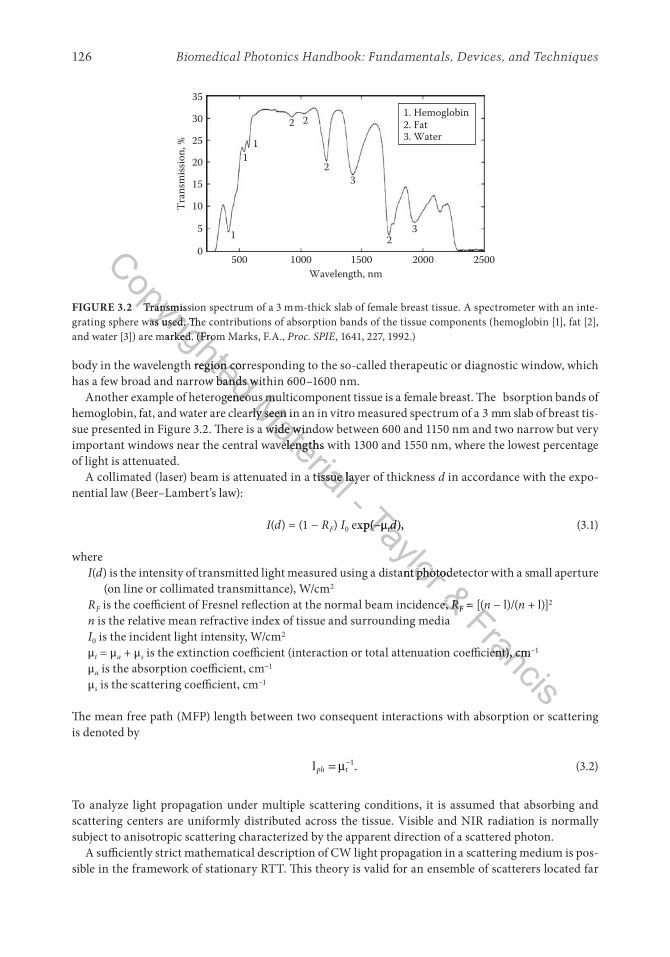
Another example of heterogeneous multicomponent tissue is a female breast. The bsorption bands of hemoglobin, fat, and water are clearly seen in an in vitro measured spectrum of a 3 mm slab of breast tis-sue presented in Figure 3.2. There is a wide window between 600 and 1150 nm and two narrow but very important windows near the central wavelengths with 1300 and 1550 nm, where the lowest percentage of light is attenuated.
A collimated (laser) beam is attenuated in a tissue layer of thickness d in accordance with the expo-nential law (Beer–Lambert’s law):
I(d) = (1 − RF) I0 exp(−μtd), (3.1)
whereI(d) is the intensity of transmitted light measured using a distant photodetector with a small aperture
(on line or collimated transmittance), W/cm2
RF is the coefficient of Fresnel reflection at the normal beam incidence, RF = [(n − l)/(n + l)]2
n is the relative mean refractive index of tissue and surrounding mediaI0 is the incident light intensity, W/cm2
μt = μa + μs is the extinction coefficient (interaction or total attenuation coefficient), cm−1
μa is the absorption coefficient, cm−1
μs is the scattering coefficient, cm−1
The mean free path (MFP) length between two consequent interactions with absorption or scattering is denoted by
lph t= −µ 1. (3.2)
To analyze light propagation under multiple scattering conditions, it is assumed that absorbing and scattering centers are uniformly distributed across the tissue. Visible and NIR radiation is normally subject to anisotropic scattering characterized by the apparent direction of a scattered photon.
A sufficiently strict mathematical description of CW light propagation in a scattering medium is pos-sible in the framework of stationary RTT. This theory is valid for an ensemble of scatterers located far
35
30
25
20
15
10
5
0500 1000 1500
Wavelength, nm
23
3
3. Water2. Fat1. Hemoglobin
2
22
Tran
smiss
ion,
% 11
1
2000 2500
FIGURE 3.2 Transmission spectrum of a 3 mm-thick slab of female breast tissue. A spectrometer with an inte-grating sphere was used. The contributions of absorption bands of the tissue components (hemoglobin [1], fat [2], and water [3]) are marked. (From Marks, F.A., Proc. SPIE, 1641, 227, 1992.)
Copyrighted body in the wavelength region corresponding to the so-called therapeutic or diagnostic window, which
Copyrighted body in the wavelength region corresponding to the so-called therapeutic or diagnostic window, which has a few broad and narrow bands within 600–1600 nm.
Copyrighted has a few broad and narrow bands within 600–1600 nm.Another example of heterogeneous multicomponent tissue is a female breast. The bsorption bands of
Copyrighted Another example of heterogeneous multicomponent tissue is a female breast. The bsorption bands of hemoglobin, fat, and water are clearly seen in an in vitro measured spectrum of a 3 mm slab of breast tis
Copyrighted hemoglobin, fat, and water are clearly seen in an in vitro measured spectrum of a 3 mm slab of breast tis
Transmission spectrum of a 3 mm-thick slab of female breast tissue. A spectrometer with an inte
Copyrighted
Transmission spectrum of a 3 mm-thick slab of female breast tissue. A spectrometer with an integrating sphere was used. The contributions of absorption bands of the tissue components (hemoglobin [1], fat [2],
Copyrighted
grating sphere was used. The contributions of absorption bands of the tissue components (hemoglobin [1], fat [2], and water [3]) are marked. (From Marks, F.A.,
Copyrighted
and water [3]) are marked. (From Marks, F.A.,
Material
Another example of heterogeneous multicomponent tissue is a female breast. The bsorption bands of Material
Another example of heterogeneous multicomponent tissue is a female breast. The bsorption bands of hemoglobin, fat, and water are clearly seen in an in vitro measured spectrum of a 3 mm slab of breast tisMaterial
hemoglobin, fat, and water are clearly seen in an in vitro measured spectrum of a 3 mm slab of breast tissue presented in Figure 3.2. There is a wide window between 600 and 1150 nm and two narrow but very
Material
sue presented in Figure 3.2. There is a wide window between 600 and 1150 nm and two narrow but very important windows near the central wavelengths with 1300 and 1550 nm, where the lowest percentage
Material important windows near the central wavelengths with 1300 and 1550 nm, where the lowest percentage
A collimated (laser) beam is attenuated in a tissue layer of thickness
Material A collimated (laser) beam is attenuated in a tissue layer of thickness
- Taylor
exp(−Taylor
exp(−μTaylor
μtTaylor
tdTaylor
d),Taylor
),
is the intensity of transmitted light measured using a distant photodetector with a small aperture
Taylor is the intensity of transmitted light measured using a distant photodetector with a small aperture & is the coefficient of Fresnel reflection at the normal beam incidence, & is the coefficient of Fresnel reflection at the normal beam incidence, R& RF& F = [(& = [(Francis
= [(Francis
= [(nFrancis
n
is the extinction coefficient (interaction or total attenuation coefficient), cm
Francis is the extinction coefficient (interaction or total attenuation coefficient), cm
Light–Tissue Interactions 127
from one another and has been successfully used to work out some practical aspects of tissue optics. The main stationary equation of RTT for monochromatic light takes the following form1–7:
∂∂
= + +∫I r s
sI r s I r p s d S r st
s( , )( , ) ( , ( , ( , ),) )−µ µ
πΩ
π4
4
−′ −′ ′s s (3.3)
whereI r s( , ) is the radiance (or specific intensity)—average power flux density at a point r in the given
direction s , (W/cm2 sr)p s( , )−′s is the scattering phase function, sr−1
d ′Ω is the unit solid angle around the direction −′s , srS r s( , ) characterizes a radiation source inside the medium or light coming from the outside and fall-
ing on the tissue surface, for example, a laser beam; as a radiation source, internal fluorescence, excited by an external light beam, could also be considered
To characterize the relation of the scattering and absorption properties of a tissue, a parameter such as albedo is usually introduced: Λ = μs/μt. The albedo ranges from zero for a completely absorbing medium to unity for a completely scattering medium.
The phase function p s( , )−′s describes the scattering properties of the medium and is in fact the prob-ability density function for scattering in the direction −′s of a photon traveling in the direction s ; in other words, it characterizes an elementary scattering act. If scattering is symmetric relative to the direction of the incident wave, then the phase function depends only on the scattering angle θ (angle between directions s and −′s ), that is, p(θ). In practice, the phase function is usually well approximated with the aid of the postulated Henyey–Greenstein function1–7:
pg g
( )cos
,/θπ
−
− θ= ⋅
+( )1
4
1
1 2
2
2 3 2
g (3.4)
where g is the scattering anisotropy factor (mean cosine of the scattering angle θ). The value of g varies from 0 to 1 : g = 0 c orresponds to isotropic (Rayleigh) scattering and g = 1 to to tal forward scattering (Mie scattering by large particles).27–30
The integrodifferential equation (Equation 3.1) is frequently simplified by representing the solu-tion in the form of spherical harmonics. Such simplification leads to a system of (N + 1)2 connected differential partial derivative equations known as the PN approximation. This system is reducible to a single differential equation on the order of (N + 1). For example, four connected differential equa-tions reducible to a si ngle diffusion-type equation are necessary for N = 1.1–7 The photon diffusion coefficient, cm2/c,
Dc
s a
=′ +( )3 µ µ
, (3.5)
and the reduced (transport) scattering coefficient, cm–1,
′ = ( )µ − µs sg1 , (3.6)
are the major parameters of the diffusion equation; here c is the velocity of light in the medium.
Copyrighted
)Copyrighted
)′Copyrighted
′sCopyrighted
s is the scattering phase function, srCopyrighted
is the scattering phase function, sr′Copyrighted
′ΩCopyrighted
Ω is the unit solid angle around the direction Copyrighted
is the unit solid angle around the direction Copyrighted
)
Copyrighted
) characterizes a radiation source inside the medium or light coming from the outside and fall
Copyrighted
characterizes a radiation source inside the medium or light coming from the outside and falling on the tissue surface, for example, a laser beam; as a radiation source, internal fluorescence,
Copyrighted
ing on the tissue surface, for example, a laser beam; as a radiation source, internal fluorescence, excited by an external light beam, could also be considered
Copyrighted
excited by an external light beam, could also be considered
To characterize the relation of the scattering and absorption properties of a tissue, a parameter such as
Copyrighted To characterize the relation of the scattering and absorption properties of a tissue, a parameter such as
albedo is usually introduced:
Copyrighted albedo is usually introduced: Λ
Copyrighted Λ =
Copyrighted = μ
Copyrighted μs
Copyrighted s
to unity for a completely scattering medium.
Copyrighted to unity for a completely scattering medium. describes the scattering properties of the medium and is in fact the prob
Copyrighted describes the scattering properties of the medium and is in fact the probMaterial
describes the scattering properties of the medium and is in fact the probMaterial
describes the scattering properties of the medium and is in fact the probability density function for scattering in the direction
Material
ability density function for scattering in the direction words, it characterizes an elementary scattering act. If scattering is symmetric relative to the direction
Material
words, it characterizes an elementary scattering act. If scattering is symmetric relative to the direction of the incident wave, then the phase function depends only on the scattering angle
Material of the incident wave, then the phase function depends only on the scattering angle
). In practice, the phase function is usually well approximated with the
Material ). In practice, the phase function is usually well approximated with the
aid of the postulated Henyey–Greenstein function
Material aid of the postulated Henyey–Greenstein function1–7
Material 1–7:
Material : - −- −1- 1 Taylor
Taylor
/Taylor
/( )Taylor
( )− θ( )− θTaylor
− θ( )− θg g− θg g( )g g− θg gTaylor
g g− θg g( )g g− θg g co− θco( )co− θcoTaylor
co− θco( )co− θcos− θs( )s− θsTaylor
s− θs( )s− θs− θ( )− θ1 2− θ( )− θTaylor
− θ( )− θ1 2− θ( )− θ3 2
Taylor
3 2/3 2/Taylor
/3 2/
gTaylor
g
is the scattering anisotropy factor (mean cosine of the scattering angle
Taylor is the scattering anisotropy factor (mean cosine of the scattering angle = 0 c orresponds to isotropic (Rayleigh) scattering and
Taylor = 0 c orresponds to isotropic (Rayleigh) scattering and g
Taylor g = 1 to to tal forward scattering
Taylor = 1 to to tal forward scattering & is the scattering anisotropy factor (mean cosine of the scattering angle & is the scattering anisotropy factor (mean cosine of the scattering angle & = 1 to to tal forward scattering & = 1 to to tal forward scattering
Francis
The integrodifferential equation (Equation 3.1) is frequently simplified by representing the soluFrancis
The integrodifferential equation (Equation 3.1) is frequently simplified by representing the solution in the form of spherical harmonics. Such simplification leads to a system of (
Francistion in the form of spherical harmonics. Such simplification leads to a system of (N
FrancisN + 1)
Francis+ 1)
approximation. This system is reducible to
Francis approximation. This system is reducible to
Francis + 1). For example, four connected differential equa
Francis + 1). For example, four connected differential equa The photon diffusion
Francis The photon diffusion
Biomedical Photonics Handbook: Fundamentals, Devices, and Techniques128
The transport MFP of a photon (cm) is defined as
ltr s a= ′ +( )−µ µ 1. (3.7)
It is worthwhile to note that the transport MFP in a medium with anisotropic single scattering signifi-cantly exceeds the MFP in a medium with isotropic single scattering ltr >> lph. The transport MFP ltr is the distance over which the photon loses its initial direction.
Based on the diffusion theory, attenuation of a wide laser beam of intensity I0 at depths z > ld = 1/μeff
in a thick tissue may be described as5
I(z) ≈ I0bs exp(–μeff z), (3.8)
where bs accounts for additional irradiation of the upper layers of a tissue due to backscattering (photon recycling effect) and
µ µ µ µeff a s a= ′ +( ) 31 2/
, (3.9)
is the effective attenuation coefficient or inverse diffusion length, μeff = 1/ld, cm–1. Consequently, the depth of light penetration into a tissue is defined as
le = ld[ln bs + 1]. (3.10)
Typically, for tissues, bs = 1–5 for a beam diameter of 1–20 mm.5,31 Thus, when wide laser beams are used for irradiation of highly scattering tissues with low absorption, CW light energy is accumulated in tissue due to high multiplicity of chaotic long-path photon migrations. A highly scattering medium works as a random cavity providing the capacity of light energy. The light power density within the superficial tis-sue layers may substantially (up to fivefold) exceed the incident power density and cause the overdosage during photodynamic therapy or overheating at interstitial laser thermotherapy. On the other hand, the photon recycling effect can be used for more effective irradiation of undersurface lesions at relatively small incident power densities.
3.2.2 Short Light Pulses
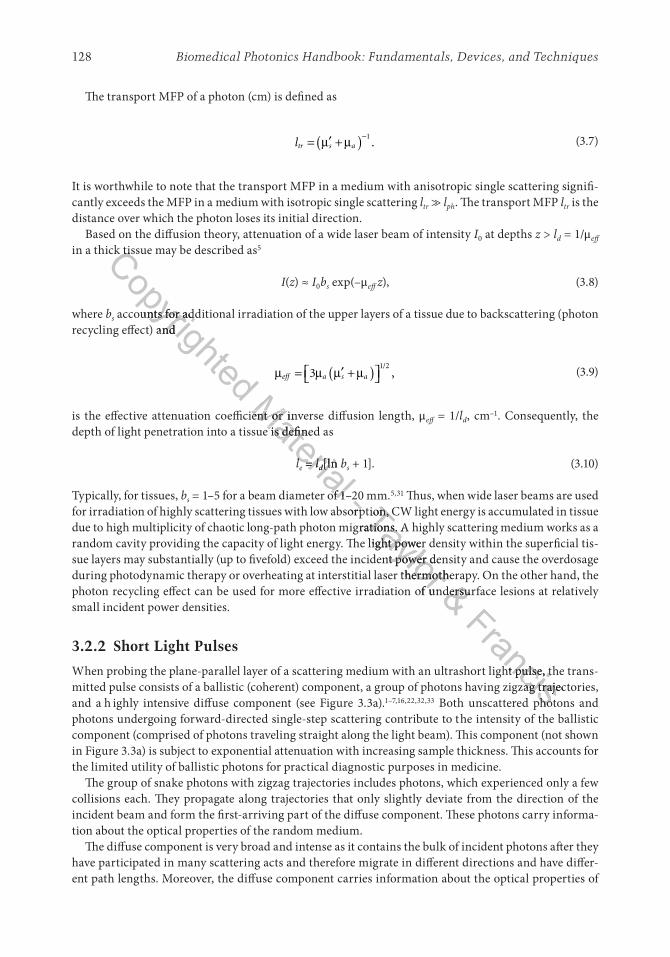
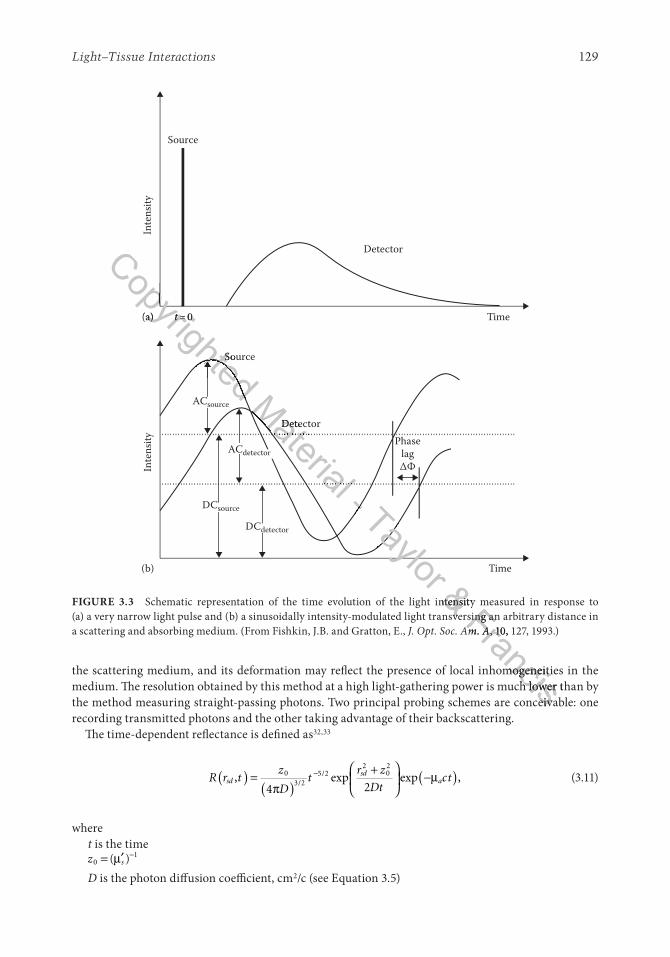
When probing the plane-parallel layer of a scattering medium with an ultrashort light pulse, the trans-mitted pulse consists of a ballistic (coherent) component, a group of photons having zigzag trajectories, and a h ighly intensive diffuse component (see Figure 3.3a).1–7,16,22,32,33 Both unscattered photons and photons undergoing forward-directed single-step scattering contribute to the intensity of the ballistic component (comprised of photons traveling straight along the light beam). This component (not shown in Figure 3.3a) is subject to exponential attenuation with increasing sample thickness. This accounts for the limited utility of ballistic photons for practical diagnostic purposes in medicine.
The group of snake photons with zigzag trajectories includes photons, which experienced only a few collisions each. They propagate along trajectories that only slightly deviate from the direction of the incident beam and form the first-arriving part of the diffuse component. These photons carry informa-tion about the optical properties of the random medium.
The diffuse component is very broad and intense as it contains the bulk of incident photons after they have participated in many scattering acts and therefore migrate in different directions and have differ-ent path lengths. Moreover, the diffuse component carries information about the optical properties of
Copyrighted
in a thick tissue may be described asCopyrighted
in a thick tissue may be described as
accounts for additional irradiation of the upper layers of a tissue due to backscattering (photon
Copyrighted
accounts for additional irradiation of the upper layers of a tissue due to backscattering (photon recycling effect) and
Copyrighted
recycling effect) and
Material
is the effective attenuation coefficient or inverse diffusion length, Material
is the effective attenuation coefficient or inverse diffusion length, depth of light penetration into a tissue is defined as
Material
depth of light penetration into a tissue is defined as
l
Material l =
Material = l
Material ld
Material d[ln
Material [ln b
Material b
= 1–5 for a beam diameter of 1–20 mm.
Material = 1–5 for a beam diameter of 1–20 mm.- for irradiation of highly scattering tissues with low absorption, CW light energy is accumulated in tissue - for irradiation of highly scattering tissues with low absorption, CW light energy is accumulated in tissue Taylor
for irradiation of highly scattering tissues with low absorption, CW light energy is accumulated in tissue Taylor
for irradiation of highly scattering tissues with low absorption, CW light energy is accumulated in tissue due to high multiplicity of chaotic long-path photon migrations. A highly scattering medium works as a
Taylor
due to high multiplicity of chaotic long-path photon migrations. A highly scattering medium works as a random cavity providing the capacity of light energy. The light power density within the superficial tis
Taylor random cavity providing the capacity of light energy. The light power density within the superficial tis
Taylor sue layers may substantially (up to fivefold) exceed the incident power density and cause the overdosage
Taylor sue layers may substantially (up to fivefold) exceed the incident power density and cause the overdosage during photodynamic therapy or overheating at interstitial laser thermotherapy. On the other hand, the
Taylor during photodynamic therapy or overheating at interstitial laser thermotherapy. On the other hand, the photon recycling effect can be used for more effective irradiation of undersurface lesions at relatively
Taylor photon recycling effect can be used for more effective irradiation of undersurface lesions at relatively & photon recycling effect can be used for more effective irradiation of undersurface lesions at relatively & photon recycling effect can be used for more effective irradiation of undersurface lesions at relatively
FrancisWhen probing the plane-parallel layer of a scattering medium with an ultrashort light pulse, the trans
FrancisWhen probing the plane-parallel layer of a scattering medium with an ultrashort light pulse, the trans
Francismitted pulse consists of a ballistic (coherent) component, a group of photons having zigzag trajectories,
Francismitted pulse consists of a ballistic (coherent) component, a group of photons having zigzag trajectories, Both unscattered photons and
Francis Both unscattered photons and
Light–Tissue Interactions 129
the scattering medium, and its deformation may reflect the presence of local inhomogeneities in the medium. The resolution obtained by this method at a high light-gathering power is much lower than by the method measuring straight-passing photons. Two principal probing schemes are conceivable: one recording transmitted photons and the other taking advantage of their backscattering.
The time-dependent reflectance is defined as32,33
R r tz
Dt
r z
Dtctsd
sda, exp exp ,/
/( ) =( )
+
( )0
3 25 2
202
4 2π−µ− (3.11)
wheret is the timez s0
1= ′ −( )µD is the photon diffusion coefficient, cm2/c (see Equation 3.5)
Source
Source
Detector
Detector
Time
PhaselagΔΦIn
tens
ity
Time(a)
(b)
Inte
nsity
t= 0
ACdetector
ACsource
DCsource
DCdetector
FIGURE 3.3 Schematic representation of the time evolution of the light intensity measured in response to (a) a very narrow light pulse and (b) a sinusoidally intensity-modulated light transversing an arbitrary distance in a scattering and absorbing medium. (From Fishkin, J.B. and Gratton, E., J. Opt. Soc. Am. A, 10, 127, 1993.)
Copyrighted S
Copyrighted Source
Copyrighted ource
(a)
Copyrighted
(a) t
Copyrighted
t= 0
Copyrighted
= 0
Copyrighted
Copyrighted
Copyrighted
Copyrighted
Copyrighted Material
DeMaterial
DeteMaterial
tectMaterial
ctMaterial
Material
Material - - Taylor
Taylor
Taylor Schematic representation of the time evolution of the light intensity measured in response to
Taylor Schematic representation of the time evolution of the light intensity measured in response to & Schematic representation of the time evolution of the light intensity measured in response to & Schematic representation of the time evolution of the light intensity measured in response to
(a) a very narrow light pulse and (b) a sinusoidally intensity-modulated light transversing an arbitrary distance in
& (a) a very narrow light pulse and (b) a sinusoidally intensity-modulated light transversing an arbitrary distance in Francisthe scattering medium, and its deformation may reflect the presence of local inhomogeneities in the
Francisthe scattering medium, and its deformation may reflect the presence of local inhomogeneities in the medium. The resolution obtained by this method at a high light-gathering power is much lower than by
Francismedium. The resolution obtained by this method at a high light-gathering power is much lower than by the method measuring straight-passing photons. Two principal probing schemes are conceivable: one
Francisthe method measuring straight-passing photons. Two principal probing schemes are conceivable: one
(a) a very narrow light pulse and (b) a sinusoidally intensity-modulated light transversing an arbitrary distance in Francis
(a) a very narrow light pulse and (b) a sinusoidally intensity-modulated light transversing an arbitrary distance in J. Opt. Soc. Am. A
Francis
J. Opt. Soc. Am. A, 10, 127, 1993.)Francis
, 10, 127, 1993.)
Biomedical Photonics Handbook: Fundamentals, Devices, and Techniques130
An important advantage of the pulse method is its applicability to in vivo studies due to the possibility of the separate evaluation of μa and ′µs using a single measurement in the backscattering or transillumi-nation regimes.
3.2.3 Diffuse Photon-Density Waves
When probing the plane-parallel layer of a s cattering medium with an intensity-modulated light, the modulation depth of scattered light intensity mU ≡ ACdetector/DCdetector (see Figure 3.3b) and the corresponding phase shift relative to t he incident light modulation phase ∆Φ (phase lag) can be measured.1–7,34–37 In applications to tissue spectroscopy and tomography compared with pulse measure-ments, this method is more simple and reliable in terms of data interpretation and noise immunity. These happen because amplitude modulation is measured at low peak powers, slow rise time, and hence smaller bandwidths than the pulse measurements need. The current measuring schemes are based on heterodyning of optical and transformed signals.35
The development of the theory underlying this method resulted in the discovery of a new type of waves: photon-density waves or progressively decaying waves of intensity.1–7,34–37 Microscopically, indi-vidual photons make random migrations in a scattering medium, but collectively they form a photon-density wave at a modulation frequency ω that moves away from a radiation source (see Figure 3.3b). Photon-density waves possess typical wave properties: for example, they undergo refraction, diffraction, interference, dispersion, and attenuation.
In strongly scattering media with weak absorption far from the walls and a source or a receiver of radia-tion, the light distribution may be regarded as a decaying diffusion process described by the time-dependent diffusion equation for photon density. For a point light source with harmonic intensity modulation at fre-quency ω = 2πν placed at the point r = 0, an alternating component (AC) of intensity is a going-away spherical wave with its center at the point r = 0, which oscillates at a modulation frequency with modulation depth36
m r m rc
Dr
DU I
a( , ) exp exp ,ω µ − ω=
2
(3.12)
and undergoes a phase shift elative to the phase value at point r = 0 equal to
∆Φ ω ω( , ) ,
.
r rD
=
2
0 5
(3.13)
wheremI is the intensity modulation depth of the incident lightD = c/3( ′µs + μa)
The length of a photon-density wave, ΛΦ, and its phase velocity, VΦ, are defined by
Λ πω
ωΦ Φ2
228
2= =DV Dand . (3.14)
Measurement of mU(r , ω) and ΔΦ(r , ω) allows one to s eparately determine the transport scattering coefficient ′µs and the absorption coefficient μa and evaluate the spatial distribution of these parameters.
Keeping medical applications in mind, we can easily estimate that, for ω/2π = 500 MHz, ′µs = 15 cm−1, μa = 0.035 cm−1, and c = (3 × 10¹⁰/1.33) cm/s, the wavelength is ΛΦ ≅ 5.0 cm and the phase velocity is VΦ ≅ 1.77 × 109 cm/s.
Copyrighted
ments, this method is more simple and reliable in terms of data interpretation and noise immunity. Copyrighted
ments, this method is more simple and reliable in terms of data interpretation and noise immunity. These happen because amplitude modulation is measured at low peak powers, slow rise time, and hence
Copyrighted
These happen because amplitude modulation is measured at low peak powers, slow rise time, and hence smaller bandwidths than the pulse measurements need. The current measuring schemes are based on
Copyrighted
smaller bandwidths than the pulse measurements need. The current measuring schemes are based on heterodyning of optical and transformed signals.
Copyrighted
heterodyning of optical and transformed signals.The development of the theory underlying this method resulted in the discovery of a new type of
Copyrighted
The development of the theory underlying this method resulted in the discovery of a new type of waves: photon-density waves or progressively decaying waves of intensity.
Copyrighted
waves: photon-density waves or progressively decaying waves of intensity.vidual photons make random migrations in a scattering medium, but collectively they form a photon-
Copyrighted vidual photons make random migrations in a scattering medium, but collectively they form a photon-density wave at a modulation frequency
Copyrighted density wave at a modulation frequency Photon-density waves possess typical wave properties: for example, they undergo refraction, diffraction,
Copyrighted Photon-density waves possess typical wave properties: for example, they undergo refraction, diffraction, interference, dispersion, and attenuation.
Copyrighted interference, dispersion, and attenuation.Material
interference, dispersion, and attenuation.Material
interference, dispersion, and attenuation.In strongly scattering media with weak absorption far from the walls and a source or a receiver of radia
Material
In strongly scattering media with weak absorption far from the walls and a source or a receiver of radiation, the light distribution may be regarded as a decaying diffusion process described by the time-dependent
Material
tion, the light distribution may be regarded as a decaying diffusion process described by the time-dependent diffusion equation for photon density. For a point light source with harmonic intensity modulation at fre
Material diffusion equation for photon density. For a point light source with harmonic intensity modulation at fre
, an alternating component (AC) of intensity is a going-away spherical
Material , an alternating component (AC) of intensity is a going-away spherical
, which oscillates at a modulation frequency with modulation depth
Material , which oscillates at a modulation frequency with modulation depth
- - - Taylor
Taylor
exTaylor
exp ,Taylor
p ,rp ,rTaylor
rp ,rp ,−p ,Taylor
p ,−p ,Taylor
Taylor Taylor
Taylor
Taylor Taylor
Taylor
Taylor
Taylor
p ,
p ,Taylor
p ,
p ,Taylor
p ,p ,Taylor
p ,p ,Taylor
Taylor
p ,
p ,p ,
p ,Taylor
p ,
p ,p ,
p ,p ,p ,p ,p ,Taylor
p ,p ,p ,p ,p ,
p ,p ,
p ,p ,
p ,p ,
p ,Taylor
p ,
p ,p ,
p ,p ,
p ,p ,
p ,Taylor =
Taylor = 0
Taylor 0 equal to
Taylor equal to
& Francis
Light–Tissue Interactions 131
3.3 Polarized Light Interaction
3.3.1 Tissue Structure and Anisotropy
The randomness of tissue structure results in fast depolarization of light propagating in tissues. However, in certain tissues (transparent tissues, such as eye tissues, cellular monolayers, mucous mem-brane, and superficial skin layers), the degree of polarization of transmitted or reflected light remains measurable even when the tissue is of considerable thickness. From the registered depolarization degree of initially polarized light, the transformed state of polarization, or the appearance of a polarized com-ponent in the scattered light, the information about the structure of tissues and cell ensembles can be extracted.3,5,7,25,30,38–58 As regards practical implications, polarization techniques are believed to give rise to simplified schemes of optical medical tomography compared with time-resolved methods and also provide additional information about the structure of tissues.
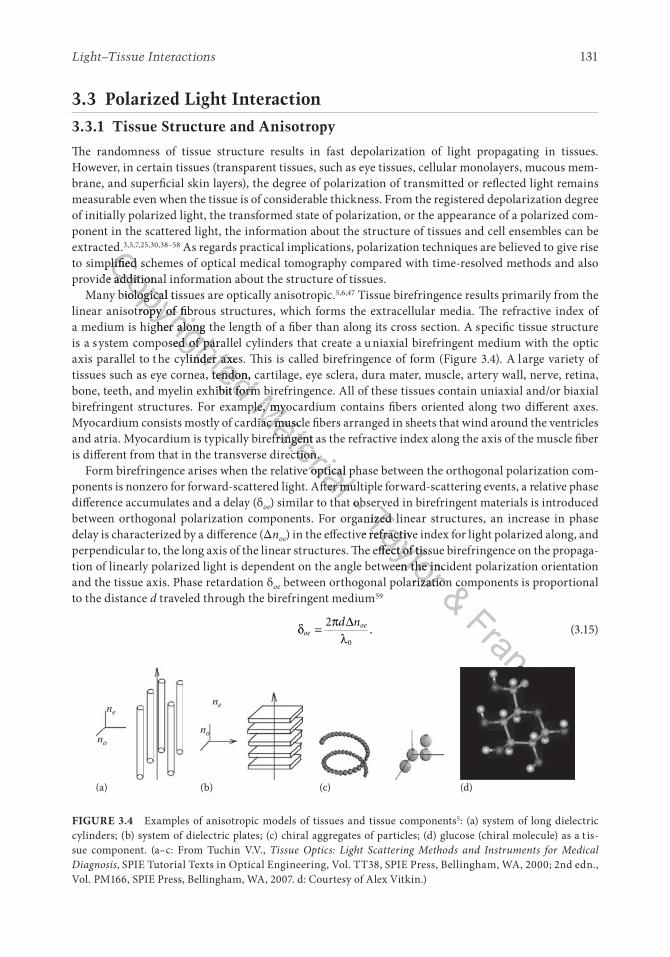
Many biological tissues are optically anisotropic.5,6,47 Tissue birefringence results primarily from the linear anisotropy of fibrous structures, which forms the extracellular media. The refractive index of a medium is higher along the length of a fiber than along its cross section. A specific tissue structure is a system composed of parallel cylinders that create a u niaxial birefringent medium with the optic axis parallel to t he cylinder axes. This is called birefringence of form (Figure 3.4). A large variety of tissues such as eye cornea, tendon, cartilage, eye sclera, dura mater, muscle, artery wall, nerve, retina, bone, teeth, and myelin exhibit form birefringence. All of these tissues contain uniaxial and/or biaxial birefringent structures. For example, myocardium contains fibers oriented along two different axes. Myocardium consists mostly of cardiac muscle fibers arranged in sheets that wind around the ventricles and atria. Myocardium is typically birefringent as the refractive index along the axis of the muscle fiber is different from that in the transverse direction.
Form birefringence arises when the relative optical phase between the orthogonal polarization com-ponents is nonzero for forward-scattered light. After multiple forward-scattering events, a relative phase difference accumulates and a delay (δoe) similar to that observed in birefringent materials is introduced between orthogonal polarization components. For organized linear structures, an increase in phase delay is characterized by a difference (Δnoe) in the effective refractive index for light polarized along, and perpendicular to, the long axis of the linear structures. The effect of tissue birefringence on the propaga-tion of linearly polarized light is dependent on the angle between the incident polarization orientation and the tissue axis. Phase retardation δoe between orthogonal polarization components is proportional to the distance d traveled through the birefringent medium59
δ π ∆λoe
oed n= 2
0
. (3.15)
nene
no
(a) (b) (c) (d)
no
FIGURE 3.4 Examples of anisotropic models of tissues and tissue components5: (a) system of long dielectric cylinders; (b) system of dielectric plates; (c) chiral aggregates of particles; (d) glucose (chiral molecule) as a t is-sue component. (a–c: From Tuchin V.V., Tissue Optics: Light Scattering Methods and Instruments for Medical Diagnosis, SPIE Tutorial Texts in Optical Engineering, Vol. TT38, SPIE Press, Bellingham, WA, 2000; 2nd edn., Vol. PM166, SPIE Press, Bellingham, WA, 2007. d: Courtesy of Alex Vitkin.)
Copyrighted
to simplified schemes of optical medical tomography compared with time-resolved methods and also Copyrighted
to simplified schemes of optical medical tomography compared with time-resolved methods and also provide additional information about the structure of tissues.
Copyrighted
provide additional information about the structure of tissues.Many biological tissues are optically anisotropic.
Copyrighted
Many biological tissues are optically anisotropic.linear anisotropy of fibrous structures, which forms the extracellular media. The refractive index of
Copyrighted
linear anisotropy of fibrous structures, which forms the extracellular media. The refractive index of a medium is higher along the length of a fiber than along its cross section. A specific tissue structure
Copyrighted
a medium is higher along the length of a fiber than along its cross section. A specific tissue structure is a system composed of parallel cylinders that create a u niaxial birefringent medium with the optic
Copyrighted is a system composed of parallel cylinders that create a u niaxial birefringent medium with the optic axis parallel to t he cylinder axes. This is called birefringence of form (Figure 3.4). A large variety of
Copyrighted axis parallel to t he cylinder axes. This is called birefringence of form (Figure 3.4). A large variety of tissues such as eye cornea, tendon, cartilage, eye sclera, dura mater, muscle, artery wall, nerve, retina,
Copyrighted tissues such as eye cornea, tendon, cartilage, eye sclera, dura mater, muscle, artery wall, nerve, retina, bone, teeth, and myelin exhibit form birefringence. All of these tissues contain uniaxial and/or biaxial
Copyrighted bone, teeth, and myelin exhibit form birefringence. All of these tissues contain uniaxial and/or biaxial birefringent structures. For example, myocardium contains fibers oriented along two different axes.
Copyrighted birefringent structures. For example, myocardium contains fibers oriented along two different axes. Material
bone, teeth, and myelin exhibit form birefringence. All of these tissues contain uniaxial and/or biaxial Material
bone, teeth, and myelin exhibit form birefringence. All of these tissues contain uniaxial and/or biaxial birefringent structures. For example, myocardium contains fibers oriented along two different axes. Material
birefringent structures. For example, myocardium contains fibers oriented along two different axes. Myocardium consists mostly of cardiac muscle fibers arranged in sheets that wind around the ventricles
Material
Myocardium consists mostly of cardiac muscle fibers arranged in sheets that wind around the ventricles and atria. Myocardium is typically birefringent as the refractive index along the axis of the muscle fiber
Material and atria. Myocardium is typically birefringent as the refractive index along the axis of the muscle fiber is different from that in the transverse direction.
Material is different from that in the transverse direction.
Form birefringence arises when the relative optical phase between the orthogonal polarization com
Material Form birefringence arises when the relative optical phase between the orthogonal polarization com
ponents is nonzero for forward-scattered light. After multiple forward-scattering events, a relative phase
Material ponents is nonzero for forward-scattered light. After multiple forward-scattering events, a relative phase ) similar to that observed in birefringent materials is introduced
Material ) similar to that observed in birefringent materials is introduced - ) similar to that observed in birefringent materials is introduced - ) similar to that observed in birefringent materials is introduced between orthogonal polarization components. For organized linear structures, an increase in phase
- between orthogonal polarization components. For organized linear structures, an increase in phase Taylor
) similar to that observed in birefringent materials is introduced Taylor
) similar to that observed in birefringent materials is introduced between orthogonal polarization components. For organized linear structures, an increase in phase Taylor
between orthogonal polarization components. For organized linear structures, an increase in phase ) in the effective refractive index for light polarized along, and
Taylor ) in the effective refractive index for light polarized along, and
perpendicular to, the long axis of the linear structures. The effect of tissue birefringence on the propaga
Taylor perpendicular to, the long axis of the linear structures. The effect of tissue birefringence on the propaga
Taylor tion of linearly polarized light is dependent on the angle between the incident polarization orientation
Taylor tion of linearly polarized light is dependent on the angle between the incident polarization orientation between orthogonal polarization components is proportional
Taylor between orthogonal polarization components is proportional & between orthogonal polarization components is proportional & between orthogonal polarization components is proportional
Francis
Francis
Biomedical Photonics Handbook: Fundamentals, Devices, and Techniques132
A medium of parallel cylinders is a p ositive uniaxial birefringent medium [Δnoe = (ne − no) > 0] with its optic axis parallel to the cylinder axes (Figure 3.4a). Therefore, a case defined by an incident electrical field directed parallel to the cylinder axes will be called extraordinary, and a case with the incident electrical field perpendicular to the cylinder axes will be called ordinary. The difference (ne − no) between the extraordinary index and the ordinary index is a measure of the birefringence of a medium comprised of cylinders. For the Rayleigh limit (when the wavelength is much larger than cylinder diameter), the form birefringence becomes59
∆ −−
n n nf f n n
f n f noe e o= ( ) = ( )
+1 2 1 2
2
1 1 2 2
, (3.16)
wheref1 is the volume fraction of the cylindersf2 is the volume fraction of the ground substancen1, n2 are the corresponding indices
For a given index difference, maximal birefringence is expected for approximately equal volume frac-tions of thin cylinders and ground material. For systems with large-diameter cylinders (when the wave-length is much smaller than cylinder diameter), the birefringence goes to zero.
For tissues that could be modeled as a system of thin dielectric plates (Figure 3.4b), the form birefrin-gence is described by the expression5
n nf f n n
f n f ne o2 2 1 2 1 2
1 12
2 22
− −−
= ( )+
, (3.17)
wheref1 is the volume fraction occupied by the platesf2 is the volume fraction of the ground substancen1, n2 are the corresponding indices
This implies that the system behaves like a negative uniaxial crystal with its optical axis aligned nor-mally with the plate surface.
Linear dichroism (diattenuation), that is, different wave attenuation for two orthogonal polariza-tions, in systems formed by long cylinders or plates is defined by the difference between the imagi-nary parts of the effective indices of refraction. Depending on the relationship between the sizes and the optical constants of the cylinders or plates, this difference can take both positive and negative values.60
Reported birefringence values for tendon, muscle, coronary artery, myocardium, sclera, cartilage, and skin are on the order of 10−3. A new technique—polarization-sensitive optical coherence tomog-raphy (OCT)—allows for the measurement of linear birefringence in turbid tissue with high precision. The following data have been reported using this technique: for rodent muscle, 1.4 × 10⁻³; for normal porcine tendon, (4.2 ± 0.3) × 10−3 and for thermally treated tendon (90°C, 20 s), (2.24 ± 0.07) × 10−3; for porcine skin, (1.5 × 1 0−3)–(3.5 × 1 0−3); for bovine cartilage, 3.0 × 1 0−3; and for bovine tendon, (3.7 ± 0.4) ×10−3.54 Such birefringence provides 90% phase retardation at a depth on the order of several hundred micrometers.
The magnitude of birefringence and diattenuation are related to t he density and other proper-ties of the collagen fibers, whereas the orientation of the fast axis indicates the orientation of the
Copyrighted
is the volume fraction of the cylinders
Copyrighted
is the volume fraction of the cylinders is the volume fraction of the ground substance
Copyrighted
is the volume fraction of the ground substance are the corresponding indices
Copyrighted
are the corresponding indices
For a given index difference, maximal birefringence is expected for approximately equal volume frac
Copyrighted For a given index difference, maximal birefringence is expected for approximately equal volume fractions of thin cylinders and ground material. For systems with large-diameter cylinders (when the wave
Copyrighted tions of thin cylinders and ground material. For systems with large-diameter cylinders (when the wavelength is much smaller than cylinder diameter), the birefringence goes to zero.
Copyrighted length is much smaller than cylinder diameter), the birefringence goes to zero.For tissues that could be modeled as a system of thin dielectric plates (Figure 3.4b), the form birefrin
Copyrighted For tissues that could be modeled as a system of thin dielectric plates (Figure 3.4b), the form birefrinMaterial
length is much smaller than cylinder diameter), the birefringence goes to zero.Material
length is much smaller than cylinder diameter), the birefringence goes to zero.For tissues that could be modeled as a system of thin dielectric plates (Figure 3.4b), the form birefrinMaterial
For tissues that could be modeled as a system of thin dielectric plates (Figure 3.4b), the form birefrinMaterial f f
Material f f
f n
Material f n1 2
Material 1 2f f1 2f f
Material f f1 2f f
1 1
Material 1 1f n1 1f n
Material f n1 1f n2
Material 2− −
Material − −=
Material =− −=− −
Material − −=− −+
Material +- Taylor & This implies that the system behaves like a negative uniaxial crystal with its optical axis aligned nor& This implies that the system behaves like a negative uniaxial crystal with its optical axis aligned norFrancis
This implies that the system behaves like a negative uniaxial crystal with its optical axis aligned norFrancis
This implies that the system behaves like a negative uniaxial crystal with its optical axis aligned nor
Linear dichroism (diattenuation), that is, different wave attenuation for two orthogonal polarizaFrancis
Linear dichroism (diattenuation), that is, different wave attenuation for two orthogonal polarizations, in systems formed by long cylinders or plates is defined by the difference between the imagi
Francistions, in systems formed by long cylinders or plates is defined by the difference between the imaginary parts of the effective indices of refraction. Depending on the relationship between the sizes and
Francisnary parts of the effective indices of refraction. Depending on the relationship between the sizes and the optical constants of the cylinders or plates, this difference can take both positive and negative
Francisthe optical constants of the cylinders or plates, this difference can take both positive and negative
Light–Tissue Interactions 133
collagen fibers. The amplitude and orientation of birefringence in the skin and cartilage are not as uniformly distributed as in tendon. In other words, the densities of collagen fibers in skin and car-tilage are not as uniform as in tendon, and the orientation of collagen fibers is not distributed in as orderly a fashion.
In addition to l inear birefringence and dichroism (diattenuation), many tissue components show optical activity. In complex tissue structures, chiral aggregates of particles, in particular spherical par-ticles, may be responsible for tissue optical activity (Figure 3.4c). The molecule’s chirality, which stems from its asymmetric molecular structure, also results in a number of characteristic effects generically called optical activity. A well-known manifestation of optical activity is the ability to rotate the plane of linearly polarized light around the axis of propagation. The amount of rotation depends on the chiral molecular concentration, the path length through the medium, and the light wavelength. Tissues con-taining chiral components display optical activity (Figure 3.4d). Interest in chiral turbid media is driven by the attractive possibility of noninvasive in situ optical monitoring of glucose in diabetic patients.61
Within turbid tissues, however, where the scattering effects dominate, the loss of polarization informa-tion is significant and the chiral effects due to t he small amount of dissolved glucose are difficult to detect (see Chapter 17 of Tuchin61).
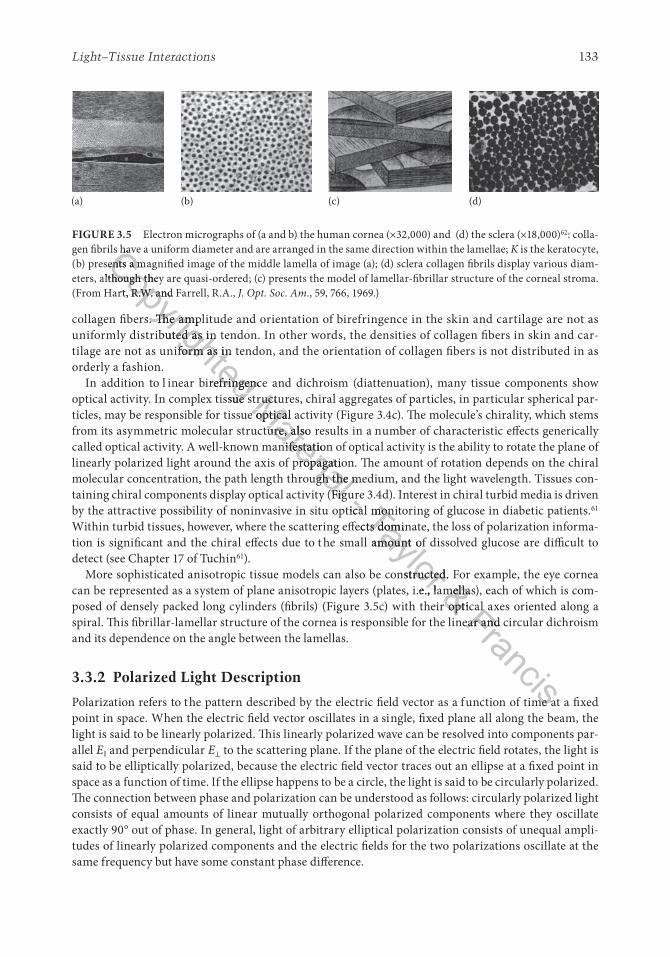
More sophisticated anisotropic tissue models can also be constructed. For example, the eye cornea can be represented as a system of plane anisotropic layers (plates, i.e., lamellas), each of which is com-posed of densely packed long cylinders (fibrils) (Figure 3.5c) with their optical axes oriented along a spiral. This fibrillar-lamellar structure of the cornea is responsible for the linear and circular dichroism and its dependence on the angle between the lamellas.
3.3.2 Polarized Light Description
Polarization refers to the pattern described by the electric field vector as a function of time at a fixed point in space. When the electric field vector oscillates in a single, fixed plane all along the beam, the light is said to be linearly polarized. This linearly polarized wave can be resolved into components par-allel E ǀǀ and perpendicular E⊥ to the scattering plane. If the plane of the electric field rotates, the light is said to be elliptically polarized, because the electric field vector traces out an ellipse at a fixed point in space as a function of time. If the ellipse happens to be a circle, the light is said to be circularly polarized. The connection between phase and polarization can be understood as follows: circularly polarized light consists of equal amounts of linear mutually orthogonal polarized components where they oscillate exactly 90° out of phase. In general, light of arbitrary elliptical polarization consists of unequal ampli-tudes of linearly polarized components and the electric fields for the two polarizations oscillate at the same frequency but have some constant phase difference.
(a) (b) (c) (d)
FIGURE 3.5 Electron micrographs of (a and b) the human cornea (×32,000) and (d) the sclera (×18,000)62: colla-gen fibrils have a uniform diameter and are arranged in the same direction within the lamellae; K is the keratocyte, (b) presents a magnified image of the middle lamella of image (a); (d) sclera collagen fibrils display various diam-eters, although they are quasi-ordered; (c) presents the model of lamellar-fibrillar structure of the corneal stroma. (From Hart, R.W. and Farrell, R.A., J. Opt. Soc. Am., 59, 766, 1969.)
Copyrighted
gen fibrils have a uniform diameter and are arranged in the same direction within the lamellae; Copyrighted
gen fibrils have a uniform diameter and are arranged in the same direction within the lamellae; Copyrighted
(b) presents a magnified image of the middle lamella of image (a); (d) sclera collagen fibrils display various diamCopyrighted
(b) presents a magnified image of the middle lamella of image (a); (d) sclera collagen fibrils display various diameters, although they are quasi-ordered; (c) presents the model of lamellar-fibrillar structure of the corneal stroma.
Copyrighted
eters, although they are quasi-ordered; (c) presents the model of lamellar-fibrillar structure of the corneal stroma. Copyrighted
collagen fibers. The amplitude and orientation of birefringence in the skin and cartilage are not as
Copyrighted
collagen fibers. The amplitude and orientation of birefringence in the skin and cartilage are not as uniformly distributed as in tendon. In other words, the densities of collagen fibers in skin and car
Copyrighted
uniformly distributed as in tendon. In other words, the densities of collagen fibers in skin and cartilage are not as uniform as in tendon, and the orientation of collagen fibers is not distributed in as
Copyrighted tilage are not as uniform as in tendon, and the orientation of collagen fibers is not distributed in as
In addition to l inear birefringence and dichroism (diattenuation), many tissue components show
Copyrighted In addition to l inear birefringence and dichroism (diattenuation), many tissue components show optical activity. In complex tissue structures, chiral aggregates of particles, in particular spherical par
Copyrighted optical activity. In complex tissue structures, chiral aggregates of particles, in particular spherical par
(From Hart, R.W. and Farrell, R.A.,
Copyrighted
(From Hart, R.W. and Farrell, R.A.,
Material
optical activity. In complex tissue structures, chiral aggregates of particles, in particular spherical parMaterial
optical activity. In complex tissue structures, chiral aggregates of particles, in particular spherical particles, may be responsible for tissue optical activity (Figure 3.4c). The molecule’s chirality, which stems
Material
ticles, may be responsible for tissue optical activity (Figure 3.4c). The molecule’s chirality, which stems from its asymmetric molecular structure, also results in a number of characteristic effects generically
Material
from its asymmetric molecular structure, also results in a number of characteristic effects generically called optical activity. A well-known manifestation of optical activity is the ability to rotate the plane of
Material called optical activity. A well-known manifestation of optical activity is the ability to rotate the plane of linearly polarized light around the axis of propagation. The amount of rotation depends on the chiral
Material linearly polarized light around the axis of propagation. The amount of rotation depends on the chiral molecular concentration, the path length through the medium, and the light wavelength. Tissues con
Material molecular concentration, the path length through the medium, and the light wavelength. Tissues containing chiral components display optical activity (Figure 3.4d). Interest in chiral turbid media is driven
Material taining chiral components display optical activity (Figure 3.4d). Interest in chiral turbid media is driven - taining chiral components display optical activity (Figure 3.4d). Interest in chiral turbid media is driven - taining chiral components display optical activity (Figure 3.4d). Interest in chiral turbid media is driven by the attractive possibility of noninvasive in situ optical monitoring of glucose in diabetic patients.- by the attractive possibility of noninvasive in situ optical monitoring of glucose in diabetic patients.Taylor
by the attractive possibility of noninvasive in situ optical monitoring of glucose in diabetic patients.Taylor
by the attractive possibility of noninvasive in situ optical monitoring of glucose in diabetic patients.Within turbid tissues, however, where the scattering effects dominate, the loss of polarization informaTaylor
Within turbid tissues, however, where the scattering effects dominate, the loss of polarization information is significant and the chiral effects due to t he small amount of dissolved glucose are difficult to
Taylor tion is significant and the chiral effects due to t he small amount of dissolved glucose are difficult to
More sophisticated anisotropic tissue models can also be constructed. For example, the eye cornea
Taylor More sophisticated anisotropic tissue models can also be constructed. For example, the eye cornea can be represented as a system of plane anisotropic layers (plates, i.e., lamellas), each of which is com
Taylor can be represented as a system of plane anisotropic layers (plates, i.e., lamellas), each of which is com& can be represented as a system of plane anisotropic layers (plates, i.e., lamellas), each of which is com& can be represented as a system of plane anisotropic layers (plates, i.e., lamellas), each of which is com& posed of densely packed long cylinders (fibrils) (Figure 3.5c) with their optical axes oriented along a & posed of densely packed long cylinders (fibrils) (Figure 3.5c) with their optical axes oriented along a
spiral. This fibrillar-lamellar structure of the cornea is responsible for the linear and circular dichroism
& spiral. This fibrillar-lamellar structure of the cornea is responsible for the linear and circular dichroism Francis
posed of densely packed long cylinders (fibrils) (Figure 3.5c) with their optical axes oriented along a Francis
posed of densely packed long cylinders (fibrils) (Figure 3.5c) with their optical axes oriented along a spiral. This fibrillar-lamellar structure of the cornea is responsible for the linear and circular dichroism Francis
spiral. This fibrillar-lamellar structure of the cornea is responsible for the linear and circular dichroism
Polarization refers to the pattern described by the electric field vector as a function of time at a fixed
FrancisPolarization refers to the pattern described by the electric field vector as a function of time at a fixed
Biomedical Photonics Handbook: Fundamentals, Devices, and Techniques134
Light of arbitrary polarization can be represented by four numbers known as the Stokes parameters, I, Q, U, and V: I refers to the intensity of the light; the parameters Q, U, and V represent the extent of horizontal linear polarization, 45° linear polarization, and circular polarization, respectively.30 In terms of electric field components, the Stokes parameters are given by
I E E E E
Q E E E E
U E E E E
V E E E E
= +== +=
⊥ ⊥
⊥ ⊥
⊥ ⊥
⊥ ⊥
* *
* *
* *
* *
,
,
,
,
−
−
(3.18)
and the irradiance or intensity of light by
I Q U V2 2 2 2≥ + + . (3.19)
For an elementary monochromatic plane or spherical electromagnetic wave, Equation 3.19 is the equal-ity.45 For a partially polarized quasi-monochromatic light, which can be presented as a mixture of ele-mentary waves, the Stokes parameters are sums of the respective Stokes parameters of these elementary waves, because of the fundamental property of additivity. In this case, Equation 3.19 is the inequality.30,45
The polarization state of the scattered light in the far zone is described by the Stokes vector connected with the Stokes vector of the incident light
S M Ss i= ⋅ , (3.20)
whereM is the normalized 4 × 4 scattering matrix (intensity or Mueller’s matrix)
M =
M M M M
M M M M
M M M M
M M M M
11 12 13 14
21 22 23 24
31 32 33 34
41 42 43 44
, (3.21)
Si is the Stokes vector of incident light
In polarimetry, the Stokes vector S of a l ight beam is constructed based on six flux measurements obtained with different polarization analyzers in front of the detector:
S =
=
+
+
I
Q
U
V
I I
I I
I I
I I
H V
H V
R L
−−−
−45 45° °
, (3.22)
where IH, IV, I+45°, I−45°, IR, and IL are the light intensities measured with a horizontal linear polarizer, a vertical linear polarizer, a +45° linear polarizer, a −45° linear polarizer, a right circular analyzer, and
Copyrighted
and the irradiance or intensity of light by
Copyrighted
and the irradiance or intensity of light by
For an elementary monochromatic plane or spherical electromagnetic wave, Equation 3.19 is the equal
Copyrighted For an elementary monochromatic plane or spherical electromagnetic wave, Equation 3.19 is the equal
For a partially polarized quasi-monochromatic light, which can be presented as a mixture of ele
Copyrighted For a partially polarized quasi-monochromatic light, which can be presented as a mixture of elementary waves, the Stokes parameters are sums of the respective Stokes parameters of these elementary
Copyrighted mentary waves, the Stokes parameters are sums of the respective Stokes parameters of these elementary Material
mentary waves, the Stokes parameters are sums of the respective Stokes parameters of these elementary Material
mentary waves, the Stokes parameters are sums of the respective Stokes parameters of these elementary waves, because of the fundamental property of additivity. In this case, Equation 3.19 is the inequality.Material
waves, because of the fundamental property of additivity. In this case, Equation 3.19 is the inequality.The polarization state of the scattered light in the far zone is described by the Stokes vector connected
Material
The polarization state of the scattered light in the far zone is described by the Stokes vector connected with the Stokes vector of the incident light
Material with the Stokes vector of the incident light
S M
Material S M S
Material Ss i
Material s iS Ms iS M
Material S Ms iS M Ss iS
Material Ss iS= ⋅
Material = ⋅S M= ⋅S M
Material S M= ⋅S Ms i= ⋅s i
Material s i= ⋅s iS Ms iS M= ⋅S Ms iS M
Material S Ms iS M= ⋅S Ms iS M - Taylor is the normalized 4 × 4 scattering matrix (intensity or Mueller’s matrix)
Taylor is the normalized 4 × 4 scattering matrix (intensity or Mueller’s matrix)
Taylor M M
Taylor M M11 12 13 14
Taylor 11 12 13 14
Taylor
Taylor & Francis
Light–Tissue Interactions 135
a left circular analyzer in front of the detector, respectively. Because of the relationship IH + IV = I+45° + I−45° = IR + IL = I, where I is the intensity of the light beam measured without any analyzer in front of the detector, a Stokes vector can be determined by four independent measurements.
The degree of linear polarization of scattered light is defined as
PI I
I I
Q U
IL
s s
s
= ( )+( ) =
+ ⊥
⊥
− 2 2 1 2/
, (3.23)
and that of circular polarization as
PV
IC
s
s
= . (3.24)
Elements of the light scattering matrix (LSM) depend on the scattering angle θ, the wavelength, and the geometrical and optical parameters of the scatterers. There are only 7 independent elements (of 16) in the scattering matrix of a single particle with fixed orientation and 9 relations that connect the oth-ers together. For scattering by a collection of randomly oriented scatterers, there are 10 independent parameters.
M11 is what is measured when the incident light is unpolarized, the scattering angle dependence of which is the phase function of the scattered light. It provides only a fraction of the information theo-retically available from scattering experiments. M11 is much less sensitive to chirality and long-range structure than some of the other matrix elements.30 M12 refers to a degree of linear polarization of the scattered light, M22 displays the ratio of depolarized light to the total scattered light (a good measure of scatterer nonsphericity), and M34 displays the transformation of 45° obliquely polarized incident light to circularly polarized scattered light (uniquely characteristic for different biological systems); the differ-ence between M33 and M44 is a good measure of scatterer nonsphericity.
If a particle is small with respect to the wavelength of the incident light, its scattering can be described as if it were a si ngle dipole, and the so-called Rayleigh theory is applicable under the condition that m(2πa/λ) = 1, where m is the relative refractive index of the scatterers, (2πa/λ) is the size parameter, a is the radius of the particle, and λ is the wavelength of the incident light in a medium.30 For NIR light and typical biological scatterers with a refractive index referring to the ground matter m = 1.05–1.1, the maximum particle radius is about 12–14 nm for the Rayleigh theory to remain valid. For this theory, the scattered irradiance is inversely proportional to λ4 and increases as a6, and the angular distribution of the scattered light is isotropic.
The Rayleigh–Gans or Rayleigh–Debye theory addresses the problem of calculating the scatter-ing by a special class of arbitrarily shaped particles; it requires ∣m − 1∣ ≪ 1 and (2πa′/λ) ∣m − 1∣ ≪ 1, where a′ is the largest dimension of the particle.38 These conditions mean that the electric field inside the particle must be close to that of the incident field and the particle can be viewed as a collection of independent dipoles that are all exposed to the same incident field. A biological cell might be modeled as a sphere of cytoplasm with a higher refractive index (n = 1.37) relative to that of the surrounding water medium (n = 1.35), then m = 1.015, and for NIR light this theory will be valid for particles whose dimension is up to a′ = 850–950 nm. This approximation has been applied extensively to calculations of light scattering from suspensions of bacteria.38 It can be applicable for describing light scatter-ing from cell components (mitochondria, lysosomes, peroxisomes, etc.) in tissues due to their small dimensions and refraction.
For describing forward direction scattering caused by large particles (on the order of 10 μm), the Fraunhofer diffraction approximation is useful.38 According to this theory, the scattered light has the same polarization as that of the incident light and the scatter pattern is independent of the refrac-tive index of the object. For small scattering angles, the Fraunhofer diffraction approximation can
Copyrighted
Elements of the light scattering matrix (LSM) depend on the scattering angle
Copyrighted
Elements of the light scattering matrix (LSM) depend on the scattering angle the geometrical and optical parameters of the scatterers. There are only 7 independent elements (of 16)
Copyrighted
the geometrical and optical parameters of the scatterers. There are only 7 independent elements (of 16) in the scattering matrix of a single particle with fixed orientation and 9 relations that connect the oth
Copyrighted in the scattering matrix of a single particle with fixed orientation and 9 relations that connect the others together. For scattering by a collection of randomly oriented scatterers, there are 10 independent
Copyrighted ers together. For scattering by a collection of randomly oriented scatterers, there are 10 independent
is what is measured when the incident light is unpolarized, the scattering angle dependence of
Copyrighted is what is measured when the incident light is unpolarized, the scattering angle dependence of Material
is what is measured when the incident light is unpolarized, the scattering angle dependence of Material
is what is measured when the incident light is unpolarized, the scattering angle dependence of which is the phase function of the scattered light. It provides only a fraction of the information theo
Material
which is the phase function of the scattered light. It provides only a fraction of the information theoretically available from scattering experiments.
Material
retically available from scattering experiments. structure than some of the other matrix elements.
Material structure than some of the other matrix elements.
displays the ratio of depolarized light to the total scattered light (a good measure of
Material displays the ratio of depolarized light to the total scattered light (a good measure of
displays the transformation of 45° obliquely polarized incident light to
Material displays the transformation of 45° obliquely polarized incident light to circularly polarized scattered light (uniquely characteristic for different biological systems); the differ
Material circularly polarized scattered light (uniquely characteristic for different biological systems); the differ- circularly polarized scattered light (uniquely characteristic for different biological systems); the differ- circularly polarized scattered light (uniquely characteristic for different biological systems); the differ is a good measure of scatterer nonsphericity.- is a good measure of scatterer nonsphericity.Taylor
is a good measure of scatterer nonsphericity.Taylor
is a good measure of scatterer nonsphericity.If a particle is small with respect to the wavelength of the incident light, its scattering can be described
Taylor
If a particle is small with respect to the wavelength of the incident light, its scattering can be described as if it were a si ngle dipole, and the so-called Rayleigh theory is applicable under the condition that
Taylor as if it were a si ngle dipole, and the so-called Rayleigh theory is applicable under the condition that
is the relative refractive index of the scatterers, (2
Taylor is the relative refractive index of the scatterers, (2
is the wavelength of the incident light in a medium.
Taylor is the wavelength of the incident light in a medium.
Taylor and typical biological scatterers with a refractive index referring to the ground matter
Taylor and typical biological scatterers with a refractive index referring to the ground matter & and typical biological scatterers with a refractive index referring to the ground matter & and typical biological scatterers with a refractive index referring to the ground matter ayleigh theory to remain valid
& ayleigh theory to remain validFrancis
ayleigh theory to remain validFrancis
ayleigh theory to remain valid, and the angular distribution of Francis
, and the angular distribution of
The Rayleigh–Gans or Rayleigh–Debye theory addresses the problem of calculating the scatter
FrancisThe Rayleigh–Gans or Rayleigh–Debye theory addresses the problem of calculating the scatter
a
Francisa′
Francis′/
Francis/λ
Francisλ)
Francis) ∣
Francis∣mFrancismFrancis − 1
Francis − 1 These conditions mean that the electric field inside
Francis These conditions mean that the electric field inside the particle must be close to that of the incident field and the particle can be viewed as a collection of
Francisthe particle must be close to that of the incident field and the particle can be viewed as a collection of
Biomedical Photonics Handbook: Fundamentals, Devices, and Techniques136
represent accurately the change in irradiance as a function of particle size. That is why this approach is applicable in the laser flow cytometry. The structure of the biological cell such as the cell mem-brane, its nuclear texture, and the granules in the cytoplasm can be represented by variations in optical density.
The Mie or Lorenz–Mie scattering theory is an exact solution of Maxwell’s electromagnetic field equations for a homogeneous sphere.30,38,44–46,60 In the general case, light scattered by a particle becomes elliptically polarized. For spherically symmetric particles of an optically inactive material, the Mueller scattering matrix is given by30
M( )
( ) ( )
( ) ( )
( ) ( )
( )
θ
θ θθ θ
θ θ− θ
=
M M
M M
M M
M M
11 12
12 22
33 34
34 4
0 0
0 0
0 0
0 0 44( )
.
θ
(3.25)
The Mie theory has been extended to arbitrarily coated spheres and to arbitrary cylinders.38,44–46,60 In the Mie theory, the electromagnetic fields of the incident, internal, and scattered waves are each expanded in a series. A linear transformation can be effected between the fields in each of the regions. This approach can also be used for nonspherical objects such as spheroids.44–46 The linear transformation is called the transition matrix (T-matrix). The T-matrix for spherical particles is diagonal.
3.3.3 Single Scattering and Quasi-Ordered Tissues
Healthy tissues of the anterior human eye chamber (e.g., the cornea and lens) are highly transparent to visible light because of their ordered structure and the absence of strongly absorbing chromophors.5,47,63
Scattering is an important feature of light propagation in eye tissues. The size of the scatterers and the distance between them are smaller than or comparable to the wavelength of visible light, and the rela-tive refractive index of the scatterers is equally small (soft particles). Typical eye tissue models are long, round dielectric cylinders (corneal and scleral collagen fibers) (Figure 3.5) or spherical particles (lens protein structures) with a refractive index ns; they are randomly/quasi-orderly (sclera, opaque lens) or regularly (transparent cornea and lens) distributed in the isotropic base matter with a refractive index n0 < ns. Light scattering analysis in eye tissue is often possible using a single scattering model owing to the small scattering cross section.
The corneal stroma is composed of several hundred successively stacked layers of lamellae (Figure 3.5c), which vary in width (0.5–250 μm) and thickness (0.2–0.5 μm), depending on the tissue region (three sequential lamellae are shown in Figure 3.5a). A few flat cells (keratocytes) are dispersed between the lamellae, and these occupy only 0.03–0.05 of the stromal volume. Each lamella is composed of a parallel array of collagen fibrils.
The fibrils in the human cornea have a uniform diameter of about 30.8 ± 0.8 nm with a periodic-ity close to t wo diameters, 55.3 ± 4 .0 nm, and rather high regularity in the organization of fibril axes around one another (Figures 3.5a, b and 3.6a). The intermolecular spacing is 1.63 ± 0.10 nm.64
Thus, the stroma has at least three levels of structural organization: the lamellae that lie parallel to the cornea’s surface; the fibrillar structure within each lamella that consists of small, parallel col-lagen fibrils with uniform diameters that have some degree of order in their spatial positions; and the collagen molecular ultrastructure. In the scleral stroma, the collagen fibrils exhibit a wide range of diameters, from 25 to 2 30 nm, and the mean distance between fibril centers is about 285 nm (Figures 3.5d and 3.6b). Collagen intermolecular spacing is similar to that in the cornea; in bovine
Copyrighted The Mie theory has been extended to arbitrarily coated spheres and to arbitrary cylinders.
Copyrighted The Mie theory has been extended to arbitrarily coated spheres and to arbitrary cylinders.Mie theory, the electromagnetic fields of the incident, internal, and scattered waves are each expanded in
Copyrighted Mie theory, the electromagnetic fields of the incident, internal, and scattered waves are each expanded in a series. A linear transformation can be effected between the fields in each of the regions. This approach
Copyrighted a series. A linear transformation can be effected between the fields in each of the regions. This approach can also be used for nonspherical objects such as spheroids.
Copyrighted can also be used for nonspherical objects such as spheroids.Material
a series. A linear transformation can be effected between the fields in each of the regions. This approach Material
a series. A linear transformation can be effected between the fields in each of the regions. This approach can also be used for nonspherical objects such as spheroids.Material
can also be used for nonspherical objects such as spheroids.transition matrix (T-matrix). The T-matrix for spherical particles is diagonal.
Material
transition matrix (T-matrix). The T-matrix for spherical particles is diagonal.
ingle Scattering and Quasi-Ordered Tissues
Material ingle Scattering and Quasi-Ordered Tissues
Healthy tissues of the anterior human eye chamber (e.g., the cornea and lens) are highly transparent to
Material Healthy tissues of the anterior human eye chamber (e.g., the cornea and lens) are highly transparent to - visible light because of their ordered structure and the absence of strongly absorbing chromophors.- visible light because of their ordered structure and the absence of strongly absorbing chromophors.Taylor
visible light because of their ordered structure and the absence of strongly absorbing chromophors.Taylor
visible light because of their ordered structure and the absence of strongly absorbing chromophors.Scattering is an important feature of light propagation in eye tissues. The size of the scatterers and the Taylor
Scattering is an important feature of light propagation in eye tissues. The size of the scatterers and the distance between them are smaller than or comparable to the wavelength of visible light, and the rela
Taylor distance between them are smaller than or comparable to the wavelength of visible light, and the relative refractive index of the scatterers is equally small (soft particles). Typical eye tissue models are long,
Taylor tive refractive index of the scatterers is equally small (soft particles). Typical eye tissue models are long, round dielectric cylinders (corneal and scleral collagen fibers) (Figure 3.5) or spherical particles (lens
Taylor round dielectric cylinders (corneal and scleral collagen fibers) (Figure 3.5) or spherical particles (lens ; they are randomly/quasi-orderly (sclera, opaque lens) or
Taylor ; they are randomly/quasi-orderly (sclera, opaque lens) or regularly (transparent cornea and lens) distributed in the isotropic base matter with a refractive index
Taylor regularly (transparent cornea and lens) distributed in the isotropic base matter with a refractive index &
; they are randomly/quasi-orderly (sclera, opaque lens) or & ; they are randomly/quasi-orderly (sclera, opaque lens) or
regularly (transparent cornea and lens) distributed in the isotropic base matter with a refractive index & regularly (transparent cornea and lens) distributed in the isotropic base matter with a refractive index . Light scattering analysis in eye tissue is often possible using a single scattering model owing to
& . Light scattering analysis in eye tissue is often possible using a single scattering model owing to Francis
regularly (transparent cornea and lens) distributed in the isotropic base matter with a refractive index Francis
regularly (transparent cornea and lens) distributed in the isotropic base matter with a refractive index . Light scattering analysis in eye tissue is often possible using a single scattering model owing to Francis
. Light scattering analysis in eye tissue is often possible using a single scattering model owing to
The corneal stroma is composed of several hundred successively stacked layers of lamellae
FrancisThe corneal stroma is composed of several hundred successively stacked layers of lamellae
Francism), depending on the tissue
Francism), depending on the tissue region (three sequential lamellae are shown in Figure 3.5a). A few flat cells (keratocytes) are dispersed
Francisregion (three sequential lamellae are shown in Figure 3.5a). A few flat cells (keratocytes) are dispersed between the lamellae, and these occupy only 0.03–0.05 of the stromal volume. Each lamella is composed
Francisbetween the lamellae, and these occupy only 0.03–0.05 of the stromal volume. Each lamella is composed
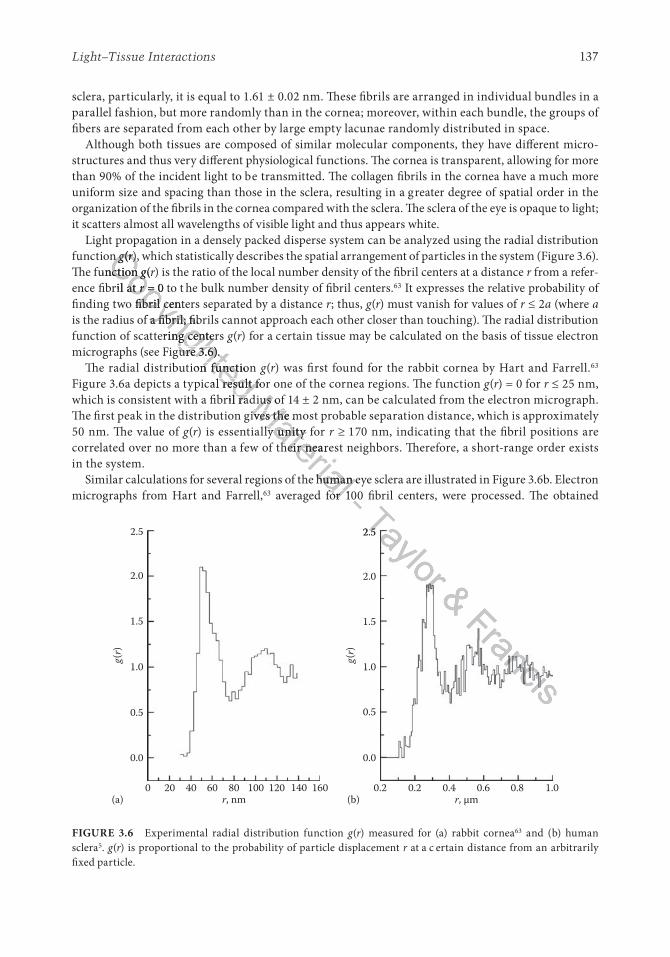
Light–Tissue Interactions 137
sclera, particularly, it is equal to 1.61 ± 0.02 nm. These fibrils are arranged in individual bundles in a parallel fashion, but more randomly than in the cornea; moreover, within each bundle, the groups of fibers are separated from each other by large empty lacunae randomly distributed in space.
Although both tissues are composed of similar molecular components, they have different micro-structures and thus very different physiological functions. The cornea is transparent, allowing for more than 90% of the incident light to be transmitted. The collagen fibrils in the cornea have a much more uniform size and spacing than those in the sclera, resulting in a greater degree of spatial order in the organization of the fibrils in the cornea compared with the sclera. The sclera of the eye is opaque to light; it scatters almost all wavelengths of visible light and thus appears white.
Light propagation in a densely packed disperse system can be analyzed using the radial distribution function g(r), which statistically describes the spatial arrangement of particles in the system (Figure 3.6). The function g(r) is the ratio of the local number density of the fibril centers at a distance r from a refer-ence fibril at r = 0 to t he bulk number density of fibril centers.63 It expresses the relative probability of finding two fibril centers separated by a distance r; thus, g(r) must vanish for values of r ≤ 2a (where a is the radius of a fibril; fibrils cannot approach each other closer than touching). The radial distribution function of scattering centers g(r) for a certain tissue may be calculated on the basis of tissue electron micrographs (see Figure 3.6).
The radial distribution function g(r) was first found for the rabbit cornea by Hart and Farrell.63
Figure 3.6a depicts a typical result for one of the cornea regions. The function g(r) = 0 for r ≤ 25 nm, which is consistent with a fibril radius of 14 ± 2 nm, can be calculated from the electron micrograph. The first peak in the distribution gives the most probable separation distance, which is approximately 50 nm. The value of g(r) is essentially unity for r ≥ 170 nm, indicating that the fibril positions are correlated over no more than a few of their nearest neighbors. Therefore, a short-range order exists in the system.
Similar calculations for several regions of the human eye sclera are illustrated in Figure 3.6b. Electron micrographs from Hart and Farrell,63 averaged for 100 fibril centers, were processed. The obtained
2.5
2.0
g(r)
1.5
1.0
0.5
0.0
2.5
2.0
g(r)
1.5
1.0
0.5
0.0
20 40 60r, nm r, μm
80 100 120 140 160 0.2 0.2 0.4 0.6 0.8 1.00(a) (b)
FIGURE 3.6 Experimental radial distribution function g(r) measured for (a) rabbit cornea63 and (b) human sclera5. g(r) is proportional to the probability of particle displacement r at a c ertain distance from an arbitrarily fixed particle.
Copyrighted
function Copyrighted
function gCopyrighted
g(Copyrighted
(rCopyrighted
r), which statistically describes the spatial arrangement of particles in the system (Figure 3.6). Copyrighted
), which statistically describes the spatial arrangement of particles in the system (Figure 3.6). r), which statistically describes the spatial arrangement of particles in the system (Figure 3.6). rCopyrighted
r), which statistically describes the spatial arrangement of particles in the system (Figure 3.6). rThe function
Copyrighted
The function gCopyrighted
g(Copyrighted
(rCopyrighted
r) is the ratio of the local number density of the fibril centers at a distance Copyrighted
) is the ratio of the local number density of the fibril centers at a distance ence fibril at
Copyrighted
ence fibril at r
Copyrighted
r = 0 to t he bulk number density of fibril centers.
Copyrighted
= 0 to t he bulk number density of fibril centers.r = 0 to the bulk number density of fibril centers.r
Copyrighted
r = 0 to the bulk number density of fibril centers.rfinding two fibril centers separated by a distance
Copyrighted
finding two fibril centers separated by a distance
Copyrighted
is the radius of a fibril; fibrils cannot approach each other closer than touching). The radial distribution
Copyrighted
is the radius of a fibril; fibrils cannot approach each other closer than touching). The radial distribution function of scattering centers
Copyrighted
function of scattering centers micrographs (see Figure 3.6).
Copyrighted micrographs (see Figure 3.6).
The radial distribution function
Copyrighted The radial distribution function
Figure 3.6a depicts a typical result for one of the cornea regions. The function
Copyrighted Figure 3.6a depicts a typical result for one of the cornea regions. The function which is consistent with a fibril radius of 14 ± 2 nm, can be calculated from the electron micrograph.
Copyrighted which is consistent with a fibril radius of 14 ± 2 nm, can be calculated from the electron micrograph. Material
which is consistent with a fibril radius of 14 ± 2 nm, can be calculated from the electron micrograph. Material
which is consistent with a fibril radius of 14 ± 2 nm, can be calculated from the electron micrograph. The first peak in the distribution gives the most probable separation distance, which is approximately
Material
The first peak in the distribution gives the most probable separation distance, which is approximately ) is essentially unity for
Material
) is essentially unity for
Material correlated over no more than a few of their nearest neighbors. Therefore, a short-range order exists
Material correlated over no more than a few of their nearest neighbors. Therefore, a short-range order exists
Similar calculations for several regions of the human eye sclera are illustrated in Figure 3.6b. Electron
Material Similar calculations for several regions of the human eye sclera are illustrated in Figure 3.6b. Electron averaged for 100 fibril centers, were processed. The obtained
Material averaged for 100 fibril centers, were processed. The obtained - averaged for 100 fibril centers, were processed. The obtained - averaged for 100 fibril centers, were processed. The obtained Taylor 2.5Taylor 2.5Taylor & Francis
Francis
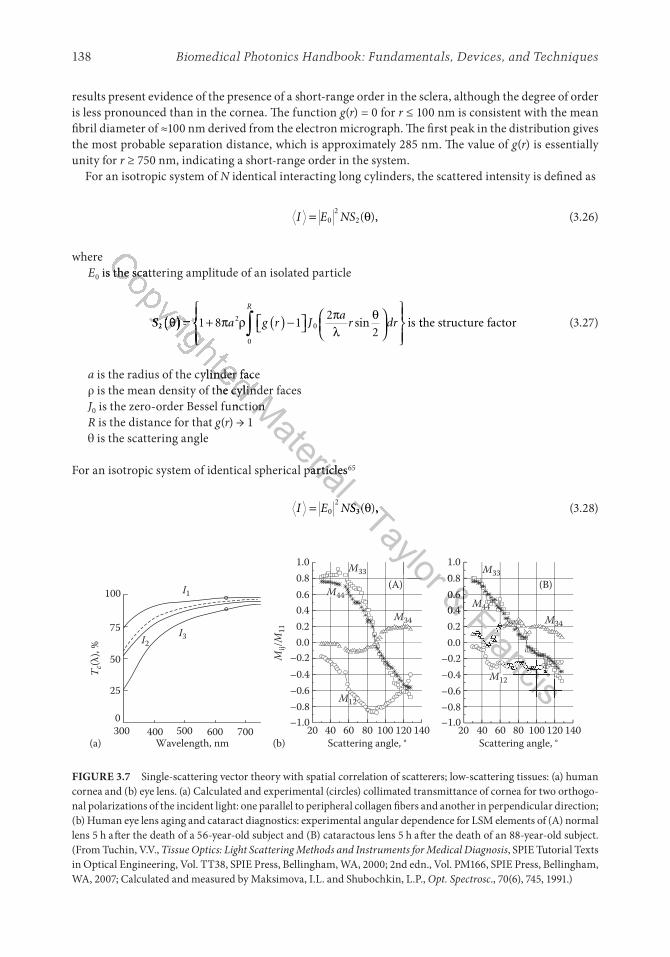
Biomedical Photonics Handbook: Fundamentals, Devices, and Techniques138
results present evidence of the presence of a short-range order in the sclera, although the degree of order is less pronounced than in the cornea. The function g(r) = 0 for r ≤ 100 nm is consistent with the mean fibril diameter of ≈100 nm derived from the electron micrograph. The first peak in the distribution gives the most probable separation distance, which is approximately 285 nm. The value of g(r) is essentially unity for r ≥ 750 nm, indicating a short-range order in the system.
For an isotropic system of N identical interacting long cylinders, the scattered intensity is defined as
I E NS= 02
2( ),θ (3.26)
whereE0 is the scattering amplitude of an isolated particle
S a g r Ja
r dr
R
22
0
01 8 12
2θ π ρ − π
λθ( ) = + ( )
∫ sin is tthe structure factor (3.27)
a is the radius of the cylinder faceρ is the mean density of the cylinder facesJ0 is the zero-order Bessel functionR is the distance for that g(r) → 1θ is the scattering angle
For an isotropic system of identical spherical particles65
I E NS= 02
3( ),θ (3.28)
–1.0700600
Wavelength, nm
T c(λ
), %
5004003000
25
50
75
100 I1
I2I3
–0.6–0.8
–0.4–0.2
0.00.20.40.60.81.0
(a)
M33
M12
Mij/M
11
Scattering angle, °20 40 60 80 100 120 140 20 40 60 80 100 120 140
–1.0–0.8–0.6–0.4–0.2
0.00.20.40.60.81.0
(b)
M34
M33
Scattering angle, °
M44M44
M12
(A) (B)
M34
FIGURE 3.7 Single-scattering vector theory with spatial correlation of scatterers; low-scattering tissues: (a) human cornea and (b) eye lens. (a) Calculated and experimental (circles) collimated transmittance of cornea for two orthogo-nal polarizations of the incident light: one parallel to peripheral collagen fibers and another in perpendicular direction; (b) Human eye lens aging and cataract diagnostics: experimental angular dependence for LSM elements of (A) normal lens 5 h after the death of a 56-year-old subject and (B) cataractous lens 5 h after the death of an 88-year-old subject. (From Tuchin, V.V., Tissue Optics: Light Scattering Methods and Instruments for Medical Diagnosis, SPIE Tutorial Texts in Optical Engineering, Vol. TT38, SPIE Press, Bellingham, WA, 2000; 2nd edn., Vol. PM166, SPIE Press, Bellingham, WA, 2007; Calculated and measured by Maksimova, I.L. and Shubochkin, L.P., Opt. Spectrosc., 70(6), 745, 1991.)
Copyrighted
is the scattering amplitude of an isolated particleCopyrighted
is the scattering amplitude of an isolated particle
S a
Copyrighted
S a2
Copyrighted
2S a2S a
Copyrighted
S a2S aθ π
Copyrighted
θ πS aθ πS a
Copyrighted
S aθ πS aS a1 8S aθ πS a1 8S a
Copyrighted
S a1 8S aθ πS a1 8S aθ π
Copyrighted
θ πS aθ πS a
Copyrighted
S aθ πS a( )
Copyrighted
( )S a( )S a
Copyrighted
S a( )S aθ π( )θ π
Copyrighted
θ π( )θ πS aθ πS a( )S aθ πS a
Copyrighted
S aθ πS a( )S aθ πS aS aθ πS a= +S aθ πS a
Copyrighted
S aθ πS a= +S aθ πS aS a1 8S aθ πS a1 8S a= +S a1 8S aθ πS a1 8S a
Copyrighted
S a1 8S aθ πS a1 8S a= +S a1 8S aθ πS a1 8S aS aθ πS a= +S aθ πS a
Copyrighted
S aθ πS a= +S aθ πS a
Copyrighted
θ πθ π
Copyrighted
θ πθ πS aθ πS aS aθ πS a
Copyrighted
S aθ πS aS aθ πS a
Copyrighted
θ πθ π
Copyrighted
θ πθ πS aθ πS aS aθ πS a
Copyrighted
S aθ πS aS aθ πS aS aθ πS a= +S aθ πS aS aθ πS a= +S aθ πS a
Copyrighted
S aθ πS a= +S aθ πS aS aθ πS a= +S aθ πS aS aθ πS aS aθ πS a
S aθ πS aS aθ πS a
Copyrighted
S aθ πS aS aθ πS a
S aθ πS aS aθ πS aS aθ πS a= +S aθ πS aS aθ πS a= +S aθ πS a
S aθ πS a= +S aθ πS aS aθ πS a= +S aθ πS a
Copyrighted
S aθ πS a= +S aθ πS aS aθ πS a= +S aθ πS a
S aθ πS a= +S aθ πS aS aθ πS a= +S aθ πS a
Copyrighted
Copyrighted
Copyrighted
Copyrighted
is the radius of the cylinder face
Copyrighted is the radius of the cylinder face is the mean density of the cylinder faces
Copyrighted is the mean density of the cylinder faces is the zero-order Bessel function
Copyrighted is the zero-order Bessel functionMaterial
is the mean density of the cylinder facesMaterial
is the mean density of the cylinder faces is the zero-order Bessel functionMaterial
is the zero-order Bessel function
For an isotropic system of identical spherical particles
Material For an isotropic system of identical spherical particles
- NS- NS3- 3( )- ( )Taylor
( )Taylor
( ),Taylor
,Taylor 0.8
Taylor 0.8& & 0.4& 0.4
0.6& 0.6& M& MFrancis
Francis
Francis
Francis
Francis
Francis
Francis
Francis
Francis
Francis
Francis
Francis
Francis
Francis
Francis
Francis
Francis
Francis
Francis
Francis
Francis
Francis
Francis
Francis
Francis
Francis
Francis
Francis
Francis
Francis
Francis
Francis
Francis
Francis
Francis
Francis
Francis
Francis
Francis
Francis
Francis
Francis
Francis
Francis
Francis
Francis
Francis
Francis
Francis
Francis
Francis
Francis
Francis
Francis
Francis
Francis
Francis
Francis
Francis
Francis
Francis
Francis
Francis
Francis
Francis
Francis
Francis
Francis
Francis
Francis
Francis
Francis
Francis
Francis
Francis
Francis
Francis
Francis
Francis
Francis
Francis
Francis
Francis
Francis
Francis
Francis
Francis
Francis
Francis
Francis
Francis
Francis
44Francis
44
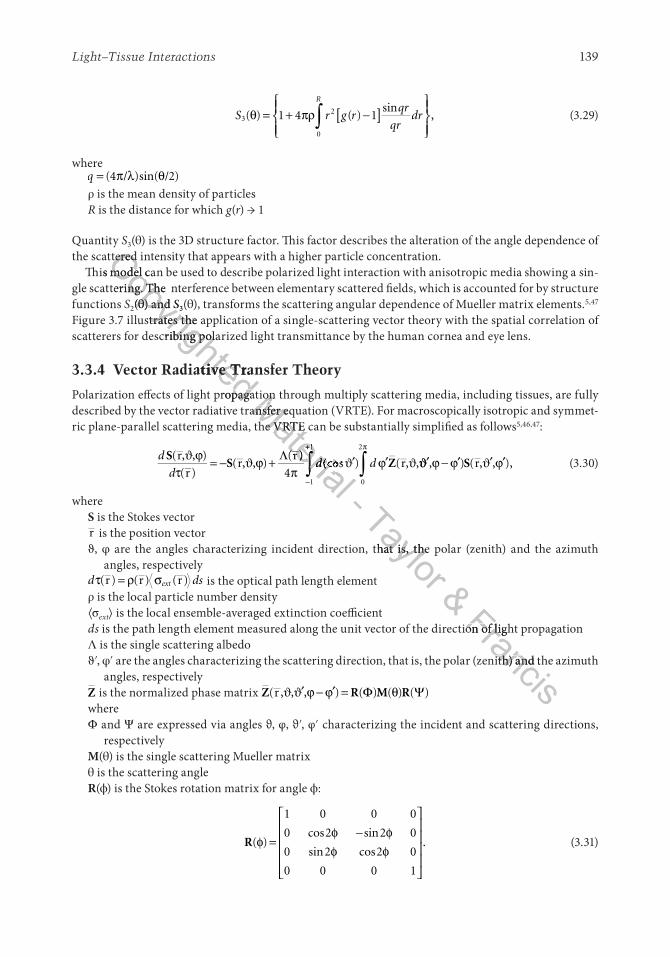
Light–Tissue Interactions 139
S r g rqr
qrdr
R
3
0
21 4 1( ) ( )sin
,θ πρ −= + [ ]
∫ (3.29)
whereq = ( )sin( )4 2π λ θ/ /
ρ is the mean density of particlesR is the distance for which g(r) → 1
Quantity S3(θ) is the 3D structure factor. This factor describes the alteration of the angle dependence of the scattered intensity that appears with a higher particle concentration.
This model can be used to describe polarized light interaction with anisotropic media showing a sin-gle scattering. The nterference between elementary scattered fields, which is accounted for by structure functions S2(θ) and S3(θ), transforms the scattering angular dependence of Mueller matrix elements.5,47
Figure 3.7 illustrates the application of a single-scattering vector theory with the spatial correlation of scatterers for describing polarized light transmittance by the human cornea and eye lens.
3.3.4 Vector Radiative Transfer Theory
Polarization effects of light propagation through multiply scattering media, including tissues, are fully described by the vector radiative transfer equation (VRTE). For macroscopically isotropic and symmet-ric plane-parallel scattering media, the VRTE can be substantially simplified as follows5,46,47:
d
dd d
SS Z
( )
( )( )
( )(cos ) (
r, ,
rr, ,
rr, ,
ϑ ϕτ
− ϑ ϕ Λπ
ϑ ϕ ϑ−
π
= + ′ ′ ′+
∫ ∫41
1
0
2
ϑϑ ϕ − ϕ ϑ ϕ, r, ,′ ′ ′) ( ),S (3.30)
whereS is the Stokes vectorr is the position vectorϑ, φ are the angles characterizing incident direction, that is, the polar (zenith) and the azimuth
angles, respectivelyd dsextτ ρ σ( ) ( ) ( )r r r= is the optical path length elementρ is the local particle number density⟨σext⟩ is the local ensemble-averaged extinction coefficientds is the path length element measured along the unit vector of the direction of light propagationΛ is the single scattering albedoϑ′, φ′ are the angles characterizing the scattering direction, that is, the polar (zenith) and the azimuth
angles, respectivelyZ is the normalized phase matrix Z R M R( ) ( ) ( ) ( )r , , ,ϑ ϑ ϕ − ϕ Φ θ Ψ′ ′ =whereΦ and Ψ are expressed via angles ϑ, φ, ϑ′, φ′ characterizing the incident and scattering directions,
respectivelyM(θ) is the single scattering Mueller matrixθ is the scattering angleR(ϕ) is the Stokes rotation matrix for angle ϕ:
R( )cos sin
sin cos.φ
φ − φφ φ
=
1 0 0 0
0 2 2 0
0 2 2 0
0 0 0 1
(3.31)
Copyrighted
the scattered intensity that appears with a higher particle concentration.Copyrighted
the scattered intensity that appears with a higher particle concentration.This model can be used to describe polarized light interaction with anisotropic media showing a sin
Copyrighted
This model can be used to describe polarized light interaction with anisotropic media showing a single scattering. The nterference between elementary scattered fields, which is accounted for by structure
Copyrighted
gle scattering. The nterference between elementary scattered fields, which is accounted for by structure S
Copyrighted
S (
Copyrighted
(θ
Copyrighted
θ) and
Copyrighted
) and S
Copyrighted
S3
Copyrighted
3(
Copyrighted
(Figure 3.7 illustrates the application of a single-scattering vector theory with the spatial correlation of
Copyrighted
Figure 3.7 illustrates the application of a single-scattering vector theory with the spatial correlation of scatterers for describing polarized light transmittance by the human cornea and eye lens.
Copyrighted
scatterers for describing polarized light transmittance by the human cornea and eye lens.
ector Radiative Transfer Theory
Copyrighted ector Radiative Transfer Theory
Polarization effects of light propagation through multiply scattering media, including tissues, are fully
Copyrighted Polarization effects of light propagation through multiply scattering media, including tissues, are fully described by the vector radiative transfer equation (VRTE). For macroscopically isotropic and symmet
Copyrighted described by the vector radiative transfer equation (VRTE). For macroscopically isotropic and symmetMaterial
Polarization effects of light propagation through multiply scattering media, including tissues, are fully Material
Polarization effects of light propagation through multiply scattering media, including tissues, are fully described by the vector radiative transfer equation (VRTE). For macroscopically isotropic and symmetMaterial
described by the vector radiative transfer equation (VRTE). For macroscopically isotropic and symmetric plane-parallel scattering media, the VRTE can be substantially simplified as follows
Material
ric plane-parallel scattering media, the VRTE can be substantially simplified as follows
S Z
Material S ZS Z
Material S Z
( )
Material ( )( )
Material ( )
S Z( )
S Z
Material S Z
( )S Z
( )r( )
Material ( )r( )
Material +
Material +
∫ ∫
Material ∫ ∫d d∫ ∫d d
Material d d∫ ∫d dS Z∫ ∫S Z
Material S Z∫ ∫S Zd dS Zd d∫ ∫d dS Zd d
Material d dS Zd d∫ ∫d dS Zd d(cos∫ ∫(cos
Material (cos∫ ∫(cosd d(cosd d∫ ∫d d(cosd d
Material d d(cosd d∫ ∫d d(cosd dS Z(cosS Z∫ ∫S Z(cosS Z
Material S Z(cosS Z∫ ∫S Z(cosS Zd dS Zd d(cosd dS Zd d∫ ∫d dS Zd d(cosd dS Zd d
Material d dS Zd d(cosd dS Zd d∫ ∫d dS Zd d(cosd dS Zd dϑ ϕ∫ ∫ϑ ϕ
Material ϑ ϕ∫ ∫ϑ ϕ
1
Material 1
- Taylor are the angles characterizing incident direction, that is, the polar (zenith) and the azimuth
Taylor are the angles characterizing incident direction, that is, the polar (zenith) and the azimuth
& Francis
is the path length element measured along the unit vector of the direction of light propagationFrancis
is the path length element measured along the unit vector of the direction of light propagation
are the angles characterizing the scattering direction, that is, the polar (zenith) and the azimuth
Francis are the angles characterizing the scattering direction, that is, the polar (zenith) and the azimuth
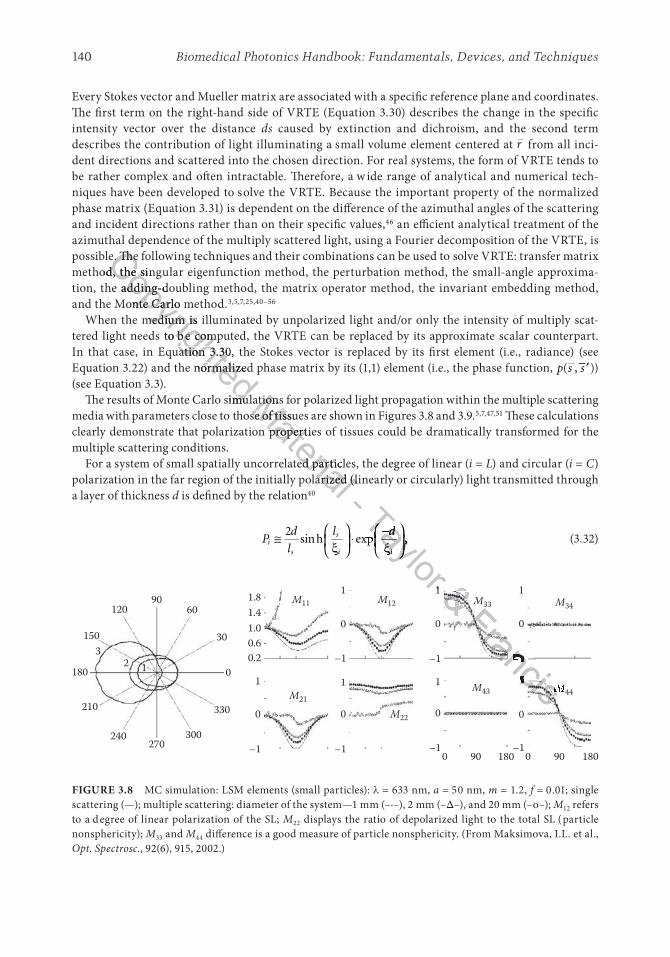
Biomedical Photonics Handbook: Fundamentals, Devices, and Techniques140
Every Stokes vector and Mueller matrix are associated with a specific reference plane and coordinates. The first term on the right-hand side of VRTE (Equation 3.30) describes the change in the specific intensity vector over the distance ds caused by extinction and dichroism, and the second term describes the contribution of light illuminating a small volume element centered at r from all inci-dent directions and scattered into the chosen direction. For real systems, the form of VRTE tends to be rather complex and often intractable. Therefore, a w ide range of analytical and numerical tech-niques have been developed to solve the VRTE. Because the important property of the normalized phase matrix (Equation 3.31) is dependent on the difference of the azimuthal angles of the scattering and incident directions rather than on their specific values,46 an efficient analytical treatment of the azimuthal dependence of the multiply scattered light, using a Fourier decomposition of the VRTE, is possible. The following techniques and their combinations can be used to solve VRTE: transfer matrix method, the singular eigenfunction method, the perturbation method, the small-angle approxima-tion, the adding-doubling method, the matrix operator method, the invariant embedding method, and the Monte Carlo method.3,5,7,25,40–56
When the medium is illuminated by unpolarized light and/or only the intensity of multiply scat-tered light needs to be computed, the VRTE can be replaced by its approximate scalar counterpart. In that case, in Equation 3.30, the Stokes vector is replaced by its first element (i.e., radiance) (see Equation 3.22) and the normalized phase matrix by its (1,1) element (i.e., the phase function, p s( , )−′s ) (see Equation 3.3).
The results of Monte Carlo simulations for polarized light propagation within the multiple scattering media with parameters close to those of tissues are shown in Figures 3.8 and 3.9.5,7,47,51 These calculations clearly demonstrate that polarization properties of tissues could be dramatically transformed for the multiple scattering conditions.
For a system of small spatially uncorrelated particles, the degree of linear (i = L) and circular (i = C) polarization in the far region of the initially polarized (linearly or circularly) light transmitted through a layer of thickness d is defined by the relation40
Pd
l
l di
s
s
i i
≅
⋅
2sin ,h exp
ξ−ξ
(3.32)
90120
1503
2 1180
210
240
60
30
1.8 1
0
–1
1
0
–1
1
0
–1
M11 M12
M21
M22
1.41.00.60.2
0
330
300
M34
1
0
–1
1
0
–1
1
0
–1
1
0
0 90 1800 90 180–1
M33
M44M43
270
FIGURE 3.8 MC simulation: LSM elements (small particles): λ = 633 nm, a = 50 nm, m = 1.2, f = 0.01; single scattering (—); multiple scattering: diameter of the system—1 mm (–·–), 2 mm (–Δ–), and 20 mm (–o–); M12 refers to a degree of linear polarization of the SL; M22 displays the ratio of depolarized light to the total SL (particle nonsphericity); M33 and M44 difference is a good measure of particle nonsphericity. (From Maksimova, I.L. et al., Opt. Spectrosc., 92(6), 915, 2002.)
Copyrighted
possible. The following techniques and their combinations can be used to solve VRTE: transfer matrix Copyrighted
possible. The following techniques and their combinations can be used to solve VRTE: transfer matrix method, the singular eigenfunction method, the perturbation method, the small-angle approxima
Copyrighted
method, the singular eigenfunction method, the perturbation method, the small-angle approximation, the adding-doubling method, the matrix operator method, the invariant embedding method,
Copyrighted
tion, the adding-doubling method, the matrix operator method, the invariant embedding method, and the Monte Carlo method.
Copyrighted
and the Monte Carlo method.When the medium is illuminated by unpolarized light and/or only the intensity of multiply scat
Copyrighted
When the medium is illuminated by unpolarized light and/or only the intensity of multiply scattered light needs to be computed, the VRTE can be replaced by its approximate scalar counterpart.
Copyrighted
tered light needs to be computed, the VRTE can be replaced by its approximate scalar counterpart. In that case, in Equation 3.30, the Stokes vector is replaced by its first element (i.e., radiance) (see
Copyrighted In that case, in Equation 3.30, the Stokes vector is replaced by its first element (i.e., radiance) (see Equation 3.22) and the normalized phase matrix by its (1,1) element (i.e., the phase function,
Copyrighted Equation 3.22) and the normalized phase matrix by its (1,1) element (i.e., the phase function,
The results of Monte Carlo simulations for polarized light propagation within the multiple scattering
Copyrighted The results of Monte Carlo simulations for polarized light propagation within the multiple scattering Material
The results of Monte Carlo simulations for polarized light propagation within the multiple scattering Material
The results of Monte Carlo simulations for polarized light propagation within the multiple scattering media with parameters close to those of tissues are shown in Figures 3.8 and 3.9.
Material
media with parameters close to those of tissues are shown in Figures 3.8 and 3.9.clearly demonstrate that polarization properties of tissues could be dramatically transformed for the
Material
clearly demonstrate that polarization properties of tissues could be dramatically transformed for the
For a system of small spatially uncorrelated particles, the degree of linear (
Material For a system of small spatially uncorrelated particles, the degree of linear (
polarization in the far region of the initially polarized (linearly or circularly) light transmitted through
Material polarization in the far region of the initially polarized (linearly or circularly) light transmitted through
- Taylor l d
Taylor l d
i i
Taylor i i
Taylor
l dl dTaylor
l dl d
Taylor i ii i
Taylor i ii i
Taylor l dl d
l dl dTaylor
l dl d
l dl d
Taylor
Taylor
Taylor
Taylor
Taylor
n ,
Taylor n ,n ,
Taylor n ,
n ,
Taylor
n ,
n ,
Taylor
n ,n ,
Taylor n ,
n ,
Taylor
n ,
n ,
Taylor
n ,
n ,
Taylor
n ,
n ,
Taylor
n ,n ,
Taylor n ,
n ,
Taylor
n ,
n ,
Taylor
n ,
xp
Taylor xpn ,xpn ,
Taylor n ,xpn ,
l d−l dTaylor
l d−l d
ξ
Taylor ξi iξi i
Taylor i iξi i
n ,ξ
n ,
Taylor n ,
ξn ,
1
Taylor 1& & M& MFrancis–1
Francis–1
1
Francis1M
Francis M
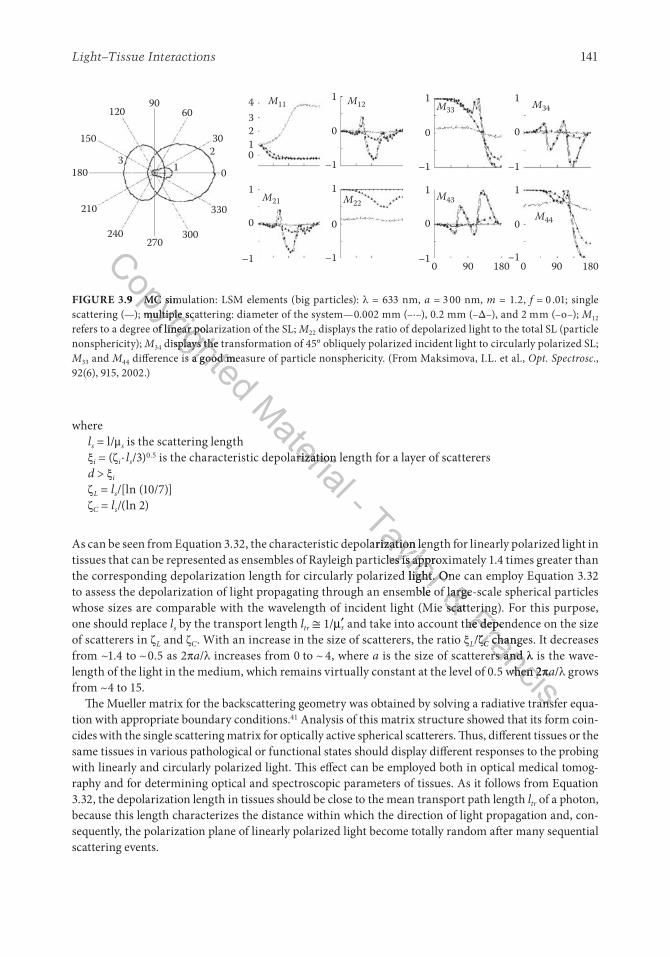
Light–Tissue Interactions 141
wherels = l/μs is the scattering lengthξi = (ζi · ls/3)0.5 is the characteristic depolarization length for a layer of scatterersd > ξi
ζL = ls/[ln (10/7)]ζC = ls/(ln 2)
As can be seen from Equation 3.32, the characteristic depolarization length for linearly polarized light in tissues that can be represented as ensembles of Rayleigh particles is approximately 1.4 times greater than the corresponding depolarization length for circularly polarized light. One can employ Equation 3.32 to assess the depolarization of light propagating through an ensemble of large-scale spherical particles whose sizes are comparable with the wavelength of incident light (Mie scattering). For this purpose, one should replace ls by the transport length ltr ≅ 1/ ′µs and take into account the dependence on the size of scatterers in ζL and ζC. With an increase in the size of scatterers, the ratio ξL/ζC changes. It decreases from ~1.4 to ~0.5 as 2πa/λ increases from 0 to ~ 4, where a is the size of scatterers and λ is the wave-length of the light in the medium, which remains virtually constant at the level of 0.5 when 2πa/λ grows from ~4 to 15.
The Mueller matrix for the backscattering geometry was obtained by solving a radiative transfer equa-tion with appropriate boundary conditions.41 Analysis of this matrix structure showed that its form coin-cides with the single scattering matrix for optically active spherical scatterers. Thus, different tissues or the same tissues in various pathological or functional states should display different responses to the probing with linearly and circularly polarized light. This effect can be employed both in optical medical tomog-raphy and for determining optical and spectroscopic parameters of tissues. As it follows from Equation 3.32, the depolarization length in tissues should be close to the mean transport path length ltr of a photon, because this length characterizes the distance within which the direction of light propagation and, con-sequently, the polarization plane of linearly polarized light become totally random after many sequential scattering events.
90120
150
32
1180
210
240
60
30
0
330
300270
4 M11 M12 M33 M34
M44
M43M21 M22
3210
1
0
–1
1
0
–1
1
0
–1
1
0
–10 90 180 0 90 180
1
0
–1
1
0
–1
1
0
–1
FIGURE 3.9 MC simulation: LSM elements (big particles): λ = 633 nm, a = 3 00 nm, m = 1.2, f = 0 .01; single scattering (—); multiple scattering: diameter of the system—0.002 mm (–·–), 0.2 mm (–Δ–), and 2 mm (–o–); M12
refers to a degree of linear polarization of the SL; M22 displays the ratio of depolarized light to the total SL (particle nonsphericity); M34 displays the transformation of 45° obliquely polarized incident light to circularly polarized SL; M33 and M44 difference is a good measure of particle nonsphericity. (From Maksimova, I.L. et al., Opt. Spectrosc., 92(6), 915, 2002.)
Copyrighted
FIGURE 3.9
Copyrighted
FIGURE 3.9 MC simulation: LSM elements (big particles):
Copyrighted
MC simulation: LSM elements (big particles): scattering (—); multiple scattering: diameter of the system—0.002 mm (–·–), 0.2 mm (–
Copyrighted
scattering (—); multiple scattering: diameter of the system—0.002 mm (–·–), 0.2 mm (–refers to a degree of linear polarization of the SL;
Copyrighted
refers to a degree of linear polarization of the SL; displays the transformation of 45° obliquely polarized incident light to circularly polarized SL;
Copyrighted displays the transformation of 45° obliquely polarized incident light to circularly polarized SL;
difference is a good measure of particle nonsphericity. (From Maksimova, I.L. et al.,
Copyrighted difference is a good measure of particle nonsphericity. (From Maksimova, I.L. et al.,
Material is the characteristic depolarization length for a layer of scatterers
Material is the characteristic depolarization length for a layer of scatterers
- Taylor As can be seen from Equation 3.32, the characteristic depolarization length for linearly polarized light in
Taylor As can be seen from Equation 3.32, the characteristic depolarization length for linearly polarized light in tissues that can be represented as ensembles of Rayleigh particles is approximately 1.4 times greater than
Taylor tissues that can be represented as ensembles of Rayleigh particles is approximately 1.4 times greater than the corresponding depolarization length for circularly polarized light. One can employ Equation 3.32
Taylor the corresponding depolarization length for circularly polarized light. One can employ Equation 3.32 to assess the depolarization of light propagating through an ensemble of large-scale spherical particles
Taylor to assess the depolarization of light propagating through an ensemble of large-scale spherical particles & the corresponding depolarization length for circularly polarized light. One can employ Equation 3.32 & the corresponding depolarization length for circularly polarized light. One can employ Equation 3.32 to assess the depolarization of light propagating through an ensemble of large-scale spherical particles & to assess the depolarization of light propagating through an ensemble of large-scale spherical particles whose sizes are comparable with the wavelength of incident light (Mie scattering). For this purpose,
& whose sizes are comparable with the wavelength of incident light (Mie scattering). For this purpose, Francis
whose sizes are comparable with the wavelength of incident light (Mie scattering). For this purpose, Francis
whose sizes are comparable with the wavelength of incident light (Mie scattering). For this purpose, and take into account the dependence on the size Francis
and take into account the dependence on the size /
Francis/ζ
FrancisζC
FrancisC changes. It decreases
Francis changes. It decreases C changes. It decreases C
FrancisC changes. It decreases C
is the size of scatterers and
Francis is the size of scatterers and λ
Francisλ is the wave
Francis is the wave
length of the light in the medium, which remains virtually constant at the level of 0.5 when 2
Francislength of the light in the medium, which remains virtually constant at the level of 0.5 when 2π
Francisπa
Francisa
The Mueller matrix for the backscattering geometry was obtained by solving a radiative transfer equa
FrancisThe Mueller matrix for the backscattering geometry was obtained by solving a radiative transfer equa
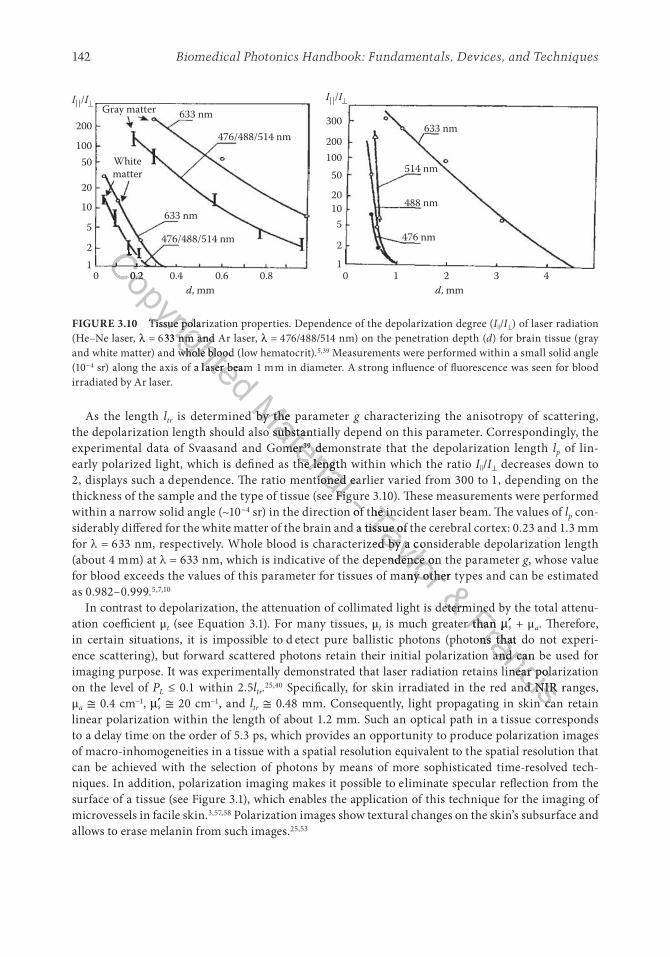
Biomedical Photonics Handbook: Fundamentals, Devices, and Techniques142
As the length ltr is determined by the parameter g characterizing the anisotropy of scattering, the depolarization length should also substantially depend on this parameter. Correspondingly, the experimental data of Svaasand and Gomer39 demonstrate that the depolarization length lp of lin-early polarized light, which is defined as the length within which the ratio Iǀǀ/I⊥ decreases down to 2, displays such a dependence. The ratio mentioned earlier varied from 300 to 1, depending on the thickness of the sample and the type of tissue (see Figure 3.10). These measurements were performed within a narrow solid angle (~10−4 sr) in the direction of the incident laser beam. The values of lp con-siderably differed for the white matter of the brain and a tissue of the cerebral cortex: 0.23 and 1.3 mm for λ = 633 nm, respectively. Whole blood is characterized by a considerable depolarization length (about 4 mm) at λ = 633 nm, which is indicative of the dependence on the parameter g, whose value for blood exceeds the values of this parameter for tissues of many other types and can be estimated as 0.982–0.999.5,7,10
In contrast to depolarization, the attenuation of collimated light is determined by the total attenu-ation coefficient μt (see Equation 3.1). For many tissues, μt is much greater than ′µs + μa. Therefore, in certain situations, it is impossible to d etect pure ballistic photons (photons that do not experi-ence scattering), but forward scattered photons retain their initial polarization and can be used for imaging purpose. It was experimentally demonstrated that laser radiation retains linear polarization on the level of PL ≤ 0.1 within 2.5ltr.25,40 Specifically, for skin irradiated in the red and NIR ranges, μa ≅ 0.4 cm−1, ′µs ≅ 20 cm−1, and ltr ≅ 0.48 mm. Consequently, light propagating in skin can retain linear polarization within the length of about 1.2 mm. Such an optical path in a t issue corresponds to a delay time on the order of 5.3 ps, which provides an opportunity to produce polarization images of macro-inhomogeneities in a tissue with a spatial resolution equivalent to the spatial resolution that can be achieved with the selection of photons by means of more sophisticated time-resolved tech-niques. In addition, polarization imaging makes it possible to eliminate specular reflection from the surface of a tissue (see Figure 3.1), which enables the application of this technique for the imaging of microvessels in facile skin.3,57,58 Polarization images show textural changes on the skin’s subsurface and allows to erase melanin from such images.25,53
200
10050
20
10
5
21
0 0.2 0.4 0.6 0.8
Gray matter 633 nm
476/488/514 nm
633 nm
d, mm
Whitematter
476/488/514 nm
200
300
10050
2010
5
2
10 1 2 3 4
633 nm
488 nm
514 nm
d, mm
476 nm
I||/II||/I
FIGURE 3.10 Tissue polarization properties. Dependence of the depolarization degree (Iǀǀ/I⊥) of laser radiation (He–Ne laser, λ = 633 nm and Ar laser, λ = 476/488/514 nm) on the penetration depth (d) for brain tissue (gray and white matter) and whole blood (low hematocrit).5,39 Measurements were performed within a small solid angle (10−4 sr) along the axis of a laser beam 1 mm in diameter. A strong influence of fluorescence was seen for blood irradiated by Ar laser.
Copyrighted
Copyrighted
0 0.2 0.4 0.6 0.8Copyrighted
0 0.2 0.4 0.6 0.8
Tissue polarization properties. Dependence of the depolarization degree (
Copyrighted
Tissue polarization properties. Dependence of the depolarization degree (
Copyrighted
= 633 nm and Ar laser,
Copyrighted
= 633 nm and Ar laser, and white matter) and whole blood (low hematocrit).
Copyrighted and white matter) and whole blood (low hematocrit).
Copyrighted sr) along the axis of a laser beam 1 mm in diameter. A strong influence of fluorescence was seen for blood
Copyrighted sr) along the axis of a laser beam 1 mm in diameter. A strong influence of fluorescence was seen for blood
Material
is determined by the parameter Material
is determined by the parameter the depolarization length should also substantially depend on this parameter. Correspondingly, the
Material
the depolarization length should also substantially depend on this parameter. Correspondingly, the experimental data of Svaasand and Gomer
Material experimental data of Svaasand and Gomer39
Material 39 demonstrate that the depolarization length
Material demonstrate that the depolarization length
early polarized light, which is defined as the length within which the ratio
Material early polarized light, which is defined as the length within which the ratio 2, displays such a dependence. The ratio mentioned earlier varied from 300 to 1, depending on the
Material 2, displays such a dependence. The ratio mentioned earlier varied from 300 to 1, depending on the thickness of the sample and the type of tissue (see Figure 3.10). These measurements were performed
Material thickness of the sample and the type of tissue (see Figure 3.10). These measurements were performed - thickness of the sample and the type of tissue (see Figure 3.10). These measurements were performed - thickness of the sample and the type of tissue (see Figure 3.10). These measurements were performed sr) in the direction of the incident laser beam. The values of
- sr) in the direction of the incident laser beam. The values of Taylor
sr) in the direction of the incident laser beam. The values of Taylor
sr) in the direction of the incident laser beam. The values of siderably differed for the white matter of the brain and a tissue of the cerebral cortex: 0.23 and 1.3 mm
Taylor
siderably differed for the white matter of the brain and a tissue of the cerebral cortex: 0.23 and 1.3 mm = 633 nm, respectively. Whole blood is characterized by a considerable depolarization length
Taylor = 633 nm, respectively. Whole blood is characterized by a considerable depolarization length
= 633 nm, which is indicative of the dependence on the parameter
Taylor = 633 nm, which is indicative of the dependence on the parameter
for blood exceeds the values of this parameter for tissues of many other types and can be estimated
Taylor for blood exceeds the values of this parameter for tissues of many other types and can be estimated & In contrast to depolarization, the attenuation of collimated light is determined by the total attenu& In contrast to depolarization, the attenuation of collimated light is determined by the total attenuFrancis
In contrast to depolarization, the attenuation of collimated light is determined by the total attenuFrancis
In contrast to depolarization, the attenuation of collimated light is determined by the total attenu is much greater than Francis
is much greater than µFrancis
µFrancisin certain situations, it is impossible to d etect pure ballistic photons (photons that do not experi
Francisin certain situations, it is impossible to d etect pure ballistic photons (photons that do not experience scattering), but forward scattered photons retain their initial polarization and can be used for
Francisence scattering), but forward scattered photons retain their initial polarization and can be used for imaging purpose. It was experimentally demonstrated that laser radiation retains linear polarization
Francisimaging purpose. It was experimentally demonstrated that laser radiation retains linear polarization Specifically, for skin irradiated in the red and NIR ranges,
Francis Specifically, for skin irradiated in the red and NIR ranges, 0.48 mm. Consequently, light propagating in skin can retain
Francis 0.48 mm. Consequently, light propagating in skin can retain
Light–Tissue Interactions 143
Polarization imaging is a new direction in tissue optics.3,5,7,25,40–43,47–58 The basis for this technique is to register two-dimensional polarization patterns for the backscattering of a polarized incident narrow laser beam. The major informative images can be received using the backscattering Mueller matrix approach. To determine each of the 16 experimental matrix elements, a total of 16 images should be taken at various combinations of input and output polarization states. Spatially resolved reflectance and OCT imaging techniques combine well with the polarization method.6,43,52,54
3.4 Optothermal Interactions
3.4.1 Temperature Rise and Tissue Damage
When photons traveling in tissue are absorbed, heat is generated. The generated heat, described by the heat source term S at a point r, is proportional to the fluence rate of light ϕ(r) (mW/cm2) and absorption coefficient μa(r) at this point3,6,20–22,66:
S(r) = μa(r) ϕ(r). (3.33)
The traditional bioheat equation originated from the energy balance describes the change in tissue tem-perature over time at a point r in the tissue:
ρ ρ −cT t
tk T t S cw T Tm a v
∂∂
= ∇ ∇[ ] + + ( )( , )( , ) ( ) ,
rr r (3.34)
whereρ is the tissue density (g/cm3)c is the tissue-specific heat (mJ/g °C)T(r,t) is the tissue temperature (°C) at time tkm is the thermal conductivity (mW/cm °C)S(r) is the heat source term (mW/cm3)w is the tissue perfusion rate (g/cm3 s)Ta is the inlet arterial temperature (°C)Tv is the outlet venous temperature (°C), all at point r in the tissue
In this equation, convection, radiation, vaporization, and metabolic heat effects are not accounted for because they are negligible in many practical cases. The source term is assumed to be stationary over the time interval of heating. The first term to the right of the equal sign describes any heat conduction (typically away from point r), and the source term accounts for heat generation due to photon absorp-tion. In most cases of light (laser)–tissue interaction, the heat transfer caused by blood perfusion (last term) is negligible.
To solve this equation, initial and boundary conditions must be accounted for. The initial condition is the tissue temperature at t = 0 a nd the boundary conditions depend on the tissue structure and the geometry of light heating. Methods of solving the bioheat equation can be found in studies by Tuchin3
and Müller and coworkers.20–23
Copyrighted
emperature Rise and Tissue DamageCopyrighted
emperature Rise and Tissue Damage
When photons traveling in tissue are absorbed, heat is generated. The generated heat, described by the Copyrighted
When photons traveling in tissue are absorbed, heat is generated. The generated heat, described by the heat source term
Copyrighted
heat source term S
Copyrighted
S at a point
Copyrighted
at a point μ
Copyrighted
μa
Copyrighted
a(
Copyrighted
(r
Copyrighted
r) at this point
Copyrighted
) at this pointr) at this pointr
Copyrighted
r) at this pointr
bioheat equation
Copyrighted bioheat equation originated from the energy balance describes the change in tissue tem
Copyrighted originated from the energy balance describes the change in tissue temMaterial
originated from the energy balance describes the change in tissue temMaterial
originated from the energy balance describes the change in tissue tem in the tissue:Material
in the tissue:
ρ ρ
Material ρ ρ[ ]
Material [ ]ρ ρ[ ]ρ ρ
Material ρ ρ[ ]ρ ρk T[ ]k T
Material k T[ ]k Tρ ρk Tρ ρ[ ]ρ ρk Tρ ρ
Material ρ ρk Tρ ρ[ ]ρ ρk Tρ ρk T[ ]k T
Material k T[ ]k T t S[ ]t S
Material t S[ ]t Sρ ρt Sρ ρ[ ]ρ ρt Sρ ρ
Material ρ ρt Sρ ρ[ ]ρ ρt Sρ ρρ ρm aρ ρ[ ]ρ ρm aρ ρ
Material ρ ρm aρ ρ[ ]ρ ρm aρ ρρ ρk Tρ ρm aρ ρk Tρ ρ[ ]ρ ρk Tρ ρm aρ ρk Tρ ρ
Material ρ ρk Tρ ρm aρ ρk Tρ ρ[ ]ρ ρk Tρ ρm aρ ρk Tρ ρρ ρt Sρ ρm aρ ρt Sρ ρ[ ]ρ ρt Sρ ρm aρ ρt Sρ ρ
Material ρ ρt Sρ ρm aρ ρt Sρ ρ[ ]ρ ρt Sρ ρm aρ ρt Sρ ρ∇[ ]∇
Material ∇[ ]∇k T∇k T[ ]k T∇k T
Material k T∇k T[ ]k T∇k Tρ ρk Tρ ρ∇ρ ρk Tρ ρ[ ]ρ ρk Tρ ρ∇ρ ρk Tρ ρ
Material ρ ρk Tρ ρ∇ρ ρk Tρ ρ[ ]ρ ρk Tρ ρ∇ρ ρk Tρ ρρ ρk Tρ ρm aρ ρk Tρ ρ∇ρ ρk Tρ ρm aρ ρk Tρ ρ[ ]ρ ρk Tρ ρm aρ ρk Tρ ρ∇ρ ρk Tρ ρm aρ ρk Tρ ρ
Material ρ ρk Tρ ρm aρ ρk Tρ ρ∇ρ ρk Tρ ρm aρ ρk Tρ ρ[ ]ρ ρk Tρ ρm aρ ρk Tρ ρ∇ρ ρk Tρ ρm aρ ρk Tρ ρ[ ]( ,[ ]
Material [ ]( ,[ ]ρ ρ[ ]ρ ρ( ,ρ ρ[ ]ρ ρ
Material ρ ρ[ ]ρ ρ( ,ρ ρ[ ]ρ ρρ ρm aρ ρ[ ]ρ ρm aρ ρ( ,ρ ρm aρ ρ[ ]ρ ρm aρ ρ
Material ρ ρm aρ ρ[ ]ρ ρm aρ ρ( ,ρ ρm aρ ρ[ ]ρ ρm aρ ρ[ ]) ([ ]
Material [ ]) ([ ]t S[ ]t S) (t S[ ]t S
Material t S[ ]t S) (t S[ ]t Sρ ρt Sρ ρ[ ]ρ ρt Sρ ρ) (ρ ρt Sρ ρ[ ]ρ ρt Sρ ρ
Material ρ ρt Sρ ρ[ ]ρ ρt Sρ ρ) (ρ ρt Sρ ρ[ ]ρ ρt Sρ ρρ ρ) (ρ ρ
Material ρ ρ) (ρ ρρ ρm aρ ρ) (ρ ρm aρ ρ
Material ρ ρm aρ ρ) (ρ ρm aρ ρρ ρt Sρ ρm aρ ρt Sρ ρ) (ρ ρt Sρ ρm aρ ρt Sρ ρ
Material ρ ρt Sρ ρm aρ ρt Sρ ρ) (ρ ρt Sρ ρm aρ ρt Sρ ρρ ρ[ ]ρ ρ) (ρ ρ[ ]ρ ρ
Material ρ ρ[ ]ρ ρ) (ρ ρ[ ]ρ ρρ ρm aρ ρ[ ]ρ ρm aρ ρ) (ρ ρm aρ ρ[ ]ρ ρm aρ ρ
Material ρ ρm aρ ρ[ ]ρ ρm aρ ρ) (ρ ρm aρ ρ[ ]ρ ρm aρ ρρ ρt Sρ ρm aρ ρt Sρ ρ[ ]ρ ρt Sρ ρm aρ ρt Sρ ρ) (ρ ρt Sρ ρm aρ ρt Sρ ρ[ ]ρ ρt Sρ ρm aρ ρt Sρ ρ
Material ρ ρt Sρ ρm aρ ρt Sρ ρ[ ]ρ ρt Sρ ρm aρ ρt Sρ ρ) (ρ ρt Sρ ρm aρ ρt Sρ ρ[ ]ρ ρt Sρ ρm aρ ρt Sρ ρρ ρ[ ]ρ ρr rρ ρ[ ]ρ ρ
Material ρ ρ[ ]ρ ρr rρ ρ[ ]ρ ρρ ρt Sρ ρ[ ]ρ ρt Sρ ρr rρ ρt Sρ ρ[ ]ρ ρt Sρ ρ
Material ρ ρt Sρ ρ[ ]ρ ρt Sρ ρr rρ ρt Sρ ρ[ ]ρ ρt Sρ ρρ ρm aρ ρ[ ]ρ ρm aρ ρr rρ ρm aρ ρ[ ]ρ ρm aρ ρ
Material ρ ρm aρ ρ[ ]ρ ρm aρ ρr rρ ρm aρ ρ[ ]ρ ρm aρ ρρ ρt Sρ ρm aρ ρt Sρ ρ[ ]ρ ρt Sρ ρm aρ ρt Sρ ρr rρ ρt Sρ ρm aρ ρt Sρ ρ[ ]ρ ρt Sρ ρm aρ ρt Sρ ρ
Material ρ ρt Sρ ρm aρ ρt Sρ ρ[ ]ρ ρt Sρ ρm aρ ρt Sρ ρr rρ ρt Sρ ρm aρ ρt Sρ ρ[ ]ρ ρt Sρ ρm aρ ρt Sρ ρρ ρ[ ]ρ ρ( ,ρ ρ[ ]ρ ρr rρ ρ[ ]ρ ρ( ,ρ ρ[ ]ρ ρ
Material ρ ρ[ ]ρ ρ( ,ρ ρ[ ]ρ ρr rρ ρ[ ]ρ ρ( ,ρ ρ[ ]ρ ρρ ρm aρ ρ[ ]ρ ρm aρ ρ( ,ρ ρm aρ ρ[ ]ρ ρm aρ ρr rρ ρm aρ ρ[ ]ρ ρm aρ ρ( ,ρ ρm aρ ρ[ ]ρ ρm aρ ρ
Material ρ ρm aρ ρ[ ]ρ ρm aρ ρ( ,ρ ρm aρ ρ[ ]ρ ρm aρ ρr rρ ρm aρ ρ[ ]ρ ρm aρ ρ( ,ρ ρm aρ ρ[ ]ρ ρm aρ ρρ ρt Sρ ρ) (ρ ρt Sρ ρr rρ ρt Sρ ρ) (ρ ρt Sρ ρ
Material ρ ρt Sρ ρ) (ρ ρt Sρ ρr rρ ρt Sρ ρ) (ρ ρt Sρ ρρ ρt Sρ ρm aρ ρt Sρ ρ) (ρ ρt Sρ ρm aρ ρt Sρ ρr rρ ρt Sρ ρm aρ ρt Sρ ρ) (ρ ρt Sρ ρm aρ ρt Sρ ρ
Material ρ ρt Sρ ρm aρ ρt Sρ ρ) (ρ ρt Sρ ρm aρ ρt Sρ ρr rρ ρt Sρ ρm aρ ρt Sρ ρ) (ρ ρt Sρ ρm aρ ρt Sρ ρρ ρt Sρ ρ[ ]ρ ρt Sρ ρ) (ρ ρt Sρ ρ[ ]ρ ρt Sρ ρr rρ ρt Sρ ρ[ ]ρ ρt Sρ ρ) (ρ ρt Sρ ρ[ ]ρ ρt Sρ ρ
Material ρ ρt Sρ ρ[ ]ρ ρt Sρ ρ) (ρ ρt Sρ ρ[ ]ρ ρt Sρ ρr rρ ρt Sρ ρ[ ]ρ ρt Sρ ρ) (ρ ρt Sρ ρ[ ]ρ ρt Sρ ρρ ρt Sρ ρm aρ ρt Sρ ρ[ ]ρ ρt Sρ ρm aρ ρt Sρ ρ) (ρ ρt Sρ ρm aρ ρt Sρ ρ[ ]ρ ρt Sρ ρm aρ ρt Sρ ρr rρ ρt Sρ ρm aρ ρt Sρ ρ[ ]ρ ρt Sρ ρm aρ ρt Sρ ρ) (ρ ρt Sρ ρm aρ ρt Sρ ρ[ ]ρ ρt Sρ ρm aρ ρt Sρ ρ
Material ρ ρt Sρ ρm aρ ρt Sρ ρ[ ]ρ ρt Sρ ρm aρ ρt Sρ ρ) (ρ ρt Sρ ρm aρ ρt Sρ ρ[ ]ρ ρt Sρ ρm aρ ρt Sρ ρr rρ ρt Sρ ρm aρ ρt Sρ ρ[ ]ρ ρt Sρ ρm aρ ρt Sρ ρ) (ρ ρt Sρ ρm aρ ρt Sρ ρ[ ]ρ ρt Sρ ρm aρ ρt Sρ ρρ ρt Sρ ρm aρ ρt Sρ ρ+ +ρ ρt Sρ ρm aρ ρt Sρ ρ) (ρ ρt Sρ ρm aρ ρt Sρ ρ+ +ρ ρt Sρ ρm aρ ρt Sρ ρr rρ ρt Sρ ρm aρ ρt Sρ ρ+ +ρ ρt Sρ ρm aρ ρt Sρ ρ) (ρ ρt Sρ ρm aρ ρt Sρ ρ+ +ρ ρt Sρ ρm aρ ρt Sρ ρ
Material ρ ρt Sρ ρm aρ ρt Sρ ρ+ +ρ ρt Sρ ρm aρ ρt Sρ ρ) (ρ ρt Sρ ρm aρ ρt Sρ ρ+ +ρ ρt Sρ ρm aρ ρt Sρ ρr rρ ρt Sρ ρm aρ ρt Sρ ρ+ +ρ ρt Sρ ρm aρ ρt Sρ ρ) (ρ ρt Sρ ρm aρ ρt Sρ ρ+ +ρ ρt Sρ ρm aρ ρt Sρ ρ
- Taylor & FrancisIn this equation, convection, radiation, vaporization, and metabolic heat effects are not accounted for
FrancisIn this equation, convection, radiation, vaporization, and metabolic heat effects are not accounted for because they are negligible in many practical cases. The source term is assumed to be stationary over
Francisbecause they are negligible in many practical cases. The source term is assumed to be stationary over
Biomedical Photonics Handbook: Fundamentals, Devices, and Techniques144
Damage of a tissue results when it is exposed to high temperature for a long time period.3,20–23,66 The damage function is expressed in terms of an Arrhenius integral:
Ω ττ
τ−( ) ln
( )
( ),( ( ))=
= ∫C
CA e dtE RT ta0
0
/ (3.35)
whereτ is the total heating time (s)C(0) is the original concentration of undamaged tissueC(τ) is the remaining concentration of undamaged tissue after time τA is an empirically determined constant (s−1)Ea is an empirically determined activation energy barrier (J/mol)R is the universal gas constant (8.32 J/mol K)T is the absolute temperature (K)
In noninvasive optical diagnostic and some photochemical applications of light, one has to keep tissue below the damaging temperature, which is also called the critical temperature Tcrit. This temperature is defined as the temperature at which the damage accumulation rate, dΩ/dt, is equal to 1.066:
TE
R Acrit
a=ln( )
. (3.36)
The constants A and Ea can be calculated on the basis of experimental data when tissue is exposed to a constant temperature.21 For example, for pig skin, A = 3.1 × 1098 and Ea = 6.28 × 10⁵ J/mol, which gives Tcrit = 59.7°C.
With CW light sources, the conduction of heat away from the light absorption region into the sur-rounding tissue increases due to the increase in temperature difference between the irradiation and the surrounding tissue. Depending on the light energy, large volumes of tissue may be damaged or may lose heat at the target tissue component. For pulsed light, little heat is usually lost during the pulse duration as light absorption is a fast process while heat conduction is relatively slow, and, therefore, more precise tissue damage is possible.
The following forms of irreversible tissue damage are expected as tissue temperature rises past Tcrit: coagulation (denaturization of cellular and tissue proteins) is the basis for tissue welding; vaporization (tissue dehydration and vapor bubbles formation [vacuolization], T ≥ 100°C) is the basis for mechanical destruction of tissue; and pyrolysis (at temperatures T ≈ 350°C–450°C) is the basis for chemical changes in tissue due to heat. The combination of vaporization, vacuolization, and pyrolysis produces thermal ablation—the basis of laser surgical removal of tissue.
The disadvantage of thermal ablation with CW light sources is undesirable damage to surrounding tissue because of coagulation. Pulsed light can deliver sufficient energy with each pulse to ablate tissue, but the tissue should be removed within a short time period before any heat is transferred to the sur-rounding tissue. To achieve precise tissue cutting, lasers with a very short penetration depth and sharp focus, such as UV excimer ArF laser (193 nm), are used.
As condensed matter, tissue can undergo any noncoherent or coherent effects with laser irradiation.67
Linear noncoherent effects exist within a w ide area of pulse duration and intensities; for long pulses of 1 s, the intensity should not exceed 10 W/cm2, whereas for shorter pulses of 10−9 s, the intensity can be up to 109 W/cm2. Multiphoton processes may exist in relatively short pulse duration (10−9–10−12 s) at intensities of 109–1012 W/cm2 and rather low light energies, not higher 0.1 J/cm2. The linear and nonlin-ear coherent effects may be induced only by a very short pulse with a time duration comparable with the relaxation time of biological molecules, τ ≤ 10−13.
Copyrighted
) is the remaining concentration of undamaged tissue after time Copyrighted
) is the remaining concentration of undamaged tissue after time is an empirically determined constant (sCopyrighted
is an empirically determined constant (s is an empirically determined activation energy barrier (J/mol)
Copyrighted
is an empirically determined activation energy barrier (J/mol) is the universal gas constant (8.32 J/mol K)
Copyrighted
is the universal gas constant (8.32 J/mol K) is the absolute temperature (K)
Copyrighted
is the absolute temperature (K)
In noninvasive optical diagnostic and some photochemical applications of light, one has to keep tissue
Copyrighted In noninvasive optical diagnostic and some photochemical applications of light, one has to keep tissue below the damaging temperature, which is also called the critical temperature
Copyrighted below the damaging temperature, which is also called the critical temperature defined as the temperature at which the damage accumulation rate,
Copyrighted defined as the temperature at which the damage accumulation rate,
Material
TMaterial
T
can be calculated on the basis of experimental data when tissue is exposed to a
Material can be calculated on the basis of experimental data when tissue is exposed to a For example, for pig skin,
Material For example, for pig skin, A
Material A = 3.1 × 10
Material = 3.1 × 10
- With CW light sources, the conduction of heat away from the light absorption region into the sur- With CW light sources, the conduction of heat away from the light absorption region into the surTaylor
With CW light sources, the conduction of heat away from the light absorption region into the surTaylor
With CW light sources, the conduction of heat away from the light absorption region into the surrounding tissue increases due to the increase in temperature difference between the irradiation and the
Taylor
rounding tissue increases due to the increase in temperature difference between the irradiation and the surrounding tissue. Depending on the light energy, large volumes of tissue may be damaged or may lose
Taylor surrounding tissue. Depending on the light energy, large volumes of tissue may be damaged or may lose heat at the target tissue component. For pulsed light, little heat is usually lost during the pulse duration
Taylor heat at the target tissue component. For pulsed light, little heat is usually lost during the pulse duration as light absorption is a fast process while heat conduction is relatively slow, and, therefore, more precise
Taylor as light absorption is a fast process while heat conduction is relatively slow, and, therefore, more precise & The following forms of irreversible tissue damage are expected as tissue temperature rises past & The following forms of irreversible tissue damage are expected as tissue temperature rises past Francis
The following forms of irreversible tissue damage are expected as tissue temperature rises past Francis
The following forms of irreversible tissue damage are expected as tissue temperature rises past tissue weldingFrancis
tissue welding ≥ 100°C) is the basis for mechanical
Francis ≥ 100°C) is the basis for mechanical
Francis ≈ 350°C–450°C) is the basis for chemical changes
Francis ≈ 350°C–450°C) is the basis for chemical changes
produces
Francis produces
The disadvantage of thermal ablation with CW light sources is undesirable damage to surrounding
FrancisThe disadvantage of thermal ablation with CW light sources is undesirable damage to surrounding
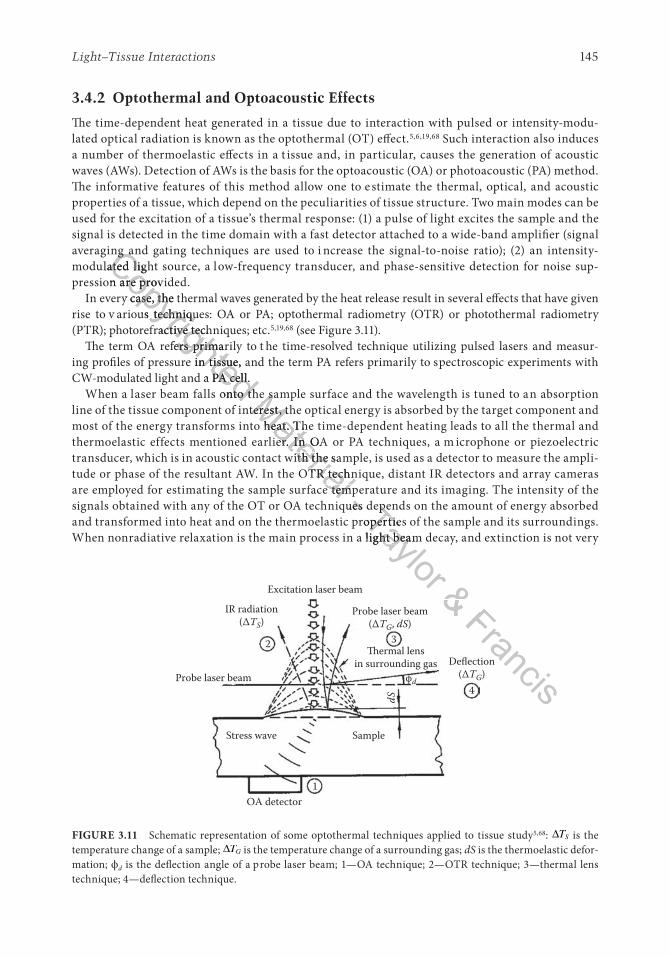
Light–Tissue Interactions 145
3.4.2 Optothermal and Optoacoustic Effects
The time-dependent heat generated in a tissue due to interaction with pulsed or intensity-modu-lated optical radiation is known as the optothermal (OT) effect.5,6,19,68 Such interaction also induces a number of thermoelastic effects in a t issue and, in particular, causes the generation of acoustic waves (AWs). Detection of AWs is the basis for the optoacoustic (OA) or photoacoustic (PA) method. The informative features of this method allow one to e stimate the thermal, optical, and acoustic properties of a tissue, which depend on the peculiarities of tissue structure. Two main modes can be used for the excitation of a tissue’s thermal response: (1) a pulse of light excites the sample and the signal is detected in the time domain with a fast detector attached to a wide-band amplifier (signal averaging and gating techniques are used to i ncrease the signal-to-noise ratio); (2) an intensity-modulated light source, a low-frequency transducer, and phase-sensitive detection for noise sup-pression are provided.
In every case, the thermal waves generated by the heat release result in several effects that have given rise to v arious techniques: OA or PA; optothermal radiometry (OTR) or photothermal radiometry (PTR); photorefractive techniques; etc.5,19,68 (see Figure 3.11).
The term OA refers primarily to t he time-resolved technique utilizing pulsed lasers and measur-ing profiles of pressure in tissue, and the term PA refers primarily to spectroscopic experiments with CW-modulated light and a PA cell.
When a laser beam falls onto the sample surface and the wavelength is tuned to an absorption line of the tissue component of interest, the optical energy is absorbed by the target component and most of the energy transforms into heat. The time-dependent heating leads to all the thermal and thermoelastic effects mentioned earlier. In OA or PA techniques, a m icrophone or piezoelectric transducer, which is in acoustic contact with the sample, is used as a detector to measure the ampli-tude or phase of the resultant AW. In the OTR technique, distant IR detectors and array cameras are employed for estimating the sample surface temperature and its imaging. The intensity of the signals obtained with any of the OT or OA techniques depends on the amount of energy absorbed and transformed into heat and on the thermoelastic properties of the sample and its surroundings. When nonradiative relaxation is the main process in a light beam decay, and extinction is not very
Excitation laser beam
IR radiation(ΔTS)
Probe laser beam(ΔTG, dS)
ermal lensin surrounding gas
φd
dS
Deection(ΔTG)Probe laser beam
Stress wave
OA detector1
Sample
2 3
4
FIGURE 3.11 Schematic representation of some optothermal techniques applied to tissue study5,68: ∆TS is the temperature change of a sample; ∆TG is the temperature change of a surrounding gas; dS is the thermoelastic defor-mation; ϕd is the deflection angle of a probe laser beam; 1—OA technique; 2—OTR technique; 3—thermal lens technique; 4—deflection technique.
Copyrighted
averaging and gating techniques are used to i ncrease the signal-to-noise ratio); (2) an intensity-Copyrighted
averaging and gating techniques are used to i ncrease the signal-to-noise ratio); (2) an intensity-modulated light source, a low-frequency transducer, and phase-sensitive detection for noise supCopyrighted
modulated light source, a low-frequency transducer, and phase-sensitive detection for noise suppression are provided.
Copyrighted
pression are provided.In every case, the thermal waves generated by the heat release result in several effects that have given
Copyrighted
In every case, the thermal waves generated by the heat release result in several effects that have given rise to v arious techniques: OA or PA; optothermal radiometry (OTR) or photothermal radiometry
Copyrighted
rise to v arious techniques: OA or PA; optothermal radiometry (OTR) or photothermal radiometry (PTR); photorefractive techniques; etc.
Copyrighted
(PTR); photorefractive techniques; etc.The term OA refers primarily to t he time-resolved technique utilizing pulsed lasers and measur
Copyrighted The term OA refers primarily to t he time-resolved technique utilizing pulsed lasers and measur
ing profiles of pressure in tissue, and the term PA refers primarily to spectroscopic experiments with
Copyrighted ing profiles of pressure in tissue, and the term PA refers primarily to spectroscopic experiments with CW-modulated light and a PA cell.
Copyrighted CW-modulated light and a PA cell.When a laser beam falls onto the sample surface and the wavelength is tuned to an absorption
Copyrighted When a laser beam falls onto the sample surface and the wavelength is tuned to an absorption line of the tissue component of interest, the optical energy is absorbed by the target component and
Copyrighted line of the tissue component of interest, the optical energy is absorbed by the target component and Material
When a laser beam falls onto the sample surface and the wavelength is tuned to an absorption Material
When a laser beam falls onto the sample surface and the wavelength is tuned to an absorption line of the tissue component of interest, the optical energy is absorbed by the target component and Material
line of the tissue component of interest, the optical energy is absorbed by the target component and most of the energy transforms into heat. The time-dependent heating leads to all the thermal and
Material
most of the energy transforms into heat. The time-dependent heating leads to all the thermal and thermoelastic effects mentioned earlier. In OA or PA techniques, a m icrophone or piezoelectric
Material thermoelastic effects mentioned earlier. In OA or PA techniques, a m icrophone or piezoelectric transducer, which is in acoustic contact with the sample, is used as a detector to measure the ampli
Material transducer, which is in acoustic contact with the sample, is used as a detector to measure the amplitude or phase of the resultant AW. In the OTR technique, distant IR detectors and array cameras
Material tude or phase of the resultant AW. In the OTR technique, distant IR detectors and array cameras are employed for estimating the sample surface temperature and its imaging. The intensity of the
Material are employed for estimating the sample surface temperature and its imaging. The intensity of the - signals obtained with any of the OT or OA techniques depends on the amount of energy absorbed - signals obtained with any of the OT or OA techniques depends on the amount of energy absorbed Taylor
signals obtained with any of the OT or OA techniques depends on the amount of energy absorbed Taylor
signals obtained with any of the OT or OA techniques depends on the amount of energy absorbed and transformed into heat and on the thermoelastic properties of the sample and its surroundings. Taylor
and transformed into heat and on the thermoelastic properties of the sample and its surroundings. When nonradiative relaxation is the main process in a light beam decay, and extinction is not very
Taylor When nonradiative relaxation is the main process in a light beam decay, and extinction is not very
& & Francis
Francis
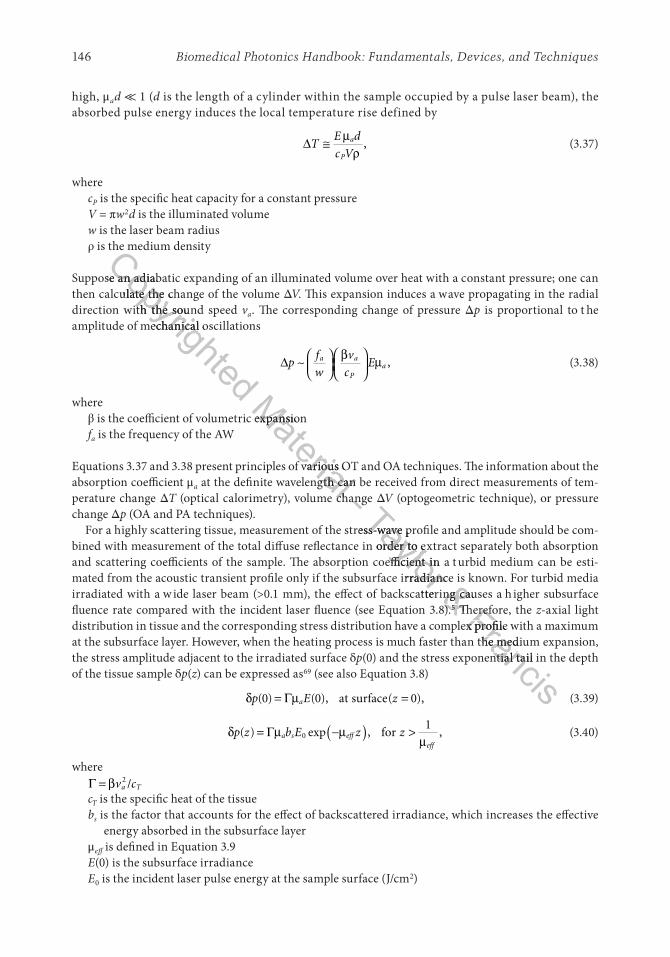
Biomedical Photonics Handbook: Fundamentals, Devices, and Techniques146
high, μad ≪ 1 (d is the length of a cylinder within the sample occupied by a pulse laser beam), the absorbed pulse energy induces the local temperature rise defined by
∆ µρ
TE d
c Va
P
≅ , (3.37)
whereсP is the specific heat capacity for a constant pressureV = πw2d is the illuminated volumew is the laser beam radiusρ is the medium density
Suppose an adiabatic expanding of an illuminated volume over heat with a constant pressure; one can then calculate the change of the volume ΔV. This expansion induces a wave propagating in the radial direction with the sound speed vа. The corresponding change of pressure Δp is proportional to t he amplitude of mechanical oscillations
∆ β µpf
w
v
cEa a
Pa~ ,
(3.38)
whereβ is the coefficient of volumetric expansionfа is the frequency of the AW
Equations 3.37 and 3.38 present principles of various OT and OA techniques. The information about the absorption coefficient μa at the definite wavelength can be received from direct measurements of tem-perature change ΔТ (optical calorimetry), volume change ΔV (optogeometric technique), or pressure change Δp (OA and PA techniques).
For a highly scattering tissue, measurement of the stress-wave profile and amplitude should be com-bined with measurement of the total diffuse reflectance in order to extract separately both absorption and scattering coefficients of the sample. The absorption coefficient in a t urbid medium can be esti-mated from the acoustic transient profile only if the subsurface irradiance is known. For turbid media irradiated with a w ide laser beam (>0.1 mm), the effect of backscattering causes a h igher subsurface fluence rate compared with the incident laser fluence (see Equation 3.8).5 Therefore, the z-axial light distribution in tissue and the corresponding stress distribution have a complex profile with a maximum at the subsurface layer. However, when the heating process is much faster than the medium expansion, the stress amplitude adjacent to the irradiated surface δp(0) and the stress exponential tail in the depth of the tissue sample δp(z) can be expressed as69 (see also Equation 3.8)
δ Γµp E za( ) ( ), ( ),0 0 0= =at surface (3.39)
δ Γµ −µµ
p z b E z za s effeff
( ) exp , ,= ( ) >01
for (3.40)
whereΓ β= v ca T
2 /cT is the specific heat of the tissuebs is the factor that accounts for the effect of backscattered irradiance, which increases the effective
energy absorbed in the subsurface layerμeff is defined in Equation 3.9E(0) is the subsurface irradianceE0 is the incident laser pulse energy at the sample surface (J/cm2)
Copyrighted
is the medium densityCopyrighted
is the medium density
Suppose an adiabatic expanding of an illuminated volume over heat with a constant pressure; one can Copyrighted
Suppose an adiabatic expanding of an illuminated volume over heat with a constant pressure; one can then calculate the change of the volume
Copyrighted
then calculate the change of the volume direction with the sound speed
Copyrighted
direction with the sound speedamplitude of mechanical oscillations
Copyrighted
amplitude of mechanical oscillations
Material
is the coefficient of volumetric expansionMaterial
is the coefficient of volumetric expansion
Equations 3.37 and 3.38 present principles of various OT and OA techniques. The information about the
Material Equations 3.37 and 3.38 present principles of various OT and OA techniques. The information about the
at the definite wavelength can be received from direct measurements of tem
Material at the definite wavelength can be received from direct measurements of tem (optical calorimetry), volume change
Material (optical calorimetry), volume change - (optical calorimetry), volume change - (optical calorimetry), volume change Taylor For a highly scattering tissue, measurement of the stress-wave profile and amplitude should be com
Taylor For a highly scattering tissue, measurement of the stress-wave profile and amplitude should be com
bined with measurement of the total diffuse reflectance in order to extract separately both absorption
Taylor bined with measurement of the total diffuse reflectance in order to extract separately both absorption and scattering coefficients of the sample. The absorption coefficient in a t urbid medium can be esti
Taylor and scattering coefficients of the sample. The absorption coefficient in a t urbid medium can be estimated from the acoustic transient profile only if the subsurface irradiance is known. For turbid media
Taylor mated from the acoustic transient profile only if the subsurface irradiance is known. For turbid media irradiated with a w ide laser beam (>0.1 mm), the effect of backscattering causes a h igher subsurface
Taylor irradiated with a w ide laser beam (>0.1 mm), the effect of backscattering causes a h igher subsurface & mated from the acoustic transient profile only if the subsurface irradiance is known. For turbid media & mated from the acoustic transient profile only if the subsurface irradiance is known. For turbid media irradiated with a w ide laser beam (>0.1 mm), the effect of backscattering causes a h igher subsurface & irradiated with a w ide laser beam (>0.1 mm), the effect of backscattering causes a h igher subsurface fluence rate compared with the incident laser fluence (see Equation 3.8).
& fluence rate compared with the incident laser fluence (see Equation 3.8).5& 5 Therefore, the & Therefore, the Francis
Therefore, the Francis
Therefore, the distribution in tissue and the corresponding stress distribution have a complex profile with a maximum Francis
distribution in tissue and the corresponding stress distribution have a complex profile with a maximum at the subsurface layer. However, when the heating process is much faster than the medium expansion,
Francisat the subsurface layer. However, when the heating process is much faster than the medium expansion,
(0) and the stress exponential tail in the depth
Francis(0) and the stress exponential tail in the depth
Light–Tissue Interactions 147
For optically thick samples,70
E(0) ≈ (1 + 7.1Rd)E0, (3.41)
where Rd is the total diffuse reflection. The Grüneisen parameter Г i s a d imensionless, temperature-dependent factor proportional to the fraction of thermal energy converted into mechanical stress. For water it can be expressed with an empirical formula:
Г = 0.0043 + 0.0053T, (3.42)
where temperature T is measured in degrees Celsius; for Т = 37°С, Г ≈ 0.2.Equations 3.39 and 3.40 are strictly valid only when the heating process is much faster than the expan-
sion of the medium. The stress is temporarily confined during laser heat deposition when the duration of the laser pulse is much shorter than the time of stress propagation across the depth of light penetration in the tissue sample. Such conditions of temporal pressure confinement in a volume of irradiated tissue enable the most efficient pressure generation (see Chapter 21 in Volume II of this handbook).69,70
The pulse laser heating of a tissue causes perturbations in its temperature and the corresponding modulation of its own thermal (IR) radiation. This is the basis for pulse OTR.5,6,19,71 The maximum intensity of the thermal radiation of living objects falls within the wavelength range close to 10 μm. A detailed analysis of OTR signal formation requires knowledge on the internal temperature distribu-tion within the tissue sample, tissue thermal diffusivity, and its absorption coefficients at the excitation μa and emission ′µa (10 μm) wavelengths. Going backward, the knowledge of some of the mentioned parameters allows the reconstruction of, for example, the depth distribution of μa on the basis of the measured OTR signal.71
The surface radiometric signal Sr(t) at any time t is the sum of the contributions from all depths in the tissue at time t. The radiation from deeper depths is attenuated by the IR absorption of the sample before reaching the detector. As the initial surface temperature is known, the temperature distribution in the sample depth can be extracted from Sr(t) measurement.
OTR, OA, and PA transient techniques provide a convenient means for in vitro or even in vivo and in situ monitoring of human skin properties (optical absorption, thermal properties, water content) and surface concentrations of topically applied substances (drugs and sunscreen diffusion). The main dif-ficulty of the PA method in the case of in vivo measurements is the requirement of a closed sample cell, which can guide the acoustic signal efficiently from sample to acoustical detector. The use of pulsed OA and OTR techniques is more appropriate for in vivo and in situ measurements.
For example, the photothermal flow cytometry (PTFC) technique has the ability to visualize absorb-ing cellular structures of moving unlabeled cells in real-time in vivo studies of circulating red and white blood cells in capillaries and lymph microvessels of rat mesentery.72,73 The imaging of single cells in vivo is potentially important for the early diagnosis of diseases (e.g., cancer and diabetes) or for the study of the influence of various factors (e.g., drugs, nanoparticles, smoking, ionizing radiation) on individual cells.
To realize PTFC, a nonscanning fast photothermal microscopy (PTM) system was used because cells cross the area of detection in 0.1–0.01 s even in the relatively slow flow in capillaries.53 Such a system was built on the basis of a pulsed pumping tunable optical parametric oscillator (420–570 nm, pulse width 8 ns, pulse energy 0.1–400 μJ). Laser-induced temperature-dependent variations of the refractive index in the cell were detected using a phase-contrast imaging technique with illumination by a low-energy collinear probe pulse from the Raman shifter with a wavelength of 639 nm, pulse width of 13 ns, and pulse energy of 2 nJ. The diameters of the pump- and probe-beam spots, with stable, smooth intensity profiles, ranged from 20 to 50 μm and 15 to 50 μm, respectively, and thus covered all the single cells and the entire microvessel as well. A spatial resolution of ~0.7 μm was provided. The acquisition procedure included illumination of the cell with three pulses: an initial
Copyrighted
where temperature Copyrighted
where temperature Equations 3.39 and 3.40 are strictly valid only when the heating process is much faster than the expan
Copyrighted
Equations 3.39 and 3.40 are strictly valid only when the heating process is much faster than the expansion of the medium. The stress is temporarily confined during laser heat deposition when the duration of
Copyrighted
sion of the medium. The stress is temporarily confined during laser heat deposition when the duration of the laser pulse is much shorter than the time of stress propagation across the depth of light penetration
Copyrighted
the laser pulse is much shorter than the time of stress propagation across the depth of light penetration in the tissue sample. Such conditions of temporal pressure confinement in a volume of irradiated tissue
Copyrighted
in the tissue sample. Such conditions of temporal pressure confinement in a volume of irradiated tissue enable the most efficient pressure generation (see Chapter 21 in Volume II of this handbook).
Copyrighted
enable the most efficient pressure generation (see Chapter 21 in Volume II of this handbook).The pulse laser heating of a tissue causes perturbations in its temperature and the corresponding
Copyrighted The pulse laser heating of a tissue causes perturbations in its temperature and the corresponding
modulation of its own thermal (IR) radiation. This is the basis for pulse OTR.
Copyrighted modulation of its own thermal (IR) radiation. This is the basis for pulse OTR.intensity of the thermal radiation of living objects falls within the wavelength range close to 10
Copyrighted intensity of the thermal radiation of living objects falls within the wavelength range close to 10 detailed analysis of OTR signal formation requires knowledge on the internal temperature distribu
Copyrighted detailed analysis of OTR signal formation requires knowledge on the internal temperature distribuMaterial
detailed analysis of OTR signal formation requires knowledge on the internal temperature distribuMaterial
detailed analysis of OTR signal formation requires knowledge on the internal temperature distribution within the tissue sample, tissue thermal diffusivity, and its absorption coefficients at the excitation
Material
tion within the tissue sample, tissue thermal diffusivity, and its absorption coefficients at the excitation m) wavelengths. Going backward, the knowledge of some of the mentioned
Material
m) wavelengths. Going backward, the knowledge of some of the mentioned parameters allows the reconstruction of, for example, the depth distribution of
Material parameters allows the reconstruction of, for example, the depth distribution of
) at any time
Material ) at any time t
Material t is the sum of the contributions from all depths in the
Material is the sum of the contributions from all depths in the t is the sum of the contributions from all depths in the t
Material t is the sum of the contributions from all depths in the t. The radiation from deeper depths is attenuated by the IR absorption of the sample before
Material . The radiation from deeper depths is attenuated by the IR absorption of the sample before - . The radiation from deeper depths is attenuated by the IR absorption of the sample before - . The radiation from deeper depths is attenuated by the IR absorption of the sample before reaching the detector. As the initial surface temperature is known, the temperature distribution in the - reaching the detector. As the initial surface temperature is known, the temperature distribution in the Taylor
reaching the detector. As the initial surface temperature is known, the temperature distribution in the Taylor
reaching the detector. As the initial surface temperature is known, the temperature distribution in the
OTR, OA, and PA transient techniques provide a convenient means for in vitro or even in vivo and
Taylor OTR, OA, and PA transient techniques provide a convenient means for in vitro or even in vivo and
in situ monitoring of human skin properties (optical absorption, thermal properties, water content) and
Taylor in situ monitoring of human skin properties (optical absorption, thermal properties, water content) and surface concentrations of topically applied substances (drugs and sunscreen diffusion). The main dif
Taylor surface concentrations of topically applied substances (drugs and sunscreen diffusion). The main difficulty of the PA method in the case of in vivo measurements is the requirement of a closed sample cell,
Taylor ficulty of the PA method in the case of in vivo measurements is the requirement of a closed sample cell, & ficulty of the PA method in the case of in vivo measurements is the requirement of a closed sample cell, & ficulty of the PA method in the case of in vivo measurements is the requirement of a closed sample cell, which can guide the acoustic signal efficiently from sample to acoustical detector. The use of pulsed OA
& which can guide the acoustic signal efficiently from sample to acoustical detector. The use of pulsed OA Francis
which can guide the acoustic signal efficiently from sample to acoustical detector. The use of pulsed OA Francis
which can guide the acoustic signal efficiently from sample to acoustical detector. The use of pulsed OA and OTR techniques is more appropriate for in vivo and in situ measurements.Francis
and OTR techniques is more appropriate for in vivo and in situ measurements.FrancisFor example, the photothermal flow cytometry (PTFC) technique has the ability to visualize absorb
FrancisFor example, the photothermal flow cytometry (PTFC) technique has the ability to visualize absorb
ing cellular structures of moving unlabeled cells in real-time in vivo studies of circulating red and
Francising cellular structures of moving unlabeled cells in real-time in vivo studies of circulating red and
The imaging of single cells
Francis The imaging of single cells in vivo is potentially important for the early diagnosis of diseases (e.g., cancer and diabetes) or for the
Francisin vivo is potentially important for the early diagnosis of diseases (e.g., cancer and diabetes) or for the study of the influence of various factors (e.g., drugs, nanoparticles, smoking, ionizing radiation) on
Francisstudy of the influence of various factors (e.g., drugs, nanoparticles, smoking, ionizing radiation) on
Biomedical Photonics Handbook: Fundamentals, Devices, and Techniques148
probe pulse followed by a 0.08 s delay to the pump pulse, and then a second probe pulse with a tun-able time delay (0–5000 ns) to the pump pulse. The PT image, calculated as the difference between the two probe-pulse images, depends only on absorption contrast transformed by the pump laser pulse into refractive contrast.73
Using transillumination digital microscopy (TDM), red blood cells (RBCs) and lymphocytes travel-ing through blood and/or lymph vessels, lymphatic valves, and other mesenteric structures were imaged (Figure 3.12, left). However, because of its low absorption sensitivity, TDM was not suitable for visual-izing absorbing cellular structures. In contrast, the PTFC mode (navigated by TDM) produced images of moving lymphocytes and RBCs (Figure 3.12, right), showing structures specific to PT images and associated with the spatial distribution of absorbing cellular chromophores (e.g., hemoglobin in RBCs, or cytochromes in lymphocytes). Currently, PTFC’s rate of ~10 cells/s is limited by the repetition rate of the pump laser (10 Hz).
Potential applications of in vivo PTFC include (1) the identification of cells with differences in natural absorptive properties (e.g., the counting of white cells in blood flow or of rare RBCs among lymphocytes in microlymphatic vessels); (2) the monitoring of the circulation and distribution of absorbing nanopar-ticles used for PT probing or photosensitizing; (3) the study of laser–cell interactions; and (4) the study of the influence of different environmental factors on cells.
3.4.3 Acoustooptical Interactions
Acoustic wave (AW) and light interaction within a t issue as a h eterogeneous medium is the basis for acoustooptical tomography or ultrasound (US)-modulated optical tomography, where the acous-tic (US) modulation of coherent laser light traveling within a t issue is provided (see Chapter 20 in Volume II of this handbook).74 An AW is focused into the tissue and laser light irradiates the same volume within the tissue. Any light that is encoded by the US, including both singly and multiply
5 μm
5 μm
5 μm
5 μm
FIGURE 3.12 Photothermal flow cytometry (PTFC) technique.73 Optical transmission (left column) and PT (right column) images in vivo of a single, moving lymphocyte (top row) and RBC (bottom row) in lymph flow in rat mesentery (vessel diameter, 105 μm; velocity, ~120 μm/s). Pump pulse parameters: wavelength, 525 nm; pulse width, 8 ns; and pulse energy, 30 and 0.5 μJ (right column, top and bottom, respectively); time delay between pump and probe pulses, 10 ns.
Copyrighted
Copyrighted
5 μm
Copyrighted
5 μm
Copyrighted
Copyrighted Photothermal flow cytometry (PTFC) technique.
Copyrighted Photothermal flow cytometry (PTFC) technique.
(right column) images in vivo of a single, moving lymphocyte (top row) and RBC (bottom row) in lymph flow in
Copyrighted (right column) images in vivo of a single, moving lymphocyte (top row) and RBC (bottom row) in lymph flow in rat mesentery (vessel diameter, 105
Copyrighted rat mesentery (vessel diameter, 105 μ
Copyrighted μm; velocity, ~120
Copyrighted m; velocity, ~120 Material probe pulse followed by a 0.08 s delay to the pump pulse, and then a second probe pulse with a tun
Material probe pulse followed by a 0.08 s delay to the pump pulse, and then a second probe pulse with a tunable time delay (0–5000 ns) to the pump pulse. The PT image, calculated as the difference between the
Material able time delay (0–5000 ns) to the pump pulse. The PT image, calculated as the difference between the two probe-pulse images, depends only on absorption contrast transformed by the pump laser pulse
Material two probe-pulse images, depends only on absorption contrast transformed by the pump laser pulse
m; velocity, ~120 Material
m; velocity, ~120 width, 8 ns; and pulse energy, 30 and 0.5
Material
width, 8 ns; and pulse energy, 30 and 0.5 μMaterial
μJ (right column, top and bottom, respectively); time delay between pump Material
J (right column, top and bottom, respectively); time delay between pump
- two probe-pulse images, depends only on absorption contrast transformed by the pump laser pulse - two probe-pulse images, depends only on absorption contrast transformed by the pump laser pulse Taylor
two probe-pulse images, depends only on absorption contrast transformed by the pump laser pulse Taylor
two probe-pulse images, depends only on absorption contrast transformed by the pump laser pulse
Using transillumination digital microscopy (TDM), red blood cells (RBCs) and lymphocytes travelTaylor
Using transillumination digital microscopy (TDM), red blood cells (RBCs) and lymphocytes traveling through blood and/or lymph vessels, lymphatic valves, and other mesenteric structures were imaged
Taylor ing through blood and/or lymph vessels, lymphatic valves, and other mesenteric structures were imaged (Figure 3.12, left). However, because of its low absorption sensitivity, TDM was not suitable for visual
Taylor (Figure 3.12, left). However, because of its low absorption sensitivity, TDM was not suitable for visualizing absorbing cellular structures. In contrast, the PTFC mode (navigated by TDM) produced images
Taylor izing absorbing cellular structures. In contrast, the PTFC mode (navigated by TDM) produced images of moving lymphocytes and RBCs (Figure 3.12, right), showing structures specific to PT images and
Taylor of moving lymphocytes and RBCs (Figure 3.12, right), showing structures specific to PT images and & izing absorbing cellular structures. In contrast, the PTFC mode (navigated by TDM) produced images & izing absorbing cellular structures. In contrast, the PTFC mode (navigated by TDM) produced images of moving lymphocytes and RBCs (Figure 3.12, right), showing structures specific to PT images and & of moving lymphocytes and RBCs (Figure 3.12, right), showing structures specific to PT images and associated with the spatial distribution of absorbing cellular chromophores (e.g., hemoglobin in RBCs,
& associated with the spatial distribution of absorbing cellular chromophores (e.g., hemoglobin in RBCs, Francis
associated with the spatial distribution of absorbing cellular chromophores (e.g., hemoglobin in RBCs, Francis
associated with the spatial distribution of absorbing cellular chromophores (e.g., hemoglobin in RBCs, or cytochromes in lymphocytes). Currently, PTFC’s rate of ~10 cells/s is limited by the repetition rate of
Francisor cytochromes in lymphocytes). Currently, PTFC’s rate of ~10 cells/s is limited by the repetition rate of
Potential applications of in vivo PTFC include (1) the identification of cells with differences in natural
FrancisPotential applications of in vivo PTFC include (1) the identification of cells with differences in natural
absorptive properties (e.g., the counting of white cells in blood flow or of rare RBCs among lymphocytes
Francisabsorptive properties (e.g., the counting of white cells in blood flow or of rare RBCs among lymphocytes in microlymphatic vessels); (2) the monitoring of the circulation and distribution of absorbing nanopar
Francisin microlymphatic vessels); (2) the monitoring of the circulation and distribution of absorbing nanoparticles used for PT probing or photosensitizing; (3) the study of laser–cell interactions; and (4) the study
Francisticles used for PT probing or photosensitizing; (3) the study of laser–cell interactions; and (4) the study
Light–Tissue Interactions 149
scattered photons, contributes to the imaging signal. Axial resolution along the acoustic axis can be achieved with US frequency sweeping and subsequent application of the Fourier transformation,74
whereas lateral resolution can be obtained by focusing the AW into the tissue.Three possible mechanisms have been identified for the acoustic modulation of light in scattering
tissues.74 The rst mechanism is based on US-induced variations of the optical properties of a tissue caused by spatially and temporally dependent compression or rarifying of the tissue at the propaga-tion of the AW. These variations in tissue density cause the corresponding oscillations of the optical properties of the tissue, including absorption and scattering coefficients, as well as refractive index. Accordingly, the detected intensity of light varies with the AW. However, US modulation of incoher-ent light has been too weak to be observed experimentally. The second mechanism is based on varia-tions of the optical properties in response to US-induced displacement of scatterers. The displacement of scatterers, assumed to follow AW amplitudes, modulates the physical path lengths of light travel-ing through the acoustic field. Multiply scattered light accumulates modulated physical path lengths along its path. Consequently, the intensity of the speckles formed by the multiply scattered light fluc-tuates with the AW. The modulated component of the speckle pattern carries spatial information determined by the US and can be utilized for tomographic imaging. The third mechanism is caused by photon–phonon interactions, where light is considered as an ensemble of photons and AW an ensemble of phonons. The photon–phonon interactions cause a Doppler shift in the classical sense to the frequency of the photons by the acoustic frequency and its harmonics. An optical detector func-tions as a heterodyning device between the Doppler-shifted light and unshifted light and produces an intensity signal at the acoustic frequency and its harmonics.
Both the second and the third mechanisms require the use of coherent light and both may be associ-ated with the speckle effect. The modulation of the speckles in the second mechanism is caused by the acoustic modulation of scatterer displacement, while the modulation of the speckles in the third mecha-nism is caused by the acoustic modulation of the refractive index of the tissue. The acoustic modulation of the refractive index also appears in both the first and third mechanisms. However, in the first mecha-nism, the variation of the refractive index causes light that may or may not be coherent to fluctuate in intensity, whereas in the second mechanism, the variation of the refractive index causes fluctuation in the phase of coherent light, which is converted to fluctuation in intensity by a square-law detector. Thus, as a result of acoustic modulation of the refractive index, the optical phase between two consecutive scattering events is modulated, multiply scattered light accumulates modulated phases along its path, and the modulated phase causes the intensity of the speckles formed by the multiply scattered light to vary with the AW.
The intensity modulation depth M is defined as the ratio between the intensity at the fundamental frequency I1 and the unmodulated intensity I0:
MI
I= 1
0
. (3.43)
The spectral intensity I1 at the fundamental acoustic frequency ωa is calculated from74
IT
n G dna
T
a
a
=
( )∫1
0
1cos ( )ω τ τ τ (3.44)
at n = 1; here, Ta is the acoustic period; the autocorrelation function of the scalar electric field, E(t), of the scattered light G1(τ) calculated in the approximation of weak scattering (the optical MFP
Copyrighted
tions of the optical properties in response to US-induced displacement of scatterers. The displacement Copyrighted
tions of the optical properties in response to US-induced displacement of scatterers. The displacement of scatterers, assumed to follow AW amplitudes, modulates the physical path lengths of light travel
Copyrighted
of scatterers, assumed to follow AW amplitudes, modulates the physical path lengths of light traveling through the acoustic field. Multiply scattered light accumulates modulated physical path lengths
Copyrighted
ing through the acoustic field. Multiply scattered light accumulates modulated physical path lengths along its path. Consequently, the intensity of the speckles formed by the multiply scattered light fluc
Copyrighted
along its path. Consequently, the intensity of the speckles formed by the multiply scattered light fluctuates with the AW. The modulated component of the speckle pattern carries spatial information
Copyrighted
tuates with the AW. The modulated component of the speckle pattern carries spatial information determined by the US and can be utilized for tomographic imaging. The third mechanism is caused
Copyrighted
determined by the US and can be utilized for tomographic imaging. The third mechanism is caused by photon–phonon interactions, where light is considered as an ensemble of photons and AW an
Copyrighted by photon–phonon interactions, where light is considered as an ensemble of photons and AW an ensemble of phonons. The photon–phonon interactions cause a Doppler shift in the classical sense to
Copyrighted ensemble of phonons. The photon–phonon interactions cause a Doppler shift in the classical sense to the frequency of the photons by the acoustic frequency and its harmonics. An optical detector func
Copyrighted the frequency of the photons by the acoustic frequency and its harmonics. An optical detector functions as a heterodyning device between the Doppler-shifted light and unshifted light and produces an
Copyrighted tions as a heterodyning device between the Doppler-shifted light and unshifted light and produces an Material
tions as a heterodyning device between the Doppler-shifted light and unshifted light and produces an Material
tions as a heterodyning device between the Doppler-shifted light and unshifted light and produces an intensity signal at the acoustic frequency and its harmonics.
Material
intensity signal at the acoustic frequency and its harmonics.Both the second and the third mechanisms require the use of coherent light and both may be associ
Material
Both the second and the third mechanisms require the use of coherent light and both may be associated with the speckle effect. The modulation of the speckles in the second mechanism is caused by the
Material ated with the speckle effect. The modulation of the speckles in the second mechanism is caused by the acoustic modulation of scatterer displacement, while the modulation of the speckles in the third mecha
Material acoustic modulation of scatterer displacement, while the modulation of the speckles in the third mechanism is caused by the acoustic modulation of the refractive index of the tissue. The acoustic modulation
Material nism is caused by the acoustic modulation of the refractive index of the tissue. The acoustic modulation of the refractive index also appears in both the first and third mechanisms. However, in the first mecha
Material of the refractive index also appears in both the first and third mechanisms. However, in the first mecha- of the refractive index also appears in both the first and third mechanisms. However, in the first mecha- of the refractive index also appears in both the first and third mechanisms. However, in the first mechanism, the variation of the refractive index causes light that may or may not be coherent to fluctuate in - nism, the variation of the refractive index causes light that may or may not be coherent to fluctuate in Taylor
nism, the variation of the refractive index causes light that may or may not be coherent to fluctuate in Taylor
nism, the variation of the refractive index causes light that may or may not be coherent to fluctuate in intensity, whereas in the second mechanism, the variation of the refractive index causes fluctuation in
Taylor
intensity, whereas in the second mechanism, the variation of the refractive index causes fluctuation in the phase of coherent light, which is converted to fluctuation in intensity by a square-law detector. Thus,
Taylor the phase of coherent light, which is converted to fluctuation in intensity by a square-law detector. Thus, as a result of acoustic modulation of the refractive index, the optical phase between two consecutive
Taylor as a result of acoustic modulation of the refractive index, the optical phase between two consecutive
Taylor scattering events is modulated, multiply scattered light accumulates modulated phases along its path,
Taylor scattering events is modulated, multiply scattered light accumulates modulated phases along its path, and the modulated phase causes the intensity of the speckles formed by the multiply scattered light to
Taylor and the modulated phase causes the intensity of the speckles formed by the multiply scattered light to & and the modulated phase causes the intensity of the speckles formed by the multiply scattered light to & and the modulated phase causes the intensity of the speckles formed by the multiply scattered light to
Francis
is defined as the ratio between the intensity at the fundamental Francis
is defined as the ratio between the intensity at the fundamental
Biomedical Photonics Handbook: Fundamentals, Devices, and Techniques150
[see Equation 3.7] is much longer than the optical wavelength) and weak modulation (the acoustic amplitude is much less than the optical wavelength) has a view74
GL
ltra1 1
1
61( ) cos ,τ − ε − ω τ=
( ) (3.45)
whereε δ δ= +6 0 0
2( )( )n d n k A
δ α α ηn n n= +( )1 2
2
δd = 1 6/
α −n a tr a trk l k l1
1 2= tan ( )/
α α −−n n a tr a tk l k l2 1
1 1= /[( ) tan ( ) ]/
L is the tissue slab thicknessn0 is the background refractive indexk0 is the optical wave vector in vacuumA is the acoustic amplitudeka is the acoustic wave vectorlt is the photon transport MFP
Parameter η is related to the adiabatic piezo-optical coefficient of the tissue ∂n/∂p, the density ρ, and the acoustic velocity va: η = (∂n/∂p)ρ(va)2. The parameters δn and δd (=1/6) are related to the average contri-butions per photon free path and per scattering event, respectively, to the ultrasonic modulation of light intensity. The contribution from the index of refraction δn increases with kaltr because a longer photon free path, relative to the acoustic wavelength, accumulates a greater phase modulation. By contrast, the contribution from displacement δd stays constant at 1/6, independent of ka and ltr. The contribution from the index of refraction above a critical point at kaltr = 0.559, where contributions from refractive index and displacement are equal, increases with kaltr and significantly outmatches the contribution from displacement.
Accounting for Equation 3.45, the modulation depth of intensity fluctuations can be presented as
M
L
lA
t
=
∝1
6
2
2ε , (3.46)
This equation shows a quadratic relationship between the intensity modulation depth M and the acous-tic amplitude A. Only the nonlinear terms of phase accumulation contribute to the acoustic modulation of coherent light at multiple scattering. The linear term vanishes as a result of optical random walk in scattering media. In the ballistic (nonscattering) regime, M is proportional to A due to nonaveraged contributions from the linear term of phase accumulation. In the quasi-ballistic (minimal scattering) regime, M, may show a mixed behavior with A.
3.4.4 Sonoluminescence
A sonoluminescence (SL) signal generated internally in the media with a 1 M Hz CW US can be used to produce two-dimensional images of objects imbedded in turbid media.75,76 This technique is based on the light emission phenomenon connected with the driving of small bubbles by US collapse. The bubbles start out with a radius of several microns and expand to ∼50 μm, owing to a decrease in acoustic pressure in the negative half of a sinusoidal period; after the acoustic wave reaches the positive half of the period, the resulting pressure difference leads to a rapid collapse of the bubbles, accompanied by a
Copyrighted
1 6Copyrighted
1 6/Copyrighted
/1 6/1 6Copyrighted
1 6/1 6
n aCopyrighted
n a trCopyrighted
trk l k lCopyrighted
k l k ln ak l k ln aCopyrighted
n ak l k ln a trk l k ltrCopyrighted
trk l k ltrn a1n aCopyrighted
n a1n a=Copyrighted
= k l k ltak l k lCopyrighted
k l k ltak l k ln (Copyrighted
n (k l k ln (k l k lCopyrighted
k l k ln (k l k l
α α
Copyrighted
α αn n
Copyrighted
n nα αn nα α
Copyrighted
α αn nα α r a
Copyrighted
r ar ak l k lr a
Copyrighted
r ak l k lr a2 1
Copyrighted
2 1n n2 1n n
Copyrighted
n n2 1n nα αn nα α2 1α αn nα α
Copyrighted
α αn nα α2 1α αn nα α /[
Copyrighted
/[( )
Copyrighted
( )a t( )a t
Copyrighted
a t( )a tr a( )r a
Copyrighted
r a( )r aa tr aa t( )a tr aa t
Copyrighted
a tr aa t( )a tr aa tk l k l( )k l k l
Copyrighted
k l k l( )k l k la tk l k la t( )a tk l k la t
Copyrighted
a tk l k la t( )a tk l k la tr ak l k lr a( )r ak l k lr a
Copyrighted
r ak l k lr a( )r ak l k lr aa tr aa tk l k la tr aa t( )a tr aa tk l k la tr aa t
Copyrighted
a tr aa tk l k la tr aa t( )a tr aa tk l k la tr aa tr a/r a
Copyrighted
r a/r a
is the tissue slab thickness
Copyrighted
is the tissue slab thickness is the background refractive index
Copyrighted
is the background refractive index is the optical wave vector in vacuum
Copyrighted is the optical wave vector in vacuum is the acoustic amplitude
Copyrighted is the acoustic amplitude is the acoustic wave vector
Copyrighted is the acoustic wave vector
is the photon transport MFP
Copyrighted is the photon transport MFP Material
is related to the adiabatic piezo-optical coefficient of the tissue ∂Material
is related to the adiabatic piezo-optical coefficient of the tissue ∂. The parameters
Material . The parameters
butions per photon free path and per scattering event, respectively, to the ultrasonic modulation of light
Material butions per photon free path and per scattering event, respectively, to the ultrasonic modulation of light intensity. The contribution from the index of refraction
Material intensity. The contribution from the index of refraction free path, relative to the acoustic wavelength, accumulates a greater phase modulation. By contrast, the
Material free path, relative to the acoustic wavelength, accumulates a greater phase modulation. By contrast, the stays constant at 1/6, independent of
Material stays constant at 1/6, independent of - stays constant at 1/6, independent of - stays constant at 1/6, independent of = 0.559, where contributions from refractive index - = 0.559, where contributions from refractive index Taylor
stays constant at 1/6, independent of Taylor
stays constant at 1/6, independent of = 0.559, where contributions from refractive index Taylor
= 0.559, where contributions from refractive index and significantly outmatches the contribution from
Taylor and significantly outmatches the contribution from
Accounting for Equation 3.45, the modulation depth of intensity fluctuations can be presented as
Taylor Accounting for Equation 3.45, the modulation depth of intensity fluctuations can be presented as
& FrancisThis equation shows a quadratic relationship between the intensity modulation depth
FrancisThis equation shows a quadratic relationship between the intensity modulation depth M
FrancisM and the acous
Francis and the acousM and the acousM
FrancisM and the acousM
. Only the nonlinear terms of phase accumulation contribute to the acoustic modulation
Francis. Only the nonlinear terms of phase accumulation contribute to the acoustic modulation of coherent light at multiple scattering. The linear term vanishes as a result of optical random walk in
Francisof coherent light at multiple scattering. The linear term vanishes as a result of optical random walk in due to nonaveraged
Francis due to nonaveraged
Light–Tissue Interactions 151
broadband emission of light—SL. Such emission is of a short duration (in tens of picoseconds), repeat-able with each cycle of sound, and has the spectrum containing molecular emission bands (with peaks near 300–500 nm) associated with the liquid, mostly water, in which the SL occurs.
SL tomography (SLT) as a new approach for optical imaging of dense turbid media (biological tissues) is described.75,76 The ajor advantages of SLT include (1) high signal-to-noise ratio due to the internally generated probe optical signal; (2) high contrast of imaging; (3) good spatial resolution, which is limited by the US focal size; and (4) low cost of equipment. It was shown experimentally that there is a threshold of SL generation at applied US pressure, when the peak US pressure at the US focus was ∼2 bar. The rapid increase in the intensity of SL with the acoustic pressure above the threshold indicates that the SL signal would be a sensitive measure of the local acoustic pressure.
SLT is based on several contrast mechanisms76: (1) for the objects with US contrast relative to t he background, the SL signal originating from the object will differ from that originating from the back-ground medium, as the SL generation is affected by the local US intensity; (2) for the objects with con-trast in optical properties, the SL signal from the object is attenuated differently because the SL light must propagate through the object; (3) for objects with the ability to generate SL, the SL from the object is different, even if the local US pressure is the same.
It should be noted that the peak pressure at the US focus is typically less than ∼2 bar (1.3 W/cm2 in spatial-peak-temporal-peak power), which is one order in magnitude less than the safety limit set by the US Food and Drug Administration (23 bar) and two orders less than the tissue damage threshold (400 and 900 W/cm2 at 1 MHz for brain and muscle, respectively).76
3.5 Refractive Index and Controlling of Light Interaction with Tissue
The refractive index in tissues is of great importance for light–tissue interaction. Most tissues have refractive indices for visible light in the 1.335–1.62 range (e.g., 1.55 for the stratum corneum, 1.62 for the enamel, and 1.386 at the lens surface)5,77,78 (see Chapter 2 in this volume). It is worthwhile to note that in vitro and in vivo measurements may differ significantly. For example, the refractive index in rat mesenteric tissue in vitro was found to be 1.52 compared with only 1.38 in vivo. This difference can be accounted for by the decreased refractivity of ground matter n0 due to impaired hydration.
The mean refractive index n of a t issue is defined by the refractive indices of its scattering centers material ns and ground matter n0
5,78:
n c n c ns s s= + −( )1 ,0 (3.47)
where cs is the volume fraction of the scatterers.The ns/n0 ≡ m ratio determines the scattering coefficient. For example, in a si mple monodisperse
model of scattering dielectric spheres79:
′ =
( )µ π ρ πλ
−s saa
m3 282
120 37
2 09. ,
.. (3.48)
wherea is the sphere radiusρs is the volume density of the spheres
Equation 3.48 is valid for noninteracting Mie scatterers, g > 0.9; 5 < 2πa/λ < 50; 1 < m < 1.1.It follows from Equation 3.48 that even a 5% change in the refractive index of the ground matter
(n0 = 1.35 → 1.42), when that of the scattering centers is ns = 1.47, will cause a sevenfold decrease of ′µs .Therefore, matching of the refractive index of the scatterers and ground material enables considerable
Copyrighted
SLT is based on several contrast mechanismsCopyrighted
SLT is based on several contrast mechanismsbackground, the SL signal originating from the object will differ from that originating from the back
Copyrighted
background, the SL signal originating from the object will differ from that originating from the background medium, as the SL generation is affected by the local US intensity; (2) for the objects with con
Copyrighted
ground medium, as the SL generation is affected by the local US intensity; (2) for the objects with contrast in optical properties, the SL signal from the object is attenuated differently because the SL light
Copyrighted
trast in optical properties, the SL signal from the object is attenuated differently because the SL light must propagate through the object; (3) for objects with the ability to generate SL, the SL from the object
Copyrighted
must propagate through the object; (3) for objects with the ability to generate SL, the SL from the object is different, even if the local US pressure is the same.
Copyrighted
is different, even if the local US pressure is the same.It should be noted that the peak pressure at the US focus is typically less than
Copyrighted It should be noted that the peak pressure at the US focus is typically less than
spatial-peak-temporal-peak power), which is one order in magnitude less than the safety limit set by the
Copyrighted spatial-peak-temporal-peak power), which is one order in magnitude less than the safety limit set by the US Food and Drug Administration (23 bar) and two orders less than the tissue damage threshold (400
Copyrighted US Food and Drug Administration (23 bar) and two orders less than the tissue damage threshold (400 at 1 MHz for brain and muscle, respectively).
Copyrighted at 1 MHz for brain and muscle, respectively).Material
Material
at 1 MHz for brain and muscle, respectively).Material
at 1 MHz for brain and muscle, respectively).
efractive Index and Controlling of Light
Material efractive Index and Controlling of Light
Interaction with Tissue
Material Interaction with Tissue
The refractive index in tissues is of great importance for light–tissue interaction. Most tissues have
Material The refractive index in tissues is of great importance for light–tissue interaction. Most tissues have refractive indices for visible light in the 1.335–1.62 range (e.g., 1.55 for the stratum corneum, 1.62 for
Material refractive indices for visible light in the 1.335–1.62 range (e.g., 1.55 for the stratum corneum, 1.62 for - refractive indices for visible light in the 1.335–1.62 range (e.g., 1.55 for the stratum corneum, 1.62 for - refractive indices for visible light in the 1.335–1.62 range (e.g., 1.55 for the stratum corneum, 1.62 for (see Chapter 2 in this volume). It is worthwhile to note
- (see Chapter 2 in this volume). It is worthwhile to note Taylor
refractive indices for visible light in the 1.335–1.62 range (e.g., 1.55 for the stratum corneum, 1.62 for Taylor
refractive indices for visible light in the 1.335–1.62 range (e.g., 1.55 for the stratum corneum, 1.62 for (see Chapter 2 in this volume). It is worthwhile to note Taylor
(see Chapter 2 in this volume). It is worthwhile to note Taylor that in vitro and in vivo measurements may differ significantly. For example, the refractive index in rat
Taylor that in vitro and in vivo measurements may differ significantly. For example, the refractive index in rat mesenteric tissue in vitro was found to be 1.52 compared with only 1.38 in vivo. This difference can be
Taylor mesenteric tissue in vitro was found to be 1.52 compared with only 1.38 in vivo. This difference can be
Taylor due to impaired hydration.
Taylor due to impaired hydration.
of a t issue is defined by the refractive indices of its scattering centers
Taylor of a t issue is defined by the refractive indices of its scattering centers & of a t issue is defined by the refractive indices of its scattering centers & of a t issue is defined by the refractive indices of its scattering centers
Francis ratio determines the scattering coefficient. For example, in a si mple monodisperse
Francis ratio determines the scattering coefficient. For example, in a si mple monodisperse
Biomedical Photonics Handbook: Fundamentals, Devices, and Techniques152
reduction of tissue scattering. This phenomenon is very useful for improving facilities of optical tomog-raphy and for obtaining precise spectroscopic information from the depth of a tissue.
Optical parameters of a tissue, in particular the refractive index, are known to depend on water con-tent. The refractive index of water over a broad wavelength range of 0.2–200 μm has been reported.77 The following relation was shown to be valid for the visible and NIR wavelength range (λ in nm)80:
nH O2
1 3199 6878 1 132 10 1 11 102
9
4
14
6= + × + ×. . .
.λ
−λ λ
(3.49)
For different parts of a biological cell, values of the refractive index in the NIR can be estimated as follows: extracellular fluid—n = 1.35–1.36; cytoplasm—1.360–1.375; cell membrane—1.46; nucleus—1.38–1.41; mitochondria and organelles—1.38–1.41; and melanin—1.6–1.7.5,81 Scattering arises from a mismatch in refractive index of the components that make up the cell. In tissues, when cells are surrounded by other cells or tissue structures of similar index, certain organelles become important scatterers. For instance, the nucleus is a significant scatterer because it is often the largest organelle in the cell and its size increases relative to the rest of the cell throughout neoplastic progression. Mitochondria (500–1500 nm in diameter), lysosomes (500 nm), and peroxisomes (500 nm) are very important scatterers, whose size relative to the wavelength of light suggests that they must contribute significantly to backscattering. Melanin granular, traditionally thought of as an absorber, must be considered an important scatterer because of its size and high refractive index.81 Structures consisting of membrane layers such as the endoplasmic reticulum or Golgi apparatus may prove significant because they contain index fluctua-tions of high spatial frequency and amplitude. Besides cell components, fibrous structures of tissue such as collagen and elastin must be considered important scatterers.
Refractivity measurements in a number of strongly scattering tissues at 633 nm performed with a fiber-optic refractometer have shown that fatty tissue has the largest refractive index (1.455) followed by kidney (1.418), muscular tissue (1.410), and blood and spleen (1.400).82 The lowest refractive indices were found in lungs and liver (1.380 and 1.368, respectively) (see Chapter 2 in this volume). Refractive indices tend to decrease with increasing light wavelength from 390 to 700 nm (e.g., for bovine muscle in the range of 1.42–1.39).
It is possible to a chieve a m arked impairment of scattering by matching the refractive indices of scattering centers and ground matter by means of intratissue administration of the appropriate chemi-cal agents. Experimental optical clearing in human sclera in the visible wavelength range induced by administration of x-ray contrast (verografin, trazograph), glucose, propylene glycol, polyethylene glycol, and other solutions has been described.5,7,78,83–87 Osmotic phenomena appear to be involved when optical properties of tissues are modulated by sugar, alcohol, glycerol, and electrolyte solutions.
Experimental studies on optical clearing of normal and pathological skin and its components ( epidermis and dermis) and the management of reflectance and transmittance spectra using glycerol, glycerol–water solutions, glucose, sunscreen creams, cosmetic lotions, gels, and pharmaceutical prod-ucts were carried out.5,7,78
A marked clearing effect through the rat85 and human86 skin and the rabbit sclera7,78 was observed in an in vivo tissue within a few minutes of topical application or intratissue injection of glycerol, glucose, verografin, or trazograph. In vivo reflectance spectra of the human skin with intraskin injection of 40% glucose are shown in Figure 3.13. Skin is well protected from penetration of any agent by the stratum corneum, thus preventing permeation of optical clearing agents with topical application. In addition, optical reflectance of the skin is defined mostly by the dermis. For both these reasons, the intradermis injection is useful if temporal reduction of light scattering by the skin as a whole is desirable.
Multiple scattering is a detrimental factor that limits OCT imaging performances including imag-ing resolution, depth, and localization (OCT is described in Chapter 10 in this volume). To improve the imaging capabilities, the multiple scattering of tissue must be reduced. The mmersion technique for the application of biocompatible agents is a prospective technique for OCT because the depth and contrast
Copyrighted
For different parts of a biological cell, values of the refractive index in the NIR can be estimated as follows: Copyrighted
For different parts of a biological cell, values of the refractive index in the NIR can be estimated as follows: extracellular fluid—
Copyrighted
extracellular fluid—mitochondria and organelles—1.38–1.41; and melanin—1.6–1.7.
Copyrighted
mitochondria and organelles—1.38–1.41; and melanin—1.6–1.7.in refractive index of the components that make up the cell. In tissues, when cells are surrounded by
Copyrighted
in refractive index of the components that make up the cell. In tissues, when cells are surrounded by other cells or tissue structures of similar index, certain organelles become important scatterers. For
Copyrighted
other cells or tissue structures of similar index, certain organelles become important scatterers. For instance, the nucleus is a significant scatterer because it is often the largest organelle in the cell and its
Copyrighted
instance, the nucleus is a significant scatterer because it is often the largest organelle in the cell and its size increases relative to the rest of the cell throughout neoplastic progression. Mitochondria (500–1500
Copyrighted size increases relative to the rest of the cell throughout neoplastic progression. Mitochondria (500–1500 nm in diameter), lysosomes (500 nm), and peroxisomes (500 nm) are very important scatterers, whose
Copyrighted nm in diameter), lysosomes (500 nm), and peroxisomes (500 nm) are very important scatterers, whose size relative to the wavelength of light suggests that they must contribute significantly to backscattering.
Copyrighted size relative to the wavelength of light suggests that they must contribute significantly to backscattering. Melanin granular, traditionally thought of as an absorber, must be considered an important scatterer
Copyrighted Melanin granular, traditionally thought of as an absorber, must be considered an important scatterer Material
Melanin granular, traditionally thought of as an absorber, must be considered an important scatterer Material
Melanin granular, traditionally thought of as an absorber, must be considered an important scatterer because of its size and high refractive index.
Material
because of its size and high refractive index.endoplasmic reticulum or Golgi apparatus may prove significant because they contain index fluctua
Material
endoplasmic reticulum or Golgi apparatus may prove significant because they contain index fluctuations of high spatial frequency and amplitude. Besides cell components, fibrous structures of tissue such
Material tions of high spatial frequency and amplitude. Besides cell components, fibrous structures of tissue such as collagen and elastin must be considered important scatterers.
Material as collagen and elastin must be considered important scatterers.
Refractivity measurements in a number of strongly scattering tissues at 633 nm performed with a fiber-optic
Material Refractivity measurements in a number of strongly scattering tissues at 633 nm performed with a fiber-optic refractometer have shown that fatty tissue has the largest refractive index (1.455) followed by kidney (1.418),
Material refractometer have shown that fatty tissue has the largest refractive index (1.455) followed by kidney (1.418), - refractometer have shown that fatty tissue has the largest refractive index (1.455) followed by kidney (1.418), - refractometer have shown that fatty tissue has the largest refractive index (1.455) followed by kidney (1.418), The lowest refractive indices were found in lungs and - The lowest refractive indices were found in lungs and Taylor
The lowest refractive indices were found in lungs and Taylor
The lowest refractive indices were found in lungs and liver (1.380 and 1.368, respectively) (see Chapter 2 in this volume). Refractive indices tend to decrease with Taylor
liver (1.380 and 1.368, respectively) (see Chapter 2 in this volume). Refractive indices tend to decrease with increasing light wavelength from 390 to 700 nm (e.g., for bovine muscle in the range of 1.42–1.39).
Taylor increasing light wavelength from 390 to 700 nm (e.g., for bovine muscle in the range of 1.42–1.39).
It is possible to a chieve a m arked impairment of scattering by matching the refractive indices of
Taylor It is possible to a chieve a m arked impairment of scattering by matching the refractive indices of
scattering centers and ground matter by means of intratissue administration of the appropriate chemi
Taylor scattering centers and ground matter by means of intratissue administration of the appropriate chemical agents. Experimental optical clearing in human sclera in the visible wavelength range induced by
Taylor cal agents. Experimental optical clearing in human sclera in the visible wavelength range induced by & cal agents. Experimental optical clearing in human sclera in the visible wavelength range induced by & cal agents. Experimental optical clearing in human sclera in the visible wavelength range induced by administration of x-ray contrast (verografin, trazograph), glucose, propylene glycol, polyethylene glycol,
& administration of x-ray contrast (verografin, trazograph), glucose, propylene glycol, polyethylene glycol, Osmotic phenomena appear to be involved when optical
& Osmotic phenomena appear to be involved when optical Francis
administration of x-ray contrast (verografin, trazograph), glucose, propylene glycol, polyethylene glycol, Francis
administration of x-ray contrast (verografin, trazograph), glucose, propylene glycol, polyethylene glycol, Osmotic phenomena appear to be involved when optical Francis
Osmotic phenomena appear to be involved when optical Francisproperties of tissues are modulated by sugar, alcohol, glycerol, and electrolyte solutions.
Francisproperties of tissues are modulated by sugar, alcohol, glycerol, and electrolyte solutions.
Experimental studies on optical clearing of normal and pathological skin and its components
FrancisExperimental studies on optical clearing of normal and pathological skin and its components
pidermis and dermis) and the management of reflectance and transmittance spectra using glycerol,
Francispidermis and dermis) and the management of reflectance and transmittance spectra using glycerol, glycerol–water solutions, glucose, sunscreen creams, cosmetic lotions, gels, and pharmaceutical prod
Francisglycerol–water solutions, glucose, sunscreen creams, cosmetic lotions, gels, and pharmaceutical prod
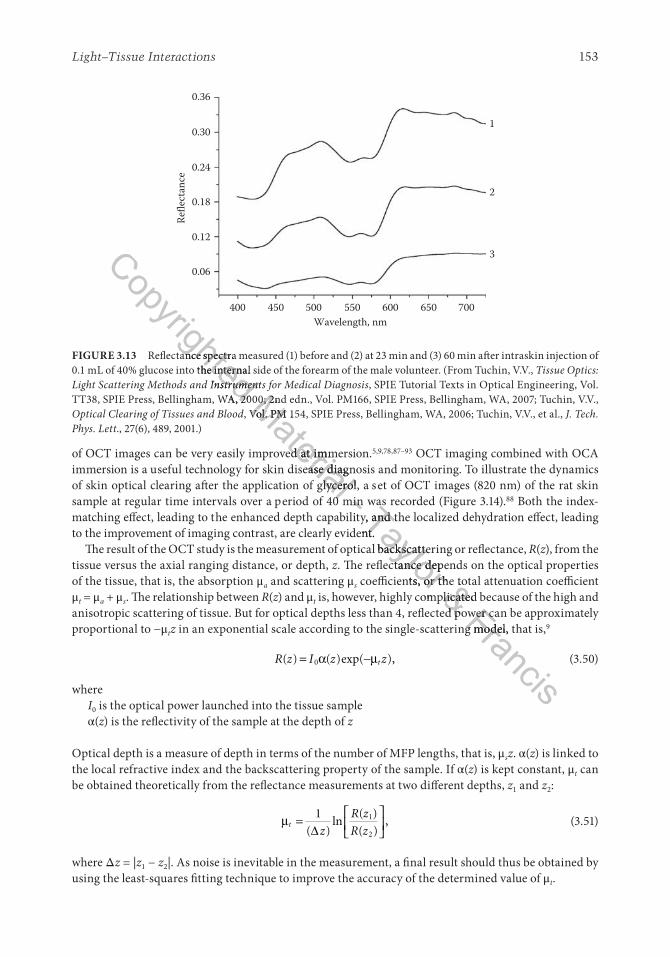
Light–Tissue Interactions 153
of OCT images can be very easily improved at immersion.5,9,78,87–93 OCT imaging combined with OCA immersion is a useful technology for skin disease diagnosis and monitoring. To illustrate the dynamics of skin optical clearing after the application of glycerol, a set of OCT images (820 nm) of the rat skin sample at regular time intervals over a period of 40 min was recorded (Figure 3.14).88 Both the index-matching effect, leading to the enhanced depth capability, and the localized dehydration effect, leading to the improvement of imaging contrast, are clearly evident.
The result of the OCT study is the measurement of optical backscattering or reflectance, R(z), from the tissue versus the axial ranging distance, or depth, z. The reflectance depends on the optical properties of the tissue, that is, the absorption μa and scattering μs coefficients, or the total attenuation coefficient μt = μa + μs. The relationship between R(z) and μt is, however, highly complicated because of the high and anisotropic scattering of tissue. But for optical depths less than 4, reflected power can be approximately proportional to −μtz in an exponential scale according to the single-scattering model, that is,9
R z I z zt( ) ( )exp( ),= 0α −µ (3.50)
whereI0 is the optical power launched into the tissue sampleα(z) is the reflectivity of the sample at the depth of z
Optical depth is a measure of depth in terms of the number of MFP lengths, that is, μsz. α(z) is linked to the local refractive index and the backscattering property of the sample. If α(z) is kept constant, μt can be obtained theoretically from the reflectance measurements at two different depths, z1 and z2:
µ∆t
z
R z
R z=
1 1
2( )ln
( )
( ), (3.51)
where Δz = |z1 − z2|. As noise is inevitable in the measurement, a final result should thus be obtained by using the least-squares fitting technique to improve the accuracy of the determined value of μt.
0.36
0.30
Refle
ctan
ce0.24
0.18
0.12
0.06
400 450 500 550 600 650 700
3
2
1
Wavelength, nm
FIGURE 3.13 Reflectance spectra measured (1) before and (2) at 23 min and (3) 60 min after intraskin injection of 0.1 mL of 40% glucose into the internal side of the forearm of the male volunteer. (From Tuchin, V.V., Tissue Optics: Light Scattering Methods and Instruments for Medical Diagnosis, SPIE Tutorial Texts in Optical Engineering, Vol. TT38, SPIE Press, Bellingham, WA, 2000; 2nd edn., Vol. PM166, SPIE Press, Bellingham, WA, 2007; Tuchin, V.V., Optical Clearing of Tissues and Blood, Vol. PM 154, SPIE Press, Bellingham, WA, 2006; Tuchin, V.V., et al., J. Tech. Phys. Lett., 27(6), 489, 2001.)
Copyrighted Reflectance spectra measured (1) before and (2) at 23 min and (3) 60 min after intraskin injection of
Copyrighted Reflectance spectra measured (1) before and (2) at 23 min and (3) 60 min after intraskin injection of
0.1 mL of 40% glucose into the internal side of the forearm of the male volunteer. (From Tuchin, V.V.,
Copyrighted 0.1 mL of 40% glucose into the internal side of the forearm of the male volunteer. (From Tuchin, V.V., Light Scattering Methods and Instruments for Medical Diagnosis
Copyrighted Light Scattering Methods and Instruments for Medical DiagnosisTT38, SPIE Press, Bellingham, WA, 2000; 2nd edn., Vol. PM166, SPIE Press, Bellingham, WA, 2007; Tuchin, V.V.,
Copyrighted TT38, SPIE Press, Bellingham, WA, 2000; 2nd edn., Vol. PM166, SPIE Press, Bellingham, WA, 2007; Tuchin, V.V., Material
TT38, SPIE Press, Bellingham, WA, 2000; 2nd edn., Vol. PM166, SPIE Press, Bellingham, WA, 2007; Tuchin, V.V., Material
TT38, SPIE Press, Bellingham, WA, 2000; 2nd edn., Vol. PM166, SPIE Press, Bellingham, WA, 2007; Tuchin, V.V., Material of OCT images can be very easily improved at immersion.
Material of OCT images can be very easily improved at immersion.immersion is a useful technology for skin disease diagnosis and monitoring. To illustrate the dynamics
Material immersion is a useful technology for skin disease diagnosis and monitoring. To illustrate the dynamics of skin optical clearing after the application of glycerol, a set of OCT images (820 nm) of the rat skin
Material of skin optical clearing after the application of glycerol, a set of OCT images (820 nm) of the rat skin at regular time intervals over a period of 40 min was recorded (Figure 3.14).
Material at regular time intervals over a period of 40 min was recorded (Figure 3.14).
, Vol. PM 154, SPIE Press, Bellingham, WA, 2006; Tuchin, V.V., et al., Material
, Vol. PM 154, SPIE Press, Bellingham, WA, 2006; Tuchin, V.V., et al.,
- at regular time intervals over a period of 40 min was recorded (Figure 3.14).- at regular time intervals over a period of 40 min was recorded (Figure 3.14).matching effect, leading to the enhanced depth capability, and the localized dehydration effect, leading
- matching effect, leading to the enhanced depth capability, and the localized dehydration effect, leading Taylor
at regular time intervals over a period of 40 min was recorded (Figure 3.14).Taylor
at regular time intervals over a period of 40 min was recorded (Figure 3.14).matching effect, leading to the enhanced depth capability, and the localized dehydration effect, leading Taylor
matching effect, leading to the enhanced depth capability, and the localized dehydration effect, leading to the improvement of imaging contrast, are clearly evident.
Taylor to the improvement of imaging contrast, are clearly evident.
The result of the OCT study is the measurement of optical backscattering or reflectance,
Taylor The result of the OCT study is the measurement of optical backscattering or reflectance,
. The reflectance depends on the optical properties
Taylor . The reflectance depends on the optical properties
coefficients, or the total attenuation coefficient
Taylor coefficients, or the total attenuation coefficient is, however, highly complicated because of the high and
Taylor is, however, highly complicated because of the high and & coefficients, or the total attenuation coefficient & coefficients, or the total attenuation coefficient
is, however, highly complicated because of the high and & is, however, highly complicated because of the high and anisotropic scattering of tissue. But for optical depths less than 4, reflected power can be approximately
& anisotropic scattering of tissue. But for optical depths less than 4, reflected power can be approximately Francis
anisotropic scattering of tissue. But for optical depths less than 4, reflected power can be approximately Francis
anisotropic scattering of tissue. But for optical depths less than 4, reflected power can be approximately in an exponential scale according to the single-scattering model, that is,
Francis
in an exponential scale according to the single-scattering model, that is,
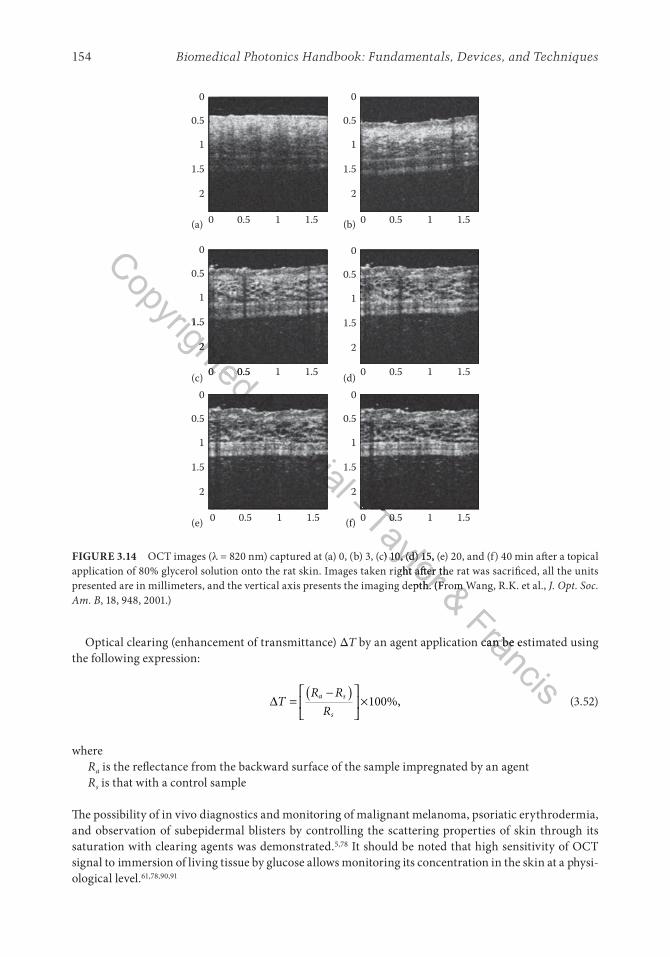
Biomedical Photonics Handbook: Fundamentals, Devices, and Techniques154
Optical clearing (enhancement of transmittance) ΔT by an agent application can be estimated using the following expression:
∆−
TR R
Ra s
s
= ( )
×100%, (3.52)
whereRa is the reflectance from the backward surface of the sample impregnated by an agentRs is that with a control sample
The possibility of in vivo diagnostics and monitoring of malignant melanoma, psoriatic erythrodermia, and observation of subepidermal blisters by controlling the scattering properties of skin through its saturation with clearing agents was demonstrated.5,78 It should be noted that high sensitivity of OCT signal to immersion of living tissue by glucose allows monitoring its concentration in the skin at a physi-ological level.61,78,90,91
0
0.5
1
1.5
2
0(a) (b)
(c) (d)
(e) (f)
0.5 1 1.5
0
0.5
1
1.5
2
0 0.5 1 1.5
0
0.5
1
1.5
2
0 0.5 1 1.5
0
0.5
1
1.5
2
0 0.5 1 1.5
0
0.5
1
1.5
2
0 0.5 1 1.5
0
0.5
1
1.5
2
0 0.5 1 1.5
FIGURE 3.14 OCT images (λ = 820 nm) captured at (a) 0, (b) 3, (c) 10, (d) 15, (e) 20, and (f) 40 min after a topical application of 80% glycerol solution onto the rat skin. Images taken right after the rat was sacrificed, all the units presented are in millimeters, and the vertical axis presents the imaging depth. (From Wang, R.K. et al., J. Opt. Soc. Am. B, 18, 948, 2001.)
Copyrighted
Copyrighted
Copyrighted
1.5
Copyrighted
1.5
2
Copyrighted 2
0 0.5 1 1.5
Copyrighted 0 0.5 1 1.5
Material
Material 1.5
Material 1.5
2
Material 2- - Taylor
Taylor
0 0.5 1 1.5Taylor
0 0.5 1 1.5Taylor = 820 nm) captured at (a) 0, (b) 3, (c) 10, (d) 15, (e) 20, and (f) 40 min after a topical
Taylor = 820 nm) captured at (a) 0, (b) 3, (c) 10, (d) 15, (e) 20, and (f) 40 min after a topical
Taylor application of 80% glycerol solution onto the rat skin. Images taken right after the rat was sacrificed, all the units
Taylor application of 80% glycerol solution onto the rat skin. Images taken right after the rat was sacrificed, all the units presented are in millimeters, and the vertical axis presents the imaging depth. (From Wang, R.K. et al.,
Taylor presented are in millimeters, and the vertical axis presents the imaging depth. (From Wang, R.K. et al., & presented are in millimeters, and the vertical axis presents the imaging depth. (From Wang, R.K. et al., & presented are in millimeters, and the vertical axis presents the imaging depth. (From Wang, R.K. et al.,
Francis by an agent application can be estimated using
Francis by an agent application can be estimated using
Light–Tissue Interactions 155
Although glycerol and glucose are effective OCAs when injected into the dermis, they do not nor-mally penetrate so well into intact skin. In recent OCT experiments with human skin in vivo with topical application during 90–120 min of the combined lipophilic polypropylene glycol–based polymers and hydrophilic polyethylene glycol (PEG)-based polymers, both with refractive indices of 1.47, which closely matches that of skin-scattering components in SC, epidermis, and dermis, it was shown that a polymer mixture can penetrate intact skin and improve OCT images to see dermal vasculature and hair follicles more clearly.89 This composition may have some advantages in skin optical clearing due to the hydrophilic component, which may more effectively diffuse within living epidermis and dermis; less osmotic strength may also have some advantages, but the optical clearing depth could not be improved radically in comparison with topical application of other clearing agents, such as glycerol, glucose, x-ray contrast, and propylene glycol, because of principal limitations of chemical agent diffusion through intact cell layers. Thus, to provide fast and effective optical clearing of skin, the appropriate well-known or newly developed methods of enhanced agent delivery should be applied.
The concept that index matching could improve the optical penetration depth of whole blood is proved experimentally in in vitro studies using OCT.78,92,93 For example, for whole blood twice diluted by saline, adding 6.5% of glycerol increases the optical penetration up to 117%; optical clearing up to 150% was achieved mostly due to refractive index matching for the high–molecular weight dextran.93
3.6 Fluorescence
3.6.1 Fundamentals and Methods
Fluorescence arises upon light absorption and is related to an electronic transition from the excited state to the ground state of a molecule. In the case of thin samples, for example, cell monolayers or biopsies with a f ew micrometers in diameter, fluorescence intensity IF is proportional to the concentration c and the fluorescence quantum yield η of the absorbing molecules.17,94 In a scattering medium, the path lengths of scattered and unscattered photons within the sample are different, and should be accounted for.17 However, in rather homogeneous thin samples, the linearity between IF, c, and η is still fulfilled.
When biological objects are excited by UV light (λ ≤ 300 nm), fluorescence of proteins and nucleic acids can be observed. Fluorescence quantum yields of all nucleic acid constituents, however, are around 10−4–10−5 corresponding to lifetimes of the excited states in the picosecond time range. Autofluorescence of proteins is related to the amino acids tryptophan, tyrosin, and phenylalanine with absorption maxima at 280, 275, and 257 nm, respectively, and emission maxima between 280 (phenylalanine) and 350 nm (tryptophan). Usually, the protein spectrum is dominated by tryptophan. Fluorescence from collagen or elastin is excited between 300 and 400 nm and shows broad emission bands between 400 and 600 nm with maxima around 400, 430, and 460 nm. In particular, fluorescence of collagen and elastin can be used to distinguish various types of tissues, such as epithelial and connective tissues.16,17,94–97
The reduced form of coenzyme nicotinamide adenine dinucleotide (NADH) is excited selectively in a wavelength range between 330 and 370 nm. NADH is most concentrated within mitochondria, where it is oxidized within the respiratory chain located within the inner mitochondrial membrane and its fluo-rescence is an appropriate parameter for detection of ischemic or neoplastic tissues.94 Fluorescence of free and protein-bound NADH has been shown to be sensitive on oxygen concentration. Flavin mono-nucleotide (FMN) and flavin dinucleotide (FAD) with excitation maxima around 380 and 450 nm have also been reported to contribute to intrinsic cellular fluorescence.94
Porphyrin molecules, for example, protoporphyrin, coproporphyrin, uroporphyrin, or hematopor-phyrin, occur within the pathway of biosynthesis of hemoglobin, myoglobin, and cytochromes; thus, intrinsic fluorescence of these molecules provides information related to disease development. For exam-ple, abnormalities in heme synthesis, occurring in the cases of porphyrias and some hemolytic diseases, may enhance considerably the porphyrin level within tissues, which could be detected via tissue autofluo-rescence associated with porphyrin bands. Several bacteria, such as Propionibacterium acnes or bacteria
Copyrighted
contrast, and propylene glycol, because of principal limitations of chemical agent diffusion through Copyrighted
contrast, and propylene glycol, because of principal limitations of chemical agent diffusion through intact cell layers. Thus, to provide fast and effective optical clearing of skin, the appropriate well-known
Copyrighted
intact cell layers. Thus, to provide fast and effective optical clearing of skin, the appropriate well-known or newly developed methods of enhanced agent delivery should be applied.
Copyrighted
or newly developed methods of enhanced agent delivery should be applied.The concept that index matching could improve the optical penetration depth of whole blood is
Copyrighted
The concept that index matching could improve the optical penetration depth of whole blood is proved experimentally in in vitro studies using OCT.
Copyrighted
proved experimentally in in vitro studies using OCT.by saline, adding 6.5% of glycerol increases the optical penetration up to 117%; optical clearing up to
Copyrighted
by saline, adding 6.5% of glycerol increases the optical penetration up to 117%; optical clearing up to 150% was achieved mostly due to refractive index matching for the high–molecular weight dextran.
Copyrighted 150% was achieved mostly due to refractive index matching for the high–molecular weight dextran.
Material
Material
undamentals and MethodsMaterial
undamentals and Methods
arises upon light absorption and is related to an electronic transition from the excited state
Material arises upon light absorption and is related to an electronic transition from the excited state
to the ground state of a molecule. In the case of thin samples, for example, cell monolayers or biopsies
Material to the ground state of a molecule. In the case of thin samples, for example, cell monolayers or biopsies with a f ew micrometers in diameter, fluorescence intensity
Material with a f ew micrometers in diameter, fluorescence intensity of the absorbing molecules.
Material of the absorbing molecules.- of the absorbing molecules.- of the absorbing molecules.lengths of scattered and unscattered photons within the sample are different, and should be accounted - lengths of scattered and unscattered photons within the sample are different, and should be accounted Taylor
lengths of scattered and unscattered photons within the sample are different, and should be accounted Taylor
lengths of scattered and unscattered photons within the sample are different, and should be accounted However, in rather homogeneous thin samples, the linearity between
Taylor
However, in rather homogeneous thin samples, the linearity between ≤ 300 nm), fluorescence of proteins and nucleic
Taylor ≤ 300 nm), fluorescence of proteins and nucleic
Taylor acids can be observed. Fluorescence quantum yields of all nucleic acid constituents, however, are around
Taylor acids can be observed. Fluorescence quantum yields of all nucleic acid constituents, however, are around
corresponding to lifetimes of the excited states in the picosecond time range. Autofluorescence
Taylor corresponding to lifetimes of the excited states in the picosecond time range. Autofluorescence of proteins is related to the amino acids tryptophan, tyrosin, and phenylalanine with absorption maxima
Taylor of proteins is related to the amino acids tryptophan, tyrosin, and phenylalanine with absorption maxima & of proteins is related to the amino acids tryptophan, tyrosin, and phenylalanine with absorption maxima & of proteins is related to the amino acids tryptophan, tyrosin, and phenylalanine with absorption maxima at 280, 275, and 257 nm, respectively, and emission maxima between 280 (phenylalanine) and 350 nm
& at 280, 275, and 257 nm, respectively, and emission maxima between 280 (phenylalanine) and 350 nm Francis
at 280, 275, and 257 nm, respectively, and emission maxima between 280 (phenylalanine) and 350 nm Francis
at 280, 275, and 257 nm, respectively, and emission maxima between 280 (phenylalanine) and 350 nm (tryptophan). Usually, the protein spectrum is dominated by tryptophan. Fluorescence from collagen or Francis
(tryptophan). Usually, the protein spectrum is dominated by tryptophan. Fluorescence from collagen or elastin is excited between 300 and 400 nm and shows broad emission bands between 400 and 600 nm
Franciselastin is excited between 300 and 400 nm and shows broad emission bands between 400 and 600 nm with maxima around 400, 430, and 460 nm. In particular, fluorescence of collagen and elastin can be
Franciswith maxima around 400, 430, and 460 nm. In particular, fluorescence of collagen and elastin can be
Francis16,17,94–97
Francis16,17,94–97
The reduced form of coenzyme nicotinamide adenine dinucleotide (NADH) is excited selectively in a
FrancisThe reduced form of coenzyme nicotinamide adenine dinucleotide (NADH) is excited selectively in a wavelength range between 330 and 370 nm. NADH is most concentrated within mitochondria, where it
Franciswavelength range between 330 and 370 nm. NADH is most concentrated within mitochondria, where it
Biomedical Photonics Handbook: Fundamentals, Devices, and Techniques156
within dental caries lesions, accumulate considerable amounts of protoporphyrin.94 Therefore, acne or caries detection based on measurements of intrinsic fluorescence appears to be a promising method.
At present, various exogenous fluorescing dyes can be applied for probing of cell anatomy and cell physiology.94 In humans, dyes such as fluorescein and indocyanine green are used for fluorescence angi-ography or blood volume determination.
Fluorescence spectra often give detailed information on fluorescent molecules, their conformation, binding sites, and interaction within cells and tissues. Fluorescence intensity can be measured either as a function of the emission wavelength or of the excitation wavelength. The fluorescence emission spec-trum IF(λ) is specific for any fluorophore and commonly used in fluorescence diagnostics.
For many biomedical applications, an optical multichannel analyzer (OMA) (a diode array or a charge-coupled device [CCD] camera) as a detector of emission radiation is preferable, because spectra can be recorded very rapidly and repeatedly with sequences in the millisecond range. Fluorescence spectrometers for in vivo diagnostics are commonly based on fiber-optic systems. The excitation light of a lamp or a laser is guided to the tissue (e.g., some specific organ) via a fiber using appropriate optical filters. Fluorescence spectra are usually measured either via the same fiber or via a second fiber or fiber bundle in close proximity to the excitation fiber.
Various comprehensive and powerful fluorescence spectroscopies such as microspectrofluorimetry, polarization anisotropy, time-resolved with pulse excitation and frequency domain, time-gated, total inter-nal reflection fluorescence spectroscopy and microscopy, fluorescence resonant energy transfer method, confocal laser scanning microscopy, and their combinations are available now17,94 (see Chapter 15 in Volume II of this handbook). These methods provide the following:
• 3D topography of specimens measured in the reflection mode for morphological studies of bio-logical samples
• High-resolution microscopy measured in the transmission mode• 3D-fluorescence detection of cellular structures and fluorescence bleaching kinetics• Time-resolved fl orescence kinetics• Studies of motions of cellular structures• Time-gated imaging in order to select specific fluorescent molecules or molecular interactions• Fluorescence lifetime imaging• Spectrally resolved imaging
Principles of optical clinical chemistry based on measuring the changes of fluorescence intensity, wave-length, polarization anisotropy, and lifetime are described by Lakowicz.17 Various fl orescence tech-niques of selective oxygen sensing and blood glucose and blood gases detection are available.17,61
3.6.2 Multiphoton Fluorescence
A new direction in laser spectroscopy of biological objects is associated with multiphoton (two-, three-photon) fluorescence scanning microscopy, which makes it possible to image functional states of an object or to determine, in combination with autocorrelation analysis of the fluorescence signal, the intercellular motility in small volumes18 (see Chapter 12 in this volume). The two-photon technique employs both bal-listic and scattered photons at the wavelength of the second harmonic of incident radiation coming to a wide-aperture photodetector exactly from the focal area of the excitation beam. A u nique advantage of two-photon microscopy is the possibility of investigating three-dimensional distributions of chromo-phores excited with UV radiation in thick samples. Such an investigation becomes possible because chro-mophores can be excited (e.g., at the wavelength of 350 nm) with laser radiation whose wavelength falls within the range (700 nm) where a tissue has high transparency. Such radiation can reach deep-lying layers and produces less damage in tissues. Fluorescent emission in this case lies in the visible range (>400 nm) and comparatively easily emerges from a tissue and reaches a photodetector, which registers only the legiti-mate signal from the focal volume without any extraneous background. Investigations of tissues and cells
Copyrighted
charge-coupled device [CCD] camera) as a detector of emission radiation is preferable, because spectra Copyrighted
charge-coupled device [CCD] camera) as a detector of emission radiation is preferable, because spectra can be recorded very rapidly and repeatedly with sequences in the millisecond range. Fluorescence
Copyrighted
can be recorded very rapidly and repeatedly with sequences in the millisecond range. Fluorescence spectrometers for in vivo diagnostics are commonly based on fiber-optic systems. The excitation light
Copyrighted
spectrometers for in vivo diagnostics are commonly based on fiber-optic systems. The excitation light of a lamp or a laser is guided to the tissue (e.g., some specific organ) via a fiber using appropriate optical
Copyrighted
of a lamp or a laser is guided to the tissue (e.g., some specific organ) via a fiber using appropriate optical filters. Fluorescence spectra are usually measured either via the same fiber or via a second fiber or fiber
Copyrighted
filters. Fluorescence spectra are usually measured either via the same fiber or via a second fiber or fiber bundle in close proximity to the excitation fiber.
Copyrighted
bundle in close proximity to the excitation fiber.Various comprehensive and powerful fluorescence spectroscopies such as microspectrofluorimetry,
Copyrighted Various comprehensive and powerful fluorescence spectroscopies such as microspectrofluorimetry,
polarization anisotropy, time-resolved with pulse excitation and frequency domain, time-gated, total inter
Copyrighted polarization anisotropy, time-resolved with pulse excitation and frequency domain, time-gated, total internal reflection fluorescence spectroscopy and microscopy, fluorescence resonant energy transfer method,
Copyrighted nal reflection fluorescence spectroscopy and microscopy, fluorescence resonant energy transfer method, confocal laser scanning microscopy, and their combinations are available now
Copyrighted confocal laser scanning microscopy, and their combinations are available nowMaterial
confocal laser scanning microscopy, and their combinations are available nowMaterial
confocal laser scanning microscopy, and their combinations are available nowVolume II of this handbook). These methods provide the following:
Material
Volume II of this handbook). These methods provide the following:
3D topography of specimens measured in the reflection mode for morphological studies of bio
Material 3D topography of specimens measured in the reflection mode for morphological studies of bio
High-resolution microscopy measured in the transmission mode
Material High-resolution microscopy measured in the transmission mode3D-fluorescence detection of cellular structures and fluorescence bleaching kinetics
Material 3D-fluorescence detection of cellular structures and fluorescence bleaching kinetics- Taylor Time-gated imaging in order to select specific fluorescent molecules or molecular interactions
Taylor Time-gated imaging in order to select specific fluorescent molecules or molecular interactions
Principles of optical clinical chemistry based on measuring the changes of fluorescence intensity, wave
Taylor Principles of optical clinical chemistry based on measuring the changes of fluorescence intensity, wave& Principles of optical clinical chemistry based on measuring the changes of fluorescence intensity, wave& Principles of optical clinical chemistry based on measuring the changes of fluorescence intensity, wavelength, polarization anisotropy, and lifetime are described by Lakowicz.
& length, polarization anisotropy, and lifetime are described by Lakowicz.17& 17 Various fl orescence tech& Various fl orescence techFrancis
Various fl orescence techFrancis
Various fl orescence techniques of selective oxygen sensing and blood glucose and blood gases detection are available.Francis
niques of selective oxygen sensing and blood glucose and blood gases detection are available.FrancisA new direction in laser spectroscopy of biological objects is associated with multiphoton (two-, three-
FrancisA new direction in laser spectroscopy of biological objects is associated with multiphoton (two-, three-photon) fluorescence scanning microscopy, which makes it possible to image functional states of an object
Francisphoton) fluorescence scanning microscopy, which makes it possible to image functional states of an object
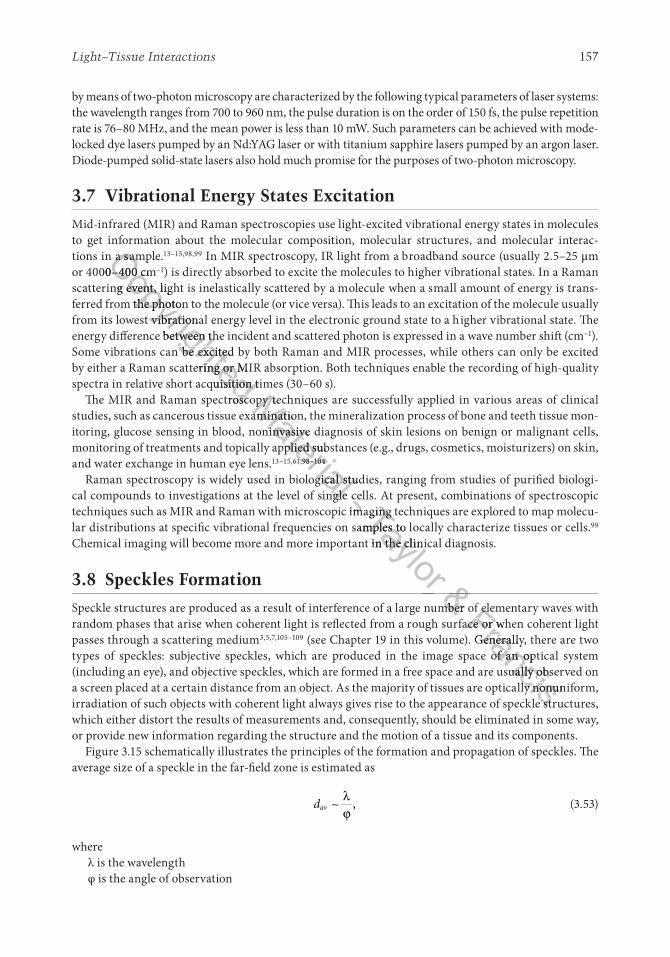
Light–Tissue Interactions 157
by means of two-photon microscopy are characterized by the following typical parameters of laser systems: the wavelength ranges from 700 to 960 nm, the pulse duration is on the order of 150 fs, the pulse repetition rate is 76–80 MHz, and the mean power is less than 10 mW. Such parameters can be achieved with mode-locked dye lasers pumped by an Nd:YAG laser or with titanium sapphire lasers pumped by an argon laser. Diode-pumped solid-state lasers also hold much promise for the purposes of two-photon microscopy.
3.7 Vibrational Energy States Excitation
Mid-infrared (MIR) and Raman spectroscopies use light-excited vibrational energy states in molecules to get information about the molecular composition, molecular structures, and molecular interac-tions in a sample.13–15,98,99 In MIR spectroscopy, IR light from a broadband source (usually 2.5–25 μm or 4000–400 cm−1) is directly absorbed to excite the molecules to higher vibrational states. In a Raman scattering event, light is inelastically scattered by a molecule when a small amount of energy is trans-ferred from the photon to the molecule (or vice versa). This leads to an excitation of the molecule usually from its lowest vibrational energy level in the electronic ground state to a higher vibrational state. The energy difference between the incident and scattered photon is expressed in a wave number shift (cm−1). Some vibrations can be excited by both Raman and MIR processes, while others can only be excited by either a Raman scattering or MIR absorption. Both techniques enable the recording of high-quality spectra in relative short acquisition times (30–60 s).
The MIR and Raman spectroscopy techniques are successfully applied in various areas of clinical studies, such as cancerous tissue examination, the mineralization process of bone and teeth tissue mon-itoring, glucose sensing in blood, noninvasive diagnosis of skin lesions on benign or malignant cells, monitoring of treatments and topically applied substances (e.g., drugs, cosmetics, moisturizers) on skin, and water exchange in human eye lens.13–15,61,98–104
Raman spectroscopy is widely used in biological studies, ranging from studies of purified biologi-cal compounds to investigations at the level of single cells. At present, combinations of spectroscopic techniques such as MIR and Raman with microscopic imaging techniques are explored to map molecu-lar distributions at specific vibrational frequencies on samples to locally characterize tissues or cells.99
Chemical imaging will become more and more important in the clinical diagnosis.
3.8 Speckles Formation
Speckle structures are produced as a result of interference of a large number of elementary waves with random phases that arise when coherent light is reflected from a rough surface or when coherent light passes through a scattering medium3,5,7,105–109 (see Chapter 19 in this volume). Generally, there are two types of speckles: subjective speckles, which are produced in the image space of an optical system (including an eye), and objective speckles, which are formed in a free space and are usually observed on a screen placed at a certain distance from an object. As the majority of tissues are optically nonuniform, irradiation of such objects with coherent light always gives rise to the appearance of speckle structures, which either distort the results of measurements and, consequently, should be eliminated in some way, or provide new information regarding the structure and the motion of a tissue and its components.
Figure 3.15 schematically illustrates the principles of the formation and propagation of speckles. The average size of a speckle in the far-field zone is estimated as
dav ~ ,λϕ
(3.53)
whereλ is the wavelengthφ is the angle of observation
Copyrighted
tions in a sample.Copyrighted
tions in a sample.or 4000–400 cm
Copyrighted
or 4000–400 cmscattering event, light is inelastically scattered by a molecule when a small amount of energy is trans
Copyrighted
scattering event, light is inelastically scattered by a molecule when a small amount of energy is transferred from the photon to the molecule (or vice versa). This leads to an excitation of the molecule usually
Copyrighted
ferred from the photon to the molecule (or vice versa). This leads to an excitation of the molecule usually from its lowest vibrational energy level in the electronic ground state to a higher vibrational state. The
Copyrighted
from its lowest vibrational energy level in the electronic ground state to a higher vibrational state. The energy difference between the incident and scattered photon is expressed in a wave number shift (cm
Copyrighted
energy difference between the incident and scattered photon is expressed in a wave number shift (cmSome vibrations can be excited by both Raman and MIR processes, while others can only be excited
Copyrighted Some vibrations can be excited by both Raman and MIR processes, while others can only be excited by either a Raman scattering or MIR absorption. Both techniques enable the recording of high-quality
Copyrighted by either a Raman scattering or MIR absorption. Both techniques enable the recording of high-quality spectra in relative short acquisition times (30–60 s).
Copyrighted spectra in relative short acquisition times (30–60 s).The MIR and Raman spectroscopy techniques are successfully applied in various areas of clinical
Copyrighted The MIR and Raman spectroscopy techniques are successfully applied in various areas of clinical Material
The MIR and Raman spectroscopy techniques are successfully applied in various areas of clinical Material
The MIR and Raman spectroscopy techniques are successfully applied in various areas of clinical studies, such as cancerous tissue examination, the mineralization process of bone and teeth tissue mon
Material
studies, such as cancerous tissue examination, the mineralization process of bone and teeth tissue monitoring, glucose sensing in blood, noninvasive diagnosis of skin lesions on benign or malignant cells,
Material
itoring, glucose sensing in blood, noninvasive diagnosis of skin lesions on benign or malignant cells, monitoring of treatments and topically applied substances (e.g., drugs, cosmetics, moisturizers) on skin,
Material monitoring of treatments and topically applied substances (e.g., drugs, cosmetics, moisturizers) on skin,
13–15,61,98–104
Material 13–15,61,98–104
Raman spectroscopy is widely used in biological studies, ranging from studies of purified biologi
Material Raman spectroscopy is widely used in biological studies, ranging from studies of purified biological compounds to investigations at the level of single cells. At present, combinations of spectroscopic
Material cal compounds to investigations at the level of single cells. At present, combinations of spectroscopic - cal compounds to investigations at the level of single cells. At present, combinations of spectroscopic - cal compounds to investigations at the level of single cells. At present, combinations of spectroscopic techniques such as MIR and Raman with microscopic imaging techniques are explored to map molecu- techniques such as MIR and Raman with microscopic imaging techniques are explored to map molecuTaylor
Taylor
techniques such as MIR and Raman with microscopic imaging techniques are explored to map molecuTaylor
techniques such as MIR and Raman with microscopic imaging techniques are explored to map molecular distributions at specific vibrational frequencies on samples to locally characterize tissues or cells.
Taylor
lar distributions at specific vibrational frequencies on samples to locally characterize tissues or cells.Chemical imaging will become more and more important in the clinical diagnosis.
Taylor Chemical imaging will become more and more important in the clinical diagnosis.
& & & Speckle structures are produced as a result of interference of a large number of elementary waves with & Speckle structures are produced as a result of interference of a large number of elementary waves with Francis
Speckle structures are produced as a result of interference of a large number of elementary waves with Francis
Speckle structures are produced as a result of interference of a large number of elementary waves with random phases that arise when coherent light is reflected from a rough surface or when coherent light Francis
random phases that arise when coherent light is reflected from a rough surface or when coherent light (see Chapter 19 in this volume). Generally, there are two
Francis (see Chapter 19 in this volume). Generally, there are two
types of speckles: subjective speckles, which are produced in the image space of an optical system
Francistypes of speckles: subjective speckles, which are produced in the image space of an optical system
Francis(including an eye), and objective speckles, which are formed in a free space and are usually observed on
Francis(including an eye), and objective speckles, which are formed in a free space and are usually observed on a screen placed at a certain distance from an object. As the majority of tissues are optically nonuniform,
Francisa screen placed at a certain distance from an object. As the majority of tissues are optically nonuniform, irradiation of such objects with coherent light always gives rise to the appearance of speckle structures,
Francisirradiation of such objects with coherent light always gives rise to the appearance of speckle structures,
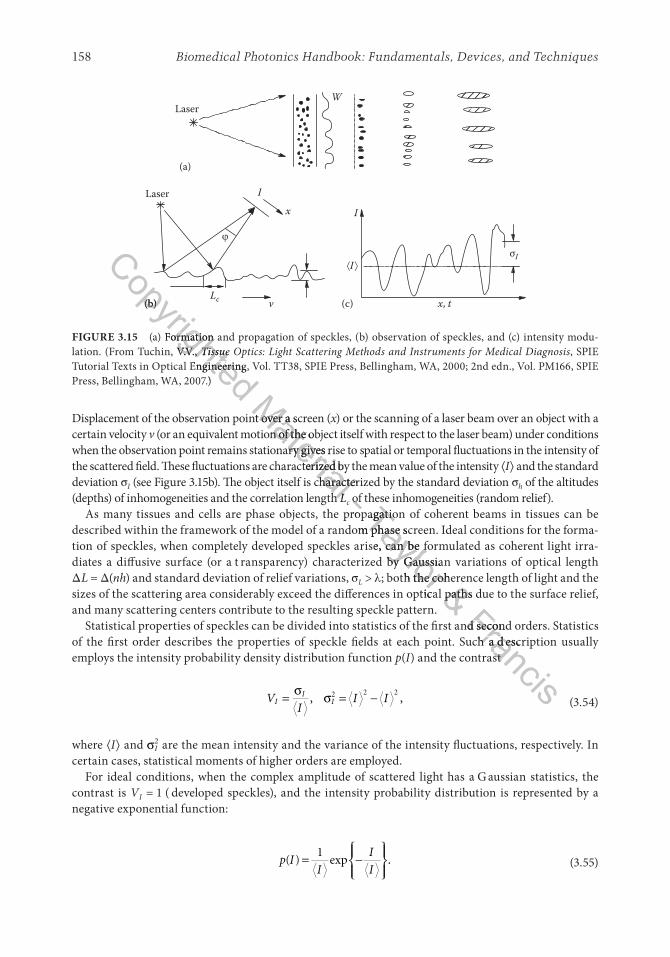
Biomedical Photonics Handbook: Fundamentals, Devices, and Techniques158
Displacement of the observation point over a screen (x) or the scanning of a laser beam over an object with a certain velocity v (or an equivalent motion of the object itself with respect to the laser beam) under conditions when the observation point remains stationary gives rise to spatial or temporal fluctuations in the intensity of the scattered field. These fluctuations are characterized by the mean value of the intensity ⟨I⟩ and the standard deviation σI (see Figure 3.15b). The object itself is characterized by the standard deviation σh of the altitudes (depths) of inhomogeneities and the correlation length Lc of these inhomogeneities (random relief).
As many tissues and cells are phase objects, the propagation of coherent beams in tissues can be described within the framework of the model of a random phase screen. Ideal conditions for the forma-tion of speckles, when completely developed speckles arise, can be formulated as coherent light irra-diates a diffusive surface (or a t ransparency) characterized by Gaussian variations of optical length ΔL = Δ(nh) and standard deviation of relief variations, σL > λ; both the coherence length of light and the sizes of the scattering area considerably exceed the differences in optical paths due to the surface relief, and many scattering centers contribute to the resulting speckle pattern.
Statistical properties of speckles can be divided into statistics of the first and second orders. Statistics of the first order describes the properties of speckle fields at each point. Such a d escription usually employs the intensity probability density distribution function p(I) and the contrast
VI
I III
I= =σ σ −, ,2 2 2
(3.54)
where ⟨I⟩ and σI2 are the mean intensity and the variance of the intensity fluctuations, respectively. In
certain cases, statistical moments of higher orders are employed.For ideal conditions, when the complex amplitude of scattered light has a G aussian statistics, the
contrast is VI = 1 ( developed speckles), and the intensity probability distribution is represented by a negative exponential function:
p II
I
I( ) exp .=
1 − (3.55)
W
(a)
Laser
I
x
Lc v(b)
Laser
(c)
I
x, t
IσI
FIGURE 3.15 (a) Formation and propagation of speckles, (b) observation of speckles, and (c) intensity modu-lation. (From Tuchin, V.V., Tissue Optics: Light Scattering Methods and Instruments for Medical Diagnosis, SPIE Tutorial Texts in Optical Engineering, Vol. TT38, SPIE Press, Bellingham, WA, 2000; 2nd edn., Vol. PM166, SPIE Press, Bellingham, WA, 2007.)
Copyrighted
(b)
Copyrighted
(b)
(a) Formation and propagation of speckles, (b) observation of speckles, and (c) intensity modu
Copyrighted
(a) Formation and propagation of speckles, (b) observation of speckles, and (c) intensity modulation. (From Tuchin, V.V.,
Copyrighted lation. (From Tuchin, V.V., Tissue Optics: Light Scattering Methods and Instruments for Medical Diagnosis
Copyrighted Tissue Optics: Light Scattering Methods and Instruments for Medical Diagnosis
Tutorial Texts in Optical Engineering, Vol. TT38, SPIE Press, Bellingham, WA, 2000; 2nd edn., Vol. PM166, SPIE
Copyrighted Tutorial Texts in Optical Engineering, Vol. TT38, SPIE Press, Bellingham, WA, 2000; 2nd edn., Vol. PM166, SPIE Press, Bellingham, WA, 2007.)
Copyrighted Press, Bellingham, WA, 2007.)
Material
Displacement of the observation point over a screen (Material
Displacement of the observation point over a screen ((or an equivalent motion of the object itself with respect to the laser beam) under conditions
Material
(or an equivalent motion of the object itself with respect to the laser beam) under conditions when the observation point remains stationary gives rise to spatial or temporal fluctuations in the intensity of
Material when the observation point remains stationary gives rise to spatial or temporal fluctuations in the intensity of the scattered field. These fluctuations are characterized by the mean value of the intensity
Material the scattered field. These fluctuations are characterized by the mean value of the intensity
(see Figure 3.15b). The object itself is characterized by the standard deviation
Material (see Figure 3.15b). The object itself is characterized by the standard deviation (depths) of inhomogeneities and the correlation length
Material (depths) of inhomogeneities and the correlation length L
Material L- of these inhomogeneities (random relief).- of these inhomogeneities (random relief).As many tissues and cells are phase objects, the propagation of coherent beams in tissues can be
- As many tissues and cells are phase objects, the propagation of coherent beams in tissues can be Taylor
As many tissues and cells are phase objects, the propagation of coherent beams in tissues can be Taylor
As many tissues and cells are phase objects, the propagation of coherent beams in tissues can be described within the framework of the model of a random phase screen. Ideal conditions for the forma
Taylor described within the framework of the model of a random phase screen. Ideal conditions for the formation of speckles, when completely developed speckles arise, can be formulated as coherent light irra
Taylor tion of speckles, when completely developed speckles arise, can be formulated as coherent light irradiates a diffusive surface (or a t ransparency) characterized by Gaussian variations of optical length
Taylor diates a diffusive surface (or a t ransparency) characterized by Gaussian variations of optical length
; both the coherence length of light and the
Taylor ; both the coherence length of light and the sizes of the scattering area considerably exceed the differences in optical paths due to the surface relief,
Taylor sizes of the scattering area considerably exceed the differences in optical paths due to the surface relief, & ; both the coherence length of light and the & ; both the coherence length of light and the
sizes of the scattering area considerably exceed the differences in optical paths due to the surface relief, & sizes of the scattering area considerably exceed the differences in optical paths due to the surface relief,
Francis
Statistical properties of speckles can be divided into statistics of the first and second orders. Statistics Francis
Statistical properties of speckles can be divided into statistics of the first and second orders. Statistics Francisof the first order describes the properties of speckle fields at each point. Such a d escription usually
Francisof the first order describes the properties of speckle fields at each point. Such a d escription usually
) and the contrast
Francis) and the contrast
Light–Tissue Interactions 159
Thus, the most probable intensity value in the corresponding speckle pattern is equal to zero; that is, destructive interference occurs with the highest probability.
Partially developed speckle fields are characterized by a contrast VI < 1. The contrast may be lower due to a uniform coherent or incoherent background added to the speckle field.
For phase objects with σφ2 1 and a small number of scatterers, N = w/Lϕ, contributing to the field at
a certain point on the observation plane, the contrast of the speckle pattern is greater than unity. The statistics of the speckle field in this case is non-Gaussian and nonuniform (i.e., the statistic parameters depend on the observation angle).
The specific features of the diffraction of focused laser beams from moving phase screens underlie speckle methods of structure diagnostics and monitoring of motion parameters of tissue, blood, and lymph flows.
Statistics of the second order shows how fast the intensity changes from point to p oint in the speckle pattern, that is, characterizes the size and the distribution of speckle sizes in the pattern. Statistics of the second order is usually described in terms of the autocorrelation function of intensity fl ctuations,
g I I2( ) ( ) ( ) ,∆ξ ξ ∆ξ ξ= + (3.56)
and its Fourier transform, representing the power spectrum of a random process; ξ ≡ x or t is the spatial or temporal variable; Δξ is the change in variable. Angular brackets ⟨⟩ in Equation 3.56 stand for the averaging over an ensemble or the time.
In the elementary case when reflected light in developed speckle structures retains linear polariza-tion, intensity distribution at the output of a dual-beam interferometer can be written as5
I r t I r I r I r I r t r rr s r s I I( , ) ( ) ( ) ( ) ( ) ( ) cos ( ) ( )/= + + [ ] +2
1 211γ ∆ ∆Φ ∆Ψ ++ ∆ΦI t( ) , (3.57)
whereIr(r) and Is(r) are intensity distributions of the reference and signal fields, respectivelyr is the transverse spatial coordinateγ11(Δt) is the degree of temporal coherence of light∆ΨI r( ) is the deterministic phase difference of the interfering waves∆Φ Φ − ΦI Ir Isr r r( ) ( ) ( )= is the random phase difference∆ΦI t( ) is the time-dependent phase difference related to the motion of an object
In the absence of speckle modulation, the deterministic phase difference ∆ΨI r( ) governs the formation of regular interference fringes. On the average, the output signal of a speckle interferometer reaches its maximum when the interfering fields are phase-matched (∆ΨI r( ) = const. within the aperture of the detector), focused laser beams are used (speckles with maximum sizes are produced), and a detector with a maximum area is employed.
3.9 Dynamic Light Scattering
3.9.1 Quasi-Elastic Light Scattering
QELS spectroscopy, photon-correlation spectroscopy, spectroscopy of intensity fluctuations, and Doppler spectroscopy are synonymous terms related to the dynamic scattering of light, which under-lies a noninvasive method for studying the dynamics of particles on a comparatively large time scale.5
Copyrighted
lymph flows.Copyrighted
lymph flows.Statistics of the second order shows how fast the intensity changes from point to p oint in the
Copyrighted
Statistics of the second order shows how fast the intensity changes from point to p oint in the speckle pattern, that is, characterizes the size and the distribution of speckle sizes in the pattern.
Copyrighted
speckle pattern, that is, characterizes the size and the distribution of speckle sizes in the pattern. Statistics of the second order is usually described in terms of the autocorrelation function of intensity
Copyrighted
Statistics of the second order is usually described in terms of the autocorrelation function of intensity
and its Fourier transform, representing the power spectrum of a random process;
Copyrighted and its Fourier transform, representing the power spectrum of a random process; Material
and its Fourier transform, representing the power spectrum of a random process; Material
and its Fourier transform, representing the power spectrum of a random process; is the change in variable. Angular brackets
Material
is the change in variable. Angular brackets averaging over an ensemble or the time.
Material averaging over an ensemble or the time.
In the elementary case when reflected light in developed speckle structures retains linear polariza
Material In the elementary case when reflected light in developed speckle structures retains linear polariza
tion, intensity distribution at the output of a dual-beam interferometer can be written as
Material tion, intensity distribution at the output of a dual-beam interferometer can be written as
- - r t- r t) c- ) c) c- ) cγ ∆- γ ∆r tγ ∆r t- r tγ ∆r t Taylor
) cTaylor
) cosTaylor
osTaylor
Taylor
∆Φ ∆Ψ ∆Φ ∆ΨTaylor
∆Φ ∆Ψ ∆Φ ∆Ψ
) are intensity distributions of the reference and signal fields, respectively
Taylor ) are intensity distributions of the reference and signal fields, respectively& Francis is the time-dependent phase difference related to the motion of an object
Francis is the time-dependent phase difference related to the motion of an object
Francis governs the formation
Francis governs the formation of regular interference fringes. On the average, the output signal of a speckle interferometer reaches its
Francisof regular interference fringes. On the average, the output signal of a speckle interferometer reaches its
Biomedical Photonics Handbook: Fundamentals, Devices, and Techniques160
The implementation of the single-scattering mode and the use of coherent light sources are of funda-mental importance in this case. The spatial scale of testing of a colloid structure (an ensemble of biologi-cal particles) is determined by the inverse of the wave vector s
−1:
sn=
4
20
πλ
θsin , (3.58)
wheren is the refractive indexθ is the angle of scattering
With an allowance for self-beating due to the photomixing of the electric components of the scattered field, the intensity autocorrelation function (AF) can be measured: g I t I t2( ) ( ) ( )τ τ= ⟨ + ⟩. For Gaussian statistics, this AF is related to the first-order AF by the Siegert formula:
g A gsb2 12
1( ) ( ) ,τ β τ= +
(3.59)
whereτ is the delay timeA = ⟨i2⟩ is the square of the mean value of the photocurrent, or the base line of the AFβsb is the parameter of self-beating efficiency, βsb ≈ 1g T1( ) exp( )τ −Γ τ= is the normalized AF of the optical field for a monodisperse system of Brownian
particlesΓT Ts D= 2 is the relaxation parameterDT = kBT/6πηrh is the coefficient of translation diffusionkB is the Boltzmann constantT is the absolute temperatureη is the absolute viscosity of the mediumrh is the hydrodynamic radius of a particle
Many biological systems are characterized by a bimodal distribution of diffusion coefficients, when fast diffusion (DTf) can be separated from slow diffusion (DTs) related to the aggregation of particles. The goal of QELS spectroscopy is to reconstruct the distribution of scattering particles according to size, which is necessary for the diagnosis or monitoring of a disease.
The description of the principles and characteristics of the homodyne and heterodyne photon-cor-relation spectrometers, the so-called laser Doppler anemometers (LDAs), differential LDA schemes, laser Doppler microscopes, laser scanning and speckle CMOS-based full-field imagers, and review of medical applications, mainly the investigation of eye tissues (cataract diagnosis), investigation of hemodynamics of individual vessels (vessels of eye fundus or any other vessels) with the use of fiber-optic catheters, and mapping of blood microcirculation in tissues, is given by Tuchin5,7 and Priezzhev and coworkers.10,105–109
3.9.2 Diffusion-Wave Spectroscopy
DWS is a new class of technique in the field of dynamic light scattering related to the investigation of the dynamics of particles within very short time intervals.5,7,9,110–113 A fundamental diffe ence of
Copyrighted
is the angle of scatteringCopyrighted
is the angle of scattering
With an allowance for self-beating due to the photomixing of the electric components of the scattered
Copyrighted
With an allowance for self-beating due to the photomixing of the electric components of the scattered field, the intensity autocorrelation function (AF) can be measured:
Copyrighted
field, the intensity autocorrelation function (AF) can be measured: statistics, this AF is related to the first-order AF by the Siegert formula:
Copyrighted
statistics, this AF is related to the first-order AF by the Siegert formula:
Material is the square of the mean value of the photocurrent, or the base line of the AF
Material is the square of the mean value of the photocurrent, or the base line of the AF
is the parameter of self-beating efficiency,
Material is the parameter of self-beating efficiency, β
Material βsb
Material sb
Material is the normalized AF of the optical field for a monodisperse system of Brownian
Material is the normalized AF of the optical field for a monodisperse system of Brownian
- is the coefficient of translation diffusion
- is the coefficient of translation diffusionTaylor
is the coefficient of translation diffusionTaylor
is the coefficient of translation diffusion
& Many biological systems are characterized by a bimodal distribution of diffusion coefficients, when fast & Many biological systems are characterized by a bimodal distribution of diffusion coefficients, when fast Francis
Many biological systems are characterized by a bimodal distribution of diffusion coefficients, when fast Francis
Many biological systems are characterized by a bimodal distribution of diffusion coefficients, when fast ) related to the aggregation of particles. The goal
Francis) related to the aggregation of particles. The goal
Francisof QELS spectroscopy is to reconstruct the distribution of scattering particles according to size, which
Francisof QELS spectroscopy is to reconstruct the distribution of scattering particles according to size, which
The description of the principles and characteristics of the homodyne and heterodyne photon-cor
FrancisThe description of the principles and characteristics of the homodyne and heterodyne photon-cor
Francisrelation spectrometers, the so-called laser Doppler anemometers (LDAs), differential LDA schemes,
Francisrelation spectrometers, the so-called laser Doppler anemometers (LDAs), differential LDA schemes,
Light–Tissue Interactions 161
this method from QELS is that it is applicable in the case of dense media with multiple scattering, which is critical for tissues. In contrast to the case of single scattering, the AF of the field g1( )τ is sensitive to the motion of a particle on the length scale on the order of λ −[ ] /L ltr/ 1 2, which is generally much smaller than λ, because L > ltr (L is the total mean photon path length and ltr is the transport length of a photon, ltr ≈ 1/ ′µs). Thus, DWS AFs decay much faster than AFs employed in QELS. In recent years, DWS has come into use as a more accurate term—diffusion-correlation spectroscopy (DCS).113
Experimental implementation of DWS is very simple.5,7,9,110–113 A measuring system provides irradiation of an object under study by a CW laser beam and the intensity f luctuations of the scat-tered radiation within a single speckle are measured with the use of a single-mode receiving fiber, photomultiplier, photon-counting system, and a fast digital correlator working in a nanosecond range. The possibilities of the DWS technique for medical applications have been demonstrated for blood f low monitoring in the human forearm. The AF slope is the indicative parameter for the determination of the blood f low velocity. The normalized AF of field f luctuations can be rep-resented in terms of two components related to t he Brownian and directed motion of scatterers (erythrocytes):
gL
lB s tr1 1 1
2
2( ) exp ,τ − ττ
ττ− −≈ +
(3.60)
whereτ Γ−
B T Ts D1 2≡ =
τ−S V trG s l1 0 18≅ . characterizes the directed flow
GV is the gradient of the flow rate
This enables the expression of the slope of the AF in terms of the diffusion coefficient (characterizes blood microcirculation) and the gradient of the directed velocity of blood. The correlation function can be modified to account for other dynamic processes in addition to random and shear flow, such as turbulence.
3.10 Conclusion
This brief review on tissue optics provides information on physical optics as well as approaches in atomic and thermal physics that may be applicable to a number of different phenomena that involve light inter-action with tissues. A more comprehensive and complete description of tissue optics and light/laser– tissue interactions can be found elsewhere.2,5–7,9,20–22,47,58,61,78,114–134
Acknowledgments
The author is thankful for the support of grants 224014 PHOTONICS4LIFE of FP7-ICT-2007-2; Russian Presidential 703.2014.2; the Government of the Russian Federation to s upport scientific research projects implemented under the supervision of leading scientists 14.Z50.31.0004; FiDiPro, TEKES Program (40111/11), Finland; SCOPES EC, Uzb/Switz/RF, Swiss NSF, IZ74ZO_137423/1; and 13-02-91176-NSFC_a of RFBR.
Copyrighted
photomultiplier, photon-counting system, and a fast digital correlator working in a nanosecond Copyrighted
photomultiplier, photon-counting system, and a fast digital correlator working in a nanosecond range. The possibilities of the DWS technique for medical applications have been demonstrated
Copyrighted
range. The possibilities of the DWS technique for medical applications have been demonstrated for blood f low monitoring in the human forearm. The AF slope is the indicative parameter for
Copyrighted
for blood f low monitoring in the human forearm. The AF slope is the indicative parameter for the determination of the blood f low velocity. The normalized AF of field f luctuations can be rep
Copyrighted
the determination of the blood f low velocity. The normalized AF of field f luctuations can be represented in terms of two components related to t he Brownian and directed motion of scatterers
Copyrighted
resented in terms of two components related to t he Brownian and directed motion of scatterers
g
Copyrighted gMaterial
( )Material
( )τ −Material
τ −( )τ −( )Material
( )τ −( )τ −≈ +τ −Material
τ −≈ +τ −
- Taylor This enables the expression of the slope of the AF in terms of the diffusion coefficient (characterizes
Taylor This enables the expression of the slope of the AF in terms of the diffusion coefficient (characterizes blood microcirculation) and the gradient of the directed velocity of blood. The correlation function
Taylor blood microcirculation) and the gradient of the directed velocity of blood. The correlation function can be modified to account for other dynamic processes in addition to random and shear flow, such as
Taylor can be modified to account for other dynamic processes in addition to random and shear flow, such as & can be modified to account for other dynamic processes in addition to random and shear flow, such as & can be modified to account for other dynamic processes in addition to random and shear flow, such as
Francis
Francis
FrancisThis brief review on tissue optics provides information on physical optics as well as approaches in atomic
FrancisThis brief review on tissue optics provides information on physical optics as well as approaches in atomic and thermal physics that may be applicable to a number of different phenomena that involve light inter
Francisand thermal physics that may be applicable to a number of different phenomena that involve light interaction with tissues. A more comprehensive and complete description of tissue optics and light/laser–
Francisaction with tissues. A more comprehensive and complete description of tissue optics and light/laser–
Biomedical Photonics Handbook: Fundamentals, Devices, and Techniques162
References
1. Chance B., Optical method, Annu. Rev. Biophys. Biophys. Chem. 20, 1–28, 1991.2. Müller G., Chance B., Alfano R. et al., eds., Medical Optical Tomography: Functional Imaging and
Monitoring, Vol. IS11, SPIE Press, Bellingham, WA, 1993.3. Tuchin V.V., ed., Selected Papers on Tissue Optics Applications in Medical Diagnostics and Therapy,
Vol. MS102, SPIE Press, Bellingham, WA, 1994.4. Minet O., Müller G., and Beuthan J., eds., Selected Papers on Optical Tomography, Fundamentals and
Applications in Medicine, Vol. MS 147, SPIE Press, Bellingham, WA, 1998.5. Tuchin V.V., Tissue Optics: Light Scattering Methods and Instruments for Medical Diagnosis, SPIE
Tutorial Texts in Optical Engineering, Vol. TT38, SPIE Press, Bellingham, WA, 2000; 2nd edn., Vol. PM166, SPIE Press, Bellingham, WA, 2007.
6. Wang L.V. and Wu H.-I., Biomedical Optics: Principles and Imaging, Wiley-Intersience, Hoboken, NJ, 2007.
7. Tuchin V.V., ed., Handbook of Optical Biomedical Diagnostics, Vol. PM107, SPIE Press, Bellingham, WA, 2002.
8. Fercher A.F., Drexler W., Hitzenberger C.K., a nd Lasser T., Optical coherence tomography—Principles and applications, Rep. Prog. Phys. 66, 239–303, 2003.
9. Tuchin V.V., ed., Coherent-Domain Optical Methods: Biomedical Diagnostics, Environmental Monitoring and Material Science, 2nd edn., Vols. 1 a nd 2, S pringer-Verlag, Berlin, Germany, 2013.
10. Priezzhev A.V. and Asakura T., eds., Special section on optical diagnostics of biological fluids, J. Biomed. Opt. 4, 35–93, 1999.
11. Tuchin V.V., Podbielska H., and Hitzenberger C.K., eds., Special section on coherence domain opti-cal methods in biomedical science and clinics, J. Biomed. Opt. 4, 94–190, 1999.
12. Katzir A., Lasers and Optical Fibers in Medicine, Academic Press, San Diego, CA, 1993.13. Ozaki Y., Medical application of Raman spectroscopy, Appl. Spectrosc. Rev. 24, 259–312, 1988.14. Mahadevan-Jansen A. and Richards-Kortum R., Raman spectroscopy for detection of cancers and
precancers, J. Biomed. Opt. 1, 31–70, 1996.15. Morris M.D., ed., Special section on biomedical applications of vibrational spectroscopic imaging,
J. Biomed. Opt. 4, 6–34, 1999.16. Das B.B., Liu F., and Alfano R.R., Time-resolved fluorescence and photon migration studies in bio-
medical and random media, Rep. Prog. Phys. 60, 227–292, 1997.17. Lakowicz J.R., Principles of Fluorescence Spectroscopy, 2nd edn., Kluwer Academic Publishers, New
York, 1999.18. Denk W., Two–photon excitation in functional biological imaging, J. Biomed. Opt. 1, 296–304, 1996.19. Braslavsky S.E. and Heihoff K., Photothermal methods, in Handbook of Organic Photochemistry,
Scaiano J.C., ed., CRC Press, Boca Raton, FL, 1989, pp. 327–355.20. Müller G. and Roggan A., eds., Laser-Induced Interstitial Thermotherapy, SPIE Press, Bellingham,
WA, 1995.21. Welch A.J. and van Gemert M.J.C., eds., Optical-Thermal Response of Laser-Irradiated Tissue,
2nd edn., Springer, New York, 2011.22. Niemz M.H., Laser-Tissue Interactions: Fundamentals and Applications, 3rd edn., Springer-Verlag,
Berlin, Germany, 2007.23. Jacques S.L., e d., Laser-Tissue Interaction: Photochemical, Photothermal, Photomechanical I–XIII,
SPIE Proceedings, Annual collection of SPIE papers, SPIE Press, Bellingham, WA, 1990–2002.24. Vij D.R. and Mahesh K., eds., Lasers in Medicine, Kluwer, Boston, MA, 2002.25. Jacques S.L., Strength and weaknesses of various optical imaging techniques, Proc. SPIE 4707, 474–
488, 2002.
Copyrighted
Tutorial Texts in Optical Engineering, Vol. TT38, SPIE Press, Bellingham, WA, 2000; 2nd edn., Vol. Copyrighted
Tutorial Texts in Optical Engineering, Vol. TT38, SPIE Press, Bellingham, WA, 2000; 2nd edn., Vol. PM166, SPIE Press, Bellingham, WA, 2007.Copyrighted
PM166, SPIE Press, Bellingham, WA, 2007.W
Copyrighted
Wang L.V. and Wu H.-I.,
Copyrighted
ang L.V. and Wu H.-I.,Wang L.V. and Wu H.-I.,W
Copyrighted
Wang L.V. and Wu H.-I.,WNJ, 2007.
Copyrighted
NJ, 2007.uchin V.V., ed.,
Copyrighted
uchin V.V., ed., Handbook of
Copyrighted
Handbook of
ercher A.F., Drexler W., Hitzenberger C.K., a nd Lasser T., Optical coherence tomography—
Copyrighted ercher A.F., Drexler W., Hitzenberger C.K., a nd Lasser T., Optical coherence tomography—
Principles and applications,
Copyrighted Principles and applications, Rep. Prog. Phys
Copyrighted Rep. Prog. Phys
Coherent-Domain Optical Methods: Biomedical Diagnostics, Environmental
Copyrighted Coherent-Domain Optical Methods: Biomedical Diagnostics, Environmental Monitoring and Material Science
Copyrighted Monitoring and Material ScienceMaterial
Monitoring and Material ScienceMaterial
Monitoring and Material Science, 2nd edn., Vols. 1 a nd 2, S pringer-Verlag, Berlin, Germany, Material
, 2nd edn., Vols. 1 a nd 2, S pringer-Verlag, Berlin, Germany,
riezzhev A.V. and Asakura T., eds., Special section on optical diagnostics of biological fluids,
Material
riezzhev A.V. and Asakura T., eds., Special section on optical diagnostics of biological fluids,
uchin V.V., Podbielska H., and Hitzenberger C.K., eds., Special section on coherence domain opti
Material uchin V.V., Podbielska H., and Hitzenberger C.K., eds., Special section on coherence domain opti
cal methods in biomedical science and clinics,
Material cal methods in biomedical science and clinics, J. Biomed. Opt
Material J. Biomed. OptLasers and Optical Fibers in Medicine
Material Lasers and Optical Fibers in Medicine, Academic Press, San Diego, CA, 1993.
Material , Academic Press, San Diego, CA, 1993.- , Academic Press, San Diego, CA, 1993.- , Academic Press, San Diego, CA, 1993.zaki Y., Medical application of Raman spectroscopy, - zaki Y., Medical application of Raman spectroscopy, Taylor
zaki Y., Medical application of Raman spectroscopy, Taylor
zaki Y., Medical application of Raman spectroscopy, Appl. Spectrosc. Rev.Taylor
Appl. Spectrosc. Rev.ahadevan-Jansen A. and Richards-Kortum R., Raman spectroscopy for detection of cancers and Taylor
ahadevan-Jansen A. and Richards-Kortum R., Raman spectroscopy for detection of cancers and
orris M.D., ed., Special section on biomedical applications of vibrational spectroscopic imaging,
Taylor orris M.D., ed., Special section on biomedical applications of vibrational spectroscopic imaging,
as B.B., Liu F., and Alfano R.R., Time-resolved fluorescence and photon migration studies in bio
Taylor as B.B., Liu F., and Alfano R.R., Time-resolved fluorescence and photon migration studies in bio& as B.B., Liu F., and Alfano R.R., Time-resolved fluorescence and photon migration studies in bio& as B.B., Liu F., and Alfano R.R., Time-resolved fluorescence and photon migration studies in bio
, 2nd edn., Kluwer Academic Publishers, New
& , 2nd edn., Kluwer Academic Publishers, New Francis
, 2nd edn., Kluwer Academic Publishers, New Francis
, 2nd edn., Kluwer Academic Publishers, New
J. Biomed. Opt
FrancisJ. Biomed. Opt.
Francis. 1
Francis1
Francis, 296–304, 1996.
Francis, 296–304, 1996.
Handbook of Organic Photochemistry
FrancisHandbook of Organic Photochemistry
, SPIE Press, Bellingham,
Francis, SPIE Press, Bellingham,
Light–Tissue Interactions 163
26. Marks F.A., Optical determination of the hemoglobin oxygenation state of breast biopsies and human breast cancer xenografts in ude mice, Proc. SPIE 1641, 227–237, 1992.
27. Ishimaru A., Wave Propagation and Scattering in Random Media, Academic Press, New York, 1978.28. Van de Hulst H.C., Multiple Light Scattering, Vol. 1, Academic Press, New York, 1980.29. Van de Hulst H.C., Light Scattering by Small Particles, Dover, New York, 1981.30. Bohren C.F. and Huffman D.R., Absorption and Scattering of Light by Small Particles, Wiley, New York, 1983.31. Star W.M., Wilson B.C., and Patterson M.C., Light delivery and dosimetry in photodynamic therapy
of solid tumors, in Photodynamic Therapy: Basic Principles and Clinical Applications, Henderson B.W. and Dougherty T.J., eds., Marcel Dekker, New York, 1992, pp. 335–368.
32. Patterson M.S., Chance B., and Wilson B.C., Time resolved refl ctance and transmittance for the non-invasive measurement of tissue optical properties, Appl. Opt. 28, 2331–2336, 1989.
33. Jacques S.L., Time-resolved refl ctance spectroscopy in turbid tissues, IEEE Trans. Biomed. Eng. 36, 1155–1161, 1989.
34. Fishkin J.B. and Gratton E., Propagation of photon-density waves in strongly scattering media con-taining an absorbing semi-infin te plane bounded by a straight edge, J. Opt. Soc. Am. A 10, 127–140, 1993.
35. Chance B., Cope M., Gratton E., Ramanujam N., and Tromberg B., Phase measurement of light absorption and scatter in human tissue, Rev. Sci. Instrum. 698, 3457–3481, 1998.
36. Rinneberg H., Scattering of laser light in turbid media, optical tomography for medical diagnostics, in The Inverse Problem, Lübbig H., ed., Akademie Verlag, Berlin, Germany, 1995, pp. 107–141.
37. Schmitt J.M., Knüttel A., and Knutson J.R., Interference of diffusive light waves, J. Opt. Soc. Am. A 9, 1832–1843, 1992.
38. Salzmann G.C., S ingham S.B., Johnston R.G., and Bohren C.F., Light scattering and cytometry, in Flow Cytometry and Sorting, 2nd edn., Melamed M.R., Lindmo T., and Mendelsohn M.L., eds., Wiley-Liss Inc., New York, 1990, p. 81–107.
39. Svaasand L.O. and Gomer Ch.J., Optics of tissue, in Dosimetry of Laser Radiation in Medicine and Biology, Mueller G.V., Sliney D.H., eds., Vol. IS5, SPIE Press, Bellingham, WA, 1989, p. 114–132.
40. Bicout D., Brosseau C., Martinez A.S., and Schmitt J.M., Depolarization of multiply scattering waves by spherical diffusers: Influence of the size parameter, Phys. Rev. E 49, 1767–1770, 1994.
41. Racovic M.J., Kattavar G.W., Mehrubeoglu M., Cameron B.D., Wang L.V., Rasteger S., and Cote G.L., Light backscattering polarization patterns from turbid media: Theory and experiment, Appl. Opt. 38, 3399–3408, 1999.
42. Zege E.P., Ivanov A.P., and Katsev I.L., Image Transfer through a Scattering Medium, Springer-Verlag, New York, 1991.
43. Wang L.V., Coté G.L., and Jacques S.L., eds., Special section on tissue polarimetry, J. Biomed. Opt. 7(3), 278–397, 2002.
44. Mishchenko M.I., Hovenier J.W., and Travis L.D., eds., Light Scattering by Nonspherical Particles, Academic Press, San Diego, CA, 2000.
45. Mishchenko M.I., Travis L.D., and Lacis A.A., Scattering, Absorption, and Emission of Light by Small Particles, Cambridge University Press, Cambridge, U.K., 2002.
46. Mishchenko M.I., Travis L.D., and Lacis A.A., Multiple Scattering of Light by Particles: Radiative Transfer and Coherent Backscattering, Cambridge University Press, New York, 2006.
47. Tuchin V.V., Wang L.V., and Zimnyakov D.A., Optical Polarization in Biomedical Applications, Springer-Verlag, New York, 2006.
48. Bartel S. and Hielscher A.H., Monte Carlo simulations of the diffuse backscattering Mueller matrix for highly scattering media, Appl. Opt. 39, 2000, 1580–1588.
49. Tynes H.H., Kattawar G.W., Zege E.P., Katsev I.L., Prikhach A.S., and Chaikovskaya L.I., Monte Carlo and multicomponent approximation methods for vector radiative transfer by use of effective Mueller matrix calculations, Appl. Opt. 40(3), 400–412, 2001.
Copyrighted
non-invasive measurement of tissue optical properties, Copyrighted
non-invasive measurement of tissue optical properties, JCopyrighted
Jacques S.L., Time-resolved refl ctance spectroscopy in turbid tissues, Copyrighted
acques S.L., Time-resolved refl ctance spectroscopy in turbid tissues, 1155–1161, 1989.
Copyrighted
1155–1161, 1989.shkin J.B. and Gratton E., Propagation of photon-density waves in strongly scattering media con
Copyrighted
shkin J.B. and Gratton E., Propagation of photon-density waves in strongly scattering media containing an absorbing semi-infin te plane bounded by a straight edge,
Copyrighted
taining an absorbing semi-infin te plane bounded by a straight edge,
hance B., Cope M., Gratton E., Ramanujam N., and Tromberg B., Phase measurement of light
Copyrighted hance B., Cope M., Gratton E., Ramanujam N., and Tromberg B., Phase measurement of light
absorption and scatter in human tissue,
Copyrighted absorption and scatter in human tissue,
inneberg H., Scattering of laser light in turbid media, optical tomography for medical diagnostics,
Copyrighted inneberg H., Scattering of laser light in turbid media, optical tomography for medical diagnostics, , Lübbig H., ed., Akademie Verlag, Berlin, Germany, 1995, pp. 107–141.
Copyrighted , Lübbig H., ed., Akademie Verlag, Berlin, Germany, 1995, pp. 107–141.Material
, Lübbig H., ed., Akademie Verlag, Berlin, Germany, 1995, pp. 107–141.Material
, Lübbig H., ed., Akademie Verlag, Berlin, Germany, 1995, pp. 107–141.chmitt J.M., Knüttel A., and Knutson J.R., Interference of diffusive light waves,
Material
chmitt J.M., Knüttel A., and Knutson J.R., Interference of diffusive light waves,
lzmann G.C., S ingham S.B., Johnston R.G., and Bohren C.F., Light scattering and cytometry,
Material lzmann G.C., S ingham S.B., Johnston R.G., and Bohren C.F., Light scattering and cytometry,
, 2nd edn., Melamed M.R., Lindmo T., and Mendelsohn M.L., eds.,
Material , 2nd edn., Melamed M.R., Lindmo T., and Mendelsohn M.L., eds.,
Wiley-Liss Inc., New York, 1990, p. 81–107.
Material Wiley-Liss Inc., New York, 1990, p. 81–107.vaasand L.O. and Gomer Ch.J., Optics of tissue, in
Material vaasand L.O. and Gomer Ch.J., Optics of tissue, in - vaasand L.O. and Gomer Ch.J., Optics of tissue, in - vaasand L.O. and Gomer Ch.J., Optics of tissue, in , Mueller G.V., Sliney D.H., eds., Vol. IS5, SPIE Press, Bellingham, WA, 1989, p. 114–132.- , Mueller G.V., Sliney D.H., eds., Vol. IS5, SPIE Press, Bellingham, WA, 1989, p. 114–132.Taylor
, Mueller G.V., Sliney D.H., eds., Vol. IS5, SPIE Press, Bellingham, WA, 1989, p. 114–132.Taylor
, Mueller G.V., Sliney D.H., eds., Vol. IS5, SPIE Press, Bellingham, WA, 1989, p. 114–132.Taylor
icout D., Brosseau C., Martinez A.S., and Schmitt J.M., Depolarization of multiply scattering waves Taylor
icout D., Brosseau C., Martinez A.S., and Schmitt J.M., Depolarization of multiply scattering waves by spherical diffusers: Influence of the size parameter,
Taylor by spherical diffusers: Influence of the size parameter, Phys. Rev. E
Taylor Phys. Rev. E
acovic M.J., Kattavar G.W., Mehrubeoglu M., Cameron B.D., Wang L.V., Rasteger S., and Cote
Taylor acovic M.J., Kattavar G.W., Mehrubeoglu M., Cameron B.D., Wang L.V., Rasteger S., and Cote
G.L., Light backscattering polarization patterns from turbid media: Theory and experiment,
Taylor G.L., Light backscattering polarization patterns from turbid media: Theory and experiment, & Image Transfer through a Scattering Medium& Image Transfer through a Scattering MediumFrancis
Image Transfer through a Scattering MediumFrancis
Image Transfer through a Scattering Medium
ang L.V., Coté G.L., and Jacques S.L., eds., Special section on tissue polarimetry, Francis
ang L.V., Coté G.L., and Jacques S.L., eds., Special section on tissue polarimetry, J. Biomed. Opt.Francis
J. Biomed. Opt.FrancisLight Scattering by Nonspherical Particles
FrancisLight Scattering by Nonspherical Particles
Scattering, Absorption, and Emission of Light by Small
FrancisScattering, Absorption, and Emission of Light by Small
Biomedical Photonics Handbook: Fundamentals, Devices, and Techniques164
50. Stockford I.M., Morgan S.P., Chang P.C.Y., and Walker J.G., Analysis of the spatial distribution of polarized light backscattering, J. Biomed. Opt. 7(3), 313–320, 2002.
51. Maksimova I.L., Romanov S.V., and Izotova V.F., The effect of multiple scattering in disperse media on polarization characteristics of scattered sight, Opt. Spectrosc. 92(6), 915–923, 2002.
52. Wang X. and Wang L.V., Propagation of polarized light in birefringent turbid media: A Monte Carlo study, J. Biomed. Opt. 7(3), 279–290, 2002.
53. Jacques S.L., R amella-Roman J.C., and Lee K., I maging skin pathology with polarized light, J. Biomed. Opt. 7(3), 329–340, 2002.
54. de Boer J.F. and Milner T.E., Review of polarization sensitive optical coherence tomography and Stokes vector determination, J. Biomed. Opt. 7(3), 359–371, 2002.
55. Gangnus S.V., Matcher S.J., and Meglinski I.V., Monte Carlo modeling of polarized light propagation in biological tissues, Laser Phys. 14, 886–891, 2004.
56. Guo X., Wood M.F.G., and Vitkin I.A., Angular measurement of light scattered by turbid chiral media using linear Stokes polarimetry, J. Biomed. Opt. 11, 041105, 2006.
57. Anderson R.R., Polarized light examination and photography of the skin, Arch. Dermatol. 127, 1000–1005, 1991.
58. Kollias N., Polarized light photography of human skin, in Bioengineering of the Skin: Skin Surface Imaging and Analysis, Wilhelm K.-P., Elsner P., Berardesca E., and Maibach H.I., eds., CRC Press, Boca Raton, FL, 1997, pp. 95–106.
59. Hemenger R.P., Refractive index changes in t he ocular lens result from increased light scatter,J. Biomed. Opt. 1, 268–272, 1996.
60. Born M. and Wolf E., Principles of Optics, 7th edn., Cambridge University Press, Cambridge, U.K., 1999.
61. Tuchin V.V., ed., Handbook of Optical Sensing of Glucose in Biological Fluids and Tissues, CRC Press, Boca Raton, FL, 2009.
62. Kamai Y. and Ushiki T., The three-dimensional organization of collagen fibrils in the human cornea and sclera, Invest. Ophthalmol. Vis. Sci. 32, 2244–2258, 1991.
63. Hart R.W. and Farrell R.A., Light scattering in the cornea, J. Opt. Soc. Am. 59, 766–774, 1969.64. Huang Y. and Meek K.M., Swelling studies on the cornea and sclera: The effect of pH and ionic
strength, Biophys. J. 77, 1655–1665, 1999.65. Maksimova I.L. and Shubochkin L.P., Light-scattering matrices for a close-packed binary system of
hard spheres, Opt. Spectrosc. 70(6), 745–748, 1991.66. Wright C.H.G, Barrett S.F., and Welch A.J., Laser–tissue interaction, in Lasers in Medicine, Vij D.R.
and Mahesh K., eds., Kluwer Academic Publishers, Boston, MA, 2002, pp. 21–58.67. Letokhov V.S., Laser biology and medicine, Nature 316(6026), 325–328, 1985.68. Tuchin V.V., Lasers and Fiber Optics in Biomedical Science, 2nd edn., Fizmatlit, Moscow, Russia,
2010.69. Oraevsky A.A., J acques S.J., and Tittel F.K., Measurement of tissue optical properties by time-
resolved detection of laser-induced transient stress, Appl. Opt. 36, 402–415, 1997.70. Karabutov A.A. a nd Oraevsky A.A., T ime-resolved detection of optoacoustic profiles for mea-
surement of optical energy distribution in tissues, Chapter 10, in Handbook of Optical Biomedical Diagnostics, Vol. PM107, Tuchin V.V., ed., SPIE Press, Bellingham, WA, 2002, pp. 585–674.
71. Sathyam U.S. and Prahl S.A., Limitations in measurement of subsurface temperatures using pulsed photothermal radiometry, J. Biomed. Opt. 2, 251–261, 1997.
72. Zharov V.P., Galanzha E.I., a nd Tuchin V.V., Integrated photothermal fl w cytometry in v ivo,J. Biomed. Opt. 10, 647–655, 2005.
73. Zharov V.P., Galanzha E.I., and Tuchin V.V., Photothermal image fl w cytometry in vivo, Opt. Lett. 30(6), 107–110, 2005.
74. Wang L.V., Ultrasound-mediated biophotonics imaging: A review of acousto-optical tomography and photo-acoustic tomography, Dis. Markers 19, 123–138, 2003–2004.
Copyrighted
GaCopyrighted
Gangnus S.V., Matcher S.J., and Meglinski I.V., Monte Carlo modeling of polarized light propagation Copyrighted
ngnus S.V., Matcher S.J., and Meglinski I.V., Monte Carlo modeling of polarized light propagation in biological tissues, Copyrighted
in biological tissues, uo X., Wood M.F.G., and Vitkin I.A., Angular measurement of light scattered by turbid chiral
Copyrighted
uo X., Wood M.F.G., and Vitkin I.A., Angular measurement of light scattered by turbid chiral media using linear Stokes polarimetry,
Copyrighted
media using linear Stokes polarimetry, nderson R.R., Polarized light examination and photography of the skin,
Copyrighted
nderson R.R., Polarized light examination and photography of the skin, 1000–1005, 1991.
Copyrighted
1000–1005, 1991.ollias N., Polarized light photography of human skin, in
Copyrighted ollias N., Polarized light photography of human skin, in
Imaging and Analysis
Copyrighted Imaging and Analysis, Wilhelm K.-P., Elsner P., Berardesca E., and Maibach H.I., eds., CRC Press,
Copyrighted , Wilhelm K.-P., Elsner P., Berardesca E., and Maibach H.I., eds., CRC Press,
Boca Raton, FL, 1997, pp. 95–106.
Copyrighted Boca Raton, FL, 1997, pp. 95–106.emenger R.P., Refractive index changes in t he ocular lens result from increased light scatter,
Copyrighted emenger R.P., Refractive index changes in t he ocular lens result from increased light scatter,Material
emenger R.P., Refractive index changes in t he ocular lens result from increased light scatter,Material
emenger R.P., Refractive index changes in t he ocular lens result from increased light scatter,, 268–272, 1996.
Material
, 268–272, 1996.Principles of Optics
Material
Principles of Optics, 7th edn., Cambridge University Press, Cambridge, U.K.,
Material
, 7th edn., Cambridge University Press, Cambridge, U.K.,
Handbook of Optical Sensing of Glucose in Biological Fluids and Tissues
Material Handbook of Optical Sensing of Glucose in Biological Fluids and Tissues
amai Y. and Ushiki T., The three-dimensional organization of collagen fibrils in the human cornea
Material amai Y. and Ushiki T., The three-dimensional organization of collagen fibrils in the human cornea - amai Y. and Ushiki T., The three-dimensional organization of collagen fibrils in the human cornea - amai Y. and Ushiki T., The three-dimensional organization of collagen fibrils in the human cornea , 2244–2258, 1991.- , 2244–2258, 1991.Taylor
, 2244–2258, 1991.Taylor
, 2244–2258, 1991.art R.W. and Farrell R.A., Light scattering in the cornea,
Taylor
art R.W. and Farrell R.A., Light scattering in the cornea, J. Opt. Soc. Am. Taylor
J. Opt. Soc. Am. uang Y. and Meek K.M., Swelling studies on the cornea and sclera: The effect of pH and ionic
Taylor uang Y. and Meek K.M., Swelling studies on the cornea and sclera: The effect of pH and ionic
aksimova I.L. and Shubochkin L.P., Light-scattering matrices for a close-packed binary system of
Taylor aksimova I.L. and Shubochkin L.P., Light-scattering matrices for a close-packed binary system of & right C.H.G, Barrett S.F., and Welch A.J., Laser–tissue interaction, in & right C.H.G, Barrett S.F., and Welch A.J., Laser–tissue interaction, in Lasers in Medicine& Lasers in MedicineFrancis
Lasers in MedicineFrancis
Lasers in MedicineFrancis
and Mahesh K., eds., Kluwer Academic Publishers, Boston, MA, 2002, pp. 21–58.Francis
and Mahesh K., eds., Kluwer Academic Publishers, Boston, MA, 2002, pp. 21–58.(6026), 325–328, 1985.
Francis(6026), 325–328, 1985.
, 2nd edn., Fizmatlit, Moscow, Russia,
Francis, 2nd edn., Fizmatlit, Moscow, Russia,
Oraevsky A.A., J acques S.J., and Tittel F.K., Measurement of tissue optical properties by time-
FrancisOraevsky A.A., J acques S.J., and Tittel F.K., Measurement of tissue optical properties by time-
Light–Tissue Interactions 165
75. Wang L.V. and Shen Q., Sonoluminescent tomography of strongly scattering media, Opt. Lett. 23(7), 561–563, 1998.
76. Shen Q. and Wang L.V., Two-dimensional imaging of dense tissue-simulating turbid media by use of sonoluminescence, Appl. Opt. 38(1), 246–252, 1999.
77. Duck F.A., Physical Properties of Tissue: A Comprehensive Reference Book, Academic Press, London, U.K., 1990.
78. Tuchin V.V., Optical Clearing of Tissues and Blood, Vol. PM 154, SPIE Press, Bellingham, WA, 2006.79. Graaff R., Aarnoudse J.G., Zijp J.R. et al., Reduced light scattering properties for mixtures of spherical
particles: A simple approximation derived from Mie calculations, Appl. Opt. 31, 1370–1376, 1992.80. Kohl M., Essenpreis M., and Cope M., The influence of glucose concentration upon the transport of
light in tissue-simulating phantoms, Phys. Med. Biol. 40, 1267–1287, 1995.81. Drezek R., Dunn A., and Richards-Kortum R., Light scattering from cells: Finite-difference time-
domain simulations and goniometric measurements, Appl. Opt. 38, 3651–3661, 1999.82. Bolin F.P., Preuss L.E., Taylor R.C., and Ference R.J., Refractive index of some mammalian tissues
using a fiber optic cladding method, Appl. Opt. 28, 2297–2303, 1989.83. Tuchin V.V., Maksimova I.L., Zimnyakov D.A. et al., Light propagation in tissues with controlled
optical properties, J. Biomed. Opt. 2, 401–417, 1997.84. Liu H., Beauvoit B., Kimura M., and Chance B., Dependence of tissue optical properties on solute—
Induced changes in refractive index and osmolarity, J. Biomed. Opt. 1, 200–211, 1996.85. Vargas G., Chan E.K., Barton J.K., Rylander III H.G., and Welch A.J., Use of an agent to reduce scat-
tering in skin, Lasers Surg. Med. 24, 133–141, 1999.86. Tuchin V.V., Bashkatov A.N., Genina E.A., Sinichkin Yu.P., and Lakodina N.A., In vivo study of the
human skin clearing dynamics, J. Tech. Phys. Lett. 27(6), 489–490, 2001.87. Wang R.K. and Tuchin V.V., Optical tissue clearing to enhance imaging performance for OCT,
Chapter 28, in Optical Coherence Tomography: Technology and Applications, Drexler W. and Fujimoto J.G., eds., Springer, Berlin, Germany, 2008, pp. 851–882.
88. Wang R.K., Tuchin V.V., Xu X., and Elder J.B., Concurrent enhancement of imaging depth and contrast for Optical Coherence Tomography by hyperosmotic agents, J. Opt. Soc. Am. B 18, 948–953, 2001.
89. Khan M.H., Choi B., Chess S., Kelly K.M., McCullough J., and Nelson J.S., Optical clearing of in vivo human skin: Implications for light-based diagnostic imaging and therapeutics, Lasers Surg. Med. 34, 83–85, 2004.
90. Khalil O., Non-invasive glucose measurement technologies: An update from 1999 to the dawn of the New Millennium, Diabetes Technol. Ther. 6(5), 660–697, 2004.
91. Larin K.V., Eledrisi M.S., Motamedi M., and Esenaliev R.O., Noninvasive blood glucose monitor-ing with optical coherence tomography: A p ilot study in human subjects, Diabetes Care 25(12), 2263–2267, 2002.
92. Brezinski M., Saunders K., Jesser C., Li X., and Fujimoto J., Index matching to improve OCT imag-ing through blood, Circulation 103, 1999–2003, 2001.
93. Tuchin V.V., Xu X., and Wang R.K., Dynamic optical coherence tomography in optical clearing, sedimentation and aggregation study of immersed blood, Appl. Opt. 41(1), 258–271, 2002.
94. Schneckenburger H., Steiner R., Strauss W., Stock K., and Sailer R., Fluorescence technologies in biomedical diagnostics, Chapter 15, in Optical Biomedical Diagnostics, Vol. PM107, Tuchin V.V., ed., SPIE Press, Bellingham, WA, 2002, pp. 825–874.
95. Sinichkin Yu.P., Kollias N., Z onios G., U tz S.R., and Tuchin V.V., Refl ctance and fluorescence spectroscopy of human skin in vivo, Chapter 13, in Handbook of Optical Biomedical Diagnostics, Vol. PM107, Tuchin V.V., ed., SPIE Press, Bellingham, WA, 2002, pp. 725–785.
96. Sterenborg H.J.C.M., Motamedi M., Wagner R.F., Duvic J.R.M., Thomsen S., and Jacques S.L., In vivo fluorescence spectroscopy and imaging of human skin tumors, Lasers Med. Sci. 9, 191–201, 1994.
97. Zeng H., MacAulay C., McLean D.I., and Palcic B., Spectroscopic and microscopic characteristics of human skin autofluorescence emission, Photochem. Photobiol. 61, 639–645, 1995.
Copyrighted
light in tissue-simulating phantoms,Copyrighted
light in tissue-simulating phantoms,DrCopyrighted
Drezek R., Dunn A., and Richards-Kortum R., Light scattering from cells: Finite-difference time-Copyrighted
ezek R., Dunn A., and Richards-Kortum R., Light scattering from cells: Finite-difference time-domain simulations and goniometric measurements,
Copyrighted
domain simulations and goniometric measurements, olin F.P., Preuss L.E., Taylor R.C., and Ference R.J., Refractive index of some mammalian tissues
Copyrighted
olin F.P., Preuss L.E., Taylor R.C., and Ference R.J., Refractive index of some mammalian tissues using a fiber optic cladding method,
Copyrighted
using a fiber optic cladding method,uchin V.V., Maksimova I.L., Zimnyakov D.A. et al., Light propagation in tissues with controlled
Copyrighted
uchin V.V., Maksimova I.L., Zimnyakov D.A. et al., Light propagation in tissues with controlled optical properties,
Copyrighted optical properties, J. Biomed. Opt
Copyrighted J. Biomed. Opt
iu H., Beauvoit B., Kimura M., and Chance B., Dependence of tissue optical properties on solute—
Copyrighted iu H., Beauvoit B., Kimura M., and Chance B., Dependence of tissue optical properties on solute—
Induced changes in refractive index and osmolarity,
Copyrighted Induced changes in refractive index and osmolarity, argas G., Chan E.K., Barton J.K., Rylander III H.G., and Welch A.J., Use of an agent to reduce scat
Copyrighted argas G., Chan E.K., Barton J.K., Rylander III H.G., and Welch A.J., Use of an agent to reduce scatMaterial
argas G., Chan E.K., Barton J.K., Rylander III H.G., and Welch A.J., Use of an agent to reduce scatMaterial
argas G., Chan E.K., Barton J.K., Rylander III H.G., and Welch A.J., Use of an agent to reduce scatLasers Surg. Med
Material
Lasers Surg. Med. Material
. 24Material
24, 133–141, 1999.Material
, 133–141, 1999.uchin V.V., Bashkatov A.N., Genina E.A., Sinichkin Yu.P., and Lakodina N.A., In vivo study of the
Material
uchin V.V., Bashkatov A.N., Genina E.A., Sinichkin Yu.P., and Lakodina N.A., In vivo study of the J. Tech. Phys. Lett
Material J. Tech. Phys. Lett
ang R.K. and Tuchin V.V., Optical tissue clearing to enhance imaging performance for OCT,
Material ang R.K. and Tuchin V.V., Optical tissue clearing to enhance imaging performance for OCT,
Optical Coherence Tomography: Technology and Applications
Material Optical Coherence Tomography: Technology and ApplicationsJ.G., eds., Springer, Berlin, Germany, 2008, pp. 851–882.
Material J.G., eds., Springer, Berlin, Germany, 2008, pp. 851–882.- J.G., eds., Springer, Berlin, Germany, 2008, pp. 851–882.- J.G., eds., Springer, Berlin, Germany, 2008, pp. 851–882.ang R.K., Tuchin V.V., Xu X., and Elder J.B., Concurrent enhancement of imaging depth and contrast - ang R.K., Tuchin V.V., Xu X., and Elder J.B., Concurrent enhancement of imaging depth and contrast Taylor
ang R.K., Tuchin V.V., Xu X., and Elder J.B., Concurrent enhancement of imaging depth and contrast Taylor
ang R.K., Tuchin V.V., Xu X., and Elder J.B., Concurrent enhancement of imaging depth and contrast for Optical Coherence Tomography by hyperosmotic agents,
Taylor
for Optical Coherence Tomography by hyperosmotic agents, J. Opt. Soc. Am. B Taylor
J. Opt. Soc. Am. B han M.H., Choi B., Chess S., Kelly K.M., McCullough J., and Nelson J.S., Optical clearing of in vivo
Taylor han M.H., Choi B., Chess S., Kelly K.M., McCullough J., and Nelson J.S., Optical clearing of in vivo
human skin: Implications for light-based diagnostic imaging and therapeutics,
Taylor human skin: Implications for light-based diagnostic imaging and therapeutics,
halil O., Non-invasive glucose measurement technologies: An update from 1999 to the dawn of the
Taylor halil O., Non-invasive glucose measurement technologies: An update from 1999 to the dawn of the & halil O., Non-invasive glucose measurement technologies: An update from 1999 to the dawn of the & halil O., Non-invasive glucose measurement technologies: An update from 1999 to the dawn of the
Francis
arin K.V., Eledrisi M.S., Motamedi M., and Esenaliev R.O., Noninvasive blood glucose monitorFrancis
arin K.V., Eledrisi M.S., Motamedi M., and Esenaliev R.O., Noninvasive blood glucose monitoring with optical coherence tomography: A p ilot study in human subjects,
Francising with optical coherence tomography: A p ilot study in human subjects, Diabetes Care
FrancisDiabetes Care
rezinski M., Saunders K., Jesser C., Li X., and Fujimoto J., Index matching to improve OCT imag
Francisrezinski M., Saunders K., Jesser C., Li X., and Fujimoto J., Index matching to improve OCT imag
uchin V.V., Xu X., and Wang R.K., Dynamic optical coherence tomography in optical clearing,
Francisuchin V.V., Xu X., and Wang R.K., Dynamic optical coherence tomography in optical clearing,
Biomedical Photonics Handbook: Fundamentals, Devices, and Techniques166
98. Carden A. and Morris M.D., Application of vibration spectroscopy to the study of mineralized tis-sues (review), J. Biomed. Opt. 5, 259–268, 2000.
99. Lucassen G.W., Caspers P.J., and Puppels G.J., Infrared and Raman spectroscopy of human skin in vivo, Chapter 14, in Handbook of Optical Biomedical Diagnostics, Vol. PM107, Tuchin V.V., ed., SPIE Press, Bellingham, WA, 2002, pp. 787–823.
100. Hanlon E.D., Manoharan R., Koo T.-W., Shafer K.E., Motz J.T., Fitzmaurice M., Kramer J.R., Itzkan I., Dasari R.R., and Feld M.S., Prospects for in vivo Raman spectroscopy, Phys. Med. Biol. 45, R1–R59, 2000.
101. Petry R., Schmitt M., and Popp J., Raman spectroscopy—A prospective tool in t he life sciences, ChemPhysChem 4, 14–30, 2003.
102. Skrebova Eikje N., Ozaki Y., Aizawa K., and Arase S., Fiber optic near-infrared Raman spectroscopy for clinical noninvasive determination of water content in diseased skin and assessment of cutane-ous edema, J. Biomed. Opt. 10, 014013-1-13, 2005.
103. Yaroslavskaya A.N., Yaroslavsky I.V., Otto C., Puppels G.J., Duindam H., Vrensen G.F.J.M., Greve J., and Tuchin V.V., Water exchange in human eye lens monitored by confocal Raman microspectros-copy, Biophysics 43(1), 109–114, 1998.
104. Dainty J.C., ed., Laser Speckle and Related Phenomena, 2nd edn., Springer-Verlag, New York, 1984.105. Aizu Y. and Asakura T., Bio-speckle phenomena and their application to the evaluation of blood
fl w, Opt. Laser Technol. 23, 205–219, 1991.106. Briers J.D., Laser Doppler and time-varying speckle: A reconciliation, J. Opt. Soc. Am. A 13, 345–
350, 1996.107. Serov A., Steinacher B., and Lasser T., Full-fi ld laser Doppler perfusion imaging and monitoring
with an intelligent CMOS camera, Opt. Express 13, 3681–3689, 2005.108. Forrester K.R., Tulip J., Leonard C., Stewart C., and Bray R.C., A laser speckle imaging technique for
measuring tissue perfusion, IEEE Trans. Biomed. Eng. 51, 2074–2084, 2004.109. Liu Q., Wang Z., and Luo Q., Temporal clustering analysis of cerebral blood fl w activation maps
measured by laser speckle contrast imaging, J. Biomed. Opt. 10(2), 024019-1-7, 2005.110. Boas D.A., Campbell L.E., and Yodh A.G., Scattering and imaging with diffusing temporal fi ld cor-
relations, Phys. Rev. Lett. 75, 1855–1858, 1995.111. Zimnyakov D.A., Tuchin V.V., and Yodh A.G., Characteristic scales of optical fi ld depolarization
and decorrelation for multiple scattering media and tissues, J. Biomed. Opt. 4, 157–163, 1999.112. Yu G., Lech G., Zhou C., Chance B., Mohler III E.R., and Yodh A.G., Time-dependent blood fl w
and oxygenation in human skeletal muscles measured with noninvasive near-infrared diffuse opti-cal spectroscopies, J. Biomed. Opt. 10(2), 024027-1-7, 2005.
113. Durduran T., Zhou C., Buckley E.M. et a l., Optical measurement of cerebral hemodynamics and oxygen metabolism in neonates with congenital heart defects, J. Biomed. Opt. 15(3), 037004-1-10, 2010.
114. Diaspro A., e d., Confocal and Two-Photon Microscopy: Foundations, Applications, and Advances, Wiley-Liss Inc., New York, 2002.
115. Bouma B.E. and Tearney G.J., eds., Handbook of Optical Coherence Tomography, Marcel Dekker, New York, 2002.
116. Berlien H.-P. and Müller G.J., eds., Applied Laser Medicine, Springer-Verlag, Berlin, Germany, 2003.117. Wilson B., Tuchin V., and Tanev S., eds., Advances in Biophotonics, NATO Science Series I. Life and
Behavioural Sciences, Vol. 369, IOS Press, Amsterdam, the Netherlands, 2005.118. Kishen A. and Asundi A., eds., Photonics in Dentistry. Series of Biomaterials and Bioengineering,
Imperial College Press, London, U.K., 2006.119. Masters B.R. and So P.T.C., eds., Handbook of Biomedical Nonlinear Optical Microscopy, Oxford
University Press, New York, 2008.120. Drexler W. and Fujimoto J.G., eds., Optical Coherence Tomography: Technology and Applications,
Springer, Berlin, Germany, 2008.
Copyrighted
krebova Eikje N., Ozaki Y., Aizawa K., and Arase S., Fiber optic near-infrared Raman spectroscopy Copyrighted
krebova Eikje N., Ozaki Y., Aizawa K., and Arase S., Fiber optic near-infrared Raman spectroscopy for clinical noninvasive determination of water content in diseased skin and assessment of cutaneCopyrighted
for clinical noninvasive determination of water content in diseased skin and assessment of cutaneous edema,
Copyrighted
ous edema, J. Biomed. Opt
Copyrighted
J. Biomed. Optaroslavskaya A.N., Yaroslavsky I.V., Otto C., Puppels G.J., Duindam H., Vrensen G.F.J.M., Greve J.,
Copyrighted
aroslavskaya A.N., Yaroslavsky I.V., Otto C., Puppels G.J., Duindam H., Vrensen G.F.J.M., Greve J., and Tuchin V.V., Water exchange in human eye lens monitored by confocal Raman microspectros
Copyrighted
and Tuchin V.V., Water exchange in human eye lens monitored by confocal Raman microspectrosBiophysics
Copyrighted
Biophysics 43
Copyrighted
43(1), 109–114, 1998.
Copyrighted
(1), 109–114, 1998.ainty J.C., ed.,
Copyrighted ainty J.C., ed., Laser Speckle and Related Phenomena
Copyrighted Laser Speckle and Related Phenomena
izu Y. and Asakura T., Bio-speckle phenomena and their application to the evaluation of blood
Copyrighted izu Y. and Asakura T., Bio-speckle phenomena and their application to the evaluation of blood
Opt. Laser Technol
Copyrighted Opt. Laser Technol.
Copyrighted . 23
Copyrighted 23, 205–219, 1991.
Copyrighted , 205–219, 1991.riers J.D., Laser Doppler and time-varying speckle: A reconciliation,
Copyrighted riers J.D., Laser Doppler and time-varying speckle: A reconciliation, Material
riers J.D., Laser Doppler and time-varying speckle: A reconciliation, Material
riers J.D., Laser Doppler and time-varying speckle: A reconciliation,
erov A., Steinacher B., and Lasser T., Full-fi ld laser Doppler perfusion imaging and monitoring
Material
erov A., Steinacher B., and Lasser T., Full-fi ld laser Doppler perfusion imaging and monitoring Opt. Express
Material Opt. Express
orrester K.R., Tulip J., Leonard C., Stewart C., and Bray R.C., A laser speckle imaging technique for
Material orrester K.R., Tulip J., Leonard C., Stewart C., and Bray R.C., A laser speckle imaging technique for
IEEE Trans. Biomed. Eng
Material IEEE Trans. Biomed. Engiu Q., Wang Z., and Luo Q., Temporal clustering analysis of cerebral blood fl w activation maps
Material iu Q., Wang Z., and Luo Q., Temporal clustering analysis of cerebral blood fl w activation maps - iu Q., Wang Z., and Luo Q., Temporal clustering analysis of cerebral blood fl w activation maps - iu Q., Wang Z., and Luo Q., Temporal clustering analysis of cerebral blood fl w activation maps J. Biomed. Opt- J. Biomed. OptTaylor
J. Biomed. OptTaylor
J. Biomed. Optoas D.A., Campbell L.E., and Yodh A.G., Scattering and imaging with diffusing temporal fi ld cor
Taylor
oas D.A., Campbell L.E., and Yodh A.G., Scattering and imaging with diffusing temporal fi ld cor
imnyakov D.A., Tuchin V.V., and Yodh A.G., Characteristic scales of optical fi ld depolarization
Taylor imnyakov D.A., Tuchin V.V., and Yodh A.G., Characteristic scales of optical fi ld depolarization
and decorrelation for multiple scattering media and tissues,
Taylor and decorrelation for multiple scattering media and tissues, J. Biomed. Opt.
Taylor J. Biomed. Opt.u G., Lech G., Zhou C., Chance B., Mohler III E.R., and Yodh A.G., Time-dependent blood fl w
Taylor u G., Lech G., Zhou C., Chance B., Mohler III E.R., and Yodh A.G., Time-dependent blood fl w & u G., Lech G., Zhou C., Chance B., Mohler III E.R., and Yodh A.G., Time-dependent blood fl w & u G., Lech G., Zhou C., Chance B., Mohler III E.R., and Yodh A.G., Time-dependent blood fl w and oxygenation in human skeletal muscles measured with noninvasive near-infrared diffuse opti
& and oxygenation in human skeletal muscles measured with noninvasive near-infrared diffuse optiFrancis
and oxygenation in human skeletal muscles measured with noninvasive near-infrared diffuse optiFrancis
and oxygenation in human skeletal muscles measured with noninvasive near-infrared diffuse opti
urduran T., Zhou C., Buckley E.M. et a l., Optical measurement of cerebral hemodynamics and Francis
urduran T., Zhou C., Buckley E.M. et a l., Optical measurement of cerebral hemodynamics and J. Biomed. Opt
FrancisJ. Biomed. Opt. 15(3), 037004-1-10,
Francis. 15(3), 037004-1-10,
FrancisConfocal and Two-Photon Microscopy: Foundations, Applications, and Advances
FrancisConfocal and Two-Photon Microscopy: Foundations, Applications, and Advances
Light–Tissue Interactions 167
121. Splinter R. and Hooper B.A., An Introduction to Biomedical Optics, CRC Press, Boca Raton, FL, 2007.
122. Wax A. and Backman V., eds., Biomedical Applications of Light Scattering, McGraw-Hill, New York, 2009.
123. Wang L., ed., Photoacoustic Imaging and Spectroscopy, CRC Press, Boca Raton, FL, 2009.124. Peiponen K.-E., Myllylä R., and Priezzhev A.V., Optical Measurement Techniques, Innovations for
Industry and the Life Science, Springer-Verlag, Berlin, Germany, 2009.125. Baron E.D., ed., Light-Based Therapies for Skin of Color, Springer, London, U.K., 2009.126. Ahluwalia G., ed., Light Based Systems for Cosmetic Application, William Andrew, Norwich, England,
2009.127. Tuchin V.V., ed., Handbook of Photonics for Biomedical Science, CRC Press, Boca Raton, FL, 2010.128. Pavone F.S., ed., Laser Imaging and Manipulation in Cell Biology, Wiley-VCH Verlag GmbH & Co.
KGaA, Weinheim, Germany, 2010.129. Boas D.A., Pitris C., and Ramanujam N., eds., Handbook of Biomedical Optics, CRC Press, Boca
Raton, FL, 2011.130. Popp J., Tuchin V.V., Chiou A., and Heinemann S.H., eds., Handbook of Biophotonics, Vol. 1: Basics
and Techniques, Wiley-VCH Verlag GmbH & Co. KGaA, Weinheim, Germany, 2011.131. Popp J., Tuchin V.V., Chiou A., a nd Heinemann S.H., e ds., Handbook of Biophotonics, Vol. 2:
Photonics for Health Care, Wiley-VCH Verlag GmbH & Co. KGaA, Weinheim, Germany, 2012.132. Popp J., Tuchin V.V., Chiou A., a nd Heinemann S.H., e ds., Handbook of Biophotonics, Vol. 3:
Photonics in Pharmaceutics, Bioanalysis and Environmental Research, Wiley-VCH Verlag GmbH & Co. KGaA, Weinheim, Germany, 2012.
133. Tuchin V.V. Dictionary of Biomedical Optics and Biophotonics, SPIE Press, Bellingham, WA, 2012.134. Wang R.K. and Tuchin V.V., eds., Advanced Biophotonics: Tissue Optical Sectioning, CRC Press,
Taylor & Francis Group, London, U.K., 2013.
Copyrighted
uchin V.V., ed., Copyrighted
uchin V.V., ed., PCopyrighted
Pavone F.S., ed., Copyrighted
avone F.S., ed., KGaA, Weinheim, Germany, 2010.
Copyrighted
KGaA, Weinheim, Germany, 2010.oas D.A., Pitris C., and Ramanujam N., eds.,
Copyrighted
oas D.A., Pitris C., and Ramanujam N., eds., Raton, FL, 2011.
Copyrighted
Raton, FL, 2011.opp J., Tuchin V.V., Chiou A., and Heinemann S.H., eds.,
Copyrighted
opp J., Tuchin V.V., Chiou A., and Heinemann S.H., eds.,and Techniques
Copyrighted and Techniques, Wiley-VCH Verlag GmbH & Co. KGaA, Weinheim, Germany, 2011.
Copyrighted , Wiley-VCH Verlag GmbH & Co. KGaA, Weinheim, Germany, 2011.
opp J., Tuchin V.V., Chiou A., a nd Heinemann S.H., e ds.,
Copyrighted opp J., Tuchin V.V., Chiou A., a nd Heinemann S.H., e ds.,
Photonics for Health Care
Copyrighted Photonics for Health Care, Wiley-VCH Verlag GmbH & Co. KGaA, Weinheim, Germany, 2012.
Copyrighted , Wiley-VCH Verlag GmbH & Co. KGaA, Weinheim, Germany, 2012.opp J., Tuchin V.V., Chiou A., a nd Heinemann S.H., e ds.,
Copyrighted opp J., Tuchin V.V., Chiou A., a nd Heinemann S.H., e ds.,Material
opp J., Tuchin V.V., Chiou A., a nd Heinemann S.H., e ds.,Material
opp J., Tuchin V.V., Chiou A., a nd Heinemann S.H., e ds.,Photonics in Pharmaceutics, Bioanalysis and Environmental Research
Material
Photonics in Pharmaceutics, Bioanalysis and Environmental ResearchCo. KGaA, Weinheim, Germany, 2012.
Material
Co. KGaA, Weinheim, Germany, 2012.Dictionary of Biomedical Optics and Biophotonics
Material Dictionary of Biomedical Optics and Biophotonics
Material Advanced Biophotonics: Tissue Optical
Material Advanced Biophotonics: Tissue Optical
Taylor & Francis Group, London, U.K., 2013.
Material Taylor & Francis Group, London, U.K., 2013.
- Taylor & Francis