Embed Size (px)
Citation preview

Deepak Subedi
Lightning Induced Over-voltages in PowerTransformer and Voltage Spikes inConnected Load
School of Electrical Engineering
Thesis submitted for examination for the degree of Master ofScience in Technology.Espoo September 28, 2017
Thesis supervisor:
Prof. Dr. Matti Lehtonen

aalto universityschool of electrical engineering
abstract of themaster’s thesis
Author: Deepak Subedi
Title: Lightning Induced Over-voltages in Power Transformer and VoltageSpikes in Connected Load
Date: September 28, 2017 Language: English Number of pages: 8+61
Department of Automation and Electrical Engineering
Professorship: Power System Code: S-18
Supervisor and instructor: Prof. Dr. Matti Lehtonen
Power Transformers are subjected to lightning strokes, which causes the voltageat the secondary side to rise abruptly. The main aim of the report is to investigatethe voltage at the medium and low voltage side in electrical system of a powerplant when the high voltage power transformers are subjected to lightning strokes.Based on modelling and simulations implemented in EMTP/ATPDraw, the volt-age at the 15.75 kV, 6 kV and 0.4 kV is determined to ensure if the transferredover-voltage is within the basic insulation level (BIL) of the connected equipment.Transformer frequency model, surge arrestor, cables and transmission tower arearranged in a single environment of EMTP/ATPDraw. A study is carried out toanalyze the transferred transient over-voltage in the low voltage side taking thescenario of direct stroke and back flashover. Combination of different surge ar-restor are implemented and analyzed to mitigate the transient voltage transferredto the medium and low voltage side.
Keywords: Transformer, Overvoltage, EMTP, Surge Arrestor, Capacitance,BIL, Back flashover

iii
PrefaceI would like to thank Prof.Matti Lehtonen for his valuable assistance and supportduring my Thesis at Aalto University.Also, my sincere thanks to the Power System research group who helped me duringmy work.
Otaniemi, September 28, 2017 Deepak Subedi

iv
ContentsAbstract ii
Preface iii
Contents iv
Symbols and abbreviations v
1 Introduction 11.1 Introduction . . . . . . . . . . . . . . . . . . . . . . . . . . . . . . . . 11.2 Thesis Objectives . . . . . . . . . . . . . . . . . . . . . . . . . . . . . 21.3 Scope of the Work . . . . . . . . . . . . . . . . . . . . . . . . . . . . 21.4 Thesis Organization . . . . . . . . . . . . . . . . . . . . . . . . . . . . 2
2 Literature Review 42.1 Transient Over-voltage . . . . . . . . . . . . . . . . . . . . . . . . . . 42.2 Causes of Transients . . . . . . . . . . . . . . . . . . . . . . . . . . . 42.3 Lightning Stroke . . . . . . . . . . . . . . . . . . . . . . . . . . . . . 62.4 Voltage Impulse . . . . . . . . . . . . . . . . . . . . . . . . . . . . . . 72.5 Current Impulse . . . . . . . . . . . . . . . . . . . . . . . . . . . . . . 9
3 Modelling 103.1 Power Transformer Modelling . . . . . . . . . . . . . . . . . . . . . . 103.2 Medium Voltage Transformer Modelling . . . . . . . . . . . . . . . . 183.3 Surge Arrestor Modelling . . . . . . . . . . . . . . . . . . . . . . . . . 203.4 Transmission Tower Modelling . . . . . . . . . . . . . . . . . . . . . . 243.5 Power Cable Modelling . . . . . . . . . . . . . . . . . . . . . . . . . . 29
4 Simulation 304.1 EMTP-Introduction[23] . . . . . . . . . . . . . . . . . . . . . . . . . . 304.2 ATP Draw [24] . . . . . . . . . . . . . . . . . . . . . . . . . . . . . . 304.3 Modelling and Simulation of the System . . . . . . . . . . . . . . . . 32
4.3.1 Direct Stroke . . . . . . . . . . . . . . . . . . . . . . . . . . . 354.3.2 Indirect Stroke . . . . . . . . . . . . . . . . . . . . . . . . . . 45
5 Discussion and Conclusion 515.1 Discussion . . . . . . . . . . . . . . . . . . . . . . . . . . . . . . . . . 515.2 Conclusion . . . . . . . . . . . . . . . . . . . . . . . . . . . . . . . . . 52
Appendices
A Frequency Response Analysis 56
B Surge arrestor non linear characteristics 60

v
Symbols and abbreviations
Symbolsα Attenuation coefficient along the towerC CapacitanceCo Surge propagation velocityf Frequencyfr Resonance frequencyH Impedance gainL InductanceR ResistanceRf Tower footing resistanceVfo Insulator flashover voltageVin Input VoltageVout Output VoltageY AdmittanceZ ImpedanceZp Surge impedanceZTx Coil impedance of Transformer
AbbreviationsATP Alternative Transients ProgramBIL Basic Insulation LevelCFO Critical Flashover VoltageEMTP Electro Magnetic Transient ProgramFRA Frequency Response AnalysisHV High VoltagekV Kilo VoltkA Kilo AmpereLV Low VoltageMV Medium Voltage
Mega VoltMVA Mega Volt AmpereSA Surge ArrestorTFR Transformer

vi
List of Figures2.1 Current Impulse transient due to lightning stroke [4]. . . . . . . . . . 52.2 Oscillatory Transient waveform [4]. . . . . . . . . . . . . . . . . . . . 52.3 Direct Stroke [5]. . . . . . . . . . . . . . . . . . . . . . . . . . . . . . 62.4 Indirect Stroke [5]. . . . . . . . . . . . . . . . . . . . . . . . . . . . . 72.5 Waveform of standard lightning voltage impulse [9]. . . . . . . . . . 82.6 8/20 µs current impulse waveform [9]. . . . . . . . . . . . . . . . . . 93.1 FRA end to end test setup [7]. . . . . . . . . . . . . . . . . . . . . . 113.2 High frequency power transformer model. . . . . . . . . . . . . . . . 153.3 Transient over-voltage in HV of the transformer. . . . . . . . . . . . 173.4 Transient over-voltage transferred to LV of the transformer. . . . . . 173.5 High frequency transformer model [13]. . . . . . . . . . . . . . . . . 183.6 Frequency dependent model [14]. . . . . . . . . . . . . . . . . . . . . 203.7 Pinceti et al.model [15]. . . . . . . . . . . . . . . . . . . . . . . . . . 213.8 Injected current. . . . . . . . . . . . . . . . . . . . . . . . . . . . . . 233.9 Residual voltage. . . . . . . . . . . . . . . . . . . . . . . . . . . . . . 233.10 Absorbed energy. . . . . . . . . . . . . . . . . . . . . . . . . . . . . . 243.11 Multistory tower model. [16] . . . . . . . . . . . . . . . . . . . . . . 253.12 Lightning source model. . . . . . . . . . . . . . . . . . . . . . . . . . 263.13 Induced voltage for different front time of lightning current. . . . . . 273.14 Pi-equivalent model of cable. . . . . . . . . . . . . . . . . . . . . . . 294.1 Single line diagram of the system. . . . . . . . . . . . . . . . . . . . 334.2 Overall simulation model. . . . . . . . . . . . . . . . . . . . . . . . . 344.3 Voltage at the transmission tower before 400 kV surge arrestor oper-
ates. . . . . . . . . . . . . . . . . . . . . . . . . . . . . . . . . . . . . 354.4 Transient voltage at the 415 kV side of the system for the case of 26.6
kA lightning with 400 kV surge arrestor. . . . . . . . . . . . . . . . . 364.5 Transient voltage at the 15.75 kV side of the system for the case of
26.6 kA lightning with 400 kV surge arrestor. . . . . . . . . . . . . . 364.6 Transient voltage at the 6 kV side of the system for the case of 26.6
kA lightning with 400 kV surge arrestor. . . . . . . . . . . . . . . . . 374.7 Transient voltage at the 0.4 kV side of the system for the case of 26.6
kA lightning with 400 kV surge arrestor. . . . . . . . . . . . . . . . . 374.8 Transient voltage at the 415 kV side of the system for the case of 200
kA lightning with 400 kV surge arrestor. . . . . . . . . . . . . . . . . 384.9 Transient voltage at the 15.75 kV side of the system for the case of
26.6 kA lightning with 400 and 15.75 kV surge arrestor. . . . . . . . 394.10 Transient voltage at the 6 kV side of the system for the case of 26.6
kA lightning with 400 and 15.75 kV surge arrestor. . . . . . . . . . . 404.11 Transient voltage at the 0.4 kV side of the system for the case of 26.6
kA lightning with 400 and 15.75 kV surge arrestor. . . . . . . . . . . 404.12 Transient voltage at the 6 kV side of the system for the case of 26.6
kA lightning with 400, 15.75 and 6 kV surge arrestor. . . . . . . . . 41

vii
4.13 Transient voltage at the 0.4 kV side of the system for the case of 26.6kA lightning with 400, 15.75 and 6 kV surge arrestor. . . . . . . . . 41
4.14 Transient voltage at the 15.75 kV side of the system for the case of20 kA lightning with 400 and 15.75 kV surge arrestor. . . . . . . . . 42
4.15 Transient voltage at the 6 kV side of the system for the case of 20 kAlightning with 400 and 15.75 kV surge arrestor. . . . . . . . . . . . . 42
4.16 Transient voltage at the 0.4 kV side of the system for the case of 20kA lightning with 400 and 15.75 kV surge arrestor. . . . . . . . . . . 43
4.17 Transient voltage at the 6 kV side of the system for the case of 20 kAlightning with 400, 15.75 and 6 kV surge arrestor. . . . . . . . . . . 44
4.18 Transient voltage at the 0.4 kV side of the system for the case of 20kA lightning with 400, 15.75 and 6 kV surge arrestor. . . . . . . . . 44
4.19 Voltage at the 415 kV side for the case of back flashover with 1640kV step voltage. . . . . . . . . . . . . . . . . . . . . . . . . . . . . . . 45
4.20 Transient voltage at the 15.75 kV side of the system for the case ofback flashover with 400 kV surge arrestor. . . . . . . . . . . . . . . . 46
4.21 Transient voltage at the 6 kV side of the system for the case of backflashover with 400 kV surge arrestor. . . . . . . . . . . . . . . . . . . 46
4.22 Transient voltage at the 15.75 kV side of the system for the case ofback flashover with 400 and 15.75 kV surge arrestor. . . . . . . . . . . 47
4.23 Transient voltage at the 6 kV side of the system for the case of backflashover with 400 and 15.75 kV surge arrestor. . . . . . . . . . . . . 48
4.24 Transient voltage at the 0.4 kV side of the system for the case of backflashover with 400 and 15.75 kV surge arrestor. . . . . . . . . . . . . . 48
4.25 Transient voltage at the 6 kV side of the system for the case of backflashover with 400, 15.75 and 6 kV surge arrestor. . . . . . . . . . . . 49
4.26 Transient voltage at 0.4 kV side of the system for the case of backflashover with 400, 15.75 and 6 kV surge arrestor. . . . . . . . . . . . 49
A1 Frequency response analysis of HV side of power transformer . . . . 56A2 Frequency response analysis of LV side of power transformer . . . . . 57A3 Frequency response analysis between LV & HV windings of power
transformer . . . . . . . . . . . . . . . . . . . . . . . . . . . . . . . . 58A4 Frequency response analysis between LV & HV windings of power
transformer . . . . . . . . . . . . . . . . . . . . . . . . . . . . . . . . 59B1 Non linear characteristic of non-linear element A0 . . . . . . . . . . . 60B2 Non linear characteristic of non-linear element A1 . . . . . . . . . . . 61

viii
List of Tables3.1 RLC parameters of the Power Transformer . . . . . . . . . . . . . . . 163.2 RLC parameters of the Transformer . . . . . . . . . . . . . . . . . . . 193.3 Surge Arrestor Electrical Data . . . . . . . . . . . . . . . . . . . . . . 223.4 Cable Electrical Data . . . . . . . . . . . . . . . . . . . . . . . . . . . 294.1 Summary of voltage peak for all cases . . . . . . . . . . . . . . . . . . 50B2 V-I characteristic of A0 and A1 . . . . . . . . . . . . . . . . . . . . . 60

1 Introduction
1.1 Introduction
Lightning is a meteorological process that has adverse effects on human life. Con-sidering electrical power system point of view, system has to be protected againstlightning as huge part of it is exposed to lightning. Components of the power systemcan be exposed to the transient over-voltages occurring due to the lightning stroke.These over-voltages, are of high magnitude and can cause damage to the connectedequipment when necessary protection is not enabled against the lightning surges.Lightning has been one of the the major cause of power outage and has significantdamage to the power system and its components. This effects the power quality andthe reliability of the system.
The investigation of the lightning surge is necessary to ensure a reliable power systemoperation as the over voltage caused by the lightning surge is the prime factor con-sidering the insulation coordination of the power system apparatus and protectionof transmission and substation equipment. Generally, there are two ways throughwhich lightning causes damage to the power apparatus: (i) lightning increases thevoltage across the equipment in such way that the equipment terminals spark-overresulting in short circuit or voltage puncture through the electrical insulation ofthe apparatus resulting in permanent damage. (ii) melt down or fracture of theapparatus, when the energy handling capacity of apparatus lags the energy of thelightning stroke. The equipment used and connected in the network have a definedbasic insulation level (BIL) and when the over-voltage exceeds the defined limit,insulation breakdown occurs and the equipment fails. There are number of strokeswithin a lightning flash which reduces negative or positive charges from cloud to theground. The first lightning stroke is more extreme than the later strokes. Small cur-rent continuously flows between two strokes which results in the increase of energyinjecting the object.
This thesis deals with the transient over-voltage transferred to the medium andlow voltage side of the electrical system of a power plant when the high voltage sideof the system is subjected to a lightning stroke. The study is carried out using Al-ternative Transient Program (ATP), a version of electro magnetic transient program(EMTP). The study presented in this work analyses the transient over-voltage ofa 400-15.75-6-0.4 kV system under the scenario of direct stroke and back flashover.Power transformer of rating 300 MVA, 415/15.75 kV and distribution transformersof rating 25 MVA and 1 MVA with low voltage side rating of 6 kV and 0.4 kV respec-tively are used in the study. The maximum amount of lightning current enteringthe phase wire before the insulator flashovers is analyzed and the same current isused in the simulation for the case of direct stroke. Also, lightning current of 200kA,1.2/50µs is used for the case of direct stroke and result is analyzed with the caseof back flashover. For the case of back flashover, step voltage impulse of 1640 kV isapplied to the phase conductor. This voltage corresponds to the flashover voltage

2
of the insulator string.
1.2 Thesis Objectives
The objective of this thesis are as:-
i. To study and analyze the transferred transient over-voltage due to direct andindirect stroke with different combination of protective surge arrestors in elec-trical network of a power plant.
ii. To study and model the different components of the system.
iii. To simulate and analyze the transferred transient over-voltage of a 400/15.75/6/0.4kV network using EMTP/ATPDraw software
iv. To ensure if the transient over-voltage at the 15.75 kV and 6 kV side of thesystem is within the protective level (basic insulation level) of the connectedequipment.
There are two ways in which the transient voltage is generated from the lightningstroke in a electrical system.
i.) Direct Stroke
ii.) Indirect Stroke
1.3 Scope of the Work
The scope of the work can be distributed in several parts. The modelling andsimulation are done with the Electro Magnetic Transient Program (EMTP). Thetransferred transient voltage to the 15.75 kV, 6 kV and 0.4 kV side due to the directand indirect stroke on 400 kV transmission line entering the substation is stud-ied. The protective measures for the mitigation of transient over-voltage transferredto the medium and low voltage side of the network with different arrangement ofprotective surge arrestor is also analyzed.
1.4 Thesis Organization
The thesis has been organized into five chapters mainly.
Chapter 1: This chapter presents the general introduction, effects, causes andimportance of transient over-voltage studies for protection of system and connectedequipment. The chapter also includes the objectives and scope of the thesis.
Chapter 2: This chapter presents the theoretical information regarding differenttypes of transients, causes of the transients, and types of lightning stroke.

3
Chapter 3: This chapter is related with the modelling of the different compo-nents of the power system used for the transient studies such as Power Transformer,Surge Arrestor, Transmission Tower, Distribution Transformer and Cable.
Chapter 4: This chapter presents the simulation studies for different cases oflightning stroke with several arrangements of surge arrestors and the results of thesimulation.
Chapter 5: This chapter analyzes the results of the simulation for different casesand presents the conclusion of the thesis.

4
2 Literature Review
2.1 Transient Over-voltage
An electrical transient is defined as the action of sudden change in the circuit condi-tion which may occur due to switch opening or closing or due to occurrence of faulton a system. The period of transition is very short. During this time, the systemcomponents are subjected to tremendous stresses from current or voltage [1].Transient over-voltages are usually short duration, high magnitude voltage peakswith fast rising edges, referred as surges. The main cause of the transient over-voltages are the lightning strokes which may result in complete outage of an unpro-tected system. Electrical equipments are subjected to continuous stress by multipletransients due to switching operations of inductive loads such as motors, transform-ers etc. Switching transients are the result of short-circuit current interruption.These transients are of low magnitude than the lightning transients[2].
2.2 Causes of Transients
The main causes of the transients in power system can be classified into naturaland technical cause. The natural cause is associated with the lightning stroke andswitching transients are concerned with the technical cause.
Depending upon the shape of the waveform, transients are further classified into:
1. Impulsive Transients: It is associated with the abrupt change in the steadystate condition of current, voltage or both in either positive or negative orboth direction [3]. These transients are analyzed by rise and decay time ofthe transient. The effects of these transient are localized as the transients aredamped instantly by the resistive element of the circuit.Impulsive lightning strikes are the main cause of impulsive transients. Thesetransients have a sudden rise followed by an exponential decay.
2. Oscillatory Transients: Oscillatory transient is associated with the suddennon-power frequency change in the steady state condition of current, voltageor both which includes both positive and negative polarity [4]. These tran-sient oscillate at the natural system frequency. These transients show dampedoscillation with frequency range from few hundred Hertz to Mega Hertz. Os-cillatory transients are dominant over impulsive transient as the oscillatorytransients are natural transients. These transients generally occur during ca-pacitor energizing and transmission line energizing.

5
Figure 2.1: Current Impulse transient due to lightning stroke [4].
Figure 2.2: Oscillatory Transient waveform [4].

6
2.3 Lightning Stroke
There are two types of lightning strokes that generates transient voltage in a powersystem:
1. Direct Stroke: During direct stroke, the lightning stroke strikes the phaseconductor of the connected transmission line of the network which results ingeneration of a travelling voltage wave. This voltage is impressed along theterminals of the connected equipment or across the insulator at the end of theline span [8]. The over-voltage propagates through the cable throughout theentire substation causing damage to the equipment along the way. In directstroke, when it strikes an apparatus, it will be permanently damaged. Thepresence of the ground wires decreases the probability of the phase conductorbeing hit by a direct lightning stroke. When the lightning strikes the phaseconductor, the current I(t) divides into two equal halves. This current travelsin both directions of the conductor. The corresponding travelling voltage waveis:
V (t) = 0.5I(t)Zp
where Zp is the surge-impedance of the phase conductor, Zp =√L/C, L and
C are the series inductance (H/m) and capacitance (F/m) per meter.
Figure 2.3: Direct Stroke [5].
2. Indirect Stroke: In indirect stroke, the lightning stroke strikes the trans-mission tower or the shield wire resulting in generation of a travelling voltagewave which travels back and forth. This voltage wave is reflected at the towergrounding and at the top of tower which raises the voltage at the tower cross-arm and the insulator string is stressed. Insulator flash-over will occur resultingin short-circuit of the system when the voltage is high enough. Power linesare equipped with shield wire to protect the phase conductor. Back flashoveroccurs across the insulator string when the transient voltage exceeds the light-ning withstand voltage of the insulator [8]. Generation of back flashover occurs
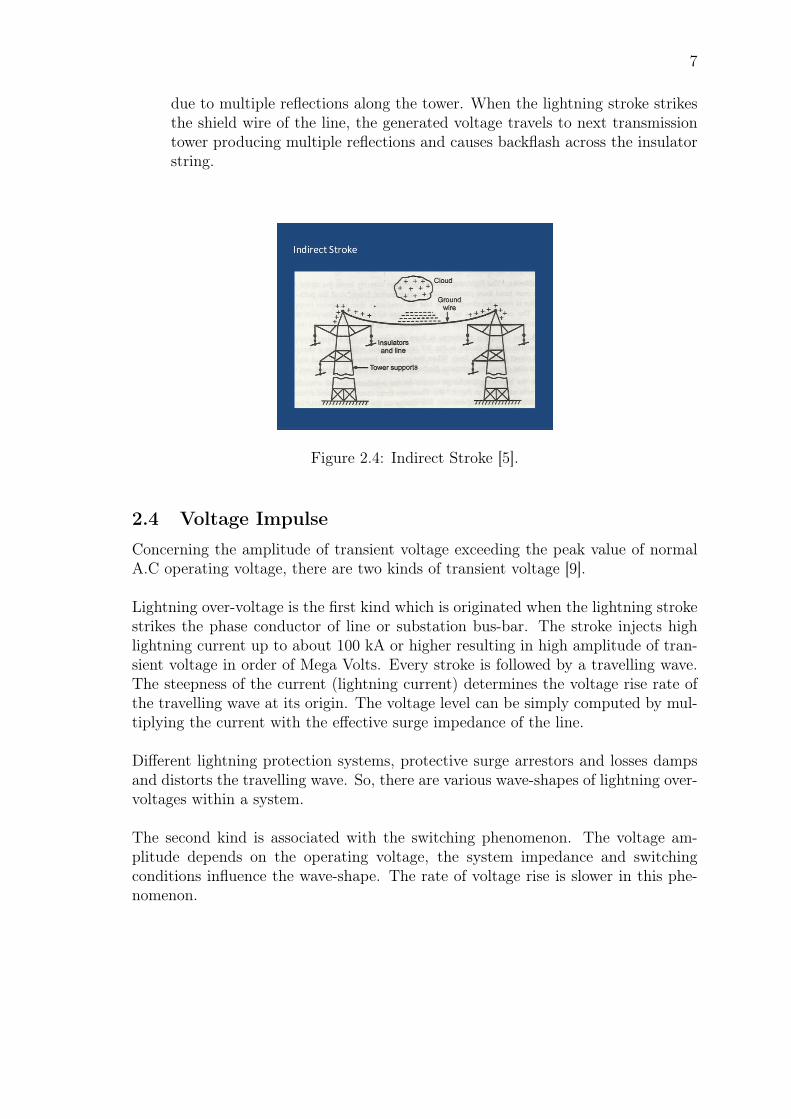
7
due to multiple reflections along the tower. When the lightning stroke strikesthe shield wire of the line, the generated voltage travels to next transmissiontower producing multiple reflections and causes backflash across the insulatorstring.
Figure 2.4: Indirect Stroke [5].
2.4 Voltage Impulse
Concerning the amplitude of transient voltage exceeding the peak value of normalA.C operating voltage, there are two kinds of transient voltage [9].
Lightning over-voltage is the first kind which is originated when the lightning strokestrikes the phase conductor of line or substation bus-bar. The stroke injects highlightning current up to about 100 kA or higher resulting in high amplitude of tran-sient voltage in order of Mega Volts. Every stroke is followed by a travelling wave.The steepness of the current (lightning current) determines the voltage rise rate ofthe travelling wave at its origin. The voltage level can be simply computed by mul-tiplying the current with the effective surge impedance of the line.
Different lightning protection systems, protective surge arrestors and losses dampsand distorts the travelling wave. So, there are various wave-shapes of lightning over-voltages within a system.
The second kind is associated with the switching phenomenon. The voltage am-plitude depends on the operating voltage, the system impedance and switchingconditions influence the wave-shape. The rate of voltage rise is slower in this phe-nomenon.

8
There are two parameters that characterizes the impulse waves [9].
1. Front Time
2. Tail Time
Front Time: It is the time by which the wave reaches the peak staring from zero.
Tail Time: It is the time by which the wave reaches 50% of the peak value startingfrom zero.
A standard lightning impulse has:-
Front Time: 1.2µs± 30%Tail Time : 50µs± 20%
An empirical formula is used to determine the front time as shown in Figure 2.5[9].
Figure 2.5: Waveform of standard lightning voltage impulse [9].

9
2.5 Current Impulse
During direct lightning stroke, the striking medium establishes a direct electricaldischarge between the cloud and the ground. A current impulse is generated as thedischarge is generally a flow of electrons. Figure 2.6 shows a 8/20 µs current impulsewaveform.
Figure 2.6: 8/20 µs current impulse waveform [9].

10
3 Modelling
3.1 Power Transformer Modelling
In order to investigate the transmitted transient over-voltage through the trans-former, high frequency model of transformer is necessary. This is necessary as thebehaviour of transformer is frequency dependent. Power transformer of rating 300MVA, 415/15.75 kV is used for the study purpose. Studies suggest that the be-haviour of transformer being frequency dependent should be taken in account forthe simulation of high frequency transients. Several high frequency transformermodels have been developed for EMTP [10].
Basically there are two main methods for the modelling of transformer [11]. Thefirst method is based on the mechanical description and geometry of the transformer.This method is quite challenging as the transformer has complicated physical struc-ture. It is difficult to obtain the detailed mechanical description of the transformerexcept for the manufacturers and the calculation is extensively difficult. The sec-ond method is based on the measurement results obtained in the frequency domain.Measurements are carried out in the transformer and the admittance function arecalculated. The behaviour of transformer for high frequency introduces resonancebecause of the capacitive and inductive coupling between the windings, classicalmodels of transformer cannot be used.
In this work the measurement data obtained from the frequency response analy-sis (FRA) of the transformer is used for the modelling. The FRA of the transformerused in the thesis are in Appendix A. FRA has been generally used for the diagnosispurpose of the transformer but it is also appropriate for the transients study in powersystems [6]. Transferred transient over-voltage through the transformer completelydepends on inductive and capacitive coupling of the windings. Measurement dataobtained from the end to end connection arrangement is used. Admittance of thewinding is calculated depending upon the data obtained in the frequency domain.
Frequency is in the range of 10 Hz to 10 MHz. The frequency range of FRA can besubdivided as:-
i. In the low frequency range (<20 kHz), transformer winding response is domi-nated by inductive components.
ii. In the medium frequency range (20-400 kHz), multiple resonance occur due tocombination of inductive and capacitive components.
iii. In the high frequency range (>400 kHz), transformer winding response is dom-inated by the capacitive components.
A power transformer model over wide frequency range has been developed for EMTP[12]. In order to obtain a suitable model for studying the transient response of trans-former, the obtained data from the FRA should be converted to admittance response.

11
Figure 3.1: FRA end to end test setup [7].
From this computed admittance response, equivalent circuit of transformer is ob-tained. The FRA data consist of the magnitude and phase angle plot. These dataare in the form.
|FRA|dB = 20log
∣∣∣∣VoutVin
∣∣∣∣ (1)
∠FRA = ∠VoutVin
(2)
Considering the internal impedance of the measuring instrument to be 50Ω.From Figure 3.1 the coil impedance is:
VoutVin
=50
50 + ZTx
ZTx is the coil impedance of the transformerSo,
VinVout
=50 + ZTx
50
VinVout
.50 = 50 + ZTx
ZTx =VoutVin
.50− 50

12
Let|H| =
∣∣∣∣VoutVin
∣∣∣∣and
∠H = ∠VoutVin
(3)
Then
ZTx = 50
(1
|H| e∠VoutVin
− 1
)
ZTx = 50
(1− |H| e∠
VoutVin
|H| e∠VoutVin
)
The admittance can be computed using
YTx =1
50
(|H| e∠
VoutVin
1− |H| e∠VoutVin
)(4)
Using the frequency response data, the admittance for the high voltage side, lowvoltage side and the coupling between high voltage and low voltage are calculated.To calculate the circuit parameters of the three phase winding of the HV side, thefirst value of corresponding admittance of three phase at frequency 20.05 Hz isconsidered.Using the relation shown in equation (4), we get
YH1 = 4.364 ∗ 10−7 − 1.999 ∗ 10−4jS
YH2 = 3.395 ∗ 10−6 − 1.360 ∗ 10−4jS
YH3 = 5.838 ∗ 10−5 − 1.899 ∗ 10−4jS
So,
ZH1 = 109.157 + 5000.11 jΩ
ZH2 = 183.438 + 7348.36 jΩ
ZH3 = 1479.08 + 4811.22 jΩ
Since the impedance of ZH1 is inductive at low frequency, thus
LH1 = 5000.11/ (2πf) = 39.69 H

13
First resonance of the admittance response should be known to calculate the capac-itance value. The first resonance frequency is
fHR = 4560 Hz
The capacitance is given by
fHR =1
2π√LH1CH1
CH1 = 3.069 ∗ 10−5 µF
For the low voltage side, the first value of admittance at frequency 20.05 Hz is con-sidered.
YL1 = 7.0482 ∗ 10−3 − 0.0291jS
YL2 = 4.1058 ∗ 10−3 − 0.0218jS
YL3 = 3.139 ∗ 10−3 − 0.0212jS
So,ZL1 = 7.862 + 32.46 jΩ
ZL2 = 8.343 + 44.30 jΩ
ZL3 = 6.834 + 46.157 jΩ
The impedance of ZL1 is inductive at low frequency, thus
LL1 = 32.46/ (2πf) = 0.2577 H
The first resonance frequency is
fLR = 5250 Hz
The capacitance is given by
fLR =1
2π√LH1CH1
CL1 = 3.566 ∗ 10−3 µF
For the capacitive coupling between the HV and LV winding of the transformer, the

14
first value of admittance at frequency 20.05 Hz is considered.
YC1 = 2.64 ∗ 10−8 + 99.86 ∗ 10−7jS
So,ZC1 = 27147− 1013468.928 jΩ
The impedance of ZC1 is capacitive at low frequency, thus
1
2πfCC1
= 1013468.928
CC1 = 7.83 ∗ 10−3 µF
In addition, due to the inductive coupling of the winding, the capacitive effect ofthe HV side will be transferred to the LV side through the stray inductance. Con-sidering the second resonance frequency from the FRA analysis of the LV side.
YHC = 0.035981− 0.0271jS
So,ZHC = 17.71965 + 13.359 jΩ
The second resonance frequency is
fLR = 170, 000 Hz
The impedance of ZHC is inductive at this frequency, thus
LLC = 13.359/ (2πf) = 0.0000125 H
The capacitance is given by
fLR =1
2π√LLCCLC
CLC = 7.008 ∗ 10−2 µF

15
These values of inductance and capacitance are lumped in order to build a RLCnetwork of the transformer. The transformer model is represented as shown in Fig-ure 3.2.
Figure 3.2: High frequency power transformer model.
Capacitance (C1-C3) and inductance (L1-L3) as shown in Figure 3.2 accounts for thewinding self capacitance and inductance of the HV winding respectively. Similarly,capacitance (C4-C6) and inductance (L4-L6) represents the winding self capacitanceand inductance of the LV winding respectively. Capacitance (C7-C9) is the couplingcapacitance between HV and LV winding. Capacitance (C10-C12) represents thecapacitive effect of the HV side transferred to the LV side through the stray induc-tance.

16
The RLC parameters of the transformer model are as:
Table 3.1: RLC parameters of the Power TransformerComponent Value
R1 0.8231 OhmR2 0.8235 OhmR3 0.8236 OhmR4 0.001053 OhmR5 0.001053 OhmR6 0.001053 OhmR7 1 OhmL1 39.69 HL2 58.34 HL3 38.19 HL4 0.257 HL5 0.351HL6 0.366 HC1 3.069*10−11FC2 2.088*10−11FC3 3.190*10−11FC4 3.57*10−9FC5 2.61*10−9FC6 2.508*10−9FC7 7.008*10−8FC8 7.008*10−8FC9 7.008*10−8FC10 7.83*10−9FC11 7.83*10−9FC12 7.83*10−9F
In order to validate the transformer model, voltage impulse of 500 kV , 1.2/50µswas applied in the HV of the transformer and the transferred transient voltage ismeasured in the LV side. The following voltage response shown in Figure 3.3 and3.4 were obtained.

17
0 0.2 0.4 0.6 0.8 1(ms)0
100
200
300
400
500
(kV)
Figure 3.3: Transient over-voltage in HV of the transformer.
0 0.2 0.4 0.6 0.8 1(ms)0
10
20
30
40
50
60
(kV)
Figure 3.4: Transient over-voltage transferred to LV of the transformer.

18
3.2 Medium Voltage Transformer Modelling
Concerning the medium voltage transformer, a high frequency model has been pro-posed by A.Sabiha [13]. This model is suitable for both loaded and unloaded condi-tions of transformer. The same model has been used in this work for the simulation.This model is based on impedance parameter two-port network theory. The impedanceparameters are computed accordingly with input port and output port open cir-cuited. Fourier algorithm is applied on the recorded voltage and current duringmeasurement and the impedance parameters are obtained as a function of frequency.According to the behaviour of the impedance in frequency domain, impedance canbe converted to RLC component. First and second resonance frequencies are takeninto consideration for the computation of RLC parameters. With both resonancefrequencies taken in account, the equivalent circuit obtained is same. This modelhas a considerable agreement between the simulated and experimental results. So,this model can be therefore used for the transient behaviour of transformer duringlightning strokes.
Figure 3.5: High frequency transformer model [13].

19
The R,L and C parameters of the transformer are as[13]:
Table 3.2: RLC parameters of the TransformerComponent Value
R1 500 OhmR2 558.54 OhmR3 1000 OhmR4 1*10−6 OhmR5 50 OhmR 1500 OhmL1 0.00856 mHL2 0.0046 mHL3 0.0368 HL4 0.0482 HC1 2.1063*10−8FC2 3.02*10−9FC3 5.12*10−9FC4 2.216*10−10FC5 4.22*10−10FC6 1.91*10−10F

20
3.3 Surge Arrestor Modelling
Surge protection devices have an important role for the mitigation of the over-voltagedue to lightning. This chapter presents the modelling of the surge arrestor usingthe Pinceti et al.Model where the modal parameters are evaluated. There are mul-tiple models developed to analyze the behaviour of surge arrestor when subjectedto different kind of electrical stress [14, 15]. The main problem of the models is theidentification of the modal parameters. The mostly used models are presented here.
i. Frequency Dependent Model (IEEE Model)
This metal oxide surge arrestor model has been recommended by IEEE work-ing group 3.4.11 [14].
Figure 3.6: Frequency dependent model [14].
The non-linear resistors (A0 and A1) represent the non-linearity of the ar-restor. These non linear resistor are separated by a R-L filter. The impedanceof the filter is very less under slow front surges but during fast front surges theimpedance increases resulting in high current flow in A0 than A1. Therefore,the voltage of A0 is higher than A1, so the arrestor excites with the increasingvoltage. Hence, using two sections in the modelling has been found enough foraccurate modelling of the surge arrestor.
ii. Pinceti et al.Model
This is the simplified model derived from the IEEE model [15]. Only twoinductances (L0 and L1) are used while the resistive elements are eliminated.To avoid the numerical instability, a high resistance of 1MΩ is added. Thismodel does not consider any physical characteristics and only the electricaldata are used for determining the modal parameters. The two inductances ofthe model are defined as:

21
L1 =1
4.Ur1/T2 − Ur8/20
Ur8/20
.Un
L0 =1
12.Ur1/T2 − Ur8/20
Ur8/20
.Un
Here, Un is the rated voltage of the arrestor in kV, Ur1/T2 is the residual voltageat 10 kA fast front current surge (1/T2µs) and Ur8/20 is the residual voltageat 10 kA current surge with (8/20µs) time.
Figure 3.7: Pinceti et al.model [15].
The Ur1/T2 data is difficult to obtain in most of the data sheets which is themain challenge associated with this model. A method has been devised in [13]to overcome this difficulty and calculate the modal parameters.
L0 = 0.01Un (5)
L1 = 0.03Un (6)
In this work, Pinceti et al. model is used for the modelling of the surge arrestor.The modal parameters (inductances) are computed using the relations (5) and (6).400 kV, 15.75 kV and 6 kV surge arrestor are modelled to be used in the simulation.The electrical data of the surge arrestor used are as listed in Table 3.3. The non-linear characteristic of the surge arrestor are presented in Appendix B. The V-Icharacteristic of A0 and A1 are listed in Table B1 and B2 respectively.

22
Table 3.3: Surge Arrestor Electrical Data
Surge
Arrestor
(kV)
Classification
kA
Rated
Voltage
kV
Max.
COV
kV
TOV
for 1 sec
kV
Maximum Residual Voltage
8/20 µs
10 kA
kV Crest
8/20 µs
20 kA
kV Crest
6 10 8.8 7 9.5 21.5 23.8
15.75 10 24 19 27.4 58.4 73.8
400 20 336 269 394 808 881
For the 400 kV surge arrestor, the value of L0 and L1 are found 0.00272 and0.00816 µH respectively.
The model is simulated in ATP with a discharge current of 8/20µs, 20 kA injected tothe surge arrestor. A resistance of 1MΩ is connected in parallel. An error of 8.6 %was observed in the residual voltage between the simulated result and manufacturerdata sheet. The error was computed using (Ups − Up)/Up. The modal parametersobtained were taken as the initial values and tuning of the parameters was done.The new parameters were found to be L0 = 0.01 mH and L1 = 0.0055 mH. Theerror for the residual voltage reached 0.14 %.
Similarly, the modal parameters for the 16 kV surge arrestor are L0 = 0.00019mH and L1 = 0.00057 mH. Likewise, the parameters for 6 kV surge arrestor are L0
= 0.00007 mH and L1 = 0.00021mH.
The wave-forms of the injected current, residual voltage and absorbed energy are asshown in Figure 3.8, 3.9 and 3.10 respectively.

23
0 0.02 0.04 0.06 0.08 0.1(ms)0
4
8
12
16
20
(kA)
Figure 3.8: Injected current.
0 0.02 0.04 0.06 0.08 0.1(ms)0
150
300
450
600
750
900
(kV)
Figure 3.9: Residual voltage.

24
0 0.2 0.4 0.6 0.8 1(ms)0
100
200
300
400
500
(kJ)
Figure 3.10: Absorbed energy.
3.4 Transmission Tower Modelling
When a transmission tower is hit by a lightning stroke, a travelling voltage is gen-erated. This generated voltage travels back and forth along the tower and whenreflected at the ground and top of tower, the voltage at the cross arm increasesresulting stress in the insulator string[16]. Insulator are subjected to flashover whenthe transient voltage due to lightning exceeds the lightning withstand voltage of theinsulator. This flashover is termed as the backflash over.In order to study the induced voltage across the insulator string when subjected toa lightning stroke, a model of the tower is developed. 400 kV double circuit towerconfiguration is used for the study [17]. Estimation of the surge impedance and thepropagation velocity (Co) is done and implemented in a multistory tower model asshown in Figure 17. Every parts of the tower is represented by distributed parame-ter model.The data of the tower structure are H1 = 21.82 m, H2 = 4.71 m, H3 = 16 m and H4= 4340 m [17]. Tower surge impedance 450Ω is used for Z1, Z2 and Z3 and 200Ωis used for Z4. Tower footing resistance (Zf) of 40Ω is used in the study. Likewise,surge propagation velocity of 300 m/µs and attenuation coefficient (α) along thetower 0.89 are taken.R and L shown in Figure 3.11 represents the resistance and inductance of the trans-mission tower.Calculation of the modal parameters:
Z1 = Z2 = Z3 = 450Ω , Z4 = 200Ω

25
Ri =−2Zi.lnα
H1 +H2 +H3.Hi (7)
R4 = −2Z4.lnα (8)
Li = α.Ri2H
Co
(9)
H = H1 +H2 +H3 +H4
Using the relation (7-10), we get
R1 = 21.43 Ω , R2 = R3 = 39.50 Ω , R4 = 44.64 Ω
L1 = 5.98 µH , L2 = L3 = 11.03 µH , L4 = 12.47 µH
Figure 3.11: Multistory tower model. [16]

26
Lightning Source Model
The magnitude of impulse current due to lightning discharge is a function of prob-ability [18]. The low discharge levels with lightning current between 5 and 22 kAmostly cause the lightning stroke to strike the phase conductor directly. In thiscase, the maximum lightning current which may enter the phase conductor withoutflashover of the insulator string is found to be 26.6 kA. However, the lightning im-pulse current of larger magnitude may hit the top of tower or shield wire and resultin backflash over across the insulator string.In this work, lightning source is modeled by a current source and a resistance inparallel for the case of direct stroke. This resistance represents the impedance of thelightning path. The impedance is taken to be 400Ω. Step Voltage impulse of 1640kV is used for the case of back flashover.
Figure 3.12: Lightning source model.
27
Back Flashover Model
The shield wires are placed in the top of tower to reduce the number of light-ning strokes terminating on the phase conductor. Back flashover occurs when thepotential of tower exceeds the lightning impulse withstand voltage or the BIL of theinsulator string [8]. Insulator string can withstand impulse voltage of high magni-tude having short duration even if the insulator string fails to withstand impulsevoltage of long duration.The critical flashover voltage for the 400 kV insulator string is taken as 1640 kVin this study [19]. The impulse withstand voltage of the insulator string can becalculated using [20].
Vf0 = K1 +K2
t0.75(10)
where, Vf0 is the flashover voltage in KVK1 is 400*LK2 is 710*LL is the length of the insulator stringt is the time elapsed after lightning stroke in µs
There are multiple factors influencing the induced voltage during back flashoverwhich are as listed below:
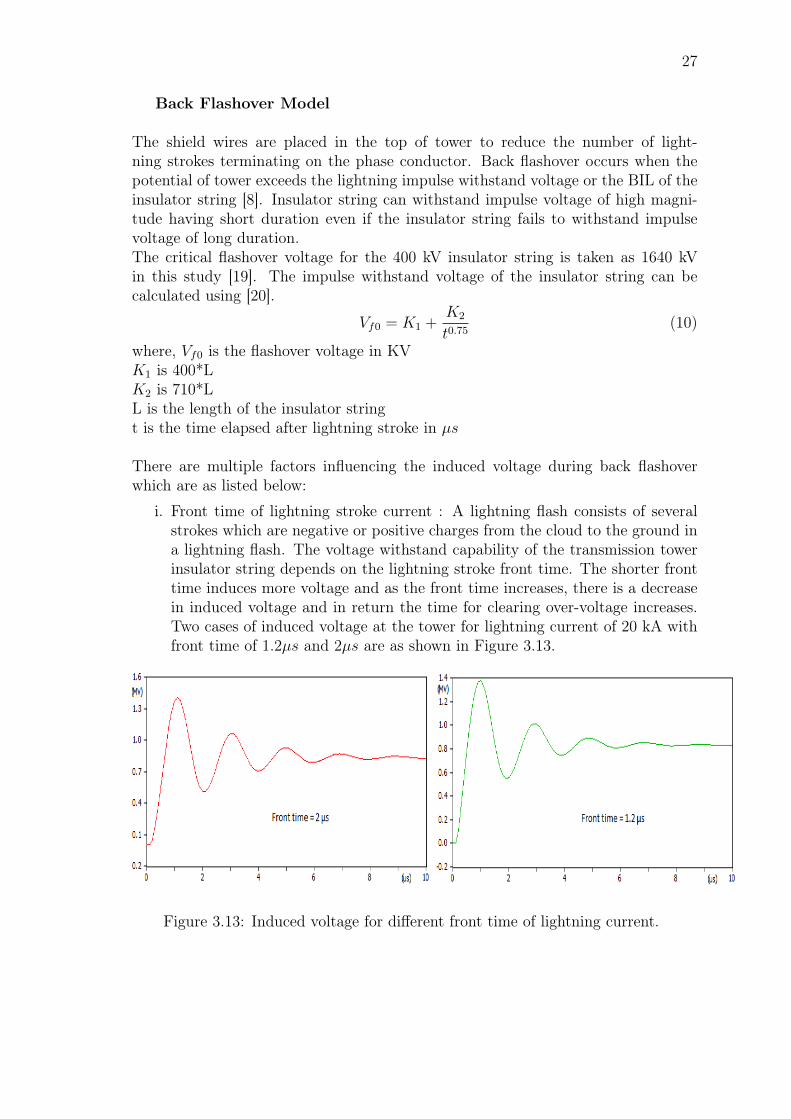
i. Front time of lightning stroke current : A lightning flash consists of severalstrokes which are negative or positive charges from the cloud to the ground ina lightning flash. The voltage withstand capability of the transmission towerinsulator string depends on the lightning stroke front time. The shorter fronttime induces more voltage and as the front time increases, there is a decreasein induced voltage and in return the time for clearing over-voltage increases.Two cases of induced voltage at the tower for lightning current of 20 kA withfront time of 1.2µs and 2µs are as shown in Figure 3.13.
Figure 3.13: Induced voltage for different front time of lightning current.

28
ii. Striking Distance: With a increase in the striking distance the magnitude ofthe induced voltage decreases. The induced voltage is highest at the point nearto the lightning stroke and is lower at far location from the point of lightningstroke.
iii. Peak of the lightning current: The induced voltage peak increases with theincrease in peak of the lightning current.
iv. Tower Footing Resistance: The voltage across the insulator string is affectedby the tower footing resistance. Higher the tower footing resistance, higher isthe voltage across the insulator string causing back flashover of the insulatorstring.
Although there are many factors responsible for the induced voltage due to backflashover, in this study the front time of the lightning stroke used is fixed i.e 1.2/50µsfront and tail time respectively. Also, the dead end transmission tower i.e. the towerclose to the power transformer is used in the study. Likewise, the peak of the light-ning current and tower footing resistance are fixed for the study.
The maximum amount of lightning current that can enter the shield wire duringdirect strike is analyzed concerning the back flashover of the insulator. The max-imum amount of lightning current was found to be 26.6 kA, 1.2/50µs . Lightningcurrent above this magnitude will cause the flashover of the insulator as the voltageacross the insulator string exceeded the critical flashover voltage of the insulatorconsidered in the thesis. Lightning current of 26.6 kA, 1.2/50µs is used for the caseof direct strike in the study. Also, the maximum amount of lightning current thatcan enter the phase wire of 400 kV line through the shield wire was observed to be20 kA. This current is also used as a lightning source in the simulation.

29
3.5 Power Cable Modelling
The cable impedance has an influence on the transient over-voltage. In order totake the effect of the cable impedance on the over-voltage, the cables used in thenetwork have to be modelled suitable for using in EMTP. The cable capacitanceplay a vital role in the transient over-voltage being transferred and somehow limitthe over-voltage. Frequency dependent model of cable are required in order to studythe transient over-voltage. There are several cable models available in EMTP [24].PI model of cable is used in this study for representing the cable connected between6 kV of transformer and the 6 kV bus-bar. Likewise, the cable connection betweenthe 6 kV bus-bar and the 6/0.4 kV transformer are also taken into account.AHXCMK 1*800, 6/10 kV, 800 sq. mm are used for the connection between 6 kVside of the transformer and the 6 kV bus-bar. 4 cables per phase are used for theconnection. The R,L and C parameters of the cable are used according to the elec-trical data sheet of the cable [21]. A Pi-model of the cable is used using the R,Land C data of the cable.
Figure 3.14: Pi-equivalent model of cable.
Cable type AHXAMK-W 3*185Al +35Cu 6/10 kv, 185 sq.mm is used for theconnection between 6 kV busbar and the 6/0.4 kV transformer. Cable length of 100m is used for upstream connection while 50 m for the downstream connection. TheR,L and C parameters of these cable are used according to the data provided in theelectrical data sheet [22]. The electrical data of the cable is listed in Table 3.4.
Table 3.4: Cable Electrical DataCable R (Ω/km) L (mH/km) C (µF/km)
AHXCMK(1*800)
0.067 0.46 0.75
AHXAMK-W(3*185Al+35 Cu)
0.21 0.34 0.39

30
4 Simulation
4.1 EMTP-Introduction[23]
The Electro Magnetic Transient program (EMTP) is a software tool used to inves-tigate the electromagnetic transients and the insulation issues associated with it. Itis a tool used by the electrical power system engineers. This tool has wide rangeof modelling capabilities holding electro-mechanical and electromagnetic oscillationsin time duration of microseconds. It is generally used for the transient study suchas switching surge, lightning surge, insulation coordination, HVDC converter.
It was developed by Hermann Dommel at the Bonneville Power Administration(BPA) in the late 1960s. the program initially consist of around 5000 lines of codewhich was basically used for the transmission line switching studies. The initialprogram was difficult to use and one had to have advanced knowledge about EMTPfor grasping its capabilities.
Modification and advancement was done in the initial program and Version 2.0appeared in 1989. This version included significant enhancement to the base code.The enhancement were multi-port frequency dependent equivalent network, multi-frequency initialization, circuit breaker arc model, arrestor models and air-gap.
The current version is 3.0 having enhancement in transformer model (high fre-quency), dc converter bridge model, 3-phase load flow module, line and cable models,corona models, protection system models.
4.2 ATP Draw [24]
The Alternative Transient Program (ATP) is the most widely used program toolfor the digital simulation of electromagnetic and electro-mechanical nature of thetransient phenomenon.
ATPDraw is a graphical, mouse-driven pre-processor to the ATP version of the Elec-tromagnetic Transients Program (EMTP) on the MS-Windows platform. The pro-gram is written in CodeGear Delphi 2007 and operates withWindows 9x/NT/2000/XP/Vista. ATP Draw allows the user to build the electrical circuit by selecting the com-ponents from the huge palette. The simulation program ATP and different plottingprograms can be executed with ATPDraw. The ATP software can predict the var-ious outcomes in a electrical power network which may arise as a function of timespecially initiated due to some disturbances.
The ATP has number of available models such as transformers, surge arrestors,machines, cables and transmission lines. It has a interfacing capability to the mod-

31
ules TACS and MODELS that allows modelling of control system and componentshaving nonlinear characteristics such as corona and arcs. TACS and MODELS con-trol system allows simulation of dynamic system that does not consist any electricalnetwrok.
Symmetrical and unsymmetrical disturbances such as faults, lightning and differentswitching operations including commutation of valves are allowed. ATP also al-lows the frequency response calculation of the phasor networks. Frequency-domainharmonic analysis using harmonic current injection method (HARMONIC FRE-QUENCY SCAN). The model-library of ATP consists of the following components:
i. Coupled and uncoupled linear, lumped R,L,C elements.
ii. Cables and transmission line with frequency dependent and distributed pa-rameters.
iii Nonlinear inductances and resistances, hysteretic inductor, time-varying resis-tance, TACS/MODELS controlled resistance.
iv. Nonlinear components such as transformers with saturation and hystersis,surge arrestors and arc.
v. Normal, time and voltage dependent switches, statistical switching.
vi. Valves (diodes, thyristors, triacs), TACS/MODELS controlled switches.
vii Analytical sources: step, ramp, sinusoidal, exponential surge functions,TACS/MODELS defined sources.
viii Rotating machines such as 3-phase synchronous machine, universal machinemodel.
ix. User-defined electrical components including MODELS interaction.

32
4.3 Modelling and Simulation of the System
The transfer of surge from the high voltage to the medium voltage and low voltagenetwork in power system is considered to be the most frequent mechanism for theover-voltage generation in the connected load among all possible mechanism. Manystudies have been conducted to investigate the transient voltage caused by the light-ning stroke on the distribution line.
The various coupling possibilities have to be taken into consideration to interpretthe transient over-voltage transferring from high voltage to medium and low voltagenetwork.These possibilities are:-
i. high frequency coupling between the primary winding and secondary windingof power transformer and distribution transformer,
ii. induced over-voltage in the medium voltage network resulting from the injectedcurrent due to flashover across the high voltage insulator string.
This chapter presents the transient over-voltage transferred to the medium and lowvoltage network through the power transformer and distribution transformer. Useof the medium voltage and low voltage surge arrestor at the secondary of the powertransformer and distribution transformer is analyzed to mitigate the transient over-voltage coming from the high voltage side of the power transformer. The influenceof the surge arrestor on the medium and low voltage network connected load isanalyzed through the waveform and the peak voltage profile. BIL of the 15.75 kVgenerator and 6 kV motors are 68 kV and 29 kV respectively.
In order to investigate the transient over-voltage reaching the medium voltage andlow voltage side due to lightning stroke, an accurate model of the power transformer,distribution transformer, transmission tower and surge arrestor is required. An ac-curate and simplified model for the power transformer, distribution transformer,transmission tower and surge arrestor proposed in Chapter 3 is used in this chapter.The high frequency power transformer and distribution transformer model, trans-mission tower model,cable model and surge arrestor model are implemented in asingle arrangement in EMTP/ATPDraw.
The impact of the cable connecting the switchgears and equipment in the tran-sient over-voltage transfer is also taken into account.The simulation is performed using the lightning source of 26.6kA, 1.2/50µs for directstroke. Also, the simulation is performed with lightning current of 20kA, 1.2/50µsas this is assumed to be the maximum current that can enter the phase wire of the400 kV line due to the geometry of the line. A step voltage of 1640 kV is applied onthe phase condcutor for the case of back flashover.
The study of lightning induced over-voltage transferred to the medium and lowvoltage side (15.75 kV, 6 kV and 0.4 kV) of the network is done by analyzing the

33
voltage profile for different scenarios. The single line diagram of the network usedin the thesis is shown in Figure 4.1.
Figure 4.1: Single line diagram of the system.
The considered scenarios for the simulation are:
1. Direct Stroke
a. With 400 kV Surge Arrestor
b. With 400 kV and 15.75 kV Surge Arrestor
c. With 400 kV, 15.75 kV and 6 kV Surge Arrestor
2. Indirect Stroke
a. With 400 kV Surge Arrestor
b. With 400 kV and 15.75 kV Surge Arrestor
c. With 400 kV, 15.75 kV and 6 kV Surge Arrestor

34
The overall ATPDraw circuit used in the simulation is shown in Figure 4.2. Thepoints A1, B1, C1, D1, E1 and F1 in Figure 4.2 are the voltage measuring points forthe transmission tower voltage, insulator string voltage, 415 kV side voltage, 15.75kV side voltage, 6 kV side voltage and 0.4 kV side voltage of the circuit respectively.
Figure 4.2: Overall simulation model.

35
A capacitance of 360 nf per phase at the 15.75 kV bus is used in the simulationmodel as shown in Figure 4.2.
4.3.1 Direct Stroke
In this case the lightning current of 26.6 kA, 1.2/50µs is considered to directly strikethe 400 kV phase conductor of the transmission line. The study is carried out withdifferent combination of 400 kV, 15.75 and 6 kV surge arrestor implemented in thesystem and the corresponding transferred transient voltage at different points of thenetwork are analyzed.
1. With only 400 kV Surge ArrestorIn this case only 400 kV surge arrestor is used in the system and the corre-sponding transient voltage at different voltage levels are studied. Lightningcurrent of 26.6 kA,1.2/50µs is used. The transient voltages are as shown inFigure 4.3 to 4.7.
0 0.2 0.4 0.6 0.8 1(ms)-1
0
1
2
3
4
5
6
7(MV)
Figure 4.3: Voltage at the transmission tower before 400 kV surge arrestor operates.

36
0 0.02 0.04 0.06 0.08 0.1(ms)-0.2
0.2
0.6
1.0
1.4
1.8
(MV)
Figure 4.4: Transient voltage at the 415 kV side of the system for the case of 26.6kA lightning with 400 kV surge arrestor.
0 0.02 0.04 0.06 0.08 0.1(ms)-20
0
20
40
60
80
(kV)
Figure 4.5: Transient voltage at the 15.75 kV side of the system for the case of 26.6kA lightning with 400 kV surge arrestor.

37
0 0.02 0.04 0.06 0.08 0.1(ms)-10
-5
0
5
10
15
(kV)
Figure 4.6: Transient voltage at the 6 kV side of the system for the case of 26.6 kAlightning with 400 kV surge arrestor.
0 0.02 0.04 0.06 0.08 0.1(ms)-20
-15
-10
-5
0
5
10
(kV)
Figure 4.7: Transient voltage at the 0.4 kV side of the system for the case of 26.6kA lightning with 400 kV surge arrestor.
38
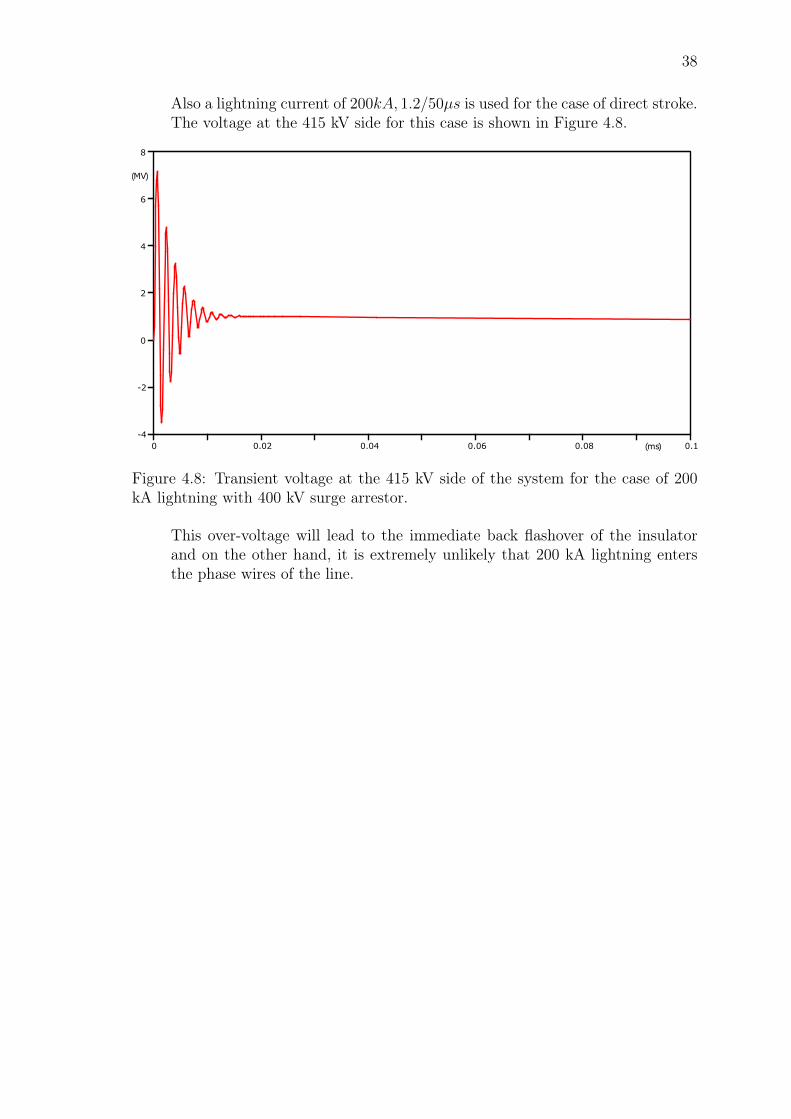
Also a lightning current of 200kA, 1.2/50µs is used for the case of direct stroke.The voltage at the 415 kV side for this case is shown in Figure 4.8.
0 0.02 0.04 0.06 0.08 0.1(ms)-4
-2
0
2
4
6
8
(MV)
Figure 4.8: Transient voltage at the 415 kV side of the system for the case of 200kA lightning with 400 kV surge arrestor.
This over-voltage will lead to the immediate back flashover of the insulatorand on the other hand, it is extremely unlikely that 200 kA lightning entersthe phase wires of the line.

39
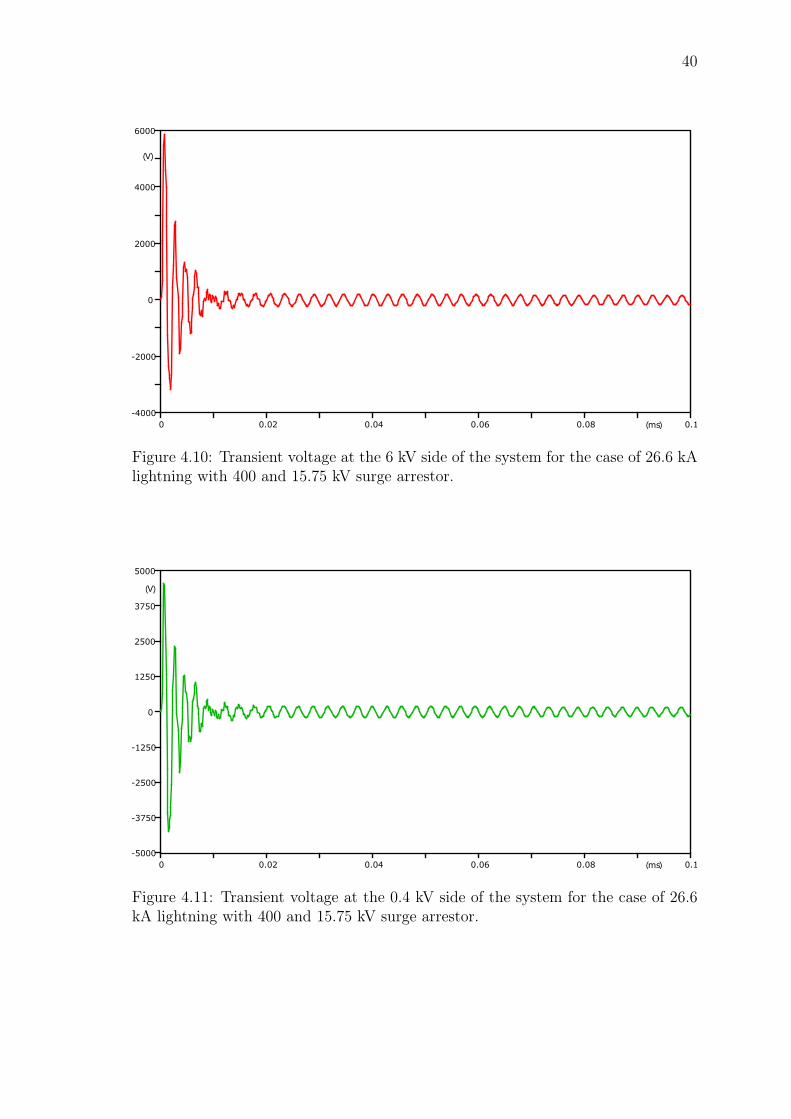
2. With 400 kV and 15.75 kV Surge Arrestor
In this case 400 kV and 15.75 kV surge arrestor are used in the system andthe corresponding transient voltage at different voltage levels are analyzed.Lightning current of 26.6 kA, 1.2/50µs is used. The transient voltages are asshown in Figure 4.9 to 4.11.
0 0.02 0.04 0.06 0.08 0.1(ms)-10
0
10
20
30
40
(kV)
Figure 4.9: Transient voltage at the 15.75 kV side of the system for the case of 26.6kA lightning with 400 and 15.75 kV surge arrestor.
40
0 0.02 0.04 0.06 0.08 0.1(ms)-4000
-2000
0
2000
4000
6000
(V)
Figure 4.10: Transient voltage at the 6 kV side of the system for the case of 26.6 kAlightning with 400 and 15.75 kV surge arrestor.
0 0.02 0.04 0.06 0.08 0.1(ms)-5000
-3750
-2500
-1250
0
1250
2500
3750
5000
(V)
Figure 4.11: Transient voltage at the 0.4 kV side of the system for the case of 26.6kA lightning with 400 and 15.75 kV surge arrestor.

41
3. With 400 kV, 15.75 kV and 6 kV Surge Arrestor
In this case 400 kV, 15.75 kV and 6 kV surge arrestor are used in the systemand the corresponding transient voltage at different voltage levels are analyzed.Lightning current of 26.6kA, 1.2/50µs is used. The transient voltages are asshown in Figure 4.12 to 4.13.
0 0.02 0.04 0.06 0.08 0.1(ms)-4000
-2000
0
2000
4000
6000
(V)
Figure 4.12: Transient voltage at the 6 kV side of the system for the case of 26.6 kAlightning with 400, 15.75 and 6 kV surge arrestor.
0 0.02 0.04 0.06 0.08 0.1(ms)-5000
-3750
-2500
-1250
0
1250
2500
3750
5000
(V)
Figure 4.13: Transient voltage at the 0.4 kV side of the system for the case of 26.6kA lightning with 400, 15.75 and 6 kV surge arrestor.

42
4. 20 kA lightning current with 400 kV and 15.75 kV Surge ArrestorIn this case the lightning current of 20 kA is taken with 400 kV and 15.75 kVsurge arrestor arranged in the system. The transferred transient voltages areas shown in Figure 4.14 to 4.16.
0 0.02 0.04 0.06 0.08 0.1(ms)-10
-5
0
5
10
15
20
25
30
(kV)
Figure 4.14: Transient voltage at the 15.75 kV side of the system for the case of 20kA lightning with 400 and 15.75 kV surge arrestor.
0 0.02 0.04 0.06 0.08 0.1(ms)-4000
-2000
0
2000
4000
6000
(V)
Figure 4.15: Transient voltage at the 6 kV side of the system for the case of 20 kAlightning with 400 and 15.75 kV surge arrestor.

43
0 0.02 0.04 0.06 0.08 0.1(ms)-5000
-3750
-2500
-1250
0
1250
2500
3750
5000
(V)
Figure 4.16: Transient voltage at the 0.4 kV side of the system for the case of 20 kAlightning with 400 and 15.75 kV surge arrestor.

44
5. 20 kA lightning current with 400 kV, 15.75 kV and 6 kV SurgeArrestorIn this case the lightning current of 20 kA is taken with 400 kV, 15.75 kV and6 kV surge arrestor arranged in the system. The transferred transient voltagesare as shown in Figure 4.17 to 4.18.
0 0.02 0.04 0.06 0.08 0.1(ms)-4000
-2000
0
2000
4000
6000
(V)
Figure 4.17: Transient voltage at the 6 kV side of the system for the case of 20 kAlightning with 400, 15.75 and 6 kV surge arrestor.
0 0.02 0.04 0.06 0.08 0.1(ms)-5000
-3750
-2500
-1250
0
1250
2500
3750
5000
(V)
Figure 4.18: Transient voltage at the 0.4 kV side of the system for the case of 20 kAlightning with 400, 15.75 and 6 kV surge arrestor.

45
4.3.2 Indirect Stroke
In this case the back flashover is modelled using a step voltage of 1640 kV appliedto the phase conductor. This voltage corresponds to the flashover voltage of theinsulator.
1. With only 400 kV Surge Arrestor
In this case only 400 kV surge arrestor is implemented in the system andthe corresponding transferred transient voltage at different point of the net-work is analyzed. Step voltage of 1640 kV is applied to the phase conductor.The transferred transient voltage are as shown in Figure 4.19 to 4.21.
0 0.02 0.04 0.06 0.08 0.1(ms)0.0
0.4
0.8
1.2
1.6
2.0
(MV)
Figure 4.19: Voltage at the 415 kV side for the case of back flashover with 1640 kVstep voltage.

46
0 0.02 0.04 0.06 0.08 0.1(ms)-10
0
10
20
30
40
50
60
70
(kV)
Figure 4.20: Transient voltage at the 15.75 kV side of the system for the case ofback flashover with 400 kV surge arrestor.
0 0.2 0.4 0.6 0.8 1(ms)-6000
-3000
0
3000
6000
9000
(V)
Figure 4.21: Transient voltage at the 6 kV side of the system for the case of backflashover with 400 kV surge arrestor.

47
2. With 400 kV and 15.75 kV Surge Arrestor
In this case surge arrestor of rating 400 kV and 15 kV are implemented inthe system and the corresponding transferred transient voltage is analyzed atdifferent point of the network. The transferred transient voltage are as pre-sented in Figure 4.22 to 4.24.
0 0.02 0.04 0.06 0.08 0.1(ms)-10
-5
0
5
10
15
20
25
(kV)
Figure 4.22: Transient voltage at the 15.75 kV side of the system for the case ofback flashover with 400 and 15.75 kV surge arrestor.

48
0 0.2 0.4 0.6 0.8 1(ms)-5000
-2800
-600
1600
3800
6000
(V)
Figure 4.23: Transient voltage at the 6 kV side of the system for the case of backflashover with 400 and 15.75 kV surge arrestor.
0 0.2 0.4 0.6 0.8 1(ms)-6000
-4000
-2000
0
2000
4000
(V)
Figure 4.24: Transient voltage at the 0.4 kV side of the system for the case of backflashover with 400 and 15.75 kV surge arrestor.
49
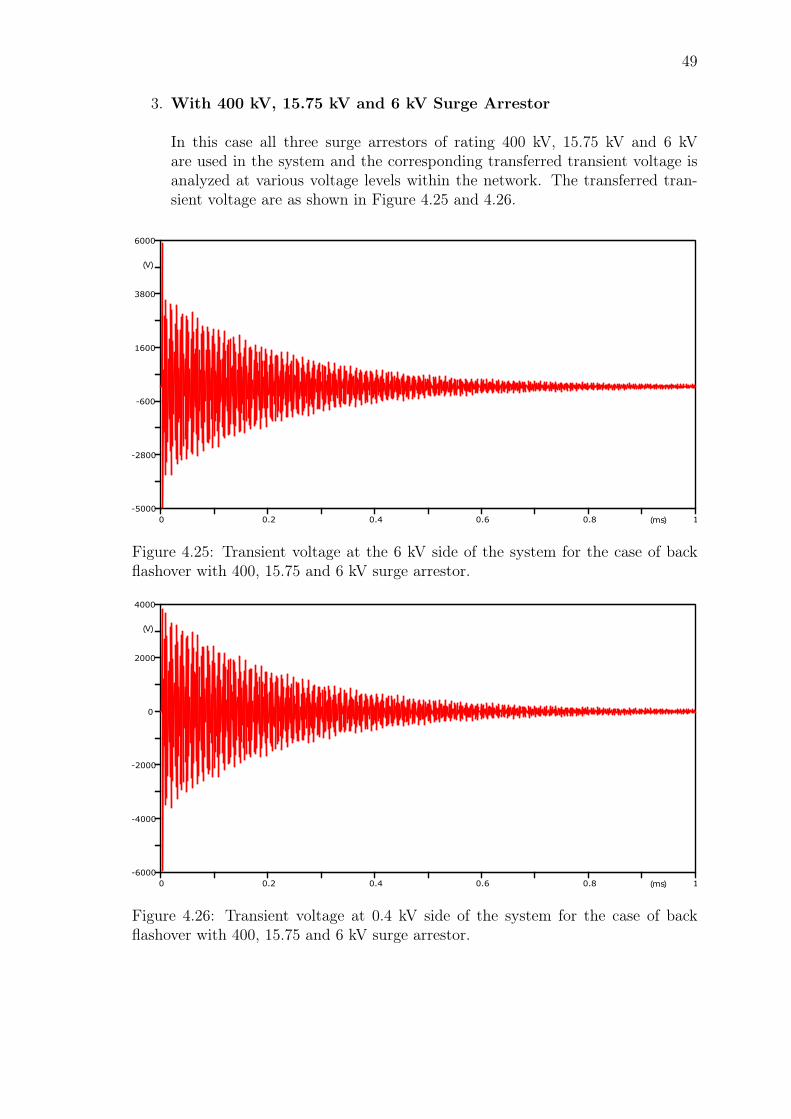
3. With 400 kV, 15.75 kV and 6 kV Surge Arrestor
In this case all three surge arrestors of rating 400 kV, 15.75 kV and 6 kVare used in the system and the corresponding transferred transient voltage isanalyzed at various voltage levels within the network. The transferred tran-sient voltage are as shown in Figure 4.25 and 4.26.
0 0.2 0.4 0.6 0.8 1(ms)-5000
-2800
-600
1600
3800
6000
(V)
Figure 4.25: Transient voltage at the 6 kV side of the system for the case of backflashover with 400, 15.75 and 6 kV surge arrestor.
0 0.2 0.4 0.6 0.8 1(ms)-6000
-4000
-2000
0
2000
4000
(V)
Figure 4.26: Transient voltage at 0.4 kV side of the system for the case of backflashover with 400, 15.75 and 6 kV surge arrestor.

50
The simulation results obtained for different cases are summarized and listed inTable 4.1.
Table 4.1: Summary of voltage peak for all cases
CaseSurge
Arrestor
Voltage Peak (kV)
415 kV 15.75 kV 6 kV 0.4 kV
Direct Stroke
26.6 kA, 1.2/50 µs
400 kV 1650 75 12 9.5
400+15.75 kV 1650 32 6 4
400+15.75+6 kV 1650 32 6 4
Direct Stroke
20 kA, 1.2/50 µs
400+15.75 kV 1350 27 5.7 4
400+15.75+6 kV 1350 27 5.7 4
Back Flashover
1640 kV
400 kV 1640 63 8.8 5.8
400+15.75 kV 1640 23 6 4
400+15.75+6 kV 1640 23 6 4

51
5 Discussion and Conclusion
5.1 Discussion
The peak voltage profile in case of direct stroke is shown in Figure 4.3 to 4.7 fortower voltage, 415 kV, 15.75 kV, 6 kV and 0.4 kV respectively. By comparing thevoltage profile of the system with only 400 kV surge arrestor in operation, the volt-age peak at the terminal of the primary side is reduced from 6.6 MV to 1.65 MV. Acomparison of the voltage profile with and without 400 kV surge arrestor operationis shown in Figure 4.3 and 4.4. The over-voltage is limited due to the behaviour ofthe surge arrestor. The transient voltage has a peak of 75 kV at the 15.75 kV side ofthe system. The voltage peak at the 6 kV and 0.4 kV side of the system are 12 kVand 9.5 kV respectively. These can be seen in Figure 4.6 to 4.7. Figure 4.8 showsthe voltage at the 415 kV side of the network when subjected to a lightning currentof 200 kA. The high overvoltage of this case will lead to the immediate flashover ofthe insulator string. The shield wire of the transmission line will however restrictthe lightning of 200 kA to enter the phase conductors of the transmission line.
Figure 4.9 to 4.11 shows the voltage at different voltage levels with 400 and 15.75 kVsurge arrestor in operation. Use of 15.75 kV surge arrestor has limited the voltageat the 15.75 kV from 75 kV to 32 kV as shown in Figure 4.9. Likewise, the voltageat the 6 kV and 0.4 kV side of the network are also reduced to 6 kV and 4 kVrespectively as shown in Figure 4.10 and 4.11.
The transient over-voltage at the 6 kV and 0.4 kV side are shown in Figure 4.12and 4.13 when all three surge arrestor 400 kV, 15.75 kV and 6 kV are in operation.In this case, the transient voltage has the peak of 6 kV at the 6 kV side and 4 kVat the 0.4 kV side. The over-voltage amplitude has a negative peak also which isshown in Figure 4.4, when the protective surge arrestors are present in the system.This is due to the operation of the surge arrestor and the reflections of the travellingwave at the open end of the line.
Figure 4.14 to 4.16 shows the voltage peak at different voltage levels for lightningcurrent of 20 kA with 400 and 15.75 kV surge arrestor in operation. 15.75 kV sideof the network has a peak voltage of 27 kV while the voltage at the 6 kV and 0.4kV side are 5.7 kV and 4 kV respectively. The same values are seen when all threesurge arrestors are in the system for the same lightning current.
The case of back flashover is analyzed with different combination of surge arrestors.The back flashover is modelled by applying a step voltage of 1640 kV to the phaseconductor of the line. This voltage is taken for all the scenarios. The transferredtransient voltage when only 400 kV surge arrestor is used in the system are as shownin Figure 4.19 to 4.21. Figure 4.19 represents the step voltage taken for the mod-elling of the back flashover. The voltage has a peak of 63 kV at the 15.75 kV sideof the system. The transient voltage reaching at the 6 kV side of the transformer

52
has a peak of 8.8 kV while the voltage peak at the 0.4 kV side of the system is at5.8 kV. The voltage at the 6 kV side is well below the basic level insulation (BILof 29 kV) and close to the system voltage of the connected motors. Figure 4.22 to4.24 presents the transferred transient voltage when the system consist of 400 kVand 15.75 kV surge arrestor. The voltage at the 15.75 kV side dropped to 23 kVfrom 63 kV with and without 15.75 kV surge arrestor respectively. The transientvoltage reaching the 6 kV and 0.4 kV end of the network is 6 kV and 4 kV as shownin Figure 4.23 and 4.24 respectively.
All three surge arrestors of rating 400 kV, 15.75 kV and 6 kV are considered inthe last study scenario. The transferred transient voltage peaks in this scenario areas depicted in Figure 4.25 to 4.26. The voltage at the 6 kV busbar is at 6 kV whilethe voltage peak at the 0.4 kV busbar has remained constant at 4 kV. The use of 6kV surge arrestor has no any effect on the system as the transient voltage reachingthe 6 kV side is at the system voltage level and surge arrestor does not operate.
The use of cable in the modelling has limited the transient voltage being transmittedto the low voltage side as the capacitance of the cable are taken into considerationand used in the modelling. The capacitance in the 15.75 kv bus bar has significantlyreduced the transient voltage at the 15.75 kV side. The oscillations in the voltagetransients at 6 kV and 0.4 side of the network is basically due to the cable impedance.Besides, the response of the transformer, there are two factors that affect the shapeof the induced voltage. They are (i) the wave shape of the incident lightning strokeand (ii) the reflection of the induced surge at the surge arrestor location when theyoperate.
5.2 Conclusion
In order to accurately estimate the transferred transient voltage to the low voltageside of the system from the high voltage side, high frequency modelling of the as-sociated equipment and apparatus is required. The parameters of the models areidentified based on the obtained measurement results. The presence of 400 kV and15.75 kV surge arrestor has strong impact in limiting the transient voltage duringboth case of direct stroke and back flashover. In both case of direct stroke and backflashover with only 400 kV surge arrestor in the system, the transferred transientvoltage at the 15.75 kV side is well above the basic insulation level (68 kV) of thegenerator in case of direct stroke and almost equal in case of back flashover whilethe transient voltage at 6 kV bus bar is below the basic insulation level (29 kV) ofthe connected motor.
The use of 15.75 kV surge arrestor together with 400 kV arrestor has significantlyreduced the voltage at the 15.75 kV side of the network. The use of 15.75 kV surgearrestor is required to ensure the protection of the generator connected to the 15.75kV voltage level for both case of direct stroke and back flashover as the voltage atthe 15.75 kV side is higher than the BIL when only 400 kV surge arestor is used.

53
This surge arrestor is enough to protect the generator against the 20 kA lightning.If higher surge are expected to enter the system, the rating of the surge arrestorshould be higher.
In conclusion, the surge arrestors in the 400 kV and 15.75 side are required forthe protection of generators and motors from the transient voltage. The resultspresented may be useful for further studies regarding the insulation coordination ofthe power system.
For further study, it is recommended to have an experimental setup for all thetransformers used in the study in order to obtain more accurate and precise simu-lation results. As the back flashover depends on number of parameters, study canbe performed on different scenarios to ensure proper protection for all the possi-ble scenarios. The surge can be more accurately modelled by proper calculation ofthe maximum amount of the surge that can enter the transmission tower throughthe shield wire and investigate how likely is that 26.6 kA surge enters the phaseconductor.
54
References[1] Allan Greenwood,Electrical Transients in Power Systems, Second Edition
[2] http://www-public.tnb.com/eel/docs/furse/ESP_-_Introduction.pdf
[3] S.Chattopadhyay, M.Mitra and S.Sengupta,Electric Power Quality
[4] R.C.Dugan, M.F. McGranaghan, S.Santoso and H.W.BeatyElectric Power Sys-tems Quality, Third Edition
[5] https://www.slideshare.net/srtu99ler/protection-devices-and\-the-lightning
[6] J.W.Kim, B.K.Park, S.C.Jeong, S.W.Kim and P.G.Park, Fault Diagnosis ofa Power Transformer Using an Improved Frequency-Response Analysis, IEEETranscations on Power Delivery, Vol.20, No.1, January 2005
[7] https://www.ee.co.za/article/interpreting-sweep-frequency-response\-analysis-measurements.html
[8] P. Chowdhuri, Parameters of Lightning Strokes and Their Effects on PowerSystems, IEEE/PES Transmission and Distribution Conference and Exposition,Volume 2, 1047 - 1051, 2001
[9] J.Chang, A.J.Kelly, and J.M.Crowley, Handbook of Electrostatic Processes
[10] A.Morched, L.Marti and J. Ottevangers, A High Frequency Transformer Modelfor the EMTP, IEEE Transcations on Power Delivery, Vol 8, 1993
[11] P.T.M.Vassen, Transformer Model for High Frequencies, IEEE Transactions onPower Delivery, Vol.3, No.4, October 1988
[12] A.Shirvani, K. Malekian, U.Schmidt and W. Schufft, A New Power transformerModel Over Wide Frequency range for EMTP, 45th International UniversitiesPower Engineering Conference UPEC2010, 1-6, 2010
[13] Nehmdoh A.Sabiha, Lightning-Induced Overvoltages in Medium Voltage Distri-bution Systems and Customer Experienced Voltage Spikes, Doctoral Disserta-tion, 2010
[14] IEEE working group 3.4.11, Application of Surge Protective Devices Subcom-mittee, Surge Protective Devices Committee, Modelling of Metal Oxide SurgeArrestors, Transcations on Power Delivery , Vol.7, No.1, PP.302-309, Jan.1992.
[15] P.Pinceti, M.Giannettoni, A simplified Model for Zinc Oxide Surge Arrestors,IEEE Transactions on Power Delivery, Vol.14, No.2, April 1999
[16] S.T.Mobarakei, T.Sami and B.Porkar, Back Flashover Phenomenon Analysis inPower Transmission Substation for Insulation Coordination, 11th InternationalConference on Environment and Electrical Engineering, 170-174, 2012

55
[17] http://www.slideshare.net/rssraaz/design-of-tower
[18] T.Horvath, Understanding Lightning and Lightning Protection, A MultimediaTeaching Guide
[19] https://static1.squarespace.com/static/51641d60e4b09de45a330799/t/52727e58e4b08d0d3170fd13/1383235160236/2.1+-+Transmission+Deadend-Suspension+Cat+T-DS+-131003.pdf
[20] A.R.Hileman Insulation Coordination for Power Systems, Dover Publications,New York, N.Y., USA, 1951
[21] http://fi.prysmiangroup.com/en/business_markets/markets/pd/download/datasheets/AHXCMK-WTC_AHXCMK-HF.pdf
[22] http://fi.prysmiangroup.com/en/business_markets/markets/ti/downloads/datasheets-english/AHXAMK-W_10kv_EN_150916.pdf
[23] H.W.Dommel, Electromagnetic Transient Program,Reference Manual (EMTPTheory Book),Bonneville Power Administration, Portland,1986
[24] ATPDRAW version 5.6 for Windows 9x/NT/2000/XP/Vista, Users’ Manual,Preliminary Release No.1.0, November 2009

56
A Frequency Response Analysis
Figure A1: Frequency response analysis of HV side of power transformer

57
Figure A2: Frequency response analysis of LV side of power transformer

58
Figure A3: Frequency response analysis between LV & HV windings of power trans-former

59
Figure A4: Frequency response analysis between LV & HV windings of power trans-former

60
B Surge arrestor non linear characteristicsThe non linear characteristic of the surge arrestor are as:
Table B2: V-I characteristic of A0 and A1
I(kA) A0(PU) A1(PU)2*10−6 0.81 0.6230.1 0.974 0.7881 1.052 0.8663 1.108 0.92210 1.195 1.00920 1.277 1.091
Figure B1: Non linear characteristic of non-linear element A0

61
Figure B2: Non linear characteristic of non-linear element A1


![Blue Sea Systems Innovative marine electrical products—Built ...disconnecting the current transformer. Failure to do so will generate lethal voltages on the current transformer.]](https://img.pdfslide.us/doc/110x75/60ca7a53df0935746f0cdf90/blue-sea-systems-innovative-marine-electrical-productsabuilt-disconnecting.jpg)