Embed Size (px)
Citation preview

www.dot.state.fl.us
Florida Department of
TRANSPORTATION
Final Lighting Justification Report
Malabar Road (SR 514) PD&E Study From East of Babcock Street (SR 507) to US 1
Brevard County, Florida
FPID: 430136‐1‐22‐01
ETDM: 13026
The environmental review, consultation, and other actions required by applicable federal environmental laws for this project are being, or have been, carried out by the Florida Department of Transportation (FDOT) pursuant to 23 U.S.C. §327 and a Memorandum of Understanding (MOU) dated December 14, 2016 and executed by the Federal Highway Administration and FDOT.
May 2015
www.dot.state.fl.us
Florida Department of
TRANSPORTATION
Final Lighting Justification Report
Malabar Road (SR 514) PD&E Study From East of Babcock Street (SR 507) to US 1
Brevard County, Florida
FPID: 430136‐1‐22‐01
ETDM: 13026
May 2015
Prepared By
ATKINS 482 South Keller Road
Orlando, Florida 32810

i Lighting Justification Report
SR 14 (Malabar Road) PD&E Study
TABLE OF CONTENTS Executive Summary ................................................................................................................ ES-1
1.0 Project Overview ............................................................................................................ 1-1 1.1. Introduction .................................................................................................................. 1-1 1.2. Existing Conditions ...................................................................................................... 1-2 1.3. Purpose ......................................................................................................................... 1-3 1.4. Procedure ..................................................................................................................... 1-3 1.5. Special Considerations ................................................................................................. 1-3 1.6. Existing Lighting ......................................................................................................... 1-4
2.0 Lighting Warrants and Analysis .................................................................................. 2-1 2.1. AASHTO & USDOT FHWA Highway Lighting Warrants ........................................ 2-1 2.2. Traffic Counts .............................................................................................................. 2-1 2.3. Crash Data Analysis ..................................................................................................... 2-2 2.4. Crash Data Cost Summary ........................................................................................... 2-4 2.5. Crash Rate Analysis ..................................................................................................... 2-4 2.6. USDOT FHWA Warrants Analysis (NCHRP REPORT 152) .................................... 2-5
3.0 Benefit-Cost Ratio Analysis .......................................................................................... 3-1
4.0 Recommendation............................................................................................................ 4-1
List of Figures Figure 1 - Project Location Map .................................................................................................. 1-1 Figure 2 - Lighting Conditions .................................................................................................... 2-3 Figure 3 - NCHRP 152 – FORM 1 .............................................................................................. 2-7 List of Tables Table 1 - Summary of Existing Conditions Malabar Road (SR 514) .......................................... 1-2 Table 2 - Daytime vs. Nighttime Traffic Volumes Comparison ................................................. 2-1 Table 3 - Average Annual Daily Traffic (AADT) ...................................................................... 2-2 Table 4 - Total Number of Crashes by Category ......................................................................... 2-2 Table 5 - Total Number of Crashes by Lighting Condition ......................................................... 2-3 Table 6 - Total Number of Crashes (Daytime vs. Nighttime) .................................................... 2-3 Table 7 - Malabar Road (SR 514) Evaluation Form 1 Classification Factors ............................. 2-6 Table 8 - Crash Reduction Factors............................................................................................... 3-2 Appendices Appendix A – FDOT’s Florida Traffic Online (2013) Traffic Counts Appendix B – 5-Year Crash Analysis Appendix C – FDOT 2017 Plans Preparation Manual, Volume 1, Chapter 23, Section 23.5 Appendix D – NCHRP 152 Warrant Procedure

ES-1 Lighting Justification Report
SR 14 (Malabar Road) PD&E Study
EXECUTIVE SUMMARY
A lighting justification analysis and report were produced for the Malabar Road [State Road (SR) 514] Project Development and Environment (PD&E) study from Babcock Road (SR 507) [mile post (M.P.) 3.060] to US 1 (M.P. 6.698), located in Brevard County, Florida. The lighting justification analysis and report are part of the PD&E study requested by the Town of Malabar and the Space Coast Transportation Planning Organization (TPO) for the potential widening of Malabar Road (SR 514) between M.P. 3.060 to M.P. 6.698. The results of this study have concluded that this section of Malabar Road (SR 514) satisfies the steps necessary to justify the installation of continuous highway lighting as outlined in the United States Department of Transportation (USDOT) Federal Highway Administration (FHWA) Warrants Analysis, National Cooperative Highway Research Program (NCHRP) Report 152, in accordance with the Highway Lighting Justification Procedure found in the Florida Department of Transportation (FDOT) Manual on Uniform Traffic Studies (MUTS), Chapter 15.

1-1 Lighting Justification Report
SR 14 (Malabar Road) PD&E Study
1.0 PROJECT OVERVIEW
1.1. Introduction This report contains the results of a highway lighting justification analysis for the Malabar Road [State Road (SR) 514] Project Development and Environment (PD&E) study, from Babcock Street (SR 507) to US 1, in Brevard County, Florida. This analysis was performed to determine the need for highway lighting as part of the project’s design process. The overall project length is approximately 3.64 miles. This section of Malabar Road (SR 514) is a four-lane divided Urban Minor Arterial from mile post (M.P.) 3.060 to M.P. 3.218, then, it converts to a two-lane undivided Urban Minor Arterial from M.P. 3.218 to M.P. 6.698. The surrounding development (or land use) along the studied corridor is primarily residential with the exception of a strip of commercial use near the intersection of SR 514 and SR 507, and the Palm Bay Hospital located on the north side of Malabar Road (SR 514) near Medplex Parkway.
Figure 1 - Project Location Map

1-2 Lighting Justification Report
SR 14 (Malabar Road) PD&E Study
1.2. Existing Conditions
Table 1 - Summary of Existing Conditions Malabar Road (SR 514)
Characteristic Observation
Limits SR 507 (M.P. 3.060) – US 1 (M.P. 6.698)
Location
SR 507 to West of Medplex Parkway – City of Palm Bay, Brevard County; West of Medplex Parkway to US 1 - Town of Malabar, Brevard County
FDOT Roadway ID 70180000
Roadway Maintaining Agency FDOT
Functional Classification
Four Lane divided Urban Minor Arterial from M.P. 3.060 to M.P. 3.218
Two Lane Undivided Urban Minor Arterial from M.P. 3.218 to M.P. 6.698
Speed Limits
M.P. 3.060 – M.P. 3.850 : 45 MPH
M.P. 3.850 – M.P. 5.974 : 55 MPH
M.P. 5.974 – M.P. 6.332 : 45 MPH
M.P. 6.332 – M.P. 6.698 : 30 MPH
Adopted LOS FDOT Standard: “D”; Brevard County Standard: “D”; City of
Palm Bay Standard: “E” and Town of Malabar Standard: “D”
Strategic Intermodal System Facility No
Signalized Intersections from West to East
1) SR 507 (M.P. 3.060)
2) US 1 (M.P. 6.698)
Land Uses
Predominantly residential use along the entire study corridor. Strip commercial use near the intersection of SR 514 and SR 507. Palm Bay Hospital on the north side of SR 514 near Medplex Parkway.
Pavement Width
13 foot wide travel lanes from M.P. 3.060 – M.P. 3.218
12 foot wide travel lanes from M.P. 3.218 – M.P. 6.698 Sidewalks 5’ sidewalk present on the north and south sides of SR 514
from M.P. 3.060 to M.P. 3.224.
Parallel Parking None
Bike Lanes Undesignated bike lanes from M.P. 3.217 to M.P. 4.241
Hurricane Evacuation SR 514 within the study limits is a hurricane evacuation route.

1-3 Lighting Justification Report
SR 14 (Malabar Road) PD&E Study
1.3. Purpose The purpose of the highway lighting justification report is to determine if highway lighting is justified for the potential roadway widening improvements to the indicated section of Malabar Road (SR 514).
1.4. Procedure The Florida Department of Transportation (FDOT) Manual on Uniform Traffic Studies (MUTS) dated January 2000, Chapter 15: Highway Lighting Justification Procedure, establishes a two-step procedure for analyzing and justifying the implementation of roadway lighting. The first step involves the use of the American Association of State Highway and Transportation Officials’ (AASHTO) roadway lighting warrants to determine if roadway conditions for the project in concert with other factors are conducive for the consideration of highway lighting. Part of the first step is to obtain a Lighting Maintenance and Operations Agreement from the maintaining agency (Florida Administrative Code (FAC) Rule 14-64 Illumination of the State Highway System). If the AASHTO warrants and the conditions established by FAC Rule 14-64 are met, then a benefit-cost analysis (step two) should be performed. On December 31, 1996, FAC Rule 14-64 was repealed, and it is no longer in effect. The AASHTO warrants provide a basis for roadway conditions under which lighting may be considered, but it doesn’t describe the sites where lighting is specifically justified. Furthermore, the AASHTO warrants do not cover arterial roadways; therefore, the United States Department of Transportation (USDOT) Federal Highway Administration’s (FHWA) National Cooperative Highway Research Program (NCHRP) Report No. 152 Warrants for Highway Lighting warranting procedure was used as the first step for this study. The second step in this analysis is to determine if roadway lighting for the project is justified on the basis of a benefit-cost analysis. If the benefit-cost ratio is equal to 1.0 or more, then lighting is justified for high crash locations as identified by the State Safety office. At other locations, the benefit-cost ratio should be 2.0 or greater to justify the implementation of roadway lighting.
1.5. Special Considerations Historical crash data for five (5) years between 2008 and 2012 was obtained from FDOT’s Crash Analysis Reporting (CAR) system, for Malabar Road (SR 514) from M.P. 3.060 to US 1 M.P. 6.698. During this five-year period a total of 110 crashes were reported. Out of the total 110 reported crashes, thirty-four (34) crashes or 30.9% were reported during dusk, dawn or night lighting conditions.

1-4 Lighting Justification Report
SR 14 (Malabar Road) PD&E Study
1.6. Existing Lighting There is existing standard overhead lighting in some areas along Malabar Road (SR 514). The light fixtures are located between:
Babcock Street (SR 507) and Enterprise Avenue – North side of Malabar Road (SR 514)
Weber Road to Sandy Creek Lane – South side of Malabar Road (SR 514)
Weir Street and Glatter Road – South side of Malabar Road (SR 514)
Marie Street and US 1- North Side of Malabar Road (SR 514)
The lighting along these segments is not 100% continuous. In addition, the existing overhead lighting along the corridor will most likely be impacted or removed to accommodate the future roadway widening. Therefore, for the purpose of this report, the study corridor will be treated as having unlighted lighting conditions.

2-1 Lighting Justification Report
SR 14 (Malabar Road) PD&E Study
2.0 LIGHTING WARRANTS AND ANALYSIS
2.1. AASHTO & USDOT FHWA Highway Lighting Warrants AASHTO’s Roadway Lighting Design Guide (dated 2005), referred to by FDOT’s MUTS, contains specific warrants for the justification of roadway lighting along freeways, interchanges and tunnels, but it does not have specific warrants for the justification of roadway lighting along arterial roadways. The guide does state that roadway lighting should be provided if it will contribute substantially to the efficiency, safety and comfort of the motoring public. SR 514 is an Urban Minor Arterial roadway and the AASHTO warrants are not applicable for this study. Therefore, the USDOT FHWA Roadway Lighting Handbook warranting procedure was adopted for this report. USDOT FHWA Roadway Lighting Handbook (Implementation Package 78-15) states that roadway lighting may be provided for all major arterials in urbanized areas and for locations or sections of street and highways where the night-to-day crash rates are high (above 2.0). The handbook adopts the analytical approach of the illumination warrants from NCHRP Report No. 152: Warrants for Highway Lighting. In this report, the roadway lighting evaluation warrants are based on geometric, operational, environmental and night-to-day crash rate parameters. This procedure is presented in the USDOT FHWA Warrants Analysis section of this roadway lighting justification report.
2.2. Traffic Counts Traffic counts were obtained from FDOT’s Florida Traffic Online (2013). Traffic information for three (3) sites along the study corridor was available from this source at mileposts 3.568, 5.642 and 6.623. The counts were taken in August 13, 20013, and sunrise/sunset tables were consulted to determine that twilight hours were from 8:00 PM to 7:00 AM. This data is summarized in Tables 2 and 3. Refer to Appendix A for the raw traffic counts from FDOT’s Florida Traffic Online (2013).
Table 2 - Daytime vs. Nighttime Traffic Volumes Comparison
M.P. 3.568 Eastbound and Westbound 15,674 2,038 17,712 12%
M.P. 5.642 Eastbound and Westbound 8,917 1,273 10,190 12%
M.P. 6.623 Eastbound and Westbound 9,579 1,831 11,410 16%
1) Counts were conducted on 8/13/2013.2) Length of study area: 3.638 miles.
Notes:
Travel DirectionDaytime Traffic
VolumesNighttime Traffic
VolumesTotal
Traffic% ADT at
NightTraffic Counter
Location

2-2 Lighting Justification Report
SR 14 (Malabar Road) PD&E Study
Table 3 - Average Annual Daily Traffic (AADT)
2.3. Crash Data Analysis Historical crash data for five (5) years between 2008 and 2012 was obtained from FDOT’s CAR system for the length of the project. A detailed crash analysis conducted with this data is shown in Appendix B. During this five-year period a total of 110 crashes were reported. Out of the total 110 reported crashes, thirty-four (34) crashes or 30.9% were reported during dusk, dawn, or night lighting conditions. Table 4 below summarizes the total number of crashes by three categories: 1) Property Damage Only (PDO) crashes; 2) Injury crashes and 3) Fatal crashes. During this five-year period, a total of two (2) fatal crashes were reported along the study corridor, but they both occurred during daylight conditions.
Table 4 - Total Number of Crashes by Category
Table 5 incorporates the total number of reported crashes for all the lighting conditions during the five-year period. This is graphically illustrated in Figure 2. For every year without exception, the majority of the crashes occurred during daylight conditions. The year 2008 had the highest number of reported crashes with a total of thirty-one (31). A total of two (2) fatal crashes were reported along the study corridor, but they both occurred during daylight conditions.
M.P. 3.568 Eastbound and Westbound 18,500
M.P. 5.642 Eastbound and Westbound 10,600
M.P. 6.623 Eastbound and Westbound 11,800
Traffic Counter Location
Travel Direction AADT
# % # % # % # % # % # %Property Damage Only Crashes 14 45% 5 0% 9 0 10 36% 12 55% 50 45.5%Injury Crashes 16 52% 9 0% 6 0 17 61% 10 45% 58 52.7%Fatal Crashes 1 3% 0 0% 0 0 1 4% 0 0% 2 1.8%Total 31 28% 14 13% 15 0 28 25% 22 20% 110
TOTAL NUMBER OF CRASHES2008 2009 2010 2011 2012 Total

2-3 Lighting Justification Report
SR 14 (Malabar Road) PD&E Study
Table 5 - Total Number of Crashes by Lighting Condition
Figure 2 - Lighting Conditions
In Table 6, the crash data was separated between daytime and nighttime crashes. During the 5-year period, a total of thirty-four (34) reported crashes occurred during nighttime. This equates to 30.9% of the total crashes.
Table 6 - Total Number of Crashes (Daytime vs. Nighttime)
Based on the above information, an annual average of 15.2 daytime crashes occurred along the study corridor during the 5-year period between 2008 and 2012. Conversely, during the nighttime period, the average dropped by more than half (when compared to the daytime annual average) at 6.8 crashes per year.
# # # # # # %Daylight 23 9 8 21 15 76 69.1Dusk 1 0 0 2 0 3 2.7Dawn 0 0 2 2 1 5 4.5Dark (Street Light) 4 3 3 0 5 15 13.6Dark (No Street Light) 3 2 2 3 1 11 10.0
Total 31 14 15 28 22
Total
110
LIGHTING CONDITIONS (ALL)
2008 2009 2010 2011 2012
# # # # # # %Daytime 23 9 8 21 15 76 69.1Nighttime 8 5 7 7 7 34 30.9Total (Day & Night) 31 14 15 28 22 110 100%
LIGHTING (DAYTIME VS. NIGHTTIME)2008 2009 2010 2011 2012 Total
2-4 Lighting Justification Report
SR 14 (Malabar Road) PD&E Study
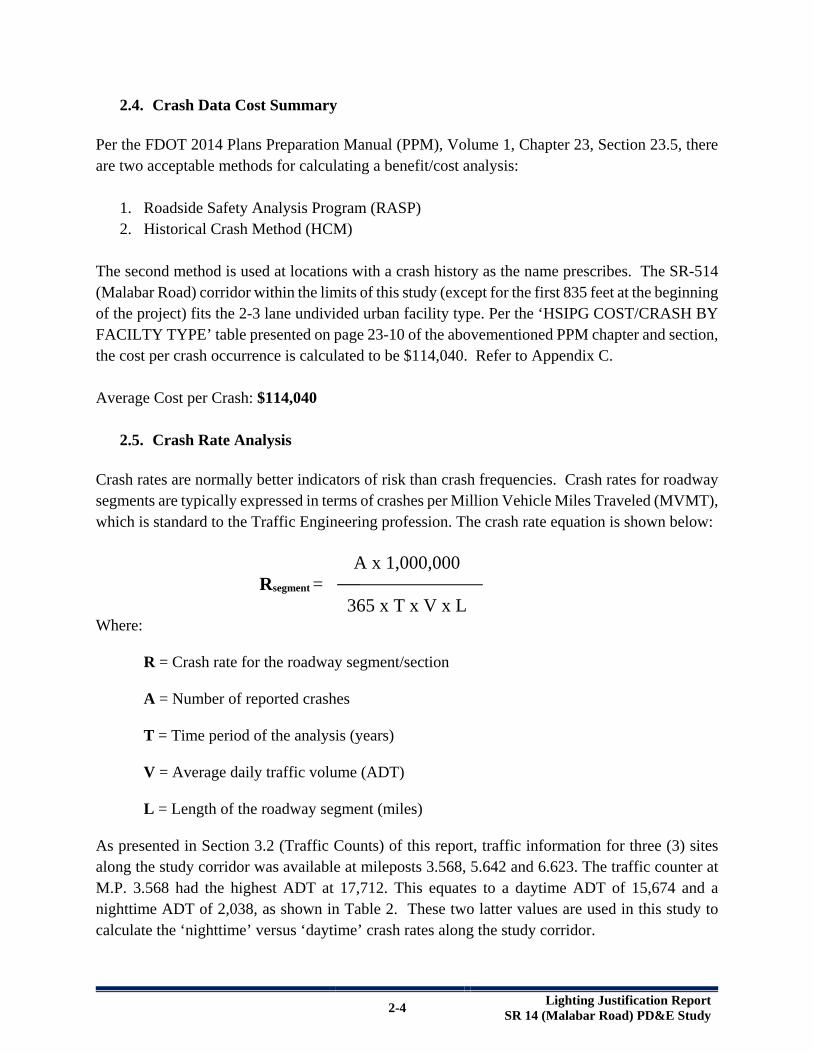
2.4. Crash Data Cost Summary Per the FDOT 2014 Plans Preparation Manual (PPM), Volume 1, Chapter 23, Section 23.5, there are two acceptable methods for calculating a benefit/cost analysis:
1. Roadside Safety Analysis Program (RASP) 2. Historical Crash Method (HCM)
The second method is used at locations with a crash history as the name prescribes. The SR-514 (Malabar Road) corridor within the limits of this study (except for the first 835 feet at the beginning of the project) fits the 2-3 lane undivided urban facility type. Per the ‘HSIPG COST/CRASH BY FACILTY TYPE’ table presented on page 23-10 of the abovementioned PPM chapter and section, the cost per crash occurrence is calculated to be $114,040. Refer to Appendix C. Average Cost per Crash: $114,040
2.5. Crash Rate Analysis Crash rates are normally better indicators of risk than crash frequencies. Crash rates for roadway segments are typically expressed in terms of crashes per Million Vehicle Miles Traveled (MVMT), which is standard to the Traffic Engineering profession. The crash rate equation is shown below:
A x 1,000,000 Rsegment =
365 x T x V x L Where:
R = Crash rate for the roadway segment/section A = Number of reported crashes T = Time period of the analysis (years) V = Average daily traffic volume (ADT) L = Length of the roadway segment (miles)
As presented in Section 3.2 (Traffic Counts) of this report, traffic information for three (3) sites along the study corridor was available at mileposts 3.568, 5.642 and 6.623. The traffic counter at M.P. 3.568 had the highest ADT at 17,712. This equates to a daytime ADT of 15,674 and a nighttime ADT of 2,038, as shown in Table 2. These two latter values are used in this study to calculate the ‘nighttime’ versus ‘daytime’ crash rates along the study corridor.

2-5 Lighting Justification Report
SR 14 (Malabar Road) PD&E Study
Daytime Crash Rate:
76 x 1,000,000 Rsegment =
365 x 5 x 15,674 x 3.638 A = 76 T = 5 V = 15,674 L = 3.638
Nighttime Crash Rate:
34 x 1,000,000 Rsegment =
365 x 5 x 2,038 x 3.638 A = 34 T = 5 V = 2,038 L = 3.638
Based on the above information, the ‘Nighttime-to-Daytime’ crash rate ratio can be calculated as follows:
2.51
Night-to-Day Crash Rate Ratio = 0.73
2.6. USDOT FHWA Warrants Analysis (NCHRP REPORT 152) The Evaluation Form 1 for Non-Controlled Access Facility Lighting shown on the next page of this report comes from the USDOT FHWA Roadway Lighting Handbook NCHRP Report No. 152. It was specifically designed to analyze warranting conditions for the installation of lighting on non-controlled access facilities. The table provides the non-controlled access roadway facility a rating between 1 and 5 points based on the warranting condition, which is multiplied by a weighting factor. If the sum of all weighted ratings for the warranting conditions is 85 points, lighting is warranted. The warranting form is divided into four classification factors; 1) Geometric, 2) Operational, 3) Environmental; and 4) Ratio of night-to-day crash rates. The form states that if the ratio of the
= 0.73 crashes per MVMT
= 2.51 crashes per MVMT
= 3.43

2-6 Lighting Justification Report
SR 14 (Malabar Road) PD&E Study
night-to-day crash rate is 2.0 or greater, then continuous lighting is warranted (even if the overall score is less than 85 points). As calculated in the previous section, the night-to-day crash rate ratio for the study corridor is 3.43; therefore, continuous lighting is warranted. Table 7 incorporates the factors that were used for the evaluation process based on the recommended alternative or ‘Opening Day’ conditions.
Table 7 - Malabar Road (SR 514) Evaluation Form 1 Classification Factors
Geometric Factors1. Number of Lanes: 42. Lane Width: 12 ft.3. Median Openings per Mile: <4.0 or one way operation4. Curb Cuts: 10-20%5. Curves: <3.0 degrees6. Grades: <3%7. Sight Distance: 300 - 500 ft.8. Parking: Prohibited both sidesOperational Factors1. Signals: Most major intersection signalized2. Left Turn Lane: Most major intersections3. Median Width: 20 - 30 ft.4. Operating Speed: 45 or greater5. Pedestrian traffic at Night (peds/mile): 0-50Environmental Factors1. Percent Development: 30 - 60%2. Predominant Type Development: Half residential and/or half commercial3. Setback Distance: 50 - 100 ft.4. Adverting or Area Lighting: 0 - 40%5. Raised Curb Median: Continuous6. Crime Rate: City averageCrash Factor1. Ratio of Night-to-Day Crash Rates: 3.43

2-7 Lighting Justification Report
SR 14 (Malabar Road) PD&E Study
Figure 3 - NCHRP 152 – FORM 1
EVALUATION FORM FOR NON-CONTROLLED ACCESS FACILITY LIGHTING

3-1 Lighting Justification Report
SR 14 (Malabar Road) PD&E Study
3.0 BENEFIT-COST RATIO ANALYSIS The purpose of this step in the roadway lighting justification procedure is to determine if the project is justified based on its benefit-cost ratio. If the benefit-cost ratio is equal to 1.0 or more, then lighting is justified for high crash locations as identified by the State Safety office. At other locations the benefit-cost ratio should be 2.0 or greater. The following equation is used to calculate the benefit-cost ratio:
ADT x %ADTn x 365 x NRU x CRF x ACC Benefit-Cost Ratio = (AIC + TMC + AEC) x 1,000,000 Where:
ADT = Average Daily Traffic (Existing or Projected) %ADTn = Percent of ADT at night NRU = Night crash rate unlighted CRF = Crash reduction factor ACC = Average crash cost (U.S. dollars per crash) AIC = Annualized installation cost TMC = Total annual maintenance cost AEC = Annual energy cost
Annualized installation cost, total annual maintenance cost, and annual energy cost are expressed on a U.S. dollar per mile basis for mainline sections and as a total U.S. dollar value for interchanges. The annual lighting cost is the sum of electrical costs, maintenance costs, and installation costs of the proposed system only. The average crash cost (ACC) was determined to be $114,040, as described in Section 3.4 of this report. Crash reduction factors (CRF) for various geometric configurations are present in Section 15.3.4 of the MUTS manual or as shown below in Figure 8. The CRF is a numerical value assigned to certain types of facilities and locations. It is based on an estimate of the crash reduction potential due to the installation of lighting. The CRF for Malabar Road (SR 514) along the PD&E study limits is 0.30.

3-2 Lighting Justification Report
SR 14 (Malabar Road) PD&E Study
Table 8 - Crash Reduction Factors
Design considerations, assumptions and historical values:
New lighting system install
ADT: 17,712
Segment length: 3.638 miles or 19,209 ft.
Poles on both sides
Pole spacing: 200 ft.
Pole height: 45 ft.
Luminaries per pole: 1
Luminaries wattage: 250
Construction cost per pole: $7500
Electrical cost: $.08/KWH
Percent of ADT at night: 12%
Night crash rate unlighted: 2.51 crashes per MVMT
Average maintenance cost per luminary: $100/year
A service life of 15 years is used in the capital recovery factor
Interest rate: 10% (IR/100) x (1 + (IR/100)15 Capital Recovery = (CRF, IR=10%, 15yr) (1 + ((IR/100)15 ) - 1 (10/100) x (1 + (10/100)15 Capital Recovery = (CRF, IR=10%, 15yr) (1 + (10/100)15 ) – 1 Capital Recovery = 0.1315 (CRF, IR=10%, 15yr)
Site Description CFRUrban Freeway Interchange 0.80Urban Freeway Mainline 0.20Rural Freeway Interchange 0.80Rural Freeway Mainline 0.20
Non-Controlled Access RoadwaysRural Intersection 0.20Rural Mainline 0.10Urban Intersection 0.20Urban Mainline (Commercial) 0.40Urban Mainline (25% Commercial) 0.30Urban Mainline (5% Commercial) 0.20

3-3 Lighting Justification Report
SR 14 (Malabar Road) PD&E Study
Segment length (ft) x (1 pole) x (No. sides lighted) No. of Poles Req’d = Spacing (ft) 19,209 (ft) x (1 pole) x (2 sides) No. of Poles Req’d = 200 (ft) No. of Poles Req’d = 192 AIC = (Initial Cost/Pole) x (CRF) x (No. of Poles) AIC = 7,500 x 0.1315 x 192 AIC = $189,360 TMC = (No. of Poles) x (Luminaries/Pole) x (Annual Maint. Cost/Luminary) TMC = (192) x (1) x ($100) TMC = $19,200 AEC = (No. of Poles) x (Luminaries/Pole) x (Watts/Luminary) x (KW/1000W) x (Cents/KWH) x (11 Hours/Day) x ($1/100 Cents) x (365 Days/Year) AEC = (192) x (1) x (250) x (1/1000) x (8) x (11) x (1/100) x (365) AEC = $15,418 Therefore, (17,712) x (0.12) x (365) x (2.51) x (0.30) x ($114,040) Benefit-Cost Ratio = (189,360 + 19,200 + 15,418) x (1,000,000) Benefit-Cost Ratio = 0.297

4-1 Lighting Justification Report
SR 14 (Malabar Road) PD&E Study
4.0 RECOMMENDATION Two procedures have been utilized for determining if roadway lighting is justified on Malabar Road (SR 514) within the project limits. The two procedures used for the analysis are the USDOT FHWA Roadway Lighting Handbook (NCHRP Report No. 152: Warrants for Highway Lighting) and the MUTS benefit-cost ratio analysis procedure. The USDOT FHWA analytical evaluation form (NCHRP 152 – Form 1) meets the warranting condition for roadway lighting based on a ratio of night-to-day crash rate higher than 2.0 at 3.43. The MUTS benefit-cost ration analysis calculated value of 0.297 does not exceed the minimum ‘2.0 or greater’ benefit-cost ratio required to justify continuous lighting. It is recommended that continuous roadway lighting be provided on Malabar Road (SR 514) from Babcock Street (SR 507) to US 1.

APPENDICES Appendix A – FDOT’s Florida Traffic Online (2013) Traffic Counts Appendix B – 5-Year Crash Analysis Appendix C – FDOT 2017 Plans Preparation Manual, Volume 1, Chapter 23, Section 23.5 Appendix D – NCHRP 152 Warrant Procedure

Appendix A
FDOT’s Florida Traffic Online (2013) Traffic Counts

Site InformationFeature 1
Site 700379Description ON SR-514, 0.463 MI. E OF SR-507 (UVL)Section 70180000Milepoint 3.568AADT 18500Site Type PortableClass Data NoK Factor 9D Factor 54.2T Factor 6.7
TRAFFIC REPORTS (provided in format)Brevard County Annual Average Daily Traffic Historical AADT Data Synopsis 700379-20130813
Print this window. Close this window.
Page 1 of 1FDOT Florida Traffic Online Identify Information
5/1/2014http://www2.dot.state.fl.us/FloridaTrafficOnline/displayAttributeDataAll3.aspx

COUNTY: 70STATION: 0379DESCRIPTION: ON SR-514, 0.463 MI. E OF SR-507 (UVL)START DATE: 08/13/2013START TIME: 1200--------------------------------------------------------------------------------------- DIRECTION: E DIRECTION: W COMBINEDTIME 1ST 2ND 3RD 4TH TOTAL 1ST 2ND 3RD 4TH TOTAL TOTAL---------------------------------------------------------------------------------------0000 14 12 10 10 46 | 17 13 17 9 56 | 1020100 7 13 6 5 31 | 15 8 13 11 47 | 780200 18 5 5 5 33 | 12 6 8 4 30 | 630300 2 2 4 9 17 | 9 4 4 6 23 | 400400 6 7 13 13 39 | 8 6 14 8 36 | 750500 16 19 27 38 100 | 11 23 31 35 100 | 2000600 37 76 129 167 409 | 44 56 74 85 259 | 6680700 137 138 178 207 660 | 125 144 166 162 597 | 12570800 224 179 185 167 755 | 152 147 109 145 553 | 13080900 156 138 136 153 583 | 124 130 123 148 525 | 11081000 108 139 140 115 502 | 134 136 134 132 536 | 10381100 107 112 114 124 457 | 143 130 115 143 531 | 9881200 125 123 121 118 487 | 149 146 149 166 610 | 10971300 143 131 124 130 528 | 129 114 146 154 543 | 10711400 132 127 149 141 549 | 132 153 152 121 558 | 11071500 123 128 135 170 556 | 166 155 156 186 663 | 12191600 152 167 151 145 615 | 224 170 183 212 789 | 14041700 127 174 147 141 589 | 223 234 189 186 832 | 14211800 143 137 146 126 552 | 183 151 134 119 587 | 11391900 113 103 77 86 379 | 132 113 126 99 470 | 8492000 90 63 64 63 280 | 90 86 72 63 311 | 5912100 49 55 46 66 216 | 64 45 42 38 189 | 4052200 54 29 32 36 151 | 37 44 29 27 137 | 2882300 23 25 19 21 88 | 31 31 27 19 108 | 196---------------------------------------------------------------------------------------24-HOUR TOTALS: 8622 9090 17712--------------------------------------------------------------------------------------- PEAK VOLUME INFORMATION DIRECTION: E DIRECTION: W COMBINED DIRECTIONS HOUR VOLUME HOUR VOLUME HOUR VOLUMEA.M. 745 795 730 627 730 1415P.M. 1545 640 1645 858 1645 1451DAILY 745 795 1645 858 1645 1451
GENERATED BY SPS 5.0.44P

Site InformationFeature 1
Site 700127
Description ON SR-514, 1.097 MI. W OF SR-5 (US-1) (UVL)
Section 70180000Milepoint 5.642AADT 10600Site Type PortableClass Data NoK Factor 9D Factor 54.2T Factor 6.7
TRAFFIC REPORTS (provided in format)Brevard County Annual Average Daily Traffic Historical AADT Data Synopsis 700127-20130813
Print this window. Close this window.
Page 1 of 1FDOT Florida Traffic Online Identify Information
5/1/2014http://www2.dot.state.fl.us/FloridaTrafficOnline/displayAttributeDataAll3.aspx

COUNTY: 70
STATION: 0127
DESCRIPTION: ON SR-514, 1.097 MI. W OF SR-5 (US-1) (UVL)
START DATE: 08/13/2013
START TIME: 1330
---------------------------------------------------------------------------------------
DIRECTION: E DIRECTION: W COMBINED
TIME 1ST 2ND 3RD 4TH TOTAL 1ST 2ND 3RD 4TH TOTAL TOTAL
---------------------------------------------------------------------------------------
0000 8 13 11 13 45 | 10 6 6 5 27 | 72
0100 3 12 5 9 29 | 3 6 3 3 15 | 44
0200 4 2 5 3 14 | 4 1 3 1 9 | 23
0300 8 0 6 2 16 | 1 1 5 5 12 | 28
0400 6 5 7 5 23 | 5 7 10 11 33 | 56
0500 9 15 18 23 65 | 16 16 33 29 94 | 159
0600 23 49 48 57 177 | 37 61 105 109 312 | 489
0700 70 53 68 76 267 | 109 133 164 153 559 | 826
0800 60 64 56 73 253 | 176 124 120 115 535 | 788
0900 54 78 59 58 249 | 84 81 86 81 332 | 581
1000 68 48 64 61 241 | 69 81 97 66 313 | 554
1100 63 69 53 75 260 | 64 58 77 74 273 | 533
1200 65 62 72 89 288 | 72 57 80 71 280 | 568
1300 74 68 71 57 270 | 76 82 78 80 316 | 586
1400 80 96 59 74 309 | 78 66 79 73 296 | 605
1500 75 77 99 104 355 | 75 89 82 98 344 | 699
1600 94 107 129 116 446 | 77 99 91 83 350 | 796
1700 116 117 129 83 445 | 81 100 75 88 344 | 789
1800 95 83 90 79 347 | 88 76 64 68 296 | 643
1900 64 71 58 45 238 | 58 58 51 55 222 | 460
2000 64 48 41 44 197 | 37 27 38 29 131 | 328
2100 51 33 22 28 134 | 35 25 32 33 125 | 259
2200 27 24 24 23 98 | 24 22 20 17 83 | 181
2300 25 21 13 16 75 | 17 8 12 11 48 | 123
---------------------------------------------------------------------------------------
24-HOUR TOTALS: 4841 5349 10190
---------------------------------------------------------------------------------------
PEAK VOLUME INFORMATION
DIRECTION: E DIRECTION: W COMBINED DIRECTIONS
HOUR VOLUME HOUR VOLUME HOUR VOLUME
A.M. 730 268 715 626 730 885
P.M. 1630 478 1545 365 1630 833
DAILY 1630 478 715 626 730 885
GENERATED BY SPS 5.0.44P

Site InformationFeature 1
Site 701001Description ON SR-514, 0.119 MI. W OF US-1 (UCLP)Section 70180000Milepoint 6.623AADT 11800Site Type PortableClass Data YesK Factor 9D Factor 54.2T Factor 5.6
TRAFFIC REPORTS (provided in format)Brevard County Annual Average Daily Traffic Annual Vehicle Classification Historical AADT Data Synopsis 701001CL-20130813 Vehicle Class History
Print this window. Close this window.
Page 1 of 1FDOT Florida Traffic Online Identify Information
5/1/2014http://www2.dot.state.fl.us/FloridaTrafficOnline/displayAttributeDataAll3.aspx

COUNTY: 70STATION: 1001DESCRIPTION: ON SR-514, 0.119 MI. W OF US-1 (UCLP)START DATE: 08/13/2013START TIME: 1315--------------------------------------------------------------------------------------- DIRECTION: E DIRECTION: W COMBINEDTIME 1ST 2ND 3RD 4TH TOTAL 1ST 2ND 3RD 4TH TOTAL TOTAL---------------------------------------------------------------------------------------0000 9 8 7 4 28 | 9 14 10 13 46 | 740100 2 6 2 3 13 | 7 12 8 6 33 | 460200 3 1 3 1 8 | 4 3 4 4 15 | 230300 1 0 6 5 12 | 7 1 5 3 16 | 280400 4 9 12 10 35 | 6 5 6 6 23 | 580500 19 15 32 33 99 | 11 17 16 21 65 | 1640600 40 63 116 116 335 | 28 53 55 55 191 | 5260700 106 143 155 180 584 | 74 66 78 102 320 | 9040800 180 127 129 117 553 | 74 65 76 65 280 | 8330900 87 92 88 79 346 | 72 89 90 67 318 | 6641000 74 79 95 77 325 | 77 68 62 76 283 | 6081100 64 62 71 80 277 | 69 73 78 77 297 | 5741200 65 65 94 70 294 | 80 74 92 93 339 | 6331300 89 84 71 79 323 | 91 94 97 65 347 | 6701400 73 70 85 72 300 | 97 111 79 100 387 | 6871500 72 85 83 95 335 | 105 100 118 130 453 | 7881600 79 95 98 88 360 | 139 127 178 160 604 | 9641700 81 92 81 86 340 | 188 180 172 152 692 | 10321800 88 83 74 64 309 | 137 90 102 88 417 | 7261900 67 59 56 51 233 | 67 74 65 57 263 | 4962000 46 25 35 29 135 | 60 55 45 42 202 | 3372100 36 24 31 30 121 | 52 36 38 21 147 | 2682200 23 23 24 13 83 | 30 20 24 23 97 | 1802300 19 9 12 11 51 | 23 21 16 16 76 | 127---------------------------------------------------------------------------------------24-HOUR TOTALS: 5499 5911 11410--------------------------------------------------------------------------------------- PEAK VOLUME INFORMATION DIRECTION: E DIRECTION: W COMBINED DIRECTIONS HOUR VOLUME HOUR VOLUME HOUR VOLUMEA.M. 715 658 700 320 715 978P.M. 1545 367 1630 706 1630 1065DAILY 715 658 1630 706 1630 1065
TRUCK PERCENTAGE 5.49 5.77 5.64----------------------------------------------------------------------------------------------------------
CLASSIFICATION SUMMARY DATABASE
DIR 1 2 3 4 5 6 7 8 9 10 11 12 13 14 15 TOTTRK TOTVOL E 56 3999 1142 25 182 35 0 36 24 0 0 0 0 0 0 302 5499 W 33 4495 1042 27 205 31 4 43 31 0 0 0 0 0 0 341 5911
----------------------------------------------------------------------------------------------------------
GENERATED BY SPS 5.0.44P

Appendix B
5‐Year Crash Analysis

2008 2009 2010 2011 2012 Total
# % # % # % # % # % # % FATAL CRASHES 1 0 0 1 0 2
Property Damage Only (PDO) Crashes 14 45% 5 0% 9 0% 10 36% 12 55% 50 45.5 Fatalities 1 0 0 1 0 2
Injury Crashes 16 52% 9 0% 6 0% 17 61% 10 45% 58 52.7 Injuries 0 0 0 1 0 1
Fatal Crashes 1 3% 0 0% 0 0% 1 4% 0 0% 2 1.8 INJURY CRASHES 16 9 6 17 10 58
Total 31 28% 14 13% 15 0% 28 25% 22 20% Injuries 24 19 13 25 14 95
Increase/Decrease -121% 7% 46% -27% TOTAL # OF INJURED PEOPLE 24 19 13 26 14 96
TOTAL # OF VEH INVOLVED 64 29 26 52 37 208
INJURED + FATAL (TOTAL INVOLVED) 25 19 13 27 14 98
TOTAL PDO 14 5 9 10 12 50
# % # % # % # % # % # %
No Improper Driving 1 7% 2 8% 3 14% 6 5.6
Careless Driving 16 52% 9 64% 9 60% 13 50% 9 41% 56 51.9
Failed to Yield Rht of Way 3 10% 3 21% 5 33% 5 19% 2 9% 18 16.7
Improper Parking 1 3% 1 0.9
Improper Lane Change
Improper Turn 1 3% 1 0.9
Alcohol-Under Influence
Drugs - Under Influence
Alcohol/Drugs
Followed Too Closely 1 4% 1 5% 2 1.9
Disregarded Traffic Signal
Exceeded Safe Speed 1 4% 1 5% 2 1.9
Disregarded Stop Sign 1 3% 1 0.9
Failed to Maintain Equip
# % # % # % # % # % # % Improper Passing 1 3% 1 0.9
Coll Rear End 13 42% 6 43% 5 33% 8 31% 10 45% 42 38.9 Drove Left of Center 2 6% 2 1.9
Coll Head On 1 4% 1 5% 2 1.9 Exceeded Stated Speed Limit
Coll Angle 3 10% 3 21% 3 20% 7 27% 2 9% 18 16.7 Obstructing Traffic
Coll Left Turn 2 6% 1 7% 1 7% 4 3.7 Improper Load 1 3% 1 0.9
Coll Right Turn 1 3% 1 7% 2 1.9 Disregarded Other Traffic Control 1 5% 1 0.9
Coll Sideswipe 1 3% 1 0.9 Driving Wrong Side/Way
Coll Backed Into 1 3% 1 0.9 Fleeing Police
Coll Parked Car Vehicle Modified
Coll MV on Roadway 1 4% 1 5% 2 1.9 Driver Distraction 1 3% 1 7% 2 1.9
Coll w/ Pedestrian 1 3% 1 5% 2 1.9 All others 4 13% 1 7% 4 15% 5 23% 14 13.0
Coll w/ Bycicle Total 31 29% 14 0% 15 0% 26 24% 22 20%
Coll w/ Bycicle (Bike Lane)
Coll w/ Moped
Coll w/ Train
Coll w/ Animal 1 5% 1 0.9
MV Hit Sign/Sign Post
MV Hit Utility Pole/Light Pole 2 13% 1 4% 2 9% 5 4.6
MV Hit Guardrail 1 5% 1 0.9
MV Hit Fence 1 3% 1 0.9
MV Hit Concrete Barrier Wall
MV Hit Bridge/Pier/Abutment/Rail
MV Hit Tree/Shrubbery 2 6% 2 1.9
Coll Const Barricade Sign
Coll w/ Traffic Gate
Coll w/ Crash Attenuators
Coll w/ Fixed Objects Above Road
MV Hit Other Fixed Objects
Coll w/ Moveable Object on Road
MV Ran Into Ditch/Culvert 2 6% 1 7% 2 13% 3 12% 2 9% 10 9.3
Ran Off Road Into Water
Overturned 3 12% 3 2.8
Occupant Fell From Veh # % # % # % # % # % # %
Tractor/Trailer Jackknifed Left 10 32% 8 57% 5 33% 11 39% 7 32% 41 37.3
Fire Right 21 68% 6 43% 9 60% 16 57% 12 55% 64 58.2
Explosion Intersection
Downhill Runaway Middle/Median
Cargo Loss or Shift 1 3% 1 0.9 Left side-road 1 7% 1 4% 2 9% 4 3.6
Separation of Units 1 7% 1 0.9 Right side-road 1 5% 1 0.9
Median Crossover End of State Road
All other 3 10% 1 7% 2 13% 2 8% 1 5% 9 8.3 All Other
Total 31 29% 14 0% 15 0% 26 24% 22 20% Total 31 28% 14 13% 15 14% 28 25% 22 20%
5-Year Crash Analysis SR 514 (Malabar Road)
From SR 507 (Babcock Street) to US 1
(MP 3.060 to MP 6.698 )
108 110
108
ROAD SIDE
2008 2009 2010 2011 2012 Total
2008 2009 2010 2011 2012
CONTRIBUTING CAUSE
2008 2009 2010 2011 2012 Total
TOTAL NUMBER OF CRASHES NUMBER OF VEHICLES INVOLVED
2008 2009 2010 2011 2012 Total
Total
110
FIRST HARMFUL EVENT
PDO Crashes
45%
Injury Crashes
53%
Fatal Crashes
2%
PERCENTAGE CRASH TYPE
31
14 15
28
22
0
5
10
15
20
25
30
35
2008 2009 2010 2011 2012
TOTAL NUMBER OF CRASHES
Dry 79%
Wet 21%
ROAD SURFACE CONDITION
Clear 75%
Cloudy 18%
Rain 7%
WEATHER
No Improper Driving
6%
Careless Driving
52%
Failed to Yield Rht of
Way 17%
Followed Too Closely
2%
Exceeded Safe 2%
Drove Left of Center
2%
Driver Distraction
2% All others
14%
CONTRIBUTING CAUSE

# % # % # % # % # % # % # % # % # % # % # % # %
Acceleration/Merge lane No Defects 30 97% 13 93% 15 100% 28 100% 20 91% 106 96.4
Toll Plaza Obtruction with Warning
Painted Crosswalk Obtruction without Warning
End of State Road Road Under Repair/Construction 1 3% 1 5% 2 1.8
Island Area 1 3% 1 0.9 Loose Surface Materials
Service/Access Road Shoulders Soft/Low/High
Left Turn Lane 1 7% 1 4% 1 5% 3 2.7 Holes/Ruts/Unsafe Paved Edge
Median/Middle Standing Water 1 7% 1 5% 2 1.8
Parking Lane Worn / Polished Road Surface
Right Turn Lane 1 3% 3 20% 1 4% 1 5% 6 5.5 All Others
Side of the Road/Shoulder 10 32% 2 14% 4 27% 7 25% 6 27% 29 26.4 Total 31 28% 14 13% 15 14% 28 25% 22 20%
Continuous Turn Lane (Center)
Unknown 2 13% 2 1.8
Bicycle Lane
Ramp1: Thru-Lanes (numbered from center
outward) 17 55% 12 86% 5 33% 19 68% 13 59% 66 60.0 # % # % # % # % # % # %2: Thru-Lanes (numbered from center
outward) 1 3% 1 0.9Dry 21 68% 11 79% 13 87% 25 89% 17 77% 87 79.1
3: Thru-Lanes (numbered from center
outward) 1 3% 1 5% 2 1.8Wet 10 32% 3 21% 2 13% 3 11% 5 23% 23 20.9
4: Thru-Lanes (numbered from center
outward)Slippery
5: Thru-Lanes (numbered from center
outward)Icy
All Other All Other
Total 31 28% 14 13% 15 14% 28 25% 22 20% Total 31 28% 14 13% 15 14% 28 25% 22 20%
# % # % # % # % # % # % # % # % # % # % # % # %
Front End 15 48% 6 43% 9 60% 14 54% 10 45% 54 50.0 Not At Intersection / RR X-ring / Bridge 15 48% 7 50% 3 20% 8 29% 7 32% 40 36.4
Right Front End 1 3% 2 13% 1 4% 4 18% 8 7.4 At Intersection 14 45% 7 50% 5 33% 11 39% 11 50% 48 43.6
Right Front Qtr Panel 1 7% 2 8% 2 9% 5 4.6 Influenced By Intersection 1 3% 5 33% 6 21% 3 14% 15 13.6
Right Front Door 2 6% 2 13% 1 4% 5 4.6 Driveway Access 1 3% 1 7% 3 11% 1 5% 6 5.5
Right Rear Door 1 4% 1 0.9 Railroad 1 7% 1 0.9
Right Rear Qtr Panel Bridge
Right Rear Corner 1 3% 1 0.9 Entrance Ramp
Rear End Exit Ramp
Left Rear Corner Parking Lot-Public
Left Rear Qtr Panel 2 6% 1 5% 3 2.8 Parking Lot-Private
Left Rear Door 1 5% 1 0.9 Private Property
Left Front Door 1 4% 1 0.9 Toll-Booth
Left Front Qtr Panel 1 7% 1 4% 1 5% 3 2.8 Public Bus Stop Zone
Left Front Corner 6 19% 4 29% 1 7% 2 8% 2 9% 15 13.9 All Other
Hood Total 31 28% 14 13% 15 14% 28 25% 22 20%
Roof
Trunk
Undercarriage # % # % # % # % # % # %
Overturn 1 3% 3 12% 4 3.7 1 Veh Crash 7 23% 2 14% 5 33% 9 32% 7 32% 30 27.3
Windshield 2 Veh Crash 17 55% 9 64% 9 60% 15 54% 15 68% 65 59.1
Trailer 1 7% 1 0.9 3 Veh Crash 5 16% 3 21% 1 7% 3 11% 12 10.9
Unknown/Other 3 10% 1 7% 1 7% 1 5% 6 5.6 4+ Veh Crash 2 6% 1 4% 3 2.7
Total 31 29% 14 13% 15 14% 26 24% 22 20% Total 31 28% 14 13% 15 14% 28 25% 22 20%
# % # % # % # % # % # % # % # % # % # % # % # %
Private Tranportation 29 94% 14 100% 15 100% 26 100% 19 86% 103 95.4 Automobile 16 52% 7 50% 9 60% 12 46% 12 55% 56 51.9
Commercial Passengers Van 2 6% 2 14% 1 7% 1 4% 6 5.6
Commercial Cargo 2 6% 2 1.9 Light Truck/ P.U. - 2 or 4 rear tires 10 32% 4 29% 5 33% 6 23% 9 41% 34 31.5
Public Transportation Medium Truck - 4 rear tires 1 3% 1 0.9
Public School Bus Heavy Truck - 2 or more rear axles 1 3% 1 0.9
Private School Bus Truck Tractor (Cab-Bobtail)
Ambulance Motor Home (RV)
Law Enforcement 1 5% 1 0.9 Bus (driver + seats for 9 - 15)
Fire/Rescue Bus (driver + seats over 15)
Military Bicycle
Other Government Motorcycle 1 3% 1 7% 6 23% 1 5% 9 8.3
Dump Moped
Concrete Mixer All Terrain Vehicle
Gargabe or Refuse Train
Cargo Van Low Speed Vehicle
Other 2 9% 2 1.9 Other 1 4% 1 0.9
Total 31 29% 14 13% 15 14% 26 24% 22 20% Total 31 29% 14 13% 15 14% 26 24% 22 20%
110
VEHICLE INVOLVEMENT
2008 2009 2010 2011 2012 Total
108
VEHICLE USE VEHICLE TYPE
Total
108 108
Total 2008 2009 2010 2011 20122008 2009 2010 2011 2012
110
Total 2008 2009 2010 2011 2012
110 110
POINT OF IMPACT SITE LOCATION
2008 2009 2010 2011 2012 Total
110
ROAD SURFACE CONDITION
2008 2009 2010 2011 2012 Total
2008 2009 2010 2011 2012 Total
ACCIDENT LANE NUMBER ROAD CONDITION AT TIME OF CRASH
2008 2009 2010 2011 2012 Total

# % # % # % # % # % # % # % # % # % # % # % # %
Straight Ahead 21 68% 10 71% 9 60% 18 69% 16 73% 74 68.5 North 4 13% 1 7% 1 4% 1 5% 7 6.4
Slowing / Stopped / Stalled 2 6% 1 4% 2 9% 5 4.6 South 1 3% 2 14% 3 20% 2 7% 1 5% 9 8.2
Making Left Turn 3 10% 3 21% 6 40% 4 15% 1 5% 17 15.7 East 16 52% 5 36% 8 53% 9 32% 12 55% 50 45.5
Backing 1 3% 1 0.9 West 10 32% 7 50% 3 20% 14 50% 8 36% 42 38.2
Making Right Turn 1 3% 1 7% 3 12% 5 4.6 Unknown 2 7% 2 1.8
Changing Lanes 1 3% 1 5% 2 1.9 Total 31 28% 14 13% 15 14% 28 25% 22 20%
Entering / Leaving Parking Space
Property Parked
Improperly Parked # % # % # % # % # % # %
Making U-Turn Clear 19 61% 10 71% 13 87% 24 86% 16 73% 82 74.5
Passing 2 6% 2 1.9 Cloudy 10 32% 2 14% 2 13% 4 14% 2 9% 20 18.2
Driverless or Runaway Vehicle Rain 2 6% 2 14% 4 18% 8 7.3
All Other 2 9% 2 1.9 Fog
Total 31 29% 14 13% 15 14% 26 24% 22 20% All Other
Total 31 28% 14 13% 15 14% 28 25% 22 20%
# % # % # % # % # % # % Total
1:00 AM 1 7% 1 0.9 # % # % # % # % # % # %
2:00 AM 1 3% 1 7% 1 4% 1 5% 4 3.6 Daylight 23 74% 9 64% 8 53% 21 75% 15 68% 76 69.1
3:00 AM Dusk 1 3% 2 7% 3 2.7
4:00 AM 1 3% 1 4% 2 1.8 Down 2 13% 2 7% 1 5% 5 4.5
5:00 AM 1 3% 1 7% 1 4% 3 2.7 Dark (Street Light) 4 13% 3 21% 3 20% 5 23% 15 13.6
6:00 AM 1 3% 1 4% 2 9% 4 3.6 Dark (No Street Light) 3 10% 2 14% 2 13% 3 11% 1 5% 11 10.0
7:00 AM 1 3% 1 7% 3 20% 3 11% 1 5% 9 8.2 Unknown
8:00 AM 3 10% 1 7% 2 7% 2 9% 8 7.3 Total 31 28% 14 13% 15 14% 28 25% 22 20%
9:00 AM 2 14% 1 5% 3 2.7
10:00 AM
11:00 AM 1 3% 2 13% 4 14% 1 5% 8 7.3
12:00 PM 1 3% 1 4% 2 1.8 # % # % # % # % # % # %
1:00 PM 1 7% 2 7% 1 5% 4 3.6 January 2 6% 1 7% 1 4% 1 5% 5 4.5
2:00 PM 5 16% 1 7% 1 4% 7 6.4 February 5 16% 3 21% 2 7% 10 9.1
3:00 PM 1 3% 1 7% 3 11% 2 9% 7 6.4 March 4 13% 2 14% 5 33% 2 7% 2 9% 15 13.6
4:00 PM 5 16% 1 7% 1 7% 3 11% 2 9% 12 10.9 April 2 6% 2 14% 2 13% 6 5.5
5:00 PM 4 13% 2 14% 1 4% 3 14% 10 9.1 May 2 6% 1 7% 2 13% 2 7% 2 9% 9 8.2
6:00 PM 1 3% 2 14% 1 7% 1 4% 1 5% 6 5.5 June 1 3% 1 7% 2 7% 2 9% 6 5.5
7:00 PM 2 6% 1 7% 1 7% 1 4% 1 5% 6 5.5 July 6 19% 2 13% 7 25% 3 14% 18 16.4
8:00 PM 1 4% 1 0.9 August 2 14% 4 14% 1 5% 7 6.4
9:00 PM 1 3% 1 7% 2 13% 4 3.6 September 3 10% 2 7% 4 18% 9 8.2
10:00 PM 1 3% 1 5% 2 1.8 October 1 3% 2 14% 2 13% 4 14% 2 9% 11 10.0
11:00 PM 1 7% 1 4% 3 14% 5 4.5 November 3 10% 1 4% 2 9% 6 5.5
12:00 AM 1 3% 1 7% 2 1.8 December 2 6% 1 7% 1 7% 1 4% 3 14% 8 7.3
Total 31 28% 14 13% 15 14% 28 25% 22 20% Total 31 28% 14 13% 15 14% 28 25% 22 20%
# % # % # % # % # % # % # % # % # % # % # % # %
16-25 7 23% 5 36% 7 47% 6 23% 6 27% 31 28.7 Monday 4 13% 1 7% 2 7% 1 5% 8 7.3
26-40 9 29% 2 14% 1 7% 7 27% 4 18% 23 21.3 Tuesday 5 16% 4 29% 4 27% 4 14% 4 18% 21 19.1
41-65 9 29% 4 29% 3 20% 12 46% 7 32% 35 32.4 Wednesday 6 19% 1 7% 3 20% 3 11% 4 18% 17 15.5
Over 65 1 3% 3 21% 2 13% 1 4% 4 18% 11 10.2 Thursday 4 13% 3 21% 3 20% 5 18% 2 9% 17 15.5
Unknown or Other 5 16% 2 13% 1 5% 8 7.4 Friday 6 19% 3 21% 2 13% 4 14% 5 23% 20 18.2
Total 31 29% 14 13% 15 14% 26 24% 22 20% Saturday 5 16% 7 25% 3 14% 15 13.6
Sunday 1 3% 3 21% 2 13% 3 11% 3 14% 12 10.9
Total 31 28% 14 13% 15 14% 28 25% 22 20%
# % # % # % # % # % # %
None 27 87% 11 79% 14 93% 25 89% 20 91% 97 88.2
Alcohol Involved 4 13% 3 21% 1 7% 2 7% 2 9% 12 10.9
Drugs Involved
Alcohol and Drugs Involved 1 4% 1 0.9
Undetermined
Total 31 28% 14 13% 15 14% 28 25% 22 20%
WEATHER
2008 2009 2010 2011 2012 Total
Total
110
2008 2009 2010 2011 2012
110
2009 2010 2011
2008 2009 2010 2011 2012
2012
2008 2009 2010 2011 2012 Total Total
108
2008
Total
2012 Total
TIME OF DAY
MONTH
LIGHTING
108
110
AGE
110
110
110
DAY OF THE WEEK
2008 2009 2010 2011 2012
2008 2009 2010 2011 2012
VEHICLE DIRECTION
110
Total
ALCOHOL/DRUGS INVOLVEMENT
2008 2009 2010 2011
2008 2009 2010 2011 2012 Total
VEHICLE MOVEMENT
5
10
15
6
9
6
18
7
9
11
6
8
0
2
4
6
8
10
12
14
16
18
20
MONTH
8
21
17 17
20
15
12
0
5
10
15
20
25
DAY OF WEEK

Appendix C
FDOT 2017 Plans Preparation Manual, Volume 1, Chapter 23, Section 23.5


Topic #625-000-007 January 1, 2013Plans Preparation Manual, Volume 1 – English Revised – January 1, 2014
Design Exceptions and Design Variations 23-7
23.5 Documentation for Central Office Approval
During the justification process supporting documentation will be generated which needs to accompany each submittal. This documentation includes, but is not limited to the following:
All Design Variations needing Central Office approvals and all Design Exceptions should include the following documentation:
a) Exhibit 23-A Submittal/Approval Letter Included (Cover Letter)
b) Summary description of included support documentation such as:
1) Location map or description,
2) Typical section,
3) Aerial or Photo logs when they best illustrate the element issues,
4) Crash History and analysis,
5) Plan sheets in the area of the Design Exception/Design Variation elements,
6) Profiles in the area of vertical alignment Design Exception/Design Variation elements,
7) Tabulation of pole offsets for horizontal clearance Design Exception/Design Variation, and
8) Any Applicable Signed and Sealed Engineering Support Documents.
c) Project description (general project information, typical section, begin/end milepost, county section number). Include Work Mix, To – From, Objectives, Obstacles and Schedule.
d) Description of the Design Exception/Design Variation element and applicable criteria (AASHTO and Department value or standard). Detailed explanation of why the criteria or standard cannot be complied with or is not applicable.Description of any proposed value for project and why it is appropriate.
e) Amount and character of traffic using the facility. Description of the anticipated impact on Operations, Adjacent Sections, Level Of Service, Safety, Long and Short Term Effects. (Is the Design Exception temporary or permanent?) Description of the anticipated Cumulative Effects.

Topic #625-000-007 January 1, 2013Plans Preparation Manual, Volume 1 – English Revised – January 1, 2014
Design Exceptions and Design Variations 23-8
f) A plan view or aerial photo of the Design Exception location, showing right of way lines, and property lines of adjacent property.
g) A photo of the area.
h) Typical section or cross-section of Design Exception location.
i) The milepost and station location of the Design Exception.
j) Any related work programmed or in future work plans.
k) The Project Schedule Management (PSM) Project Schedule Activities maintained by the Finance Management Office.
l) All mitigating efforts. An explanation of what if any associated existing or future limitations as a result of public or legal commitments. Description and explanation of any practical alternatives, the selected treatment and why.
m) Comments on the most recent 5-year crash history including all pertinent crash reports.
n) Description of the anticipated Cost (Social and to the Department - Benefit/Cost)
o) Summary Conclusions
For the specified conditions the following additional documentation is required:
p) For design speed on SIS, provide typical sections at mid blocks and at intersections.
q) For lane width, provide locations of alternative routes that meet criteria and a proposal for handling drainage, the proposed signing and pavement markings.
r) For shoulder width, provide a proposal for handling stalled vehicles and a proposal for handling drainage.
s) For bridge width, provide a plan view of the approaching roadways and existing bridge plans (these may be submitted electronically).
t) For a bridge with a design inventory load rating less than 1.0, a written evaluation and recommendation by the Office of Maintenance is required. Provide the load rating calculations for the affected structure.
u) For vertical clearance, provide locations of alternative routes that meet criteria.

Topic #625-000-007 January 1, 2013Plans Preparation Manual, Volume 1 – English Revised – January 1, 2014
Design Exceptions and Design Variations 23-9
v) For cross-slope, provide a proposal for handling drainage and details on how the cross slope impacts intersections.
w) For conditions that may adversely affect the roadway’s capacity, provide the comments on compatibility of the design and operation with the adjacent sections. Effects on capacity (proposed criteria vs. AASHTO) using an acceptable capacity analysis procedure and calculate reduction for design year, level of service).
x) For superelevation, provide the side friction factors for the curve for each lane of different cross-slope at the PC of the curve, the point of maximum cross-slope, and the PT of the curve using the following equation.
f = V2 – 15ReV2e+15R V = Design Speed (mph)
where f = Side Friction Factor
R = Radius (feet) e = Superelevation (ft/ft) at the station evaluated
y) For areas with crash histories or when a benefit to cost analysis is requested, provide a time value analysis between the benefit to society quantified in dollars and the costs to society quantified in dollars over the life of the Design Exception. In general practice the benefit to society is quantified by the reduction in crash cost foreseeable because of the proposed design and the cost due to the implementation of that change such as construction and maintenance costs over the life of the project. The Discount (interest) rate to be utilized in benefit/cost analysis is 4%.
Two acceptable methods for calculating a benefit/cost analysis are:
1. Roadside Safety Analysis Program (RSAP)This method complements the Roadside Design Guide dated June 2002. When hazards cannot be removed or relocated, designers need to determine if a safety device, such as a guardrail or a crash cushion, is warranted to protect motorists from the roadside obstacle. This method can be used to perform a benefit/cost analysis comparing a safety treatment with the existing or baseline conditions (i.e., the do-nothing option) and/or alternative safety treatments. Based on the input (offsets, traffic, slopes, crash history, traffic accident severity levels, etc.) of information available to the user, the program will offer results which can be used in comparing courses of action.
When utilizing RSAP for analysis, the accident severity level costs should be revised as follows:

Topic #625-000-007 January 1, 2013Plans Preparation Manual, Volume 1 – English Revised – January 1, 2014
Design Exceptions and Design Variations 23-10
Option 3: KABCOCrash Severity Comprehensive Crash Cost
Fatal (K) $6,820,000
Severe Injury (A) $557,752
Moderate Injury (B) $111,228
Minor Injury (C) $67,890
Property Damage Only (O) $6,500
Source: Florida Department of Transportation Crash Analysis Reporting (C.A.R.) System
2. Historical Crash Method (HCM)This method can be used for sites with a crash history. It is basically the ratio (benefit/cost) of the estimated reduction in crash costs to the estimated increase in construction and maintenance cost. The annualized conversion will show whether the estimated expenditure of funds for the benefit will exceed the direct cost, thereby lending support as to whether the improvement should be done or not.
The HCM uses the following Highway Safety Improvement Program Guideline (HSIPG) cost per crash by facility type to estimate benefit to society while the cost to society is estimated by the cost of right of way, construction, and maintenance.
All State Roads Average Cost/Crash: $141,085
The above values were derived from 2007, 2008, 2009, 2010 and 2011 traffic crash and injury severity data for crashes on state roads in Florida using the formulation described in FHWA Technical Advisory “Motor Vehicle Accident Costs”, T 7570.2, dated October 31, 1994 and from a memorandum from USDOT, Revised Departmental Guidance: Treatment of the Value of Preventing Fatalities and Injuries in Preparing Economic Analyses, dated February 5, 2008 updating the value of life saved to $5.8 million, updated from $5.8 million to $6 million on March 18, 2009 and to $6.2 million on July 29, 2011, per the memo posted at:http://www.dot.gov/sites/dot.dev/files/docs/Value_of_Life_Guidance_2011_Update_07-29-2011.pdf.
HSIPG COST/CRASH BY FACILITY TYPEFACILITY TYPE
DIVIDED UNDIVIDEDURBAN SUBURBAN RURAL URBAN SUBURBAN RURAL
2-3Lanes
$98,837 $150,613 $262,821 $114,040 $222,040 $416,658
4-5Lanes
$110,115 $183,372 $369,954 $87,390 $158,476 $93,628
6+ Lanes$109,638 $130,645 $545,271
n/a n/a n/a
Interstate$138,873
n/a$274,449
n/a n/a n/a
Turnpike$127,584
n/a$218,394
n/a n/a n/a

Appendix D
NCHRP 152 Warrant Procedure

other vehicles, and pedestrians. These situational featuresbecome extremely important when they do not conform tothe driver's expectancies.
For basic definition of roadway geometry and features inoutlying or residential areas experience has indicated thatlighting intensities of at least 0.6 horizontal footcandles willsuffice. For special features, such as pedestrians in darkclothing and unexpected roadway objects, intensities con-siderably above these basic values appear to be necessary.This is especially true as competition between driving tasklevels increases.
It is suggested that the lighting intensity levels for resi-dential area classification, as recommended by the newAmerican National Standard Practice for Roadway Light-ing, be used as basic lighting levels for the various func-tional classifications and adjusted based on geometric, op-erational and environmental complexity instead of area
25
classification. In addition, it is suggested that these levelsbe adjusted for pavement conditions. These adjustmentsare discussed later herein.
Warrants
The basic classification scheme discussed previously wasbased on functional, geometric, operational, and environ-mental conditions that produce visual information needsand modify the efficiency of visual communications withthe driver. This basic scheme has been expanded to in-clude a separate classification for each functional type offacility. In addition, the geometric, operational, and en-vironmental parameters that contribute to the informationalneeds have been defined (Table ll). A fourth classifica-tion, accidents, has also been included. Desirable attributesof roadway lighting systems have also been defined (Tablet2).
The research agency staff, consisting of six professionals,
TABLE 11
TRAFFIC FACILITY CHARACTERISTICS PRODUCINGOR AFFECTING VISUAL INFORMATION NEEDS
GEOMETRIC OPERATIONAL ENVIRONMENTAL
(a) Noncontrolled-Access Facilities
Number of lanesLane widthMedian openingsCurb cutsCurvesGradesSight distanceParking lanes
SignalsLeft-turn signals and lanesMedian widthOperating speedPedestrian traffic
DevelopmentDevelopment typeDevelopment setbackAdjacent IightingRaised-curb medians
(å) Noncontrolled-Access Intersections
Number of legsApproach-lane widthChannelizationApproach sight distanceGrades on approachCurvature on approachParking lanes
Operating speed on approvalType of controlChannelizationLevel of servicePedestrian traffic
DevelopmentDeveolpment typeAdjacent lighting
(c) Controlled-Access Facilities
Number of lanesLane widthMedian widthShoulde¡sSlopesCurvesGradesInterchanges
Level of service DevelopmentDevelopment setback
(d) Controlled-Access Interchanges
Ramp typesChannelizationFrontage roadsLane widthMedian widthNumber of freeway lanesMain-lane curvesGradesSight distance
DevelopmentDevelopment setbackCross-road IightingFreeway lighting
Level of service

'i
26
T,{BLE 12
DESIRABLE ATTRIBUTES OFROADWAY LIGHTING SYSTEMS
(¿) Noncontrolled-Access Facilities
Uniform lighting on pavement surfaceInfrequent spacings to reduce glareHigh mounting heights to reduce glareMedian location to reduce headlight glareMedian location to light areas adjacent to roadwayGradual transitions from light to dark areas
G¡adual transitions from dark to light areas
(å) Controlled-Access Facilities
Uniform lighting oû pavement surfaceInfrequent spacings to reduce glareHigh mounting heights to reduce glareMedian location to reduce headlight glareMedian location to light areas adjacent to roadwayHigh-mast lighting in interchange areas
Gradual transitions from light to dark areas
Gradual transitions from dark to light areas
assigned weighting factors to each of the Parameters. Justi-
fication for the weighting factors came from collective judg-
ment, field study results, and the literature (see "TrafficControl and Roadway Elements (25)). An unlighted and
lighted weighting factor was assigned to each parameter.
The difference between the two factors represents the
degree of effectiveness provided by fixed lighting.Tables 13, 14,15, and 16 represent the final classifica-
tion scheme for the various functional facilities considered.
Tlte minimum waruanting condition is the total effective-ness achieved by lighting a traffic facility with an average
rating of three on the subjective scale of I to 5. For exam-ple, the minimum warranting condition for continuous ar-
terial lighting (Table 13) is 85 points. These 85 points
represent a facility where all geometric, operational, envi-
ronmental, and accident Parameters have a rating of 3
(number of lanes, 6; median width, 10 to 20 ft; develop-ment, 30 to 60 percent; night-to-day accident rate, 1.2 to5; etc.) The rating number 3, multiplied by the unlightedweight for each parameter and summed, minus the ratingnumber 3 multiplied by the lighted weight for each Parame-ter and summed, equals the mínimum warrantíng number
oÍ points. If a given continuous arterial traffic facility re-ceived a 3 rating for each and every geometric, operational,environmental, and accident parameter, the facility would
iust meet the minimum requirements for lighting. Anycombination of ratings that will produce a total of 85 points
or more is, of course, warranted. The degree to which the
total warranting points exceed the minimum (85 for con-tinuous arterial lighting) serves as the basis for settingpriorities.
Justification lor Ratings and Weighting Factors
As previously stated, a professional team rated and as-
signed weightings to each of the classification factors' Justi-
fication for the ratings and weightings came from the field
studies, literature, and collective judgment of the profes-
sional team. Each member of the professional team \ryas
provided a transcript of the field study interviews, ques-
tionnaire results, and critique sessions. In addition, each
team member received a summary of accident rates forvarious traffic control and roadway element conditions.
This summary was prepared from Traffic Control andRoadway Elements (25). After each team member hada sufficient opportunity to review this information in de-
tail, eight three-hour work sessions were held to assign the
ratings and relative weightings. Each assignment was dis-
cussed and researched until a consensus of the five-member.team was achieved. The following discussion describes the
rationale involved in the ratings and weightings developedby the professional team. The ratings are highly judg-
mental and experience gained through field application mayIead to refinement and changes in the ratings and weightings.
Geometric Factors
Number of Lanes.-As the number of operating lanes in-creases, the ability of the headlights to effectively light theperiphery of the roadway is greatly reduced, especially ininclement weather. Identification of the extremes of theroadway is an important element in driver orientation.Normal headlights are able to illuminate the traveled laneand one lane on either side to an acceptable degree. There-fore, with two lanes in one direction (total of four lanes)the driver should have little difficulty in locating the ex-
tremes of the roadway and the condition would be ideal-a rating of 1. Three lanes in one direction would result inthe drivers in the inside or outside lane being able to iden-ufy only one edge of the roadway-not critical, but cer-tainly not ideal. Thus, a rating of 3 seems appropriate.With four or more lanes in one direction, the orientationof the driver becomes a critical factor and the 5 rating isjustified.
Lane Width.-As the effective width of the lane is re-duced, the problem of tracking becomes increasingly im-portant to the driver. This results in increased concentra-tion on the steering (positional) task and a reduction ofa corresponding amount of time that can be devoted to theother elements of the driving task. Therefore, it is im-portant to provide an environment that minimizes theamount of time required to accomplish the nontrackingaspects of driving. A lane width of 13 ft or more presents
little difficulty and is, therefore, assigned the ideal ratingof 1. A lane width of 9 ft or less is critical, as there islittle leeway for tracking errors. A rating of 5 has been
assigned to this condition. An ll-ft lane is acceptable formost operations and has been assigned a rating of 3, thuscompleting the scale of ratings for lane width for allclassifications.
Number of Legs.-For at-grade intersections, the com-plexity of operations increases as the number of approach
legs to the intersection inçreases. Ideally, there would be
no intersecting legs (i.e., no intersection). Three inter-secting legs, such as a T or Y intersection, would be the
smallest number of legs possible to have an intersection.
This condition has received a rating of 2. Six or more legs,
or traffic circles, represent the most complex condition and
..i
l
..-ì
'. j
'.!
... i'.:

27
TABLE 13
CLASSIFICATION FOR NONCONTROLLED-ACCESS FACILITY LIGHTING
cLAssIFtcåil0t{FACIDf,
GEO€IRIC FACIORS
No. of lanes
La¡e widtì
l,fedlan Openingsp€r nile
Cu¡b Cuts
Curues
Grades
Sight Dlstmce
Parking
OPËRATIOML FACTDRS
Signals
Left turn lane
Medim t{idth
Operating Speed
Pedestrim Trafficat night (peds/ni)
BIVIROÍ$EfiTAL FACTORS
I Developr¡ent
Predminmt TypetÞve¡oprent
Sctback Distance
Advertising orerea lighting
Raised CuröMedian
Crlre Rate
4 oÌ less
>12'
.4.0 or oneway operation
r 10t
< 3.00
<5t
,700 1
prohibi tedbotJr sides
ell mjorintersectionssignal i zed
ali najorinter-sectiorl.sor one wayoperation
30'
25 or less
very ffl ornoiìe
0
mdevelcpedor backLpdesign
>200
none
none
extrerÞlyItr
0,8 0 .2
2.5 0.5
5.0 2.0
1.0
3,0
5.0
2,6
5.0
1.0
t.0
4.0
0.5
o-2
0.5
-0.8
-l. 5 0.5
OPERATIOi|ÁL ,ltNAL
0.5
0.5
1,0 _
0.3 0,2.-0.3 0.2
-0¡5 0.2
-1.0 2.0
-0.5 0.5 _
0.5
3.0
1.0
ACCIDSITS
Råtio of nieit today ûccidcnt rates
rContimnw lighting warranted
1.0 0.5 , 0,5 _
EIWIROT$ÆNTAL TOTÁI
/ICCIDE{T 1I}TAL
8.0
-
2.010.0
POINTS
RAr¡rs oLll LtoflÐ scæ---ñ-æ ïlÍn TåÎn ?lit rl?l$'ç¡
l?l
4 .0 -8.0
I 0- 201
3. t-6.00
3.0-3.9t
s00- 700 |
loadingzones only
subststielmjorlty ofintersectimssigmli zed
substmtialmajority ofintersections
20-30f
30
0- 50
0- 30t
res identlal
1 S0- 200 |
0-40t
cont inuous
lorer tj¡ancity aver.
t.0-1.2 1.2-1.5
6
l1'
8. t-12.0
20- 30f
ó. 1- 8.00
4 .0-1 ,9¡
300- 500 |
off-peakonly
rþst mjorintersectionssigneli zed
mst mjorintersectims
l0-20'
35
s0- 100
50-ó0t
half- ¡esiden.tiat and/orcomercial
100-150r
¡t0-ó0¡
åt e¡l inter-sectlo[s
clty aver.
1.5-2.0
GEOMETRIC 1W'AL
OPERATICJI,IAL TOTAL
RIVIRfINMFTTAI TÛTAI, =
ACCIDTNT ft'TAL
Stl'l =
t0l
12.0- r s.0
30- 40t
8. r-t0.0"
5.0-6.9t
200- 300 '
perr¡ittedore slde
ebout halftjle intersec-ti oßslgnali zed
about halfthe FajorintersætloN
4-I0'
40
100-200
60-90t
industrielor comr-cial
50-100 |
60-80¡
at signallzedintersections
higher thmcity aver.
I or mre
.10'
>15.0 or noaccess control
'¡l0i)100
7l or mre
<2001
pemittedbotì sides
fre+Ent non-signalizedlntersectlons
infrequentturn bays orrndividedstrets
0 -4,
45 or grcater
>200
r00t
strip iîdrE-trlal orcorprcial
<50
essentiallycontlnwLs
af*loetioß
extrælyhigh
2.O.
5.0 5.0 2.O
13,0 5,0 t,0
t.2 2.8 0,1
2,0 1.8 0,2
0.2 0.I 0.1
GBO'GTRTC Î{YTA,
0.2
-1.0
-
lil nnAl{TINc CT'{DITIoN = BS rþints

28
TABLE 14
CLASSIFICATION FOR INTERSECTION LIGHTING
ct AsslFlcATlol RATII,IGIJ¡LIT LICI{IED SCORE
TÄfl T¡f' ?Äl5r lftI$,
2.5 0.5
-
¡ÀCEß
6E0rrlRlc FAcl0Rs
Ntmher of legs
^pproûdr l,rne Wldtlt
(:hmnel i znt lon
Âpprcnch Si¡¡htD i s tsncc
Crades on ÀpproachStr€c t s
Curvature onApprcach l.egs
Parking in Vicinity
OPERATIOIAL FAClOf,S
Operûting Speedon Âpprcacå Legs
T)¡pc of Contml
Chonnel i zation
Level of Service(Load l;actor)
Ìcdestrim Vol.(peds/hr crossing)
BIVIROITI{TAL FACTORS
Percent ^dj¿¡centDcvclopmnt
Prcdmi narìtlÞvelofmrt ncarlntersect ion
LiShtinB in lmncdiateVicini ty
Crirc Ratc
ACCITEffTS
l
l2'
4
1l' l0l
5 oormre
)¡21
no tum lanes
' 700'
(31
. 3.0"
proh ibi terlhoth sidcs
25 nph orlcss
all phasessignalizer.l(incl. tunlmc)
lcft anrl rightsignal control
0.0
vcry fw ornone
0
tuntlevc loped
none
cxt rcnc I ylæ
(including trafficc.i rcl es )
. l0'
45 nph orgreãtcr
stop controlto minor Icgsor no control
no tunì lanccontrol
lì0.7-1.0
> 200
r 007
strlp industrialor cmrcial(no circuity)
essent i al lycont i nuous
ex trcre lyfictt
¿,0r
1 .8 0.2
¿,8 0.4
-5.0 8.0
-0.1 0,1
-
3.0 2,5 0.5
2.0 1.0 I .0left t[m lâìcs left turn limcs left flnd ri8ht .lcft an<l righton mior leßs on all le¡s, ttlrn lancs on tum lanes on
right tunì naJor lcgs all legsl:utes on nnjorlegs
500-700' 300-500' 200-300r '200'
1.0-3.91 4.0-4'91 5.0-6.91 7t or rcrc
3.0-6.0' ó,1-8.0' 8.1'10'0" '10"
loa<ling zones otf-peak nemittc(l one pemittctlonly only- sltlc only botlt siclcs
2,0
3.2
t 3.0
0.2
(ìDoMitRtc 1nl^l
0.2 0.8
-2,7 0.5
-I
il
30 Íph
left turnlajìe signalcontro.l
left and rightturn lmesignat controlon major legs
B0-0.1
0- s0
0-30I
¡es identi al
0- 403
liler thmcity avcr.
1.0-1.2
35 Írph
through trafficsignal controlonly
left tunì lrmesignal controlon all legs
(:
0.1-0.3
50- 100
40 nqrh
4-way stopcont rol
left tun lânesignal controlon mâjor legs
D
0.3-0.7
I 00- 200
ó0-901
indrlstrial orcmrcial
ó0-E0t
highcr thancity aver.
I .5- 2.01.2-1.5
ctiot{;tIilc 1('rIAl,
ot,l;R TloN^t, 1l)l^l
lNvlRrN¡ilNL^I, 1I)l)\1, =
-^(:(:lIll'11
11)1^1,
SII\I = I'rllNlS
1.0
3.0
3.0
0.5
0.5
5.0
1,0
1.0
-t.0 0.2 0.8 _
1.5 0.5 1.0
-ot't:!ì^l roN^l, mT L
30-601
50? rcsiden-tiäl - 50tindustrial orcom rc i a'l
40- 601
ci ty avcr.
0.3 0.2
-0.3 0.2
-..-.._
l.s 1.5
--0.5 0.5
-
lhtio of ni¡lht to 1.0day ¡lccidcnt rates
I :NV I RONMINTAI,'IOI'AL
t0.0 2.0
^(:(:ll)l;Nl'11)t^l,rlntencct ion I i ght ing tv¡rrr¡rnte<l
t{,\RRA.ll rN(ì (r)Nt}t1loN = ?!_ulil_tl

29
TABLE 15
CLASSIFICATION FOR CONTROLLED-ACCESS FACILITY (FREEWAY) LIGHTING
CLASStFtC il$tFACIOR
--:
- R4rr{G --
Ërå]t lJffi o,rr. ,rffi12GEOIT'IRIC FACTORS
No, of Lanes
l,anc Width
l',ledim t{idth
Shoulrlers
S lopes
(;urves
Grades
Interchange Freq.
OPERAÏIOI{AL FACÍORS
Level of Scruice(any dark hour)
EIW I ROT!'TNTAL FACTORS
t Develofrent
Offset to Develop
ACCIENTS
L0 0,8 0.2
3.0 2,5 0.5
1.0 0.5 0.5
1.0 0.5 0.5
1.0 0.5 0.s
13.0 5.0 8.0
3.2 2.8 0.1,
4.0 1,0 5.0
GMi$TRIC TIYTAI
4
>l2l
>40 |
l0r
18: I
o-t/2'
.3t
4 ni,
12'
24-s9 |
8,
6: I
t / 2-1"
3-3.9t
3 ni.
252
150 |
6
ll''tz- 23,
4:I
t -2"
4-4.9t
2 ni-.
50t
100'
1.2-1.S
l0'
4-11'
3:l
2-3.
5-6.9t
I mi.
1.5-2.0
¡&
:9'0- 3'
2il
3-4'
>7t
.1 ni.
I 00t
?50 |
1.06.0 5.0
-
0r
200.1
7st
50'
OPERATICII{AL 'IO|rAL
t.5 0.5 3.0
3.5 0.5 3.0
TXVIRO¡¡I"filTAL TUTAL
Ratio of nlght t.0to day accidentrates
tcontinuo[s lighting warrmted
2.0. 10.0 2.0
ACCIDÐ{T ÌOTAL
8.0
-GR)IIÍIJTRIC 1ÛTAL
OPERA]'Ioi*¡ÂL ïn^L
B{VIRONIfiNTAL TOTAJ, =
-
ACCIDE\TT 'IOTAL
Stlrl = F0INTS
W^RRÂNTING ffNDITI(N = 95 points
have been given the rating of 5. Uniform distribution hasbeen used to assign ratings of 3 and 4.
Median Openings.-Ihe control of access reduces theprobability of accidents occurring between through andturning vehicles. As the number of access points is in-creased, the possibility of conflict increases; therefore, thereis a greater need for lighting. Two-way noncontrolled-access streets with median openings at 1,000-ft or greaterintervals, and one-way streets, have nearly ideal operationfor this condition and therefore are given a rating of 1. Ablock spacing of 500 ft (i.e., about ten openings per mile)is considered to be about the minimum condition for ac-ceptable street operation and has been assigned a rating of3. A spacing of 300 ft or less between openings, or a
situation with no separator and two-way operation, resultsin a low quality of street operation. This condition hasbeen given a rating of 5, as a good view of the vehiclemaneuvers ahead is critical to safe and efficient vehicleoperation. Also, the observed accident rate increases ra-ther slowly up to 15 openings per mile and a great dealmore rapidly thereafter (25).
Curb Cuts.-.The number and length of curb cuts deter-mine the number of vehicle maneuver points available andthe degree of operational complexity on noncontrolled-access streets. Less than 10 percent curb openings will notsubstantially impair traffic operation; therefore, an idealrating of 1 seems appropriate. When curb openings ap-proach 50 percent, the complexity of operation is critical;

30
I
TABLE 16
CLASSIFICATION FOR TNTERCHANGE LIGHTING
I¡LIT Lto{fÐ
GEO'TIRIC FACTORS
Rarp Types
Cross-RoadChameli zation
Frcntage Roads
Frecryay l¿net{idtlls
Freeray I'ledim¡{idr}s
lto Freervay Lmes
l.lain Lane Curves
Grades
Sight Dist. CrossRoad lntersection
OPCRATIOML FACTWS
tÆrel of Seruice(my <lark hour)
ErvlRotfE{fÄ- FACRnS
t DeveloFrent
Set-Back Distance
C¡tss-Road ÂpproachLighting
Fr€æây Lightlng
ACCTE{fs
Rate of night today accident rates
Button llooksCloverleã fs
con t inuous
one -way
ll
t2-24
6
2-3"
4-¿t.9t
500- 700,
c
2 quad
100- 1 s0'
partial
interchmgesonly
1.2-1.5
GMMETRIC ïT'V.I
Scissors andLeft- s ide
at interchangeintersections
two -way
<10
.4
I or mre
'4"7t or mre
.400'
Ë
4 quad
r 501
conplete
contimnur
>2.0,
1.5 1.0
3.0 2.5
1.0 0,5
1.0 0.8
13.0 s.0
1.0
1.0
-
0.5
-0.2
-
8.0
-
0.4
-0.2
-:
5.0
-:
1.5
-
0.2
-1.0
-2,0
-
-8.0
Diræt
none
none
,t2
>40
4 or less
,t/2"
]T
'10001
A
Diamnd
12
31-40
L-2'
3- 3.9?
700- I000,
B
I quad
1s0-200 |
Tnrpet
l0
4-t2
3-1'
5.ó.9t
400- 500,
t)
3 qrud
50 - 100'
1.0
1.0
2.0
2.0
0,5 .-0.s
-
3.2
2.O
GE{Í'TETRIC TÛI'AL
6.0 1.0
OPERI\TISIAL 'IOT/\L
2.0 0.5
0,5 0.3
3.0 2.0
5.0 3.0
T''IVI RONIIf,'ITTAL'IÛTAL
/\cctDl$tT ToT L
2.8
l.E
none
>200!
ru)ne
none
1.0-1.2 1.5-2.0
OPERATIGÜ\L T(NAL
R¡VIRflNl.f:1,¡TAL TOT^L =
-ACCIDE\¡T TÛTAL
Stll = fìllNTS
Cû{PLmr LICHIING l{ RR ¡¡ÎINC mt¡DtTlotl = 90 Doints
P^RIIAL LIOIIING I{ARR/\NTINC C$¡D!TIOi¡ = 60 rnints
2.0
rcorplete lighting warrmtcd
thus, the rating of 5 is assigned. For the interval between
I and 5, the percentage of curb openings has been uni-formly distributed.
Curves.--The degree of difficulty in negotiating hori-zontal curves is probably best indicated by accident ex-
perience. Curves with curvature in excess of 10' fornon-controlled-access streets and 4' for controlled-accessfacilities have apparent accident'rates four to five times
those with lesser curvature (25). Thus, curves of 10' and
4', respectively, have been selected as the upper limit ofscale and assigned a value of 5. Curves up to 3' for non-
controlled-access facilities and 1/2o for controlled-accessfacilities have a minimum accident rate. The intermediateratings have been distributed in general accord with the
apparent exponential accident rate with increasing curve
severity.Grades.-The relationship between grade and driving
complexity is difficult to establish. The interaction of grade
and curvature seems to indicate a linear relation with in-creasing grades. Below 3" there is little eftect of grade and
a rating of I is approPriate. At more than 7 Percent, the
effect of grade is very pronounced and the effect is still

appreciable on grades of more than 5 percent. Thus, 5 per-cent was established as the upper bound of the minimumvalue and is assigned a rating of 3. The remaining gaps
were distributed uniformly.Sight Distanc¿.-The operating speeds on arterial streets
and the expected occurrence of conflicts reduce the need
for extended sight distance. A sight distance of less than200 ft would certainly be critical; greater than 700 ft wouldundoubtedly provide greater information than the drivercould effectively use. These two extremes were assignedratings of I and 5, respectively, and the ranges betweenthese extremes have been distributed in a uniform manner.For controlled-access conditions, where higher speeds andless frequent expected conflicts exist, a sight distance of400 ft has been assigned the critical rating, with 1,000 ftas the ideal. These two extremes were assigned ratings ofI and 5, respectively, and the ranges between these ex-tremes have been distributed in a uniform manner.
Channelizatior?.-From a geometric standpoint, chan-nelization at intersections and cross-road channelization atinterchanges introduces visual task problems for the driver.The less frequent the channelization, the fewer visual taskproblems will be encountered. Thus, intersections with nochannelization have been given the ideal rating of 1,
whereas complete channelization on all approaches hasbeen given the rating of 5. Uniform distribution has beenused for the ranges between. For cross roads at inter-changes, the intersections without channelization have beenrated at 1. Continuous channelization of the crossroad hasbeen given the middle rating of 3. Channelization at theinterchange intersections only has been rated at 5. Thiswas done to account for the unexpected occurrence ofchannelization after driving in an area with no chan-nelization.
Median Width.-Median width has been included fromthe geometric standpoint on controlled-access facilities todescribe the level of comfort associated with opposingvehicle separation. A separation of 40 ft or more is suffi-cient to eliminate interaction between opopsing vehiclesand has been assigned the rating of 1. Median widths ofless than 4 ft represent the most undesirable condition,rated at 5. Relative uniform distribution has been used forthe ranges between.
Parking.-The effect of parking on the need for lightingis directly related to the parking condition on the facility.Five basic conditions were identified and assigned to therating scale, as follows:
PARKING
CONDITION
RATING
Prohibited both sidesLoading zones onlyOff-peak parking permittedParking permitted, one sideParking permitted, both sides
1
2J
45
3l
Shoulders.-Although parking is prohibited on controlled-access facilities, there often are emergency situations wherevehicles must take refuge adjacent to the through trafficlanes. For this reason shoulders or other areas of refugeare important. The absolute minimum shoulder width thatcan accommodate a stopped vehicle is approximately 6 ft,and this value has been given the rating of 3. An idealsituation would be 10 ft, assigned the rating of 1. Theabsence of shoulders represents an absolute critical condi-tion, assigned the value of 5.
Slopes.-For the high-speed operation of controlled-access facilities, it is desirable to provide gentle slopes forerrant vehicles. Slopes of 4:1 have been generally ac-cepted as the desirable minimum and thus have beenassigned the rating of 3. Slopes of 2:1 have been acceptedas the absolute maximum, assigned the value of 5. Theideal rating of I has been given to slopes of 8:1 or greater,the current accepted desirable slope.
I nterchanges.-Interchange frequency has been includedin geometric conditions for controlled-access facilities torepresent the geometric design problems that usually resultwhen interchange spacings are close. It is desirable to haveat least two miles between interchanges to develop accelera-tion and deceleration lanes and gentle vertical profiles. Thisspacing has been rated 3. Any spacing closer than one miledoes not provide adequate distance for good geometricdevelopmeht. Thus, spacings closer than one mile havebeen assigned the rating of 5. The ideal rating of t hasbeen assigned to spacings of four miles on an arbitrarybasis, but considering that this spacing is possible only inrural areas.
Ramp Types.-This category is included to represent thecomplexity of various ramp types. The most difficult of allramp types to negotiate are the scissors and left-side exits.These have been rated at 5. The next most difficult are thetrumpet ramps, rated at 4. Button-hook ramps and clover-leafs have been rated at 3, and diamond connections at 2.Direct connections have been given the I rating.
Frontage Roads.-{he presence or absence of frontageroads on controlled-access facilities determines to a largeextent the geometric design of ramps and the extent ofactivity adjacent to the facility. Two-way frontage roadsare the most complex and have been rated at 5. Freewayswithout frontage roads preclude the problem and thus arerated at l. One-way frontage roads have been rated at 3.
Operational Factors
Signals.-The presence or absence of traffic signals atmajor intersections is a major determinant in the need forexternal illumination. The lack of target value of signsincreases the need for identification of the intersection areaas well as decreasing the degree of difficulty of the track-ing task, thr.rs permitting greater concentration on theoperational situation. The descriptors represent the broadspectrum of conditions that exist on noncontrolled-accessfacilities.
Left-Turn Lane and Signal.-The presence or absence ofa left-turn lane and protected signal phase are importantcontributors to smooth and efficient operation. When these

:]I
:a:
32
facilities are not provided. the identification of turning ve-hicles becomes a critical part of the night driving environ-ment. Again, lighting can do little to correct the basicproblem except to reduce the complexity of the driving taskon the approaches to the critical intersection. As the fre-quency of these critical intersections increases, the need alsoincreases for a reduction in driving task difficulty to providemore time for concentration on other elements of the task.The descriptor reflects this need.
Median Wídth.-An increase in the width of the medianincreases operational efficiency on noncontrolled-access fa-cilities by reducing the effects of opposing headlights andproviding an area to "shadow" turning and crossing vehi-cles. The critical dimension for turning vehicles is 10 ft;for crossing vehicles, 20 ft. Thus, for a median width of30 ft or more, few serious operational problems exist, and arating of I has been assigned to this condition. A medianless than 4 ft in width would provide no space to "shadow"vehicles and, accordingly, has been assigned a rating of 5.Widths in the range of 10 to 20 ft provide space to shadowturning vehicles but not crossing vehicles, a condition con-sidered to be a minimum in this analysis. The remainingratings were assigned values in accordance with these twoconditions. Median width has also been rated for con-trolled-access facilities based on reduction of headlightglare. A median width of 3 ft would provide for an aver-age lateral displacement between drivers of 10 ft, the mostcritical separation from an opposing glare standpoint. Thiswidth has been assigned the rating of 5. Median width of12 to 23 ft represents a lateral separation determined as theborderline between comfort and discomfort, and thus has
been assigned the value rating of 3. A median width of40 ft provides for no discomfort from opposing headlightsand has been assigned the rating of 1.
Operating Speed.-The speed of operation on non-controlled-access street systems is a primary determinantin evaluating the need for lighting. Most modern head-lights will provide sight distance for safe operation up to40 mph. Certainly, operating speeds in excess of this mustbe considered critical, as the use of high beams would besubstantially restricted by the interference with opposingvehicles. A speed slightly below the critical value, say35 mph, should be considered a minimum to provide somemargin for error. Below 25 mph, the headlights shouldprovide sufficient advance warning. The speed range for25 through 45 mph was allocated to the five ratings in5-mph increments.
Pedestrian Traffic at Night.-An increase in the numberof pedestrians crossing the roadway during the hours ofdarkness increases the relative hazard of driving on thefacility. Two hundred crossings per night appeared to besufficient to justify a rating of 5; no pedestrians would bethe ideal condition of 1. The intermediate values wereuniformly distributed between these two extremes.
Channelization.----lhe type of channelization and signalcontrol at an intersection determines the smoothness ofoperation within the intersection. Five descriptors havebeen developed to represent this operation. Left- and right-turn lanes with signal control have been rated at 1. No
channelization or control received the rating of 5. Theremaining descriptors were assigned to the intermediatevalues.
Level of Service.-Level of service is a method of de-scribing operations on controlled-access facilities and inter-sections. Level of service may range from A to F, withA representing ideal conditions. This level has been as-signed the rating of 1. Levels of service E and F representcritical operations and, thus, have been assigned the valueof 5. The intermediate ratings were assigned to levels ofservice B, C, and D.
Environmental Factors
Percent Develo ped Frontage-For noncontrolled-access fa-cilities, the percentage of the roadside that is developedaffects the number and frequency of vehicle maneuverpoints. The location of service drives and the identifica-tion of vehicles entering or leaving the roadway are factorsof considerable importance in the driving task. As thepercentage of development increases, the need for addi-tional lighting also increases. The range from 0 to 100 per-cent development has been distributed over the rating rangeby subjective judgment. The value of 60 percent as theupper bound of the minimum condition (rating of 3) seemsreasonable.
For controlled-access facilities the ratings are basicallythe same, with the exception of interchange areas. Forinterchanges the team elected to describe the percent de-velopment in terms of the number'of quadrants in theinterchange that are developed. The rating of t has beenassigned to the condition of no development and the ratingof 5 to all four quadrants developed. Uniform assignmenthas been made to the remaining ratings.
Predomínant Development -The
type of developmentthat most nearly is compatible with noncontrolled-accessstreet operation is undeveloped or backup-type residentialdevelopment, assigned a rating of 1. The type least com-patible with good operation is strip commercial or indus-trial development, assigned a rating of 5. The otherdescriptors represent the various levels between these twoextremes.
Setback Distance.-{he setback distance to the develop-ment also affects the type of operation and the degree ofinterference from the development. For setback distancesof 50 ft or less, the operation of vehicles on adjacentproperty will be essentially parallel to the traffic stream;thus, identification of potentially conflicting vehicles is con-siderably more difficult. With increasing setback distances,the degree of control of the vehicle entering and leavingthe parking area is increased. For setbacks greater than20O ft, control of access to and from the adjacent areas iscomplete. The rating of this factor was uniformly dis-tributed between these two extremes.
Advertising or Area Lighting.-When large segments ofthe roadside are lighted, the roadway can become the dark-est portion of the driving environment. This factor mustbe included in the warranting conditions. When 40 per-cent or less of the roadside is lighted, the problem will notbe critical; when roadside lighting goes beyond 60 percent
-.1

the problem is drastically increased. The variation from noroadside lighting to continuous roadside lighting can pro_duce serious visual problems in driving. This range hasbeen subjectively rated f¡om 1 to 5.
Raised-Curb Median.-Raised-curb medians have beenincluded as an environmental factor because of the seriousinteraction between environmental lighting and the transi_tion to the median section. The frequency of these transi-tion problems is represented in the 1 to 5 ratings.
Other Fixed Lighting.-Cross-road approach lighting andfreeway lighting have been included in environmental fac-tors for interchanges. It appears reasonable that continu_ous lighting on cross-roadways or the freeway should con_tribute to warranting lighting of the interchange. Thus,these conditions have the rating of 5. No lighting of thecross-roadway and freeway has been rated as l, with partiallighting rated at 3.
Crime Rate.-Reduction in c¡ime rate is one of the oftenmentioned benefits of fixed roadway lighting on surfacestreets in downtown urban areas. It appeared desirable,therefore, to include crime rate as a warranting condition.A crime rate equal to the city average has been given the3 rating. The continuum from 1 to 5 has been rated inrelation to the city ave¡age. It is suggested that the policedepartment be asked to rate a given facility on this basisfor use by the lighting designer.
Accídents
The ratio of night-to-day accident rates has been a tradi-tional measure of the need for roadway lighting. Acci-dent experience should be weighted heavily in any war-ranting scheme. The ideal condition would be a ratio ofI :1; that is, the total accident ¡ate at night is the same asthe total accident rate under daylight conditions. Undernormal conditions a ratio of 1.5:1 is not unusual and has,therefore, been assigned a rating of 3. A ratio of 2:l ormore is critical, and lighting should be considered as beingwarranted for this site. Other ratios have been uniformlyassigned to the ratings. Accident rate should include alltypes and severity of accidents and be expressed in termsof accidents per million vehicle-miles.
Weighting of Factors
The professional research team was used to establishweighting factors for each of the classification elementsfor lighted and unlighted conditions. Decisions were basedon the compilation of accident rate data presented inTraffic Control and Roadway Elements-Their Relation-ship to Highway SaÍety/Revised (25). Where data werenot available, the team used a combination of collectivejudgment and the relative importance of other factors forwhich data were available.
Prioritíes
It was previously stated that the extent to which the war_ranting points exceed the minimum warranting pointsserves as the basis for setting priorities. priorities shouldalso be related to the number of people that benefit froma lighting improvement. Therefore, the warranting num_
33
ber for a given traffic facility (unlighted vs lighted condi-tions) represents the effectiveness that can be achievedthrough the provision of fixed lighting. Thus, a generalizedmodel for setting priorities would be
p1_ IZ x ADT.íC
in which
pI: priority index;ll : warranting number for a given facility;
ADTN : night average daily traffic; andC: cost of the lighting improvement.
This generalized model is developed more fully in the latersection on "Cost-Effectiveness."
DESIGN GUIDELINES FOR FIXED LIGHTING
This phase of the research dealt with a detailed review ofthe current (and proposed) guidelines and practices, andcomparison of these guidelines with the needs of the visualenvironment determined in this research. Specificalty, thiscomparison is made with the "American National StandardPractice for Roadway Lighting" (13) and AASHTO's lttInformational Guide lor Roadway Lighting (10).
Many effective changes have been made in the latest(1971) revision of the American National Standard prac-tice for Roadway Lighting as compared to the 1963 edition.In the design section, a concise "design process," or anoutline of the steps in lighting design, that should provehelpful to the designer, has been included. However, thereis some concern that the design section may be over-shadowed by the technical information on luminaire dis-tribution and roadway classification presented prior to thedesign process. These should be supplemental and thuspresented following the design process.
The first step in the design process is:
Determination from roadway classification andadjacent land use (area classification) of the quantityof light desired, in average horizontal footcandles.
This "step" is supplemented with basically the same sug-gestions as contained in the 1963 edition, as follows:
It is important that roadway lighting be plannedon the basis of traffic information, which includesthe factors necessary to provide traffic safety andpedestrian security. Some of the factors applicableto the specific problem which are to be carefullyevaluated are:
A. Type of land-use development (area classifica-tion) abutting the roadway or walkway.
B. Type of route (roadway or walkway classifica-tion).
C. Traffic accident experience.D. Street crime experience and security.E. Roadway construction features:
1. Width of pavement or number of trafrc lanes.2. Character of pavement surface.3. Grades and curves.4. Location and width of curbs, sidewalks, and
shoulders.5. Type and location of very high-volume
driveways.6. Width and location of dividing and safety
islands with channelizing curbs.
(2\