Embed Size (px)
Citation preview

Energy for Sustainable Development 32 (2016) 40–49
Contents lists available at ScienceDirect
Energy for Sustainable Development
Lighting energy use in Anding District, Gansu Province, China
Abigail Clarke-Sather a,b,⁎,1,2, Yan Li c,3, Jiansheng Qu a,1
a Scientific Information Center for Resources and Environment, National Science Library — Lanzhou Branch, Chinese Academy of Sciences, 8 Middle Tianshui Road, Lanzhou 730000, Chinab University of Delaware, Department of Civil & Environmental Engineering, 354A Du Pont Hall, Newark, DE 19716, USAc Lanzhou University, School of Resources and Environment, 222 South Tianshui Road, Lanzhou 730000, China
⁎ Corresponding author at: University of DelawEnvironmental Engineering, 354A Du Pont Hall, Newark,
E-mail addresses: [email protected] (A. Clarke-Sather)[email protected] (J. Qu).
1 Tel.: +86 931 8 270 035; fax: +86 931 8 275 743.2 Tel.: +1 302 831 3517; fax: +1 302 831 3640.3 Tel.: +86 931 8 270 035; fax: +86 931 8 275 743.
http://dx.doi.org/10.1016/j.esd.2016.02.0120973-0826/© 2016 International Energy Initiative. Publish
a b s t r a c t
a r t i c l e i n f oArticle history:Received 15 November 2012Revised 24 February 2016Accepted 25 February 2016Available online xxxx
An energy use survey of 237 households was carried out in rural Anding district, Gansu province, P.R. China in2010. Baseline lighting electricity use was assessed for current (2010) and future use (2020) and compared bylight bulb type, household room, and seasonal differences. A simple life cycle assessment (LCA) compared strat-egies such as replacing incandescents with CFLs and reducing total daily hours of lighting to assess possiblegreenhouse gas (GHG) emission reductions. Replacing incandescent light bulbs with compact fluorescent lightbulbs (CFLs) has the potential to reduce current and future annual energy use by 27% and 23% respectively.Within households, replacing bedroom light bulbs with CFLs reduces GHG emissions most, over 38% of thetotal CO2 equivalent reductions possible. A focus on bedroom lighting in rural Anding district has the best poten-tial to aid China's carbon intensity reduction goals by 2020.
© 2016 International Energy Initiative. Published by Elsevier Inc. All rights reserved.
Keywords:Electric lightingRural energy useChinaLife cycle assessmentGlobal warming potentialCarbon dioxide emissions
Introduction and background
Rural people's access to energy has been recognized as a de-velopment priority under the UN Millennium Development Goals(Rehfuess, 2006). A great divide still exists between the energy accessavailable to urban and rural residents in China (Crompton and Wu,2005). Since 1979, rural electricity use has increased over all regionsof China in part due to electrification reaching new areas. This increasein energy use, among other reasons, has galvanized Chinese leaders toset specific greenhouse gas (GHG) emission reduction goals. Theseemission reduction goals are to reduce carbon intensity from 40 to45% reduction of 2005 emission levels by 2020 (Lan, 2011). Carbonintensity is defined as total GHG emissions produced per unit nationalgross domestic product (Zhang, 2000). Additionally the 2020 GHGemission reduction goal has been further refined for 2015 to reduceGHG emissions to 17% of 2005 emission levels (Lan, 2011). Recently,China has committed to have carbon dioxide (CO2) emissions rise nohigher after 2030 (The White House, 2014). These goals and commit-ments demonstrate the importance of addressing climate change incurrent Chinese national policy goals. National policy goals affectregions across China, including rural northwestern regions such as
are, Department of Civil &DE 19716, USA., [email protected] (Y. Li),
ed by Elsevier Inc. All rights reserve
Anding district in Gansu province where the household energy surveydiscussed in this paper took place.
Findings from household energy surveys in northwestern China
Other research has considered rural household energy use in parts ofnorthwestern China. A brief overview of their findings as they relate toelectricity use in general and for lighting in particular follows. Fan et al.found that for the households they surveyed in Shaanxi and Yunnanprovinces in 2004 and 2005 average household energy use was a quar-ter of the national average for China (Fan et al., 2011). Kaul and Liuinterviewed rural households in three counties in Jiangxi, Hunan, andInner Mongolia provinces in 1988 and found that larger families havelower per capita energy use for certain types of energy (Kaul and Liu,1992). Van Groenendaal and Gehua surveyed rural households inGansu and Sichuan in 2006 and found that there is no significant differ-ence in electricity use between households that have biodigesters(biogas) and those that do not (Van Groenendaal and Gehua, 2010).Li, Chen, and Li surveyed rural households in two Gansu districts,Tongwei and Qin'an in 2005, which are directly to the southwest ofAnding district the area studied for this research. Li et al. found that onaverage each household used about 200 kW-hours (kWh) electricityannually or approximately 96 kWh for lighting and 104 kWh for appli-ances. Their research considers primary sources of CO2 emissions inrural households (Li et al., 2009). This paper considers secondary CO2
emissions from household electricity use specifically for lighting.The average annual household electricity consumption for lighting
in the Anding district households surveyed was found to be 123 kWh.
d.
41A. Clarke-Sather et al. / Energy for Sustainable Development 32 (2016) 40–49
This value is significantly higher than what Li et al. found for lightingelectricity use (96 kWh) for the two districts either adjacent or near toAnding district. Li et al. conducted their survey in 2006; it is possiblethat the economic growth over those years might explain some ofthe differences in average lighting use. Nationally in China an averageof 370 kWh electricity is used annually per capita (United NationsStatistics Division, 2010; IEA, 2011). Using the assumption that about12% of electricity use goes to lighting (Liu, 2012), that means that onaverage about 44 kWh of electricity is used per person annually forlighting in China. Annual average per capita electricity use for kWhfor the Anding district was well below this value ranging from 10 to30 kWh. The average per capita lighting use calculation depends onthe time of year and whether to consider lighting usage for the numberof people living in the house or by the number of persons and percent-age of the year that they lived in the household. Many Anding districtfamilies have members who mainly live and work in urban areasreturning home for a short period of the year. The difference betweenthe national average and Anding district average for lighting kWhis not very surprising given the relative low average number of lightbulbs, between 1 and 2, found in each room in the surveyed households(Fig. 8). Urban dwellers aremore likely to have greater numbers of lightbulbs in their homes, effectively raising the average kWh used for light-ing annually in China.
Why lighting matters
Improving the energy efficiency of lighting always appears to be asmart decision. The United Nations Environment Program (UNEP) iden-tifies lighting as an important focus for the following reasons:
– Lighting electricity use accounts for about 15% ofworldwide electric-ity use;
– Lighting electricity emits nearly 5% of CO2 equivalent emissions; and– Making changes to lighting can save an estimated $140 billion U.S.
dollars and 580 million tons of CO2 emissions (UNEP GEF, 2013).
Furthermore UNEP has created the Global Efficient Lighting Partner-ship Program to eliminate the use of inefficient incandescent light bulbsby 2016 (UNEP GEF, 2013). These efforts point to the importance oflighting towards CO2 emission reduction goals. Changing lighting tech-nology is often seen as low hanging fruit for CO2 emission reduction.Compared to other technologies, with lighting there are fewer social,technological, and economic barriers to changes. However some poli-cies and efforts reduce CO2 emissions from lighting electricity usemore than others. This research seeks to uncover the behavioral contextthat lighting is used by rural household members to reveal where thegreatest electricity savings can be found for a specific area.
Research questions
This research illuminateswhat role changing lighting has in affectingCO2 emission reduction goals for the rural poor in northwestern China.Three areas are considered: behavior and technology options for reduc-inghousehold CO2 emissions; lightinguses in different rooms in houses;and lighting use at different times of year (characterized as summer andwinter). The following research questions were investigated:
1. CO2 emission reduction options:What user behavior and technologyoptions are feasible for rural Anding households to change lightingelectricity use?
2. Lighting in household rooms: How does lighting use and lightingtechnology compare between household room types?
3. Seasonal lighting use: Do households use lighting in different roomsand for different time periods in the summer and winter?
Methods
All of the information about household lighting use in rural Andingdistrict in Gansu province, PR China is based on a household energy sur-vey conducted in August 2010. The survey methodology is describedbelow. Data collected from this survey was analyzed and is presentedin Section Results. This data was used in the simplified life cycle assess-ment (LCA). The LCA method used is also described below.
Survey work accomplished
On July 27th the primary investigator obtained permissions froma Human Subjects Review Committee at the Lanzhou branch of theChinese Academy of Sciences (CAS) which determined that thisresearch could proceed since the research caused no harm to humansubjects involved. A research team of one graduate student at CAS,four university students, and one high school student from the surveyregion was assembled. Teams of 2 students surveyed houses. Everytown was divided into neighborhoods (she). The town Communistparty secretary or mayor would provide our research team with eachneighborhood's list of residents. These lists included the address ofevery household. In general, one teamwould survey a particular neigh-borhoodwithin a town.A teamof studentswould go to the addresses onthe list that corresponded to a certain number, e.g. every house on thelist that ended in 3 so 3, 13, 23 etc. If adult members of that household(defined as individuals at least 18 years of age) or if the householdresidents were not available or willing to participate in the survey, theteam would travel to the next or previous house number on the list,e.g. if the 23rd household members were not available or willing toparticipate the team went to the 24th or 22nd house on the list. Aneighborhood leader (shezhang) or resident accompanied each surveyteam to help them navigate the area. Households can be quite farapart with addresses that were not necessarily clearly marked orin chronological order. Therefore in many of the towns having anaccompanier was essential to finding the households on theneighborhood's list of residents.
All potential survey respondents were aware that their participationwas voluntary. If the potential respondentwaswilling to participate, thesurvey teammember writing marks an x as acknowledgement and theother survey teammember signs their name as a witness to the surveyrespondent's agreement to participate. Survey respondents were notasked to sign their own names because of cultural stigma with signingdocuments, i.e. fear of signing away one's rights.
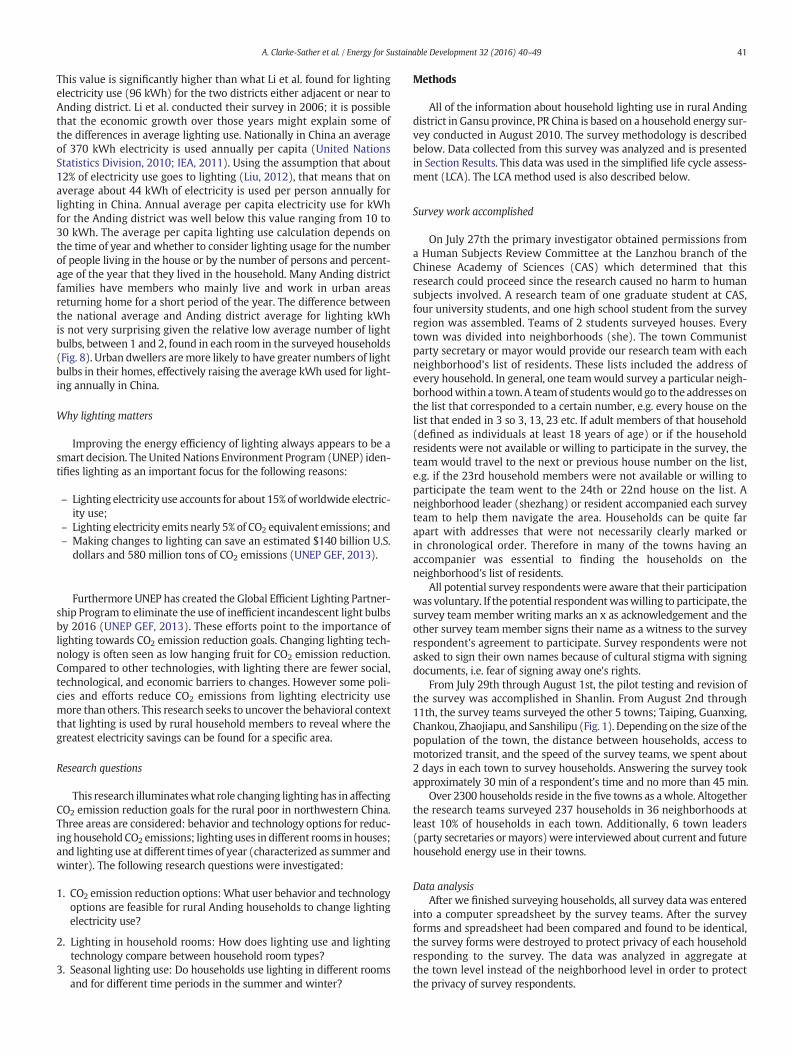
From July 29th through August 1st, the pilot testing and revision ofthe survey was accomplished in Shanlin. From August 2nd through11th, the survey teams surveyed the other 5 towns; Taiping, Guanxing,Chankou, Zhaojiapu, and Sanshilipu (Fig. 1). Depending on the size of thepopulation of the town, the distance between households, access tomotorized transit, and the speed of the survey teams, we spent about2 days in each town to survey households. Answering the survey tookapproximately 30 min of a respondent's time and no more than 45 min.
Over 2300 households reside in the five towns as awhole. Altogetherthe research teams surveyed 237 households in 36 neighborhoods atleast 10% of households in each town. Additionally, 6 town leaders(party secretaries ormayors)were interviewed about current and futurehousehold energy use in their towns.
Data analysisAfter we finished surveying households, all survey data was entered
into a computer spreadsheet by the survey teams. After the surveyforms and spreadsheet had been compared and found to be identical,the survey forms were destroyed to protect privacy of each householdresponding to the survey. The data was analyzed in aggregate atthe town level instead of the neighborhood level in order to protectthe privacy of survey respondents.
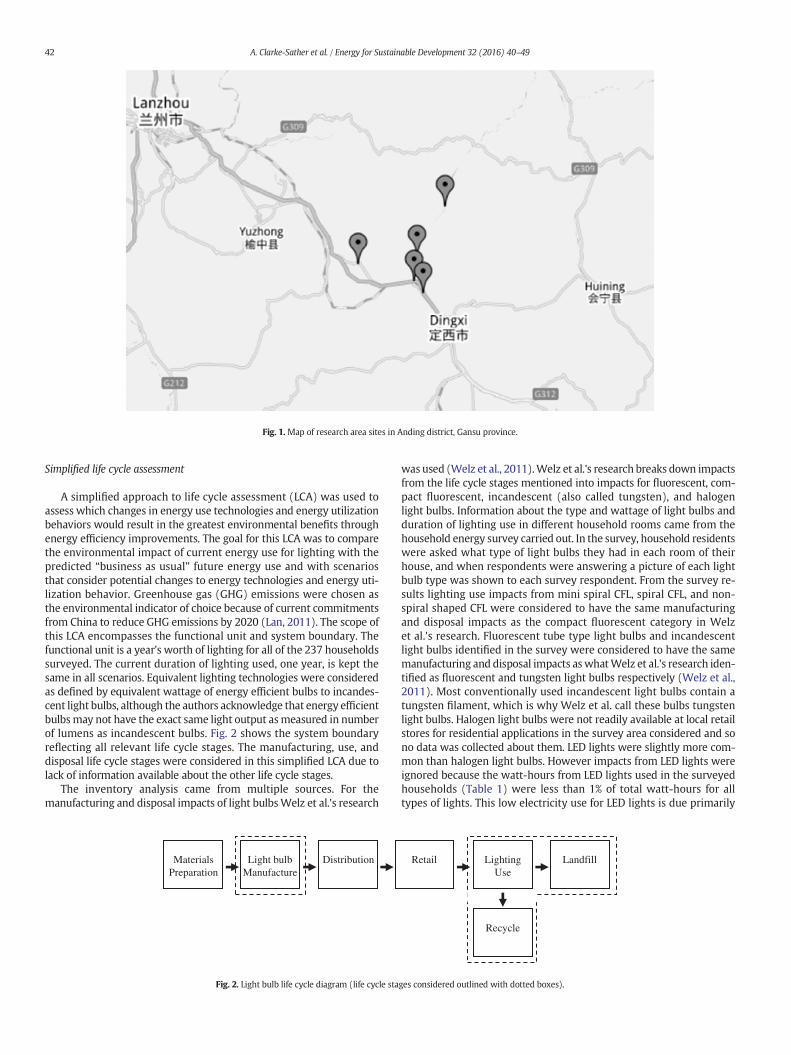
Fig. 1. Map of research area sites in Anding district, Gansu province.
42 A. Clarke-Sather et al. / Energy for Sustainable Development 32 (2016) 40–49
Simplified life cycle assessment
A simplified approach to life cycle assessment (LCA) was used toassess which changes in energy use technologies and energy utilizationbehaviors would result in the greatest environmental benefits throughenergy efficiency improvements. The goal for this LCA was to comparethe environmental impact of current energy use for lighting with thepredicted “business as usual” future energy use and with scenariosthat consider potential changes to energy technologies and energy uti-lization behavior. Greenhouse gas (GHG) emissions were chosen asthe environmental indicator of choice because of current commitmentsfrom China to reduce GHG emissions by 2020 (Lan, 2011). The scope ofthis LCA encompasses the functional unit and system boundary. Thefunctional unit is a year's worth of lighting for all of the 237 householdssurveyed. The current duration of lighting used, one year, is kept thesame in all scenarios. Equivalent lighting technologies were consideredas defined by equivalent wattage of energy efficient bulbs to incandes-cent light bulbs, although the authors acknowledge that energy efficientbulbsmay not have the exact same light output asmeasured in numberof lumens as incandescent bulbs. Fig. 2 shows the system boundaryreflecting all relevant life cycle stages. The manufacturing, use, anddisposal life cycle stages were considered in this simplified LCA due tolack of information available about the other life cycle stages.
The inventory analysis came from multiple sources. For themanufacturing and disposal impacts of light bulbsWelz et al.'s research
Light bulbManufacture
DistributionMaterialsPreparation
Fig. 2. Light bulb life cycle diagram (life cycle sta
was used (Welz et al., 2011).Welz et al.'s research breaks down impactsfrom the life cycle stages mentioned into impacts for fluorescent, com-pact fluorescent, incandescent (also called tungsten), and halogenlight bulbs. Information about the type and wattage of light bulbs andduration of lighting use in different household rooms came from thehousehold energy survey carried out. In the survey, household residentswere asked what type of light bulbs they had in each room of theirhouse, and when respondents were answering a picture of each lightbulb type was shown to each survey respondent. From the survey re-sults lighting use impacts from mini spiral CFL, spiral CFL, and non-spiral shaped CFL were considered to have the same manufacturingand disposal impacts as the compact fluorescent category in Welzet al.'s research. Fluorescent tube type light bulbs and incandescentlight bulbs identified in the survey were considered to have the samemanufacturing and disposal impacts aswhatWelz et al.'s research iden-tified as fluorescent and tungsten light bulbs respectively (Welz et al.,2011). Most conventionally used incandescent light bulbs contain atungsten filament, which is why Welz et al. call these bulbs tungstenlight bulbs. Halogen light bulbs were not readily available at local retailstores for residential applications in the survey area considered and sono data was collected about them. LED lights were slightly more com-mon than halogen light bulbs. However impacts from LED lights wereignored because the watt-hours from LED lights used in the surveyedhouseholds (Table 1) were less than 1% of total watt-hours for alltypes of lights. This low electricity use for LED lights is due primarily
Retail LightingUse
Landfill
Recycle
ges considered outlined with dotted boxes).

Table 1Megawatt-hours electricity used annually by all surveyed households for alllight bulb types.
Total annual MWh
Compact fluorescent 5.8Fluorescent 6.4Incandescent 14.7LED 0a
a Actually greater than zero, although negligible.
Table 2Globalwarming potential CO2 equivalent factors for key greenhouse gases (Solomon et al.,2007).
GWP for 100 year time horizon
Carbon dioxide (CO2) 1Methane (CH4) 25Nitrous oxide (N20) 298
43A. Clarke-Sather et al. / Energy for Sustainable Development 32 (2016) 40–49
to the small number of LED lights in the surveyed households but is alsodue to LED light bulbs' very low electricity usage.
It should be noted that Welz et al.'s life cycle inventory data andanalysis comes from the European Union and specifically assumes ad-herence to Western European recycling and disposal standards (Welzet al., 2011). Although the recycling standards are not the same inChina, in the absence of other recycling and disposal impact data,Welz et al.'s numbers were used. Disposal was by far the smallest im-pact category, thus it may be slightly understated due to lack of Chinaspecific data for light bulb recycling.
In light of China's 2020 GHG emission reduction goals (Lan, 2011),an indicator of environmental performance that tracks GHG emissionswas applied to energy reduction possibilities found through the simpli-fied LCA. The global warming potential (GWP) was applied to thisresearch because it is a simple, well-respected, and frequently usedmethod for estimating greenhouse gas impacts (Solomon et al., 2007).The factors used for GWP CO2 equivalents all came from the 100-yeartimeline in all calculations (Table 2). Only the three greenhouse gaseslisted in Table 2, carbon dioxide, methane, and nitrous oxide, were con-sidered in the global warming potential calculations in this paper.
GWPall ¼X j
1Ci � GWPið Þ ð1Þ
0
1
2
3
4
5
6
7
8
9
10
Total
Rooms
#
Bedrooms
# Kitchens # Livin
rooms
Fig. 3. Minimum, average, and maximum n
Ci concentration of greenhouse gas, i, emitted.GWPi CO2 equivalent factor for greenhouse gas, i.GWPall sum of units' concentration of CO2 equivalent for all green-
house gases emitted from i to j.
GHGemission factors (for CO2, CH4, and nitrogen oxides specifically)for the manufacturing and disposal life cycle stages came from (Welzet al., 2011), Gansu specific electricity GHG emission factors camefrom (Ji et al., 2011).
Results
All lighting came from electric sources. Candles, oil lamps and otherfuel-based sources of light were not used in the study area (candles areused for ceremonial purposes only). All of the towns studied had hadelectricity for at least twenty years. The entire Anding district, therural area where the towns were located, was electrified. The followingfactors were tracked to see effects to household lighting electricityusage differences: use in different room types, time of use of daily light-ing, number of light bulbs per household and per room, seasonal usage,and per capita energy use for lighting.
Terminology and abbreviations
kWh kilowatt-hours.MWh megawatt-hours.Peak the highest amount of electricity usage for the day.CFL compact fluorescent light bulb.
Room types
Fig. 3 shows the number of rooms in each household by type ofroom. Storage rooms and other types of rooms (responses includedchicken coops and garages) were not included in the total. Indoor bath-rooms or shower rooms were rare (not all households surveyed hadrunning water inside the house) but included in the number of roomstotal for a household, 24 out of 237 households had a shower room.All 237 respondents answered the questions asking about the numberof rooms that they have in their home.
The kWh for different room types was compared in Fig. 4. Pleasenote that in the survey the number of light bulbs by wattage and typein a room was collected separately from the time of day and durationthat lights were used in that room. Rooms that were not bedrooms,
g # OtherRooms
# ShowerRooms
Minimum
Average
Maximum
umber of rooms in each house by type.

Fig. 4.Average kWhuse per room in summer andwinter, number of respondents in boxes. Fig. 6. Time of use summer lighting use by room type in kilowatts.
44 A. Clarke-Sather et al. / Energy for Sustainable Development 32 (2016) 40–49
living rooms, or kitchens were reported as having light bulbs under thecategory “Other rooms.” However, the time of day and duration thatlights were used were not generally reported. “Other rooms”encompassed a broad range of room types including storage roomswhere lighting may only have been used incidentally instead of on aregular basis. We used the time of day and duration values from theKitchen profile for “Other rooms”. The Kitchen lighting duration is oneof the shortest duration of all the rooms, which is why we chose touse it for modeling other rooms. Still this assumption may overstatetotal lighting use in “Other rooms.”Most lighting use occurred in livingrooms.
Time of use
Fig. 5 shows the overall daily peak for lighting energy use. This chartshows that lighting is primarily used in the evening between the hoursof 6 pm and 9:30 pm. The survey results suggest that the winter peak isjust under 16.734 kWand occurs at 8 pm,while the summer peak is justover 16.935 kW and occurs at 8:30 pm. Note that the 0 and 24 h wereused to denote midnight on the current and next day respectively andthat 23 denotes 11 pm.
Figs. 6 and 7 show the summer and winter differences in peakelectricity use by room (only the peak period times of day are displayedin the graphs). Winter and summer peaks are close in value and bothfollow the same time of day trends. Bedrooms have the highest peakvalue but over a longer period of time, which makes for a flatter peak.Kitchens have an earlier peak of shorter duration, which makes formore of a spike as a peak. Living rooms' and Other rooms' peak usesare both less than bedrooms and kitchens.
Fig. 5. Time of use lighting usage in kilowatts in summer and winter for all rooms.
Light bulbs
Fig. 8 shows the minimum, maximum, and average number of lightbulbs for each room. As can be seen, on average living rooms havemorethan two light bulbs whereas all other rooms have nearly one light bulbper room. Specific households have a large number of light bulbs in aparticular room, but not for kitchens, where the maximum number oflight bulbs is three. Bedrooms have the greatest percentage of all lightbulbs installed in the households (Fig. 9) followed by living rooms.
Fig. 10 shows the total number of light bulbs by type. Table 3 showsthe abbreviations for each light bulb type. Incandescent light bulbs areby far the greatest number of light bulbs installed followed by alltypes of CFLs and then fluorescent tube lights.
Fig. 11 shows the average number of specific types of light bulbs forcertain rooms. Certain rooms do not have any number of specific typesof light bulbs, e.g. LEDs are only found in bedrooms. Other types of lightbulbs are only found in great numbers, such as candle shaped incandes-cents, which are often found in light fixtureswithmultiple bulbs. Fig. 12shows that by far incandescent light bulbs are the most common bulbsin all types of rooms. The most commonly reported wattage for eachlight bulb type found from responses from survey respondents in thehousehold energy survey is shown in Table 4. It should be noted thatsurvey respondents do not always remember correctly the wattages ofthe light bulbs in their homes if they know at all. This is a known limita-tion of allowing survey respondents to self-report wattage values(Dimetrosky, 2013) and is a known source of error in lighting use calcu-lations in this paper. Certain reported values of wattages for types ofbulbs seem to be much too high (e.g. CFLs and fluorescent tube lightbulbs), resulting in the likely overstatement of electricity use by house-holds in the Anding region. That said, it is still significant that 40-wattincandescent light bulbs are reported to be the most common lightbulb found in the surveyed households.
Fig. 7. Time of use winter lighting use by room type in kilowatts.

0
2
4
6
8
10
12
14
16
18
20
Bedrooms Living Rooms Kitchens Other Rooms
Minimum
Average
Maximum
Fig. 8.Minimum, average, and maximum number of light bulbs by room type.
45A. Clarke-Sather et al. / Energy for Sustainable Development 32 (2016) 40–49
Discussion
The researchquestions outlined in Section “Findings fromhouseholdenergy surveys in northwestern China” cover the topics of CO2 emissionreduction options, room lighting differences, and seasonal lightingdifferences. The discussion section will handle each of these topics inthe order mentioned.
CO2 reduction options
Research Question 1: What user behavior and technology optionsare feasible for rural Anding households to change lighting electricityuse?
Lighting user behaviorChanging how residents use electricity in their home is another way
to save energy and reduce carbon emissions. Behavioral options for re-ducing lighting CO2 emissions focus on reducing: the need for lighting,and the extraneous use of lighting both in physical space and overtime. Many user behavior modification options exist to reduce CO2
emissions, including:
Fig. 9.Total number of light bulbs in parentheses and percentage of total for all householdsby room.
– Occupancy sensors;– “Daylight Harvesting” techniques, such as:
– 3 way bulbs that can dim when there is more natural light,– daylight sensors that dim lights according to natural light available,
and– retrofitting buildings to allow more daylight into spaces;
– Lighting timers that turn lights off or on at a certain time each day;– Install task lighting;– Clean lighting fixtures to improve light output and extend light
bulb life;– Paint interior spaces with light colors that reflect light; and– Turning off lights when not in use (Carbon Trust, 2014).
Fig. 10. Total number in parentheses and percentage of all by light bulb type.
Table 3Types of light bulbs and their abbreviations.
Survey light bulb type Abbreviation
Mini spiral CFL Mini CFLSpiral CFL Spiral CFLNon-spiral CFL CFLIncandescent IncandCandle shaped incandescent CandleLED LEDFluorescent tube FluorOther Other
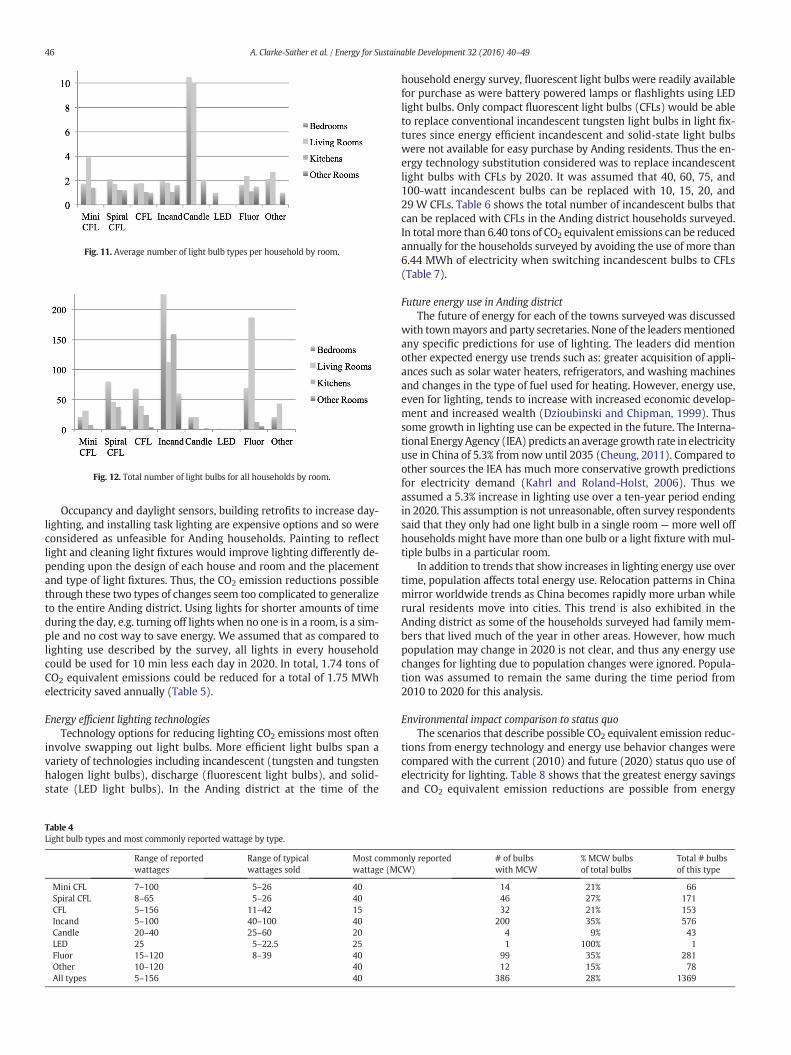
Fig. 11. Average number of light bulb types per household by room.
Fig. 12. Total number of light bulbs for all households by room.
46 A. Clarke-Sather et al. / Energy for Sustainable Development 32 (2016) 40–49
Occupancy and daylight sensors, building retrofits to increase day-lighting, and installing task lighting are expensive options and so wereconsidered as unfeasible for Anding households. Painting to reflectlight and cleaning light fixtures would improve lighting differently de-pending upon the design of each house and room and the placementand type of light fixtures. Thus, the CO2 emission reductions possiblethrough these two types of changes seem too complicated to generalizeto the entire Anding district. Using lights for shorter amounts of timeduring the day, e.g. turning off lights when no one is in a room, is a sim-ple and no cost way to save energy. We assumed that as compared tolighting use described by the survey, all lights in every householdcould be used for 10 min less each day in 2020. In total, 1.74 tons ofCO2 equivalent emissions could be reduced for a total of 1.75 MWhelectricity saved annually (Table 5).
Energy efficient lighting technologiesTechnology options for reducing lighting CO2 emissions most often
involve swapping out light bulbs. More efficient light bulbs span avariety of technologies including incandescent (tungsten and tungstenhalogen light bulbs), discharge (fluorescent light bulbs), and solid-state (LED light bulbs). In the Anding district at the time of the
Table 4Light bulb types and most commonly reported wattage by type.
Range of reportedwattages
Range of typicalwattages sold
Most commwattage (MC
Mini CFL 7–100 5–26 40Spiral CFL 8–65 5–26 40CFL 5–156 11–42 15Incand 5–100 40–100 40Candle 20–40 25–60 20LED 25 5–22.5 25Fluor 15–120 8–39 40Other 10–120 40All types 5–156 40
household energy survey, fluorescent light bulbs were readily availablefor purchase as were battery powered lamps or flashlights using LEDlight bulbs. Only compact fluorescent light bulbs (CFLs) would be ableto replace conventional incandescent tungsten light bulbs in light fix-tures since energy efficient incandescent and solid-state light bulbswere not available for easy purchase by Anding residents. Thus the en-ergy technology substitution considered was to replace incandescentlight bulbs with CFLs by 2020. It was assumed that 40, 60, 75, and100-watt incandescent bulbs can be replaced with 10, 15, 20, and29 W CFLs. Table 6 shows the total number of incandescent bulbs thatcan be replaced with CFLs in the Anding district households surveyed.In total more than 6.40 tons of CO2 equivalent emissions can be reducedannually for the households surveyed by avoiding the use of more than6.44 MWh of electricity when switching incandescent bulbs to CFLs(Table 7).
Future energy use in Anding districtThe future of energy for each of the towns surveyed was discussed
with townmayors and party secretaries. None of the leadersmentionedany specific predictions for use of lighting. The leaders did mentionother expected energy use trends such as: greater acquisition of appli-ances such as solar water heaters, refrigerators, and washing machinesand changes in the type of fuel used for heating. However, energy use,even for lighting, tends to increase with increased economic develop-ment and increased wealth (Dzioubinski and Chipman, 1999). Thussome growth in lighting use can be expected in the future. The Interna-tional Energy Agency (IEA) predicts an average growth rate in electricityuse in China of 5.3% from now until 2035 (Cheung, 2011). Compared toother sources the IEA has much more conservative growth predictionsfor electricity demand (Kahrl and Roland-Holst, 2006). Thus weassumed a 5.3% increase in lighting use over a ten-year period endingin 2020. This assumption is not unreasonable, often survey respondentssaid that they only had one light bulb in a single room — more well offhouseholds might have more than one bulb or a light fixture with mul-tiple bulbs in a particular room.
In addition to trends that show increases in lighting energy use overtime, population affects total energy use. Relocation patterns in Chinamirror worldwide trends as China becomes rapidly more urban whilerural residents move into cities. This trend is also exhibited in theAnding district as some of the households surveyed had family mem-bers that lived much of the year in other areas. However, how muchpopulation may change in 2020 is not clear, and thus any energy usechanges for lighting due to population changes were ignored. Popula-tion was assumed to remain the same during the time period from2010 to 2020 for this analysis.
Environmental impact comparison to status quoThe scenarios that describe possible CO2 equivalent emission reduc-
tions from energy technology and energy use behavior changes werecompared with the current (2010) and future (2020) status quo use ofelectricity for lighting. Table 8 shows that the greatest energy savingsand CO2 equivalent emission reductions are possible from energy
only reportedW)
# of bulbswith MCW
% MCW bulbsof total bulbs
Total # bulbsof this type
14 21% 6646 27% 17132 21% 153
200 35% 5764 9% 431 100% 1
99 35% 28112 15% 78
386 28% 1369

Table 5Annual GHG reductions achieved from using lights 10 min less each day.
Average dailysummer hours
Annual summerMWh savings
Average dailywinter hours
Annual winterMWh savings
Total annualMWh savings
Total CO2 equivalentreductions (tons)a
Bedroom 1.90 0.30 3.34 0.30 0.60 0.59Living room 1.95 0.27 3.39 0.29 0.56 0.55Kitchens 1.35 0.22 2.43 0.21 0.43 0.43Other rooms 1.35 0.09 2.43 0.07 0.16 0.16Total 1.64 0.88 2.90 0.87 1.75 1.74
a Assuming that 0.99 kg CO2 is emitted per kWh or 0.99 tons CO2 is emitted per MWh based on an emission estimate for Lanzhou which comes from Ji et al. (2011).
Table 8Current and future environmental impacts compared with potential change scenarios.
Total MWh CO2 equivalent emissions(metric tons)a
Current (2010) 27.73 27.57
47A. Clarke-Sather et al. / Energy for Sustainable Development 32 (2016) 40–49
technology changes, in this case swapping out incandescent light bulbsfor CFLs. This finding agrees with the general consensus that replacingincandescents is one of the first things to do to save energy. These resultsalso highlight that carbon emission reduction policy resources for theAnding district targeting lighting electricity use should focus on incen-tives for rural households to replace incandescents before pursuing ener-gy use behavior modifications. For other impoverished areas like theAnding district, although these findings cannot be assumed to be gener-alizable across other energy end uses and geographic areas, the techno-logical solution may provide the greatest carbon emission reductionimprovements instead of focusing on changing end user behavior andhabits.
The scenarios described in Table 8 only consider the impact of elec-tricity or the use life cycle stage. In addition to electricity use, the envi-ronmental impact of the manufacture and disposal of the light bulbswas considered. The production of lighting fixtures also has impacts,but the fixtures are more likely to stay with the house whereas lightbulbs will eventually need to be replaced.
As can be seen from Tables 9 and 10, the environmental impact inthe form of the GWP is the greatest for the use life cycle stage. Themanufacturing and disposal life cycle stages are much smaller thanthe use life cycle stage's CO2 equivalent emissions. These results empha-size that the most important changes in reducing lighting CO2 equiva-lent emissions are to reduce the amount of electricity used. Comparingthe energy technology and use changes considered, switching technol-ogies from incandescent light bulbs to CFLs is by far the most effectivemethod to reduce lighting electricity use. This switch's effectivenessis simply due to CFLs' lower wattage for similar luminosity output incomparison to incandescent light bulbs.
Table 11 shows the annual lighting use reported by the surveyedhouseholds in the Anding district. Environmental impacts for lighting
Table 6Number of incandescent light bulbs that can be replaced with CFLs.
Incandescent bulb wattage CFL wattage No. of bulbs that could be replaced
40 10 26560 15 9375 20 1100 29 28
Total 387
Table 7Annual GHG reductions achieved from replacing incandescents with CFLs.
No. of bulbsthat couldbe replaced
AnnualsummerMWhsavings
AnnualwinterMWhsavings
TotalannualMWhsavings
Total CO2
equivalentreductions(tons)a
Bedroom 146 0.95 1.53 2.48 2.47Living room 85 0.61 0.72 1.32 1.32Kitchens 111 0.73 1.24 1.97 1.96Other rooms 45 0.29 0.38 0.67 0.66Total 387 2.58 3.86 6.44 6.40
a Assuming that 0.99 kg CO2 is emitted per kWh or 0.99 tons CO2 is emitted per MWhbased on an emission estimate for Lanzhou which comes from Ji et al. (2011).
use in terms of CO2 emissions are much greater in the winter. This find-ingmakes sense because of the reduced hours of natural light that occurduring the winter in the Anding district.
Lighting in household rooms
Research Question 2: How does lighting use and lighting technologycompare between household room types?
The greatest savings in Anding households reside inmaking changesto bedroom lighting. Residents tend to light bedrooms and living roomsfor more time than other rooms in the houses (Table 6). Anding districthousehold has on average more than 2 bedrooms and on averageslightly less than one living room (Fig. 3). In total there are 469bedrooms versus 210 living rooms in the surveyed households (thisdoes not include rooms that serve multiple purposes such as kitchensor living rooms that also serve as bedrooms). Thus Anding residentsuse lighting in bedrooms for the most hours as compared to otherrooms.
In terms of lighting technology (i.e. light bulbs) present in rooms,most of the incandescent bulbs that could be replaced are located inbedrooms and kitchens (Table 11). The findings for the number ofhours that each type of household room is lit (user behavior) and therooms that have incandescent light bulbs that could be replaced inhouseholds both suggest that focusing on making changes to the
Current + technology changes 21.29 21.16Current + use changes 25.98 25.83Future (2020) 29.20 29.03Future + energy technology changes 22.42 22.28Future + energy use changes 27.36 27.20
a Assuming that 0.99 kg CO2 is emitted per kWh or 0.99 tons CO2 is emitted per MWhbased on an emission estimate for Lanzhou which comes from Ji et al. (2011).
Table 9Current environmental impacts (in kg CO2 equivalents) for different scenarios over the lifecycle.
Carbon emissions(kg CO2 equivalents)
Current(2010)
Future(2020)
Current +technology changes
Current +use changes
Manufacturinga 0.04 0.04 0.04 0.04Disposala 0.0c 0.0c 0.0b 0.0c
Total 0.04 0.04 0.04 0.04Useb 27,567 29,028 21,163 25,830Entire life cycle 27,567 29,028 21,163 25,830
a These estimates come fromWelz et al. (2011); each incandescent, fluorescent, andcompact fluorescent bulb documented in the household energy survey was assumedto be the same type of bulb as described by Welz et al. Differences in wattage wereignored for manufacturing and disposal impacts only.
b Assuming that 0.99 kg CO2 is emitted per kWh or 0.99 tons CO2 is emitted per MWhbased on an emission estimate for Lanzhou which comes from Ji et al. (2011).
c Actually greater than zero.
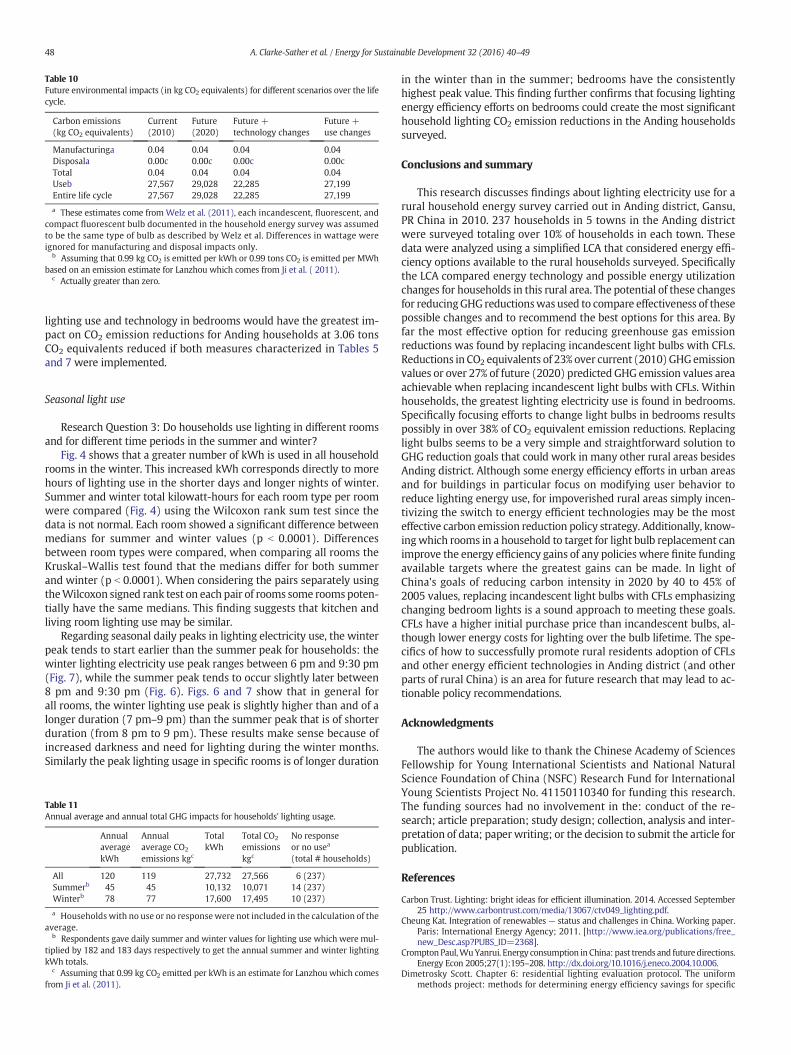
Table 10Future environmental impacts (in kg CO2 equivalents) for different scenarios over the lifecycle.
Carbon emissions(kg CO2 equivalents)
Current(2010)
Future(2020)
Future +technology changes
Future +use changes
Manufacturinga 0.04 0.04 0.04 0.04Disposala 0.00c 0.00c 0.00c 0.00cTotal 0.04 0.04 0.04 0.04Useb 27,567 29,028 22,285 27,199Entire life cycle 27,567 29,028 22,285 27,199
a These estimates come from Welz et al. (2011), each incandescent, fluorescent, andcompact fluorescent bulb documented in the household energy survey was assumedto be the same type of bulb as described by Welz et al. Differences in wattage wereignored for manufacturing and disposal impacts only.
b Assuming that 0.99 kg CO2 is emitted per kWh or 0.99 tons CO2 is emitted per MWhbased on an emission estimate for Lanzhou which comes from Ji et al. ( 2011).
c Actually greater than zero.
48 A. Clarke-Sather et al. / Energy for Sustainable Development 32 (2016) 40–49
lighting use and technology in bedrooms would have the greatest im-pact on CO2 emission reductions for Anding households at 3.06 tonsCO2 equivalents reduced if both measures characterized in Tables 5and 7 were implemented.
Seasonal light use
Research Question 3: Do households use lighting in different roomsand for different time periods in the summer and winter?
Fig. 4 shows that a greater number of kWh is used in all householdrooms in the winter. This increased kWh corresponds directly to morehours of lighting use in the shorter days and longer nights of winter.Summer and winter total kilowatt-hours for each room type per roomwere compared (Fig. 4) using the Wilcoxon rank sum test since thedata is not normal. Each room showed a significant difference betweenmedians for summer and winter values (p b 0.0001). Differencesbetween room types were compared, when comparing all rooms theKruskal–Wallis test found that the medians differ for both summerand winter (p b 0.0001). When considering the pairs separately usingtheWilcoxon signed rank test on each pair of rooms some roomspoten-tially have the same medians. This finding suggests that kitchen andliving room lighting use may be similar.
Regarding seasonal daily peaks in lighting electricity use, the winterpeak tends to start earlier than the summer peak for households: thewinter lighting electricity use peak ranges between 6 pm and 9:30 pm(Fig. 7), while the summer peak tends to occur slightly later between8 pm and 9:30 pm (Fig. 6). Figs. 6 and 7 show that in general forall rooms, the winter lighting use peak is slightly higher than and of alonger duration (7 pm–9 pm) than the summer peak that is of shorterduration (from 8 pm to 9 pm). These results make sense because ofincreased darkness and need for lighting during the winter months.Similarly the peak lighting usage in specific rooms is of longer duration
Table 11Annual average and annual total GHG impacts for households' lighting usage.
AnnualaveragekWh
Annualaverage CO2
emissions kgc
TotalkWh
Total CO2
emissionskgc
No responseor no usea
(total # households)
All 120 119 27,732 27,566 6 (237)Summerb 45 45 10,132 10,071 14 (237)Winterb 78 77 17,600 17,495 10 (237)
a Households with no use or no responsewere not included in the calculation of theaverage.
b Respondents gave daily summer and winter values for lighting use which were mul-tiplied by 182 and 183 days respectively to get the annual summer and winter lightingkWh totals.
c Assuming that 0.99 kg CO2 emitted per kWh is an estimate for Lanzhou which comesfrom Ji et al. (2011).
in the winter than in the summer; bedrooms have the consistentlyhighest peak value. This finding further confirms that focusing lightingenergy efficiency efforts on bedrooms could create the most significanthousehold lighting CO2 emission reductions in the Anding householdssurveyed.
Conclusions and summary
This research discusses findings about lighting electricity use for arural household energy survey carried out in Anding district, Gansu,PR China in 2010. 237 households in 5 towns in the Anding districtwere surveyed totaling over 10% of households in each town. Thesedata were analyzed using a simplified LCA that considered energy effi-ciency options available to the rural households surveyed. Specificallythe LCA compared energy technology and possible energy utilizationchanges for households in this rural area. The potential of these changesfor reducingGHG reductionswas used to compare effectiveness of thesepossible changes and to recommend the best options for this area. Byfar the most effective option for reducing greenhouse gas emissionreductions was found by replacing incandescent light bulbs with CFLs.Reductions in CO2 equivalents of 23% over current (2010) GHGemissionvalues or over 27% of future (2020) predicted GHG emission values areaachievable when replacing incandescent light bulbs with CFLs. Withinhouseholds, the greatest lighting electricity use is found in bedrooms.Specifically focusing efforts to change light bulbs in bedrooms resultspossibly in over 38% of CO2 equivalent emission reductions. Replacinglight bulbs seems to be a very simple and straightforward solution toGHG reduction goals that could work in many other rural areas besidesAnding district. Although some energy efficiency efforts in urban areasand for buildings in particular focus on modifying user behavior toreduce lighting energy use, for impoverished rural areas simply incen-tivizing the switch to energy efficient technologies may be the mosteffective carbon emission reduction policy strategy. Additionally, know-ingwhich rooms in a household to target for light bulb replacement canimprove the energy efficiency gains of any policies where finite fundingavailable targets where the greatest gains can be made. In light ofChina's goals of reducing carbon intensity in 2020 by 40 to 45% of2005 values, replacing incandescent light bulbs with CFLs emphasizingchanging bedroom lights is a sound approach to meeting these goals.CFLs have a higher initial purchase price than incandescent bulbs, al-though lower energy costs for lighting over the bulb lifetime. The spe-cifics of how to successfully promote rural residents adoption of CFLsand other energy efficient technologies in Anding district (and otherparts of rural China) is an area for future research that may lead to ac-tionable policy recommendations.
Acknowledgments
The authors would like to thank the Chinese Academy of SciencesFellowship for Young International Scientists and National NaturalScience Foundation of China (NSFC) Research Fund for InternationalYoung Scientists Project No. 41150110340 for funding this research.The funding sources had no involvement in the: conduct of the re-search; article preparation; study design; collection, analysis and inter-pretation of data; paperwriting; or the decision to submit the article forpublication.
References
Carbon Trust. Lighting: bright ideas for efficient illumination. 2014. Accessed September25 http://www.carbontrust.com/media/13067/ctv049_lighting.pdf.
Cheung Kat. Integration of renewables — status and challenges in China. Working paper.Paris: International Energy Agency; 2011. [http://www.iea.org/publications/free_new_Desc.asp?PUBS_ID=2368].
CromptonPaul,WuYanrui. Energy consumption in China: past trends and future directions.Energy Econ 2005;27(1):195–208. http://dx.doi.org/10.1016/j.eneco.2004.10.006.
Dimetrosky Scott. Chapter 6: residential lighting evaluation protocol. The uniformmethods project: methods for determining energy efficiency savings for specific

49A. Clarke-Sather et al. / Energy for Sustainable Development 32 (2016) 40–49
measures. Golden, Colorado: National Renewable Energy Laboratory; 2013. [http://energy.gov/sites/prod/files/2013/11/f5/53827-6.pdf].
Dzioubinski Oleg, Chipman Ralph. Trends in consumption and production: householdenergy consumption. ST/ESA/1999/DP. 6. NewYork, N.Y.: United Nations Departmentof Economic and Social Affairs; 1999 [www.un.org/esa/sustdev/publications/esa99dp6.pdf].
Fan Jie, Liang Yu-tian, Tao An-jun, Sheng Ke-rong, Ma Hai-Long, Xu Yong, et al. Energypolicies for sustainable livelihoods and sustainable development of poor areas inChina. Energy Policy 2011;39(3):1200–12.
International Energy Agency (IEA). IEA energy statistics — electricity for China (People'sRepublic of China and Hong Kong China). http://www.iea.org/stats/electricitydata.asp?COUNTRY_CODE=14, 2011.
Ji Shuguang, Cherry Christopher R, Bechle Matthew J, Wu Ye, Marshall Julian D. Electricvehicles in China: emissions and health impacts. Environ Sci Technol 2011;46(4):2018–24. http://dx.doi.org/10.1021/es202347q.
Kahrl Fredrich, Roland-Holst David. China's carbon challenge: insights from the electricpower sector. Research paper 110106. Berkeley: Center for Energy, Resources,and Economic Sustainabilty; 2006. [http://areweb.berkeley.edu/~dwrh/Docs/CCC_110106.pdf].
Kaul Sanjay, Liu Qian. Rural household energy use in China. Energy 1992;17(4):405–11.Lan, Lan. 2011. China to reduce carbon intensity by 17% by 2015. China Daily. July 29.
http://www.chinadaily.com.cn/china/2011–07/29/content_13006047.htm.Li Guozhu, Chen Zhiwen, Li Xiaolin. Analysis of rural household energy consumption
and its environmental impact in northwest China: a case study. 3rd InternationalConference on Bioinformatics and Biomedical Engineering, iCBBE 2009, June 11,2009–June 13, 2009. IEEE Engineering in Medicine and Biology Society; Gordon LifeScience Institute; FudanUniversity; BeijingUniversity of Posts and Telecommunications;Beijing Institute of Technology. 3rd International Conference on Bioinformatics andBiomedical Engineering, iCBBE 2009Beijing, China: IEEE Computer Society; 2009.http://dx.doi.org/10.1109/ICBBE.2009.5162355.
Liu, Jie. 2012. Shining a light on the value of energy. China Daily, January 30, onlineedition. http://www.chinadaily.com.cn/bizchina/greenchina/2012–01/30/content_14505155.htm.
Rehfuess Eva. Fuel for life: household energy and health. Geneva, Switzerland: WorldHealth Organization (WHO); 2006 [http://www.who.int/indoorair/publications/fuelforlife/en/index.html].
Solomon S, Qin D, Manning M, Chen Z, Marquis M, Averyt KB, et al. 2.10.2 Direct globalwarming potentials — AR4 WGI chapter 2: changes in atmospheric constituentsand in radiative forcing. Climate change 2007: working group I: the physical sciencebasis. Cambridge, United Kingdom: Intergovernmental Panel on Climate Change;2007. [http://www.ipcc.ch/publications_and_data/ar4/wg1/en/ch2s2-10-2.html].
The White House, Office of the Press Secretary. Fact sheet: U.S.–China joint announce-ment on climate change and clean energy cooperation. 2014. November 11 http://www.whitehouse.gov/the-press-office/2014/11/11/fact-sheet-us-china-joint-an-nouncement-climate-change-and-clean-energy-c.
United Nations Environment ProgrammeGlobal Environment Facility (UNEP GEF)). 2013.Efficient lighting for developing and emerging countries. En.lighten. http://www.en-lighten-initiative.org/.
United Nations Statistics Division. UNdata | country profile | China. United Nations: WorldStatistics Pocketbook; 2010 [http://data.un.org/CountryProfile.aspx?crName=CHINA].
Van Groenendaal Willem, Gehua Wang. Microanalysis of the benefits of China's family-size bio-digesters. Energy 2010;35(11):4457–66.
Welz Tobias, Hischier Roland, Hilty Lorenz M. Environmental impacts of lightingtechnologies — life cycle assessment and sensitivity analysis. Environ ImpactAssess Rev 2011;31(3):334–43. http://dx.doi.org/10.1016/j.eiar.2010.08.004.
Zhang Zhongxiang. Decoupling China's carbon emissions increase from economicgrowth: An economic analysis and policy implications. World Dev 2000;28(4):739–52. http://dx.doi.org/10.1016/S0305-750X(99)00154-0.


![Katharina Anding, Daniel Garten and Elske Linß - CORE · Katharina Anding, Daniel Garten and Elske Lin ... 255 0 entropy reli ldreli[]* ( []), (2) entropy reli ldreli ... As a result](https://img.pdfslide.us/doc/110x75/5ac9f5707f8b9aa1298d69c9/katharina-anding-daniel-garten-and-elske-lin-core-anding-daniel-garten-and-elske.jpg)