Embed Size (px)
Citation preview
University of Padova LASA – Environmental Systems Analysis Lab
Light extinction
Photosynthesis
Algal growth
University of Padova LASA – Environmental Systems Analysis Lab Modelling and Control of Environmental Systems
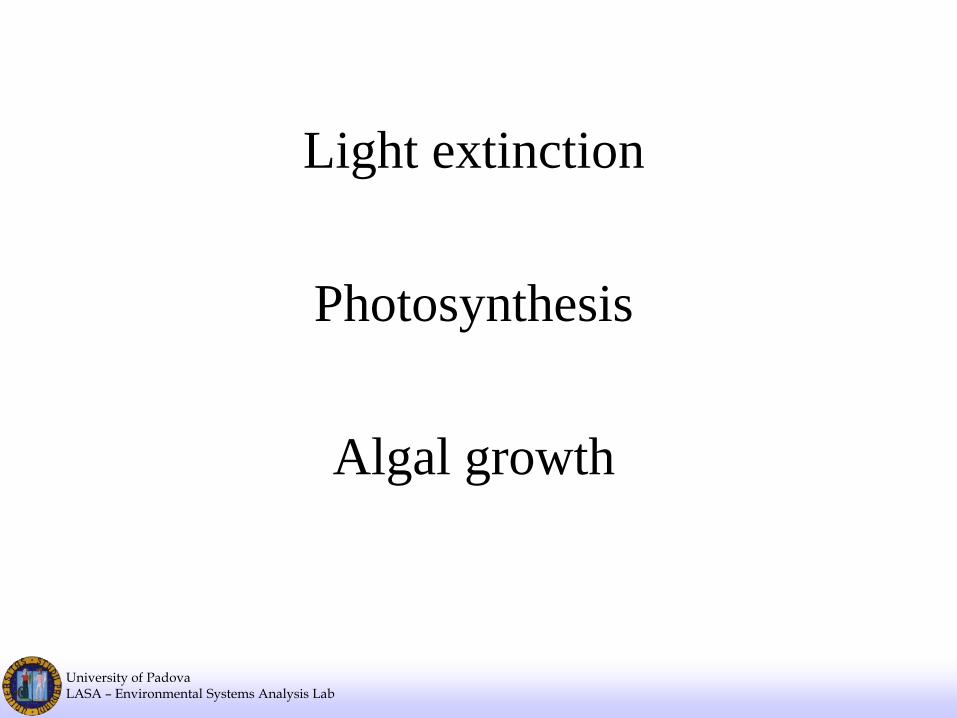
Light extinction Light is the main energy source for ecosystems and has a key role in ecological
processes: photosynthesis, transpiration, evapotranspiration, …
Hence, the quantification of the energy reaching the Earth’s surface and living
organisms is important.
University of Padova LASA – Environmental Systems Analysis Lab Modelling and Control of Environmental Systems
Physical processes – light extinction
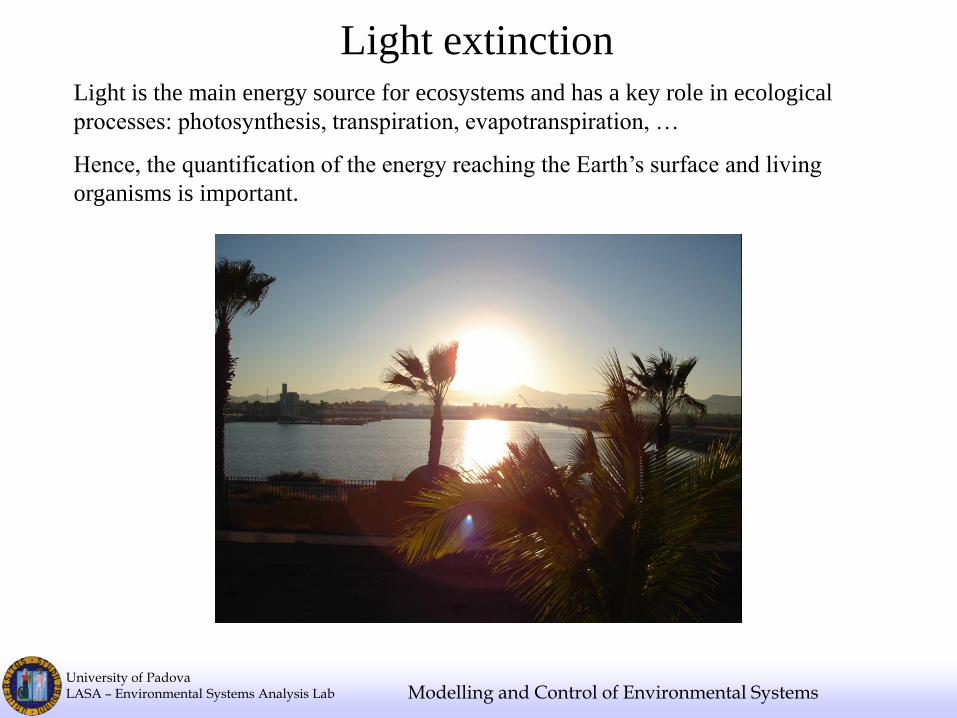
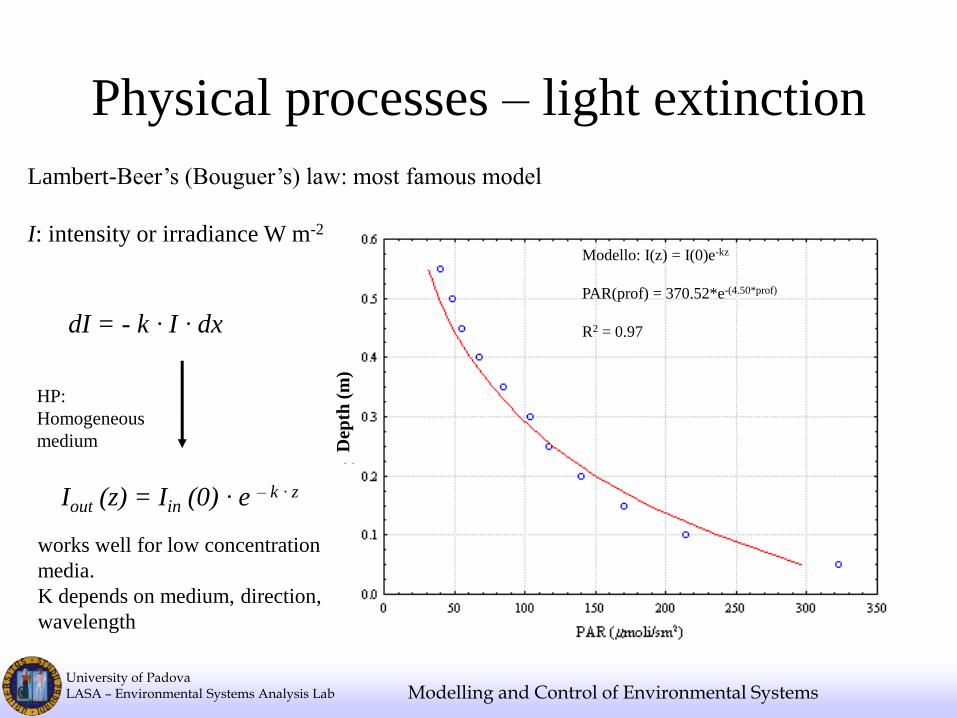
Lambert-Beer’s (Bouguer’s) law: most famous model
I: intensity or irradiance W m-2
dI = - k ∙ I ∙ dx
HP:
Homogeneous
medium
Iout (z) = Iin (0) ∙ e – k ∙ z
works well for low concentration
media.
K depends on medium, direction,
wavelength
Modello: I(z) = I(0)e-kz
PAR(prof) = 370.52*e-(4.50*prof)
R2 = 0.97 D
epth
(m
)
University of Padova LASA – Environmental Systems Analysis Lab Modelling and Control of Environmental Systems
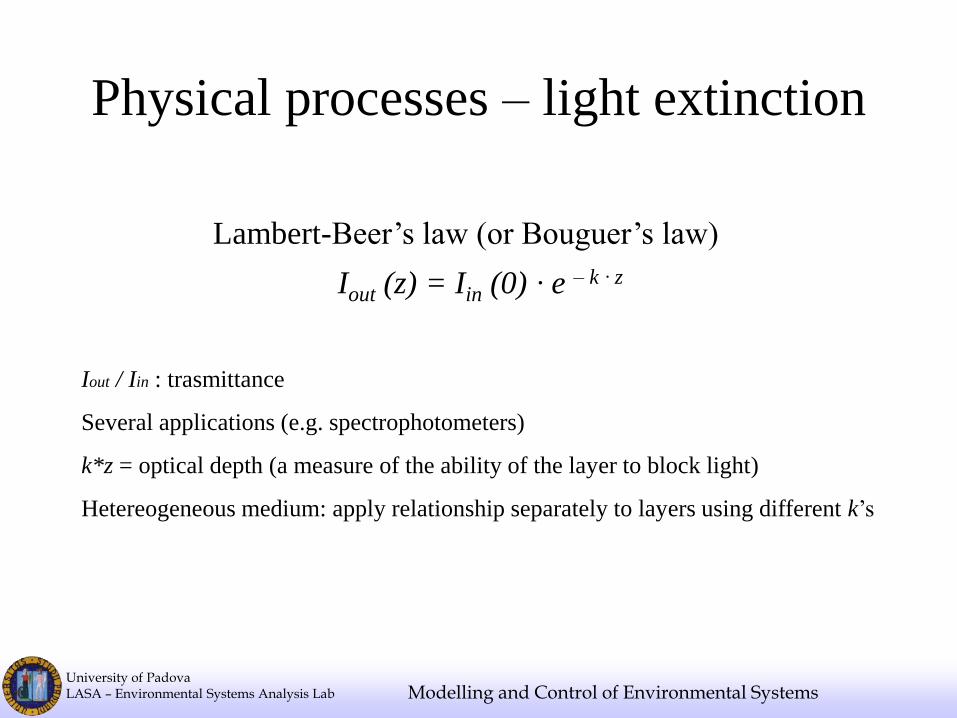
Lambert-Beer’s law (or Bouguer’s law)
Iout (z) = Iin (0) ∙ e – k ∙ z
Iout / Iin : trasmittance
Several applications (e.g. spectrophotometers)
k*z = optical depth (a measure of the ability of the layer to block light)
Hetereogeneous medium: apply relationship separately to layers using different k’s
Physical processes – light extinction
University of Padova LASA – Environmental Systems Analysis Lab Modelling and Control of Environmental Systems
Light extinction in the atmosphere
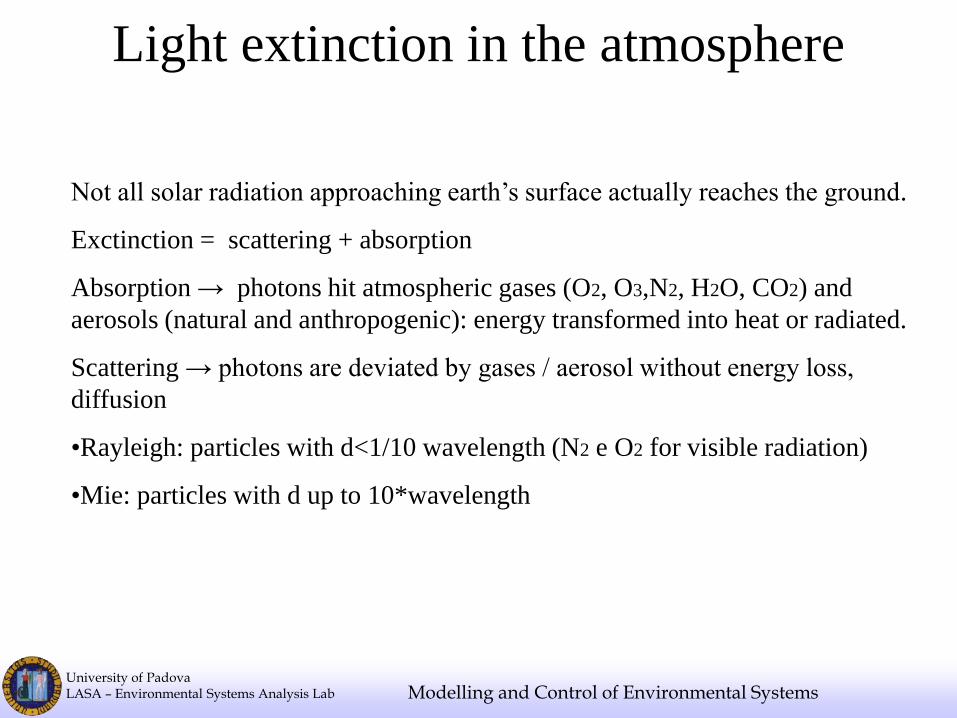
Not all solar radiation approaching earth’s surface actually reaches the ground.
Exctinction = scattering + absorption
Absorption → photons hit atmospheric gases (O2, O3,N2, H2O, CO2) and
aerosols (natural and anthropogenic): energy transformed into heat or radiated.
Scattering → photons are deviated by gases / aerosol without energy loss,
diffusion
•Rayleigh: particles with d<1/10 wavelength (N2 e O2 for visible radiation)
•Mie: particles with d up to 10*wavelength
University of Padova LASA – Environmental Systems Analysis Lab Modelling and Control of Environmental Systems
Light extinction in the atmosphere
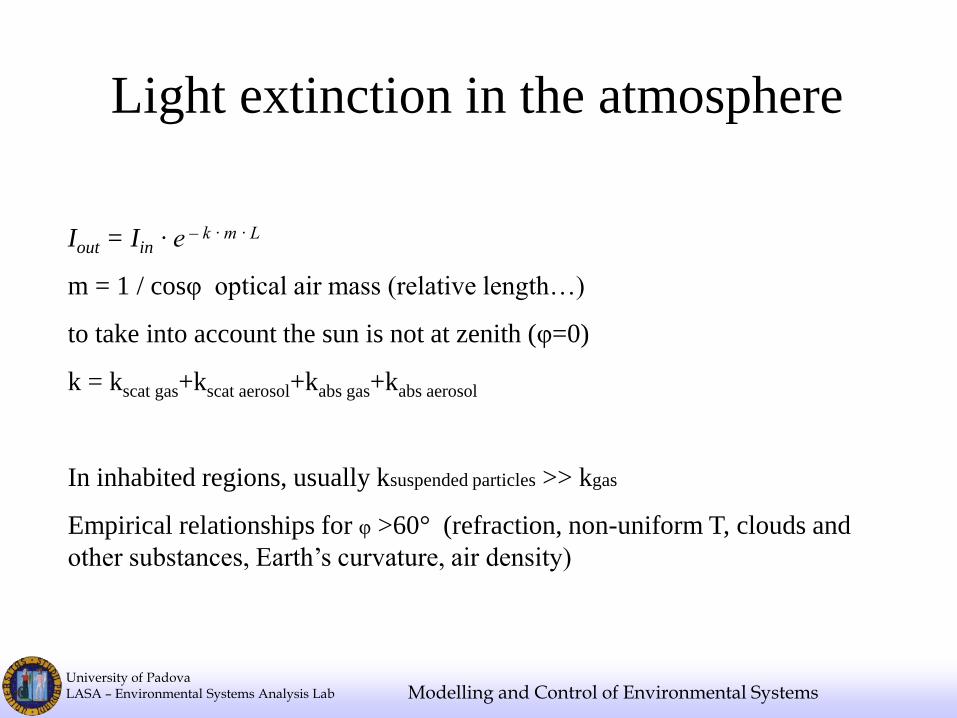
Iout = Iin ∙ e – k ∙ m ∙ L
m = 1 / cosφ optical air mass (relative length…)
to take into account the sun is not at zenith (φ=0)
k = kscat gas+kscat aerosol+kabs gas+kabs aerosol
In inhabited regions, usually ksuspended particles >> kgas
Empirical relationships for φ >60° (refraction, non-uniform T, clouds and
other substances, Earth’s curvature, air density)
University of Padova LASA – Environmental Systems Analysis Lab Modelling and Control of Environmental Systems
Light extinction in water
• Too few (or too much) light can limit primary
production (phytoplankton, macroalgae, etc.)
• Scattering and absorption due to water, suspended
and dissolved substances
• Also the other way: primary producers can
influence extinction (phytoplankton shading and
self shading). Feedback!
University of Padova LASA – Environmental Systems Analysis Lab Modelling and Control of Environmental Systems
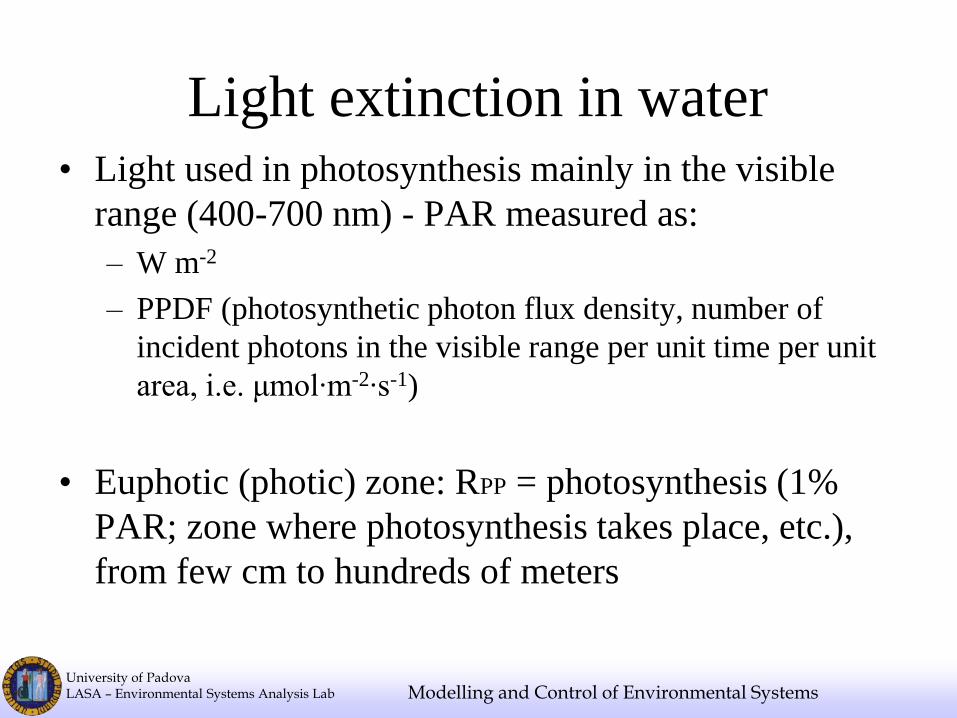
• Light used in photosynthesis mainly in the visible
range (400-700 nm) - PAR measured as:
– W m-2
– PPDF (photosynthetic photon flux density, number of
incident photons in the visible range per unit time per unit
area, i.e. μmol∙m-2∙s-1)
• Euphotic (photic) zone: RPP = photosynthesis (1%
PAR; zone where photosynthesis takes place, etc.),
from few cm to hundreds of meters
Light extinction in water
University of Padova LASA – Environmental Systems Analysis Lab Modelling and Control of Environmental Systems
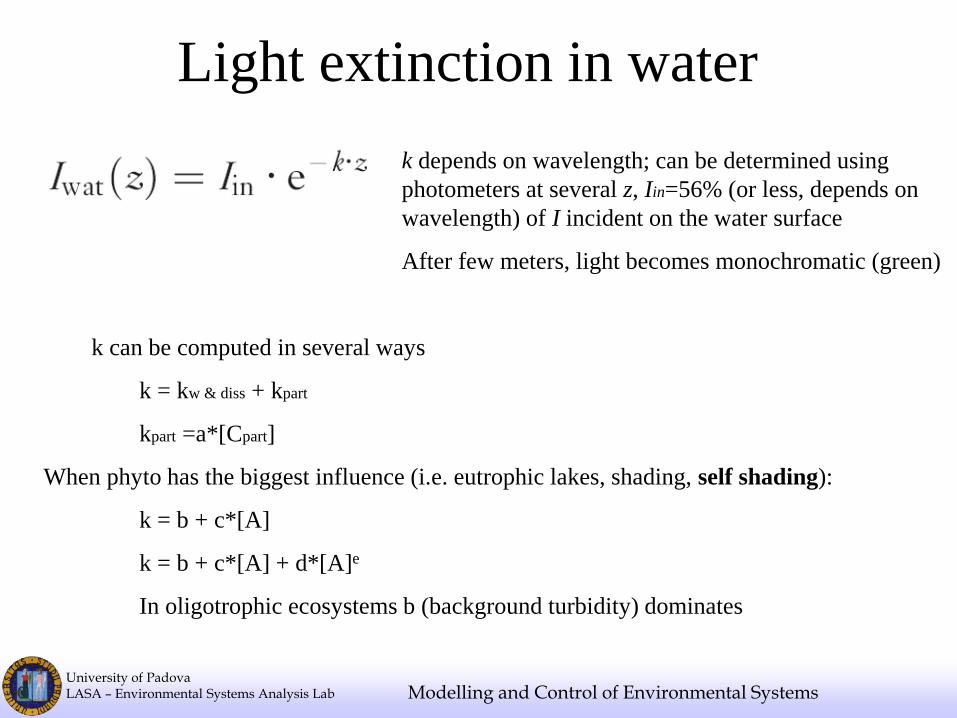
Light extinction in water
k depends on wavelength; can be determined using
photometers at several z, Iin=56% (or less, depends on
wavelength) of I incident on the water surface
After few meters, light becomes monochromatic (green)
k can be computed in several ways
k = kw & diss + kpart
kpart =a*[Cpart]
When phyto has the biggest influence (i.e. eutrophic lakes, shading, self shading):
k = b + c*[A]
k = b + c*[A] + d*[A]e
In oligotrophic ecosystems b (background turbidity) dominates
University of Padova LASA – Environmental Systems Analysis Lab Modelling and Control of Environmental Systems
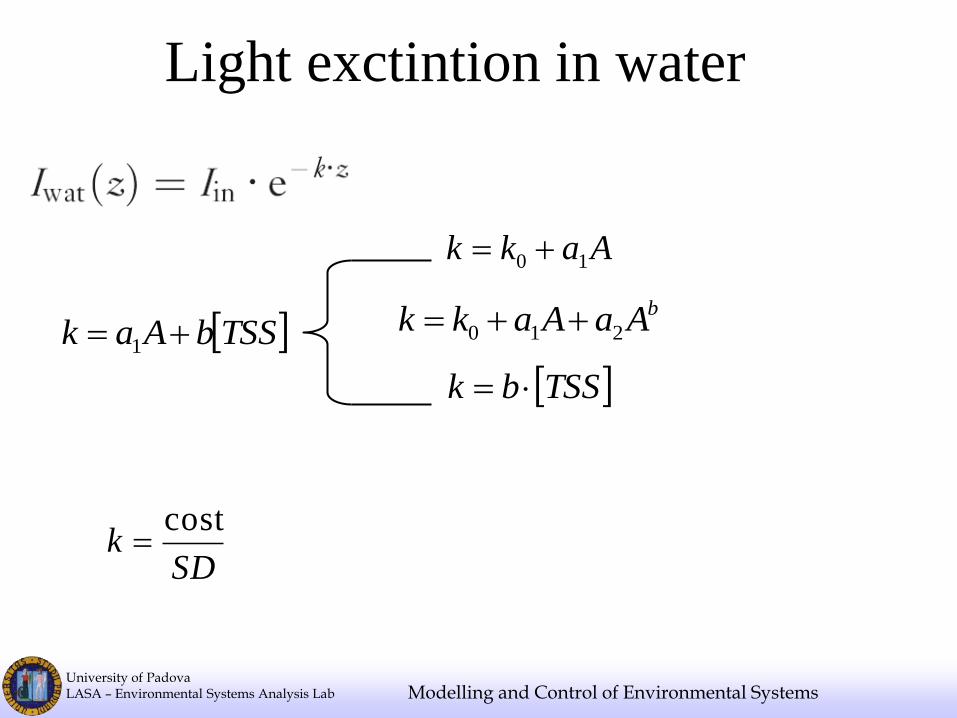
Light exctintion in water
SDk
cost
Aakk 10
bAaAakk 210
TSSbk
TSSbAak 1
University of Padova LASA – Environmental Systems Analysis Lab Modelling and Control of Environmental Systems
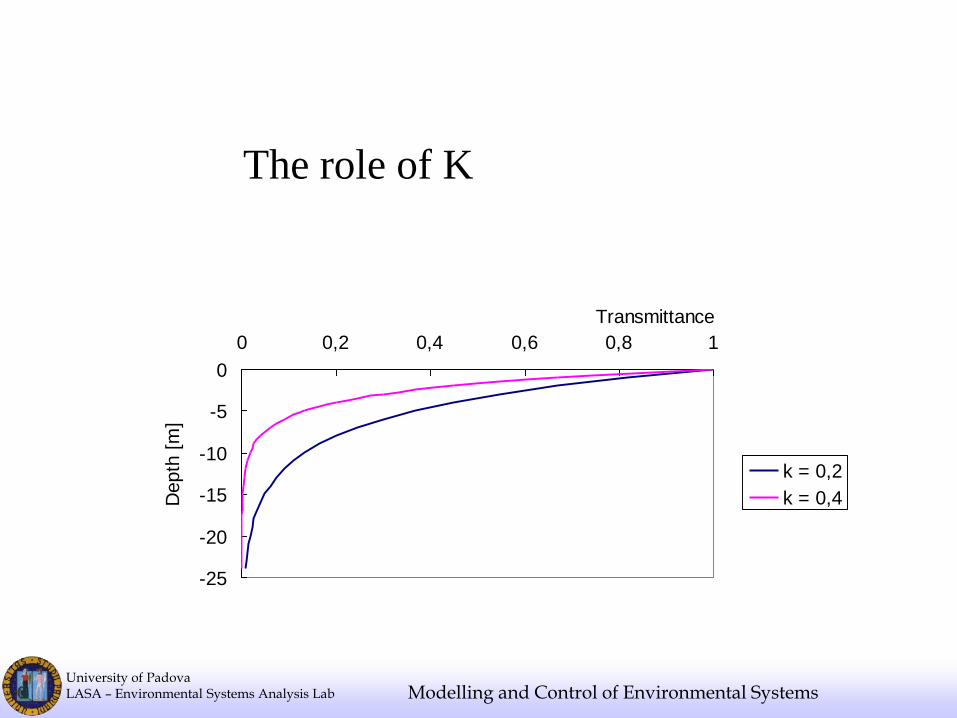
Estinzione della luce in un mezzo secodo la
legge di Lambert-Beer
-25
-20
-15
-10
-5
0
0 0,2 0,4 0,6 0,8 1
Transmittance
Depth
[m
]
k = 0,2
k = 0,4
The role of K
University of Padova LASA – Environmental Systems Analysis Lab Modelling and Control of Environmental Systems
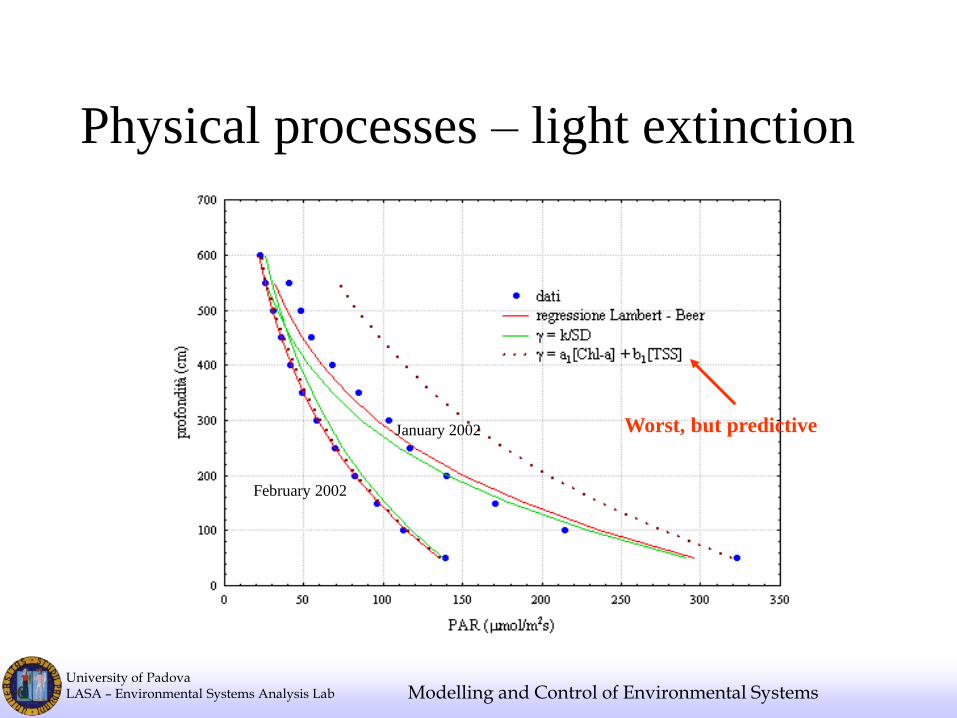
Physical processes – light extinction
February 2002
January 2002 Worst, but predictive
University of Padova LASA – Environmental Systems Analysis Lab Modelling and Control of Environmental Systems
Light extinction in terrestrial ecosystems
• The canopy of trees can attenuate light (i.e.
tropical forests)
• Influence underlying vegetation / undergrowth
/ animals / nutrient cycling etc.
• Agriculture, crop spacing, water balance for
irrigation
University of Padova LASA – Environmental Systems Analysis Lab Modelling and Control of Environmental Systems
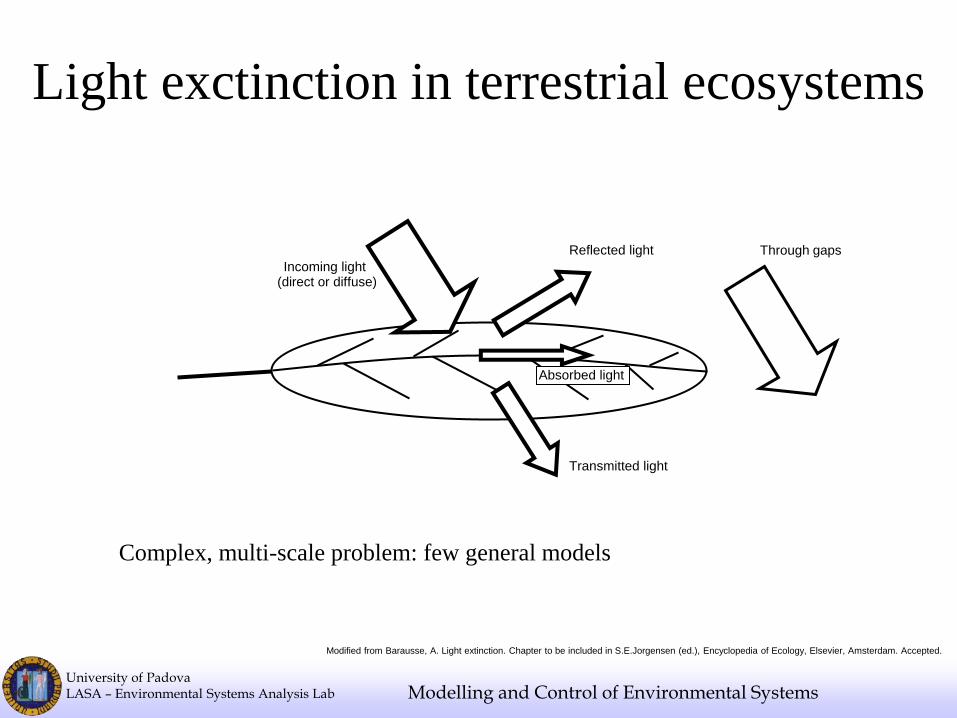
Light exctinction in terrestrial ecosystems
Reflected light
Incoming light
Transmitted light
Absorbed light
Through gaps
(direct or diffuse)
Modified from Barausse, A. Light extinction. Chapter to be included in S.E.Jorgensen (ed.), Encyclopedia of Ecology, Elsevier, Amsterdam. Accepted.
Complex, multi-scale problem: few general models
University of Padova LASA – Environmental Systems Analysis Lab Modelling and Control of Environmental Systems
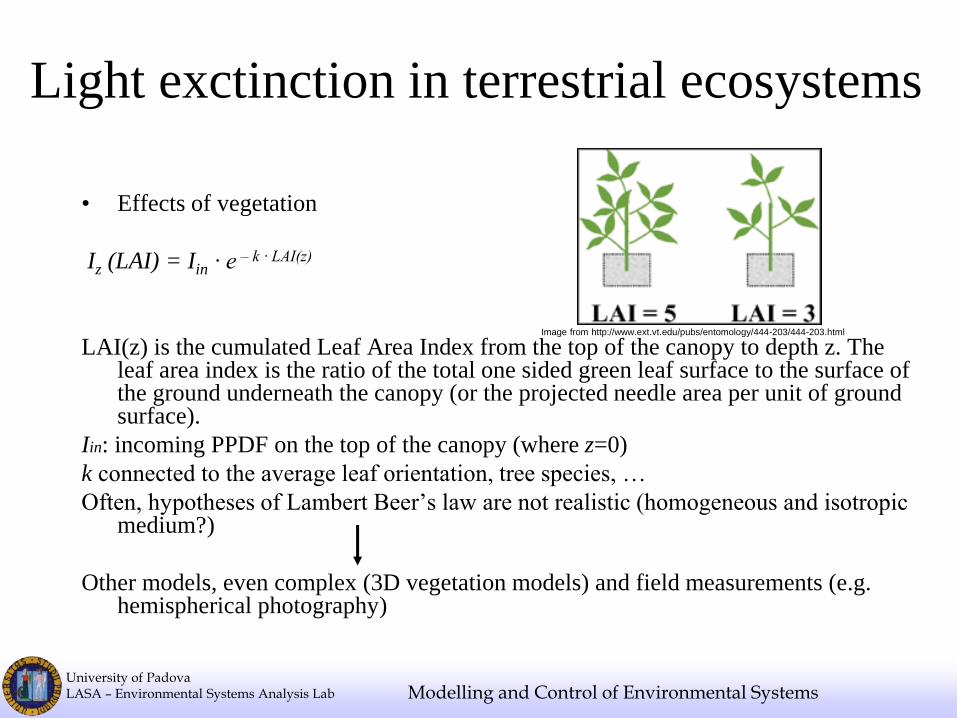
Light exctinction in terrestrial ecosystems
• Effects of vegetation
Iz (LAI) = Iin ∙ e – k ∙ LAI(z)
LAI(z) is the cumulated Leaf Area Index from the top of the canopy to depth z. The leaf area index is the ratio of the total one sided green leaf surface to the surface of the ground underneath the canopy (or the projected needle area per unit of ground surface).
Iin: incoming PPDF on the top of the canopy (where z=0)
k connected to the average leaf orientation, tree species, …
Often, hypotheses of Lambert Beer’s law are not realistic (homogeneous and isotropic medium?)
Other models, even complex (3D vegetation models) and field measurements (e.g. hemispherical photography)
Image from http://www.ext.vt.edu/pubs/entomology/444-203/444-203.html
University of Padova LASA – Environmental Systems Analysis Lab Modelling and Control of Environmental Systems
Photosynthesis
6 CO2 + 6 H20 + hν → C6H12O6 + 6 O2
University of Padova LASA – Environmental Systems Analysis Lab Modelling and Control of Environmental Systems
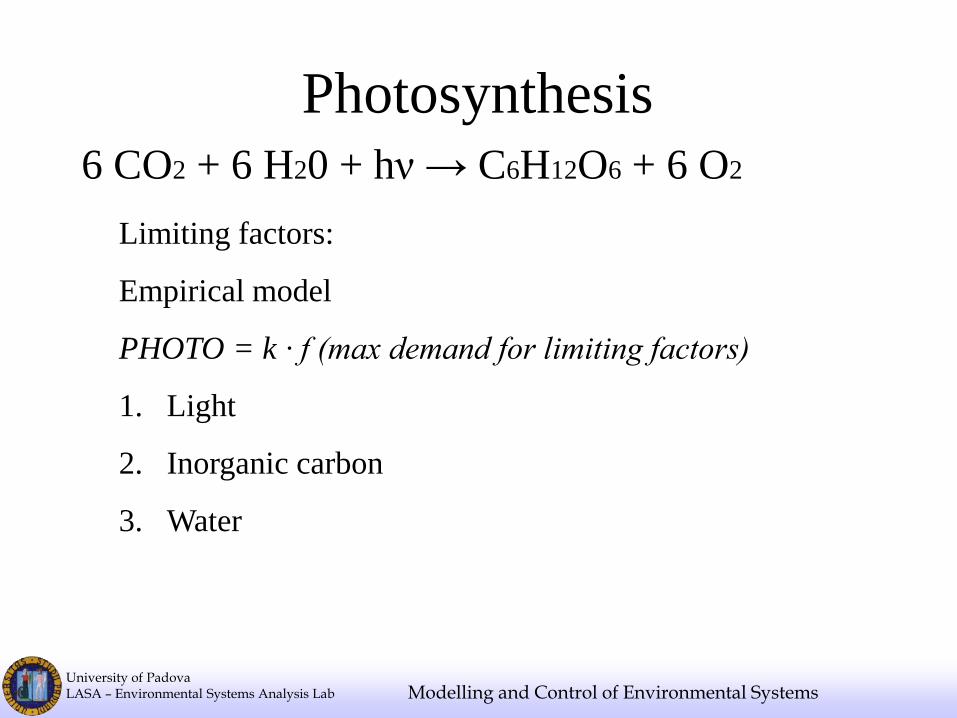
Photosynthesis 6 CO2 + 6 H20 + hν → C6H12O6 + 6 O2
Limiting factors:
Empirical model
PHOTO = k ∙ f (max demand for limiting factors)
University of Padova LASA – Environmental Systems Analysis Lab Modelling and Control of Environmental Systems
Phosynthesis
6 CO2 + 6 H20 + hν → C6H12O6 + 6 O2
Limiting factors:
Empirical model
PHOTO = k ∙ f (max demand for limiting factors)
1. Light (optimum irradiance: energy is needed but not too
much; Chlorophyll absorbance spectrum 400-700 nm and
depending on species, bacteria – bacteriochlorophyll also
longer wavelength)
University of Padova LASA – Environmental Systems Analysis Lab Modelling and Control of Environmental Systems
Photosynthesis 6 CO2 + 6 H20 + hν → C6H12O6 + 6 O2
Limiting factors:
Empirical model
PHOTO = k ∙ f (max demand for limiting factors)
1. Light
2. Inorganic carbon
University of Padova LASA – Environmental Systems Analysis Lab Modelling and Control of Environmental Systems
Photosynthesis 6 CO2 + 6 H20 + hν → C6H12O6 + 6 O2
Limiting factors:
Empirical model
PHOTO = k ∙ f (max demand for limiting factors)
1. Light
2. Inorganic carbon
3. Water
University of Padova LASA – Environmental Systems Analysis Lab Modelling and Control of Environmental Systems
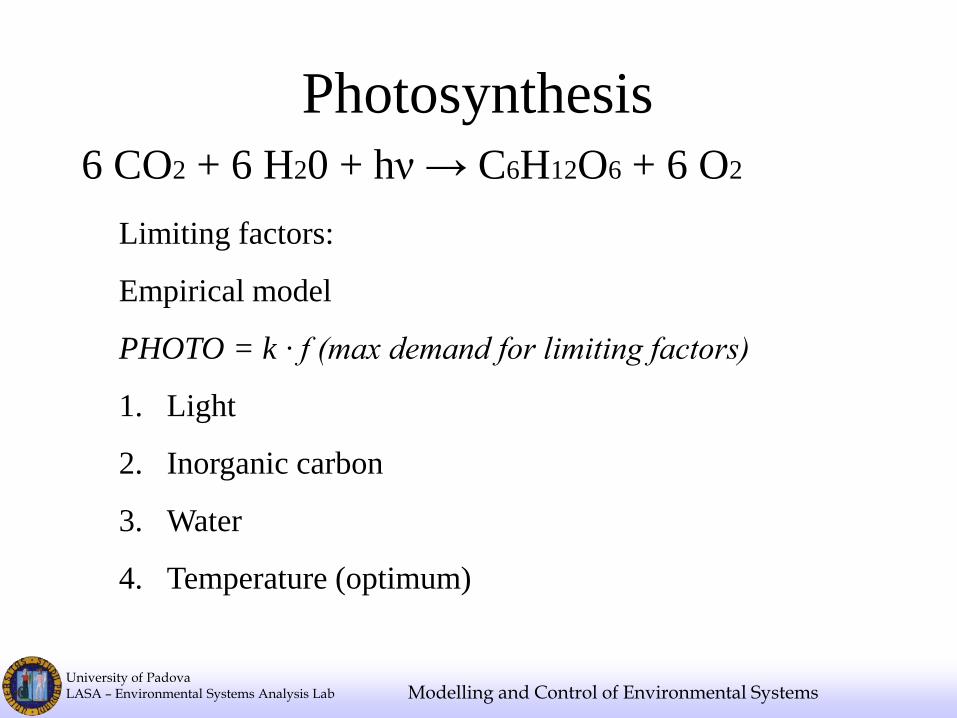
Photosynthesis 6 CO2 + 6 H20 + hν → C6H12O6 + 6 O2
Limiting factors:
Empirical model
PHOTO = k ∙ f (max demand for limiting factors)
1. Light
2. Inorganic carbon
3. Water
4. Temperature (optimum)
University of Padova LASA – Environmental Systems Analysis Lab Modelling and Control of Environmental Systems
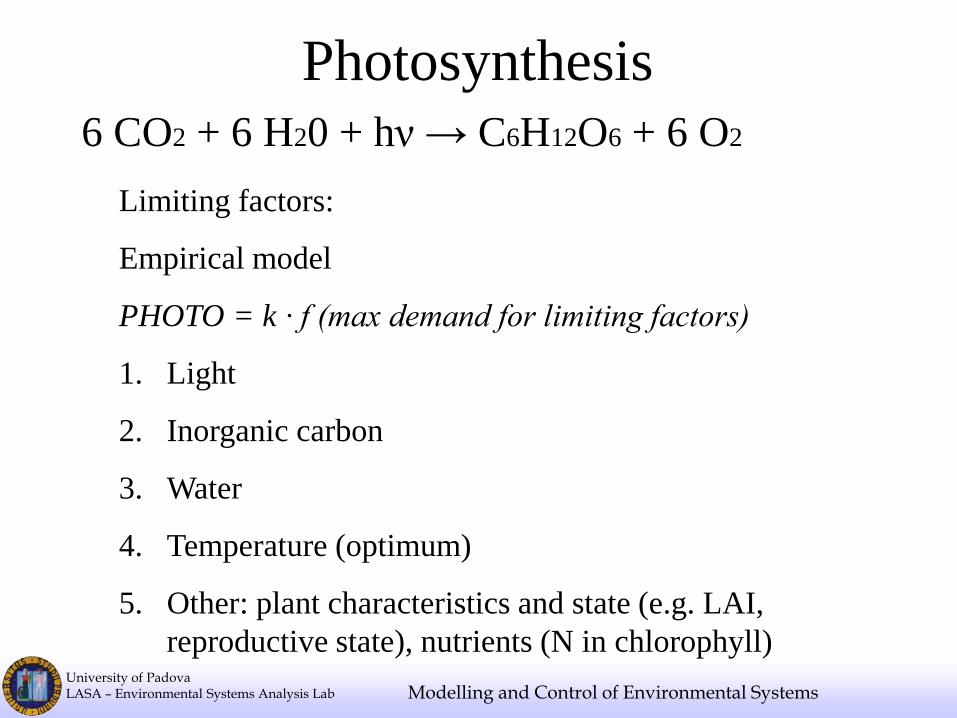
Photosynthesis 6 CO2 + 6 H20 + hν → C6H12O6 + 6 O2
Limiting factors:
Empirical model
PHOTO = k ∙ f (max demand for limiting factors)
1. Light
2. Inorganic carbon
3. Water
4. Temperature (optimum)
5. Other: plant characteristics and state (e.g. LAI,
reproductive state), nutrients (N in chlorophyll)
University of Padova LASA – Environmental Systems Analysis Lab Modelling and Control of Environmental Systems
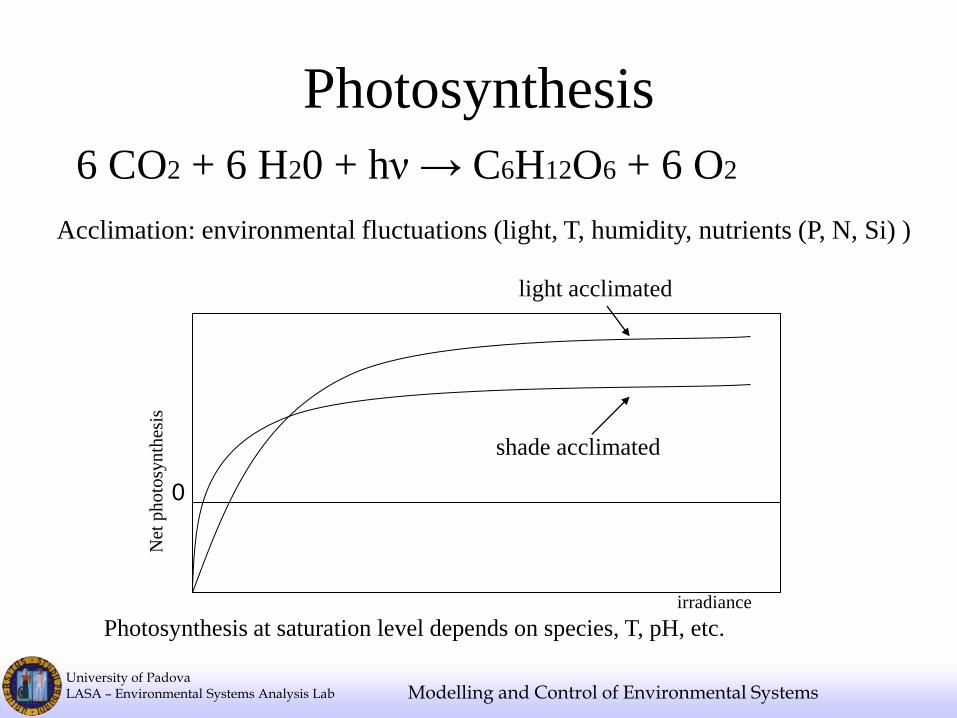
Acclimation: environmental fluctuations (light, T, humidity, nutrients (P, N, Si) )
0
Net
ph
oto
syn
thes
is
irradiance
shade acclimated
light acclimated
Photosynthesis at saturation level depends on species, T, pH, etc.
Photosynthesis
6 CO2 + 6 H20 + hν → C6H12O6 + 6 O2
University of Padova LASA – Environmental Systems Analysis Lab Modelling and Control of Environmental Systems
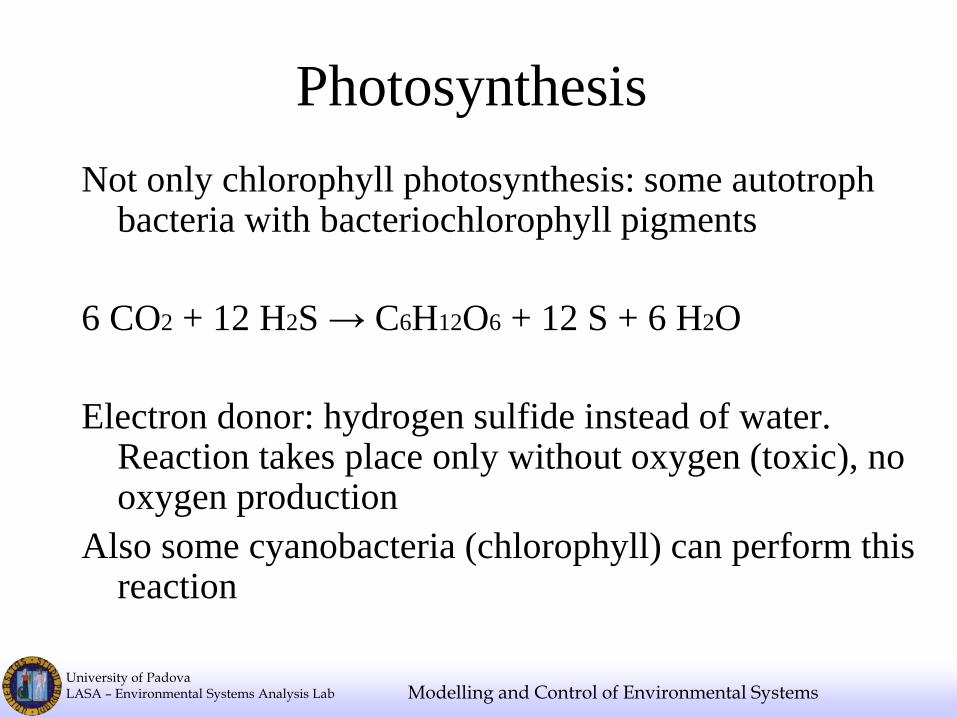
Photosynthesis
Not only chlorophyll photosynthesis: some autotroph bacteria with bacteriochlorophyll pigments
6 CO2 + 12 H2S → C6H12O6 + 12 S + 6 H2O
Electron donor: hydrogen sulfide instead of water. Reaction takes place only without oxygen (toxic), no oxygen production
Also some cyanobacteria (chlorophyll) can perform this reaction
University of Padova LASA – Environmental Systems Analysis Lab Modelling and Control of Environmental Systems
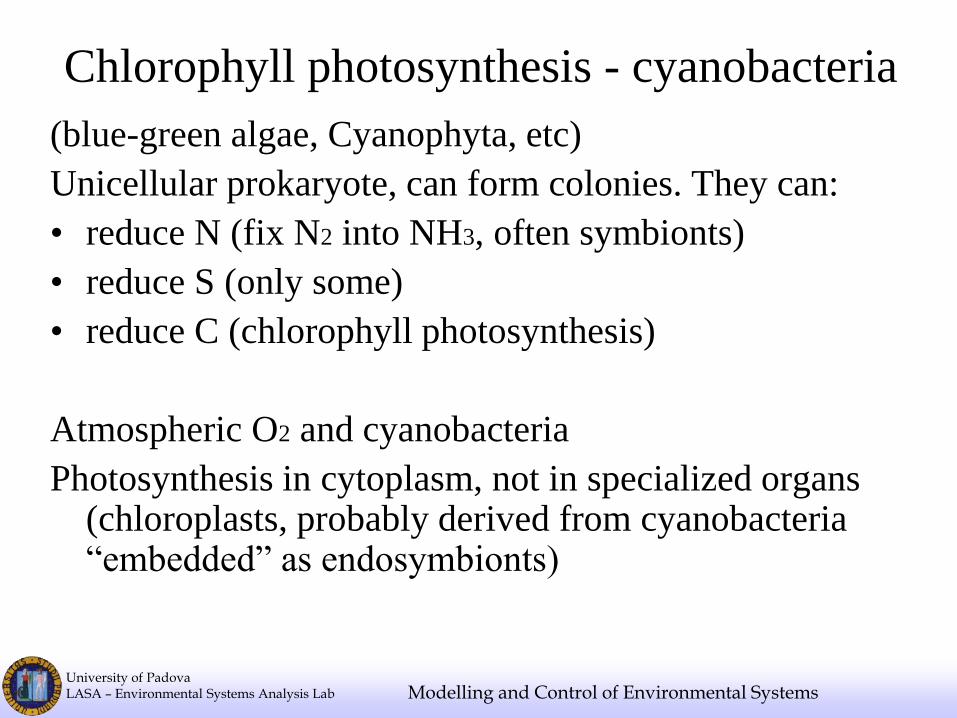
Chlorophyll photosynthesis - cyanobacteria
(blue-green algae, Cyanophyta, etc)
Unicellular prokaryote, can form colonies. They can:
• reduce N (fix N2 into NH3, often symbionts)
• reduce S (only some)
• reduce C (chlorophyll photosynthesis)
Atmospheric O2 and cyanobacteria
Photosynthesis in cytoplasm, not in specialized organs (chloroplasts, probably derived from cyanobacteria “embedded” as endosymbionts)
University of Padova LASA – Environmental Systems Analysis Lab Modelling and Control of Environmental Systems
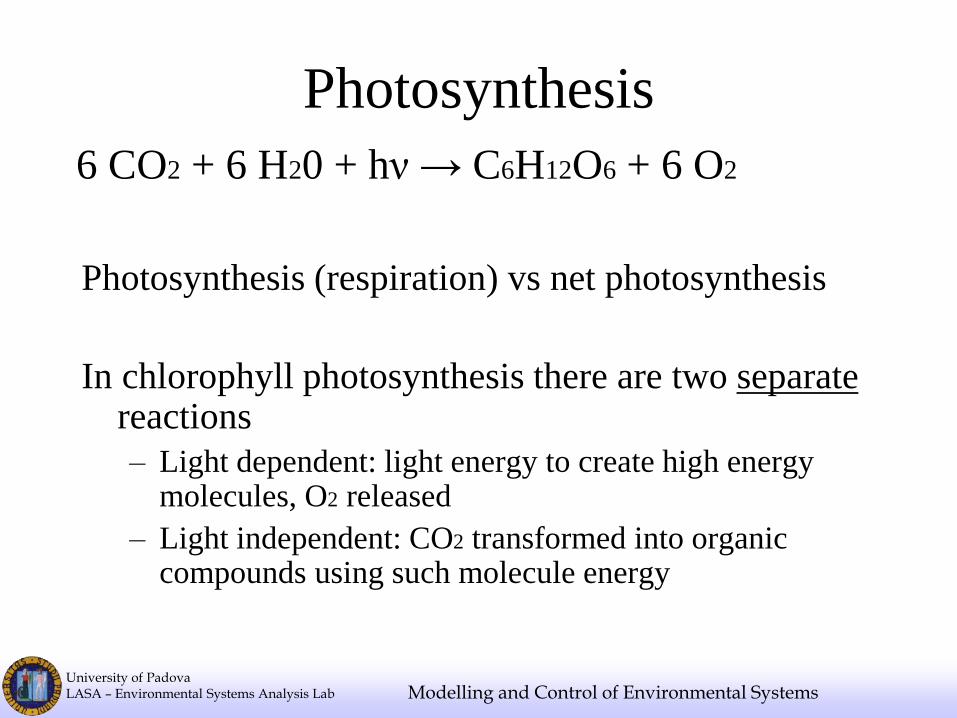
Photosynthesis (respiration) vs net photosynthesis
In chlorophyll photosynthesis there are two separate reactions
– Light dependent: light energy to create high energy molecules, O2 released
– Light independent: CO2 transformed into organic compounds using such molecule energy
Photosynthesis
6 CO2 + 6 H20 + hν → C6H12O6 + 6 O2
University of Padova LASA – Environmental Systems Analysis Lab Modelling and Control of Environmental Systems
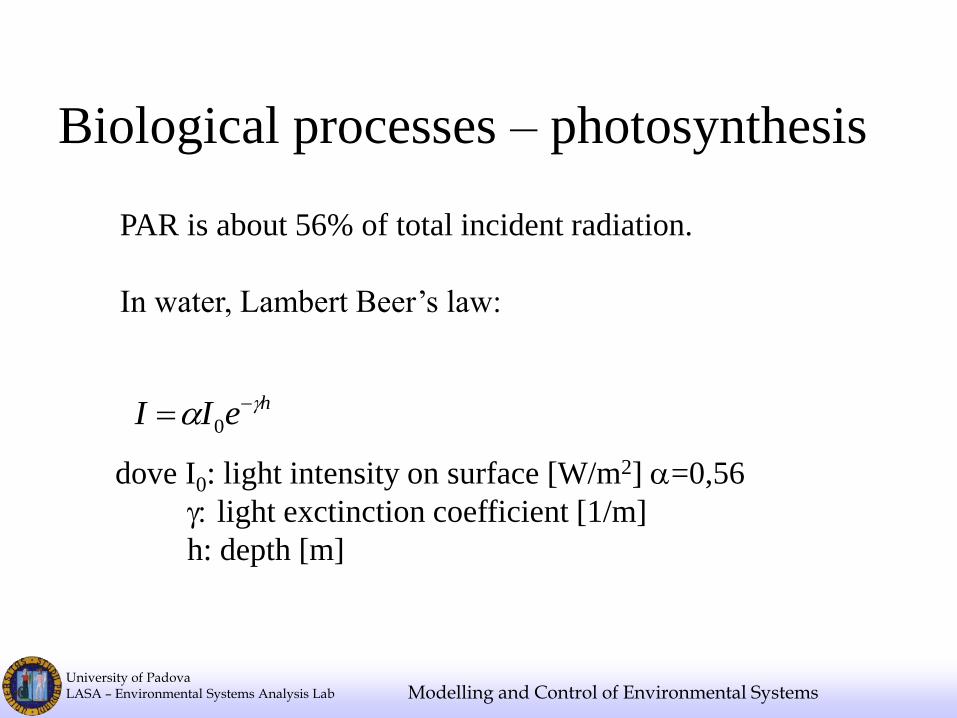
PAR is about 56% of total incident radiation.
In water, Lambert Beer’s law:
heII 0
dove I0: light intensity on surface [W/m2] =0,56
: light exctinction coefficient [1/m]
h: depth [m]
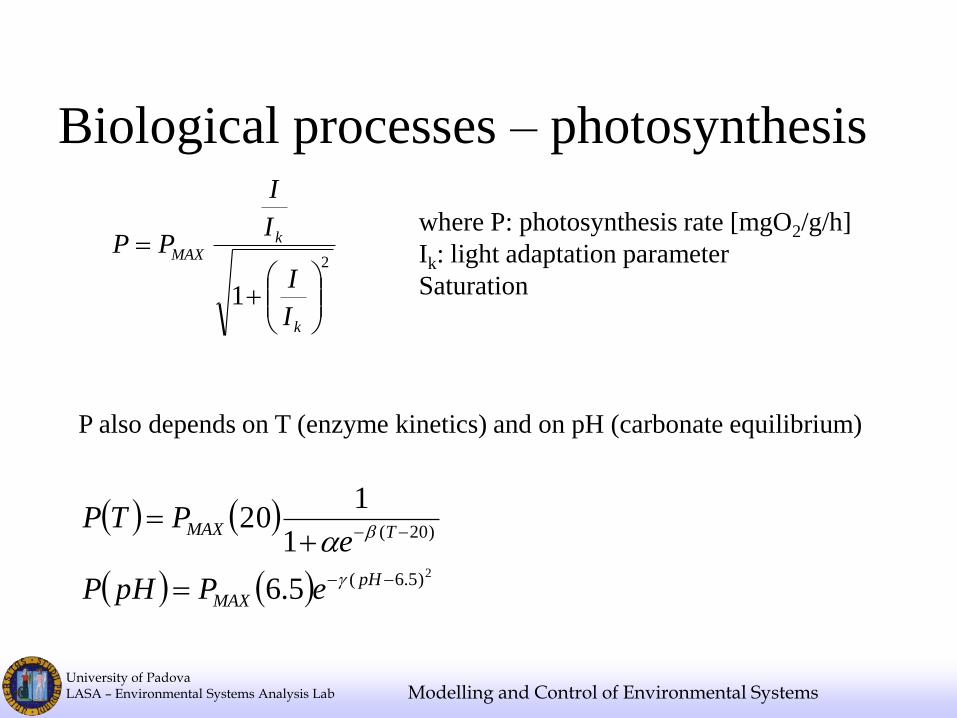
Biological processes – photosynthesis
University of Padova LASA – Environmental Systems Analysis Lab Modelling and Control of Environmental Systems
2
1
k
kMAX
I
I
I
I
PPwhere P: photosynthesis rate [mgO2/g/h]
Ik: light adaptation parameter
Saturation
P also depends on T (enzyme kinetics) and on pH (carbonate equilibrium)
2)5.6(
)20(
5.6
1
120
pH
MAX
TMAX
ePpHP
ePTP
Biological processes – photosynthesis
University of Padova LASA – Environmental Systems Analysis Lab Modelling and Control of Environmental Systems
Biological processes – algal growth
University of Padova LASA – Environmental Systems Analysis Lab
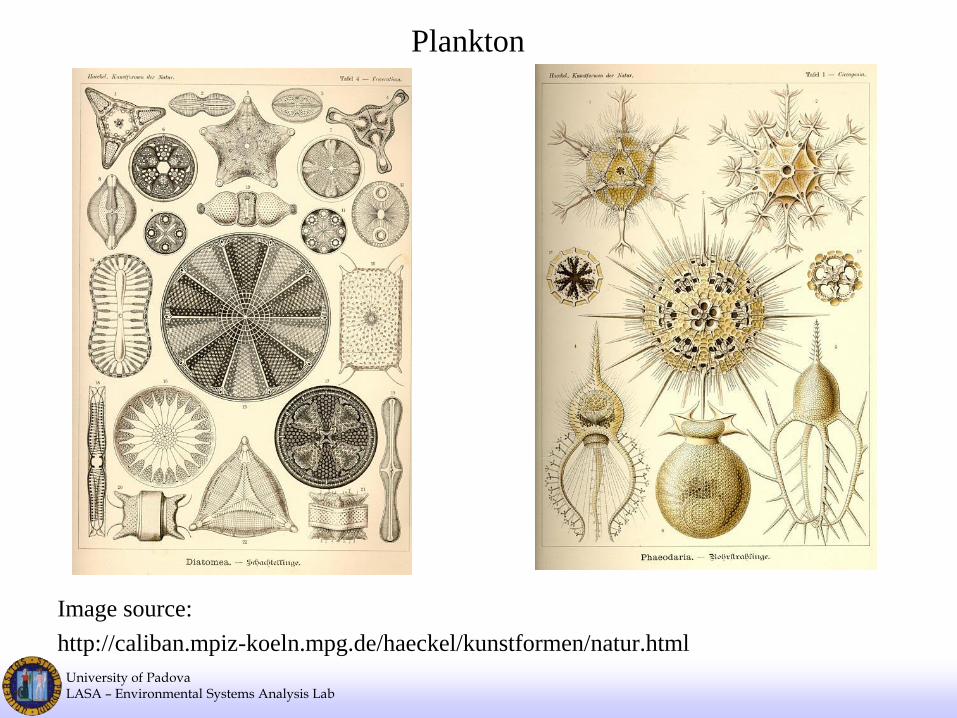
Image source:
http://caliban.mpiz-koeln.mpg.de/haeckel/kunstformen/natur.html
Plankton
University of Padova LASA – Environmental Systems Analysis Lab
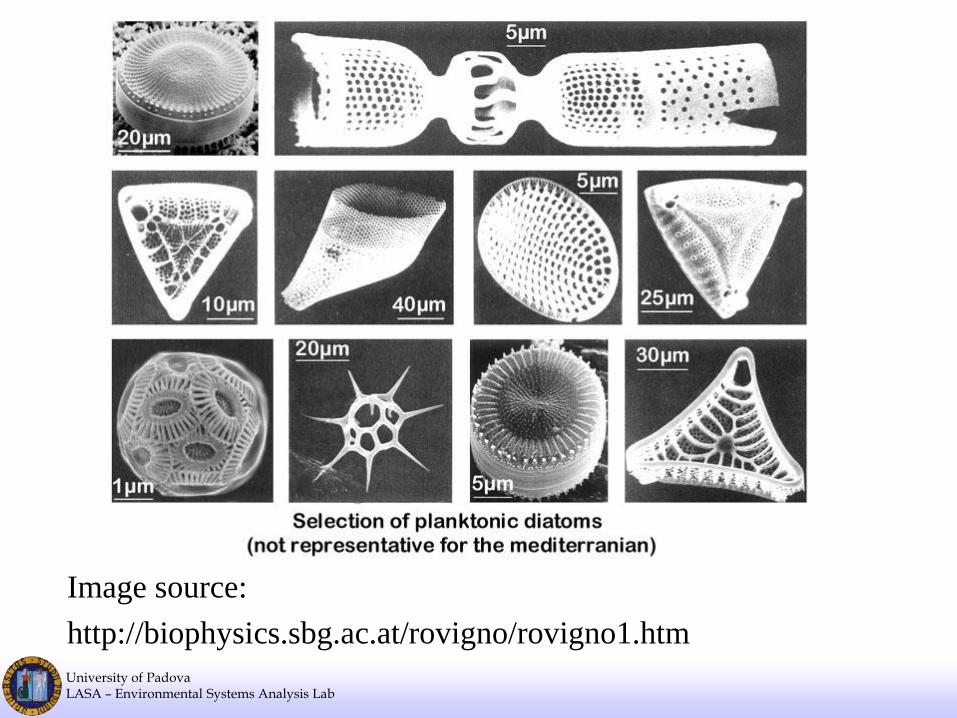
Image source:
http://biophysics.sbg.ac.at/rovigno/rovigno1.htm
University of Padova LASA – Environmental Systems Analysis Lab Modelling and Control of Environmental Systems
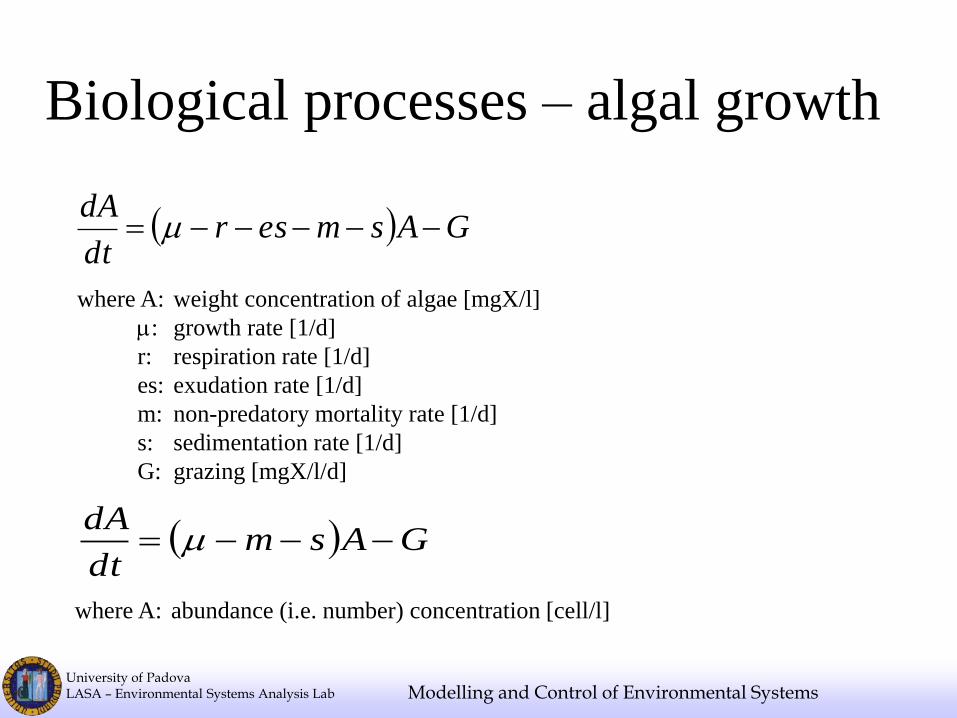
GAsmesrdt
dA
where A: weight concentration of algae [mgX/l]
: growth rate [1/d]
r: respiration rate [1/d]
es: exudation rate [1/d]
m: non-predatory mortality rate [1/d]
s: sedimentation rate [1/d]
G: grazing [mgX/l/d]
GAsmdt
dA
where A: abundance (i.e. number) concentration [cell/l]
Biological processes – algal growth
University of Padova LASA – Environmental Systems Analysis Lab Modelling and Control of Environmental Systems
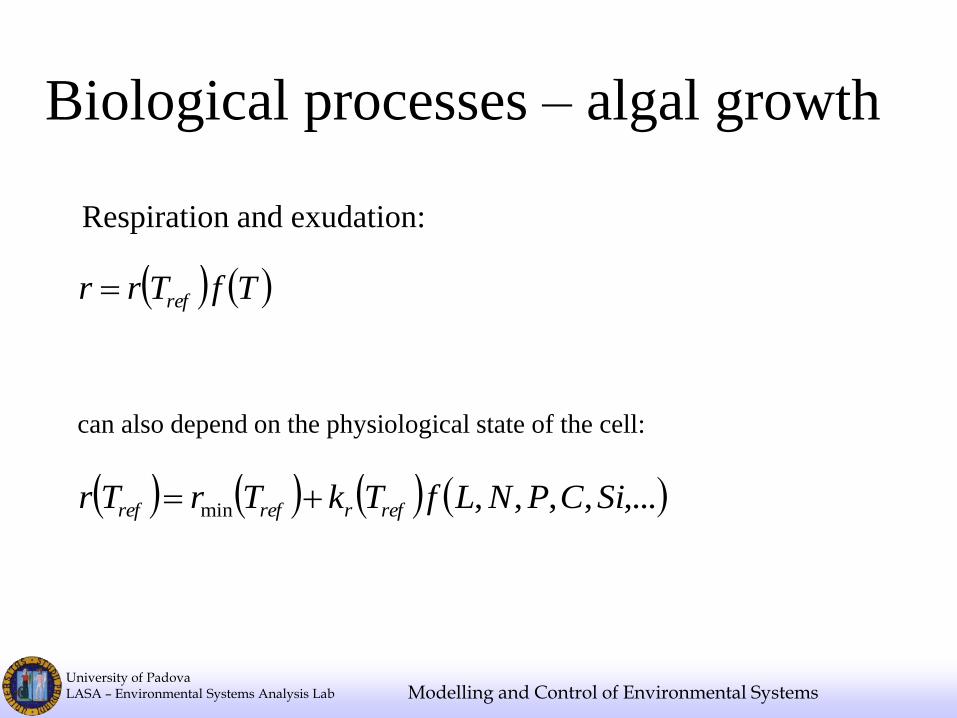
TfTrr ref
Respiration and exudation:
can also depend on the physiological state of the cell:
,...,,,,min SiCPNLfTkTrTr refrrefref
Biological processes – algal growth
University of Padova LASA – Environmental Systems Analysis Lab Modelling and Control of Environmental Systems
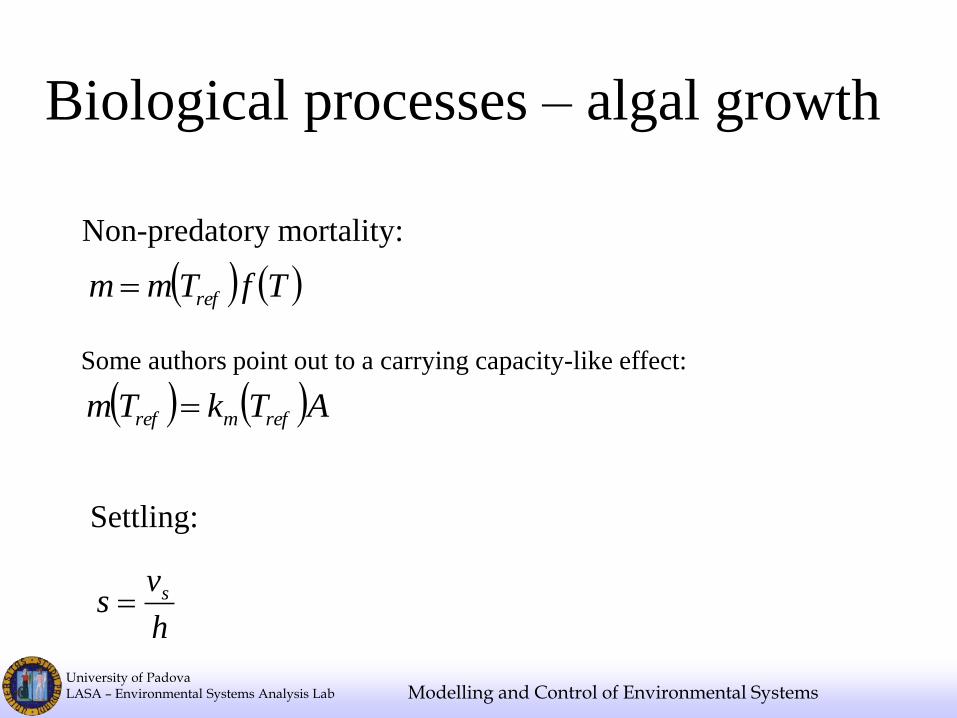
Settling:
h
vs s
Non-predatory mortality:
TfTmm ref
Some authors point out to a carrying capacity-like effect:
ATkTm refmref
Biological processes – algal growth
University of Padova LASA – Environmental Systems Analysis Lab Modelling and Control of Environmental Systems
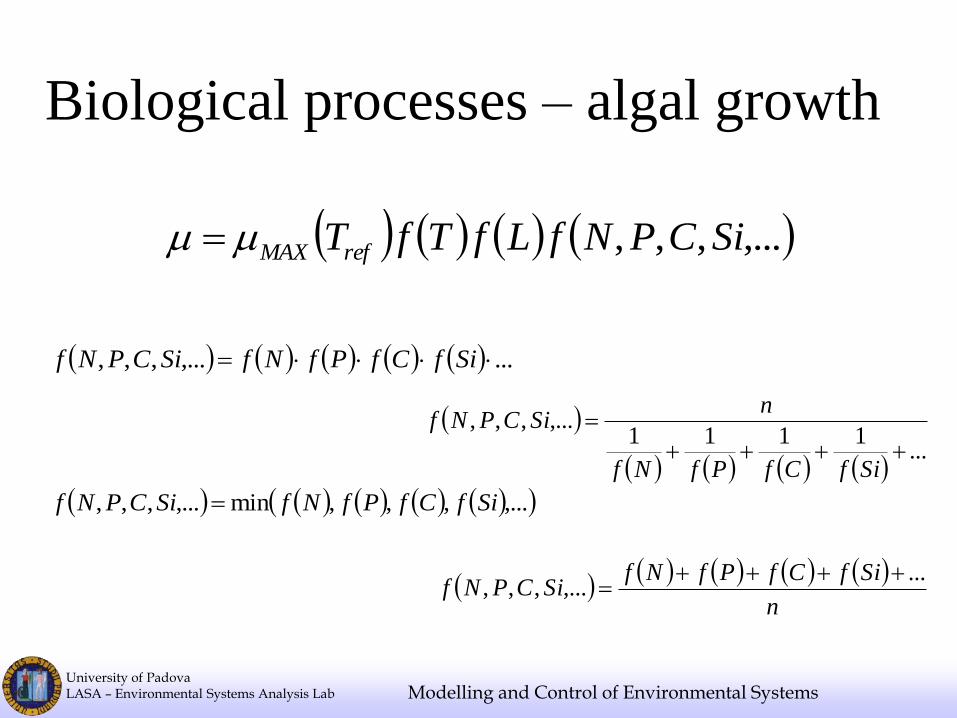
,...,,, SiCPNfLfTfTrefMAX
...,...,,, SifCfPfNfSiCPNf
,...,,,min,...,,, SifCfPfNfSiCPNf
...
1111,...,,,
SifCfPfNf
nSiCPNf
n
SifCfPfNfSiCPNf
...,...,,,
Biological processes – algal growth
University of Padova LASA – Environmental Systems Analysis Lab Modelling and Control of Environmental Systems
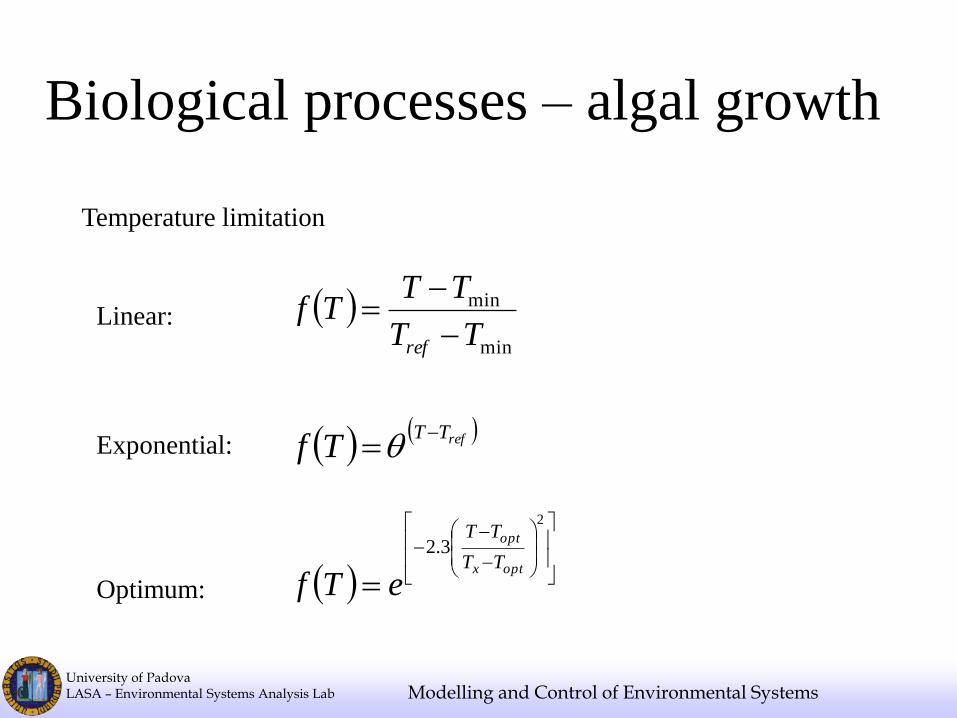
Temperature limitation
Linear: min
min
TT
TTTf
ref
Exponential: refTTTf
Optimum:
2
3.2optx
opt
TT
TT
eTf
Biological processes – algal growth
University of Padova LASA – Environmental Systems Analysis Lab Modelling and Control of Environmental Systems
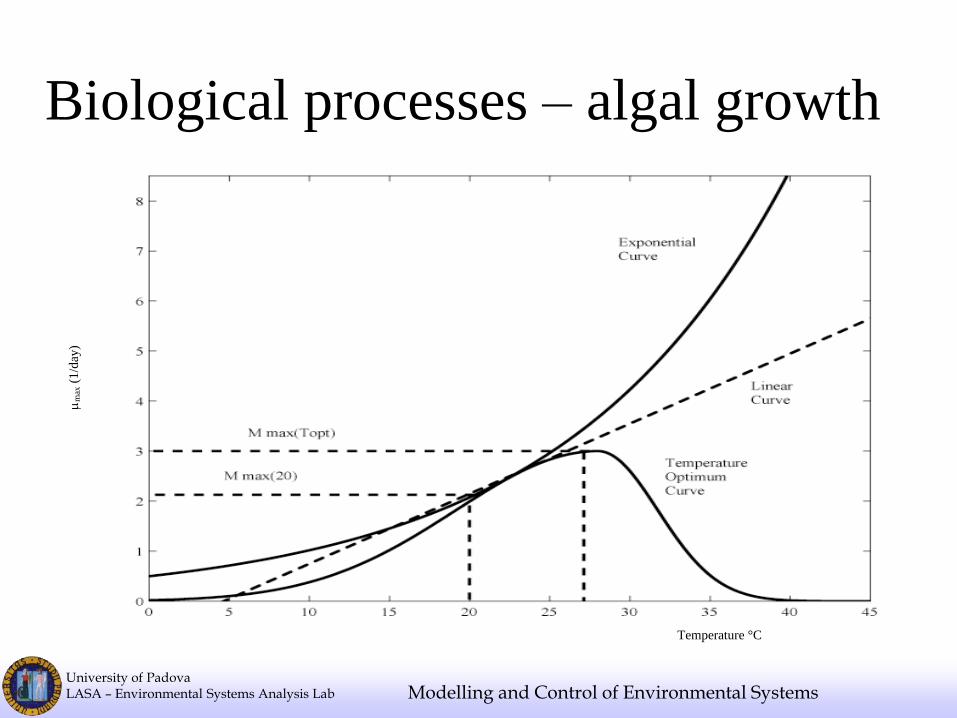
Temperature °C
m
ax (
1/d
ay)
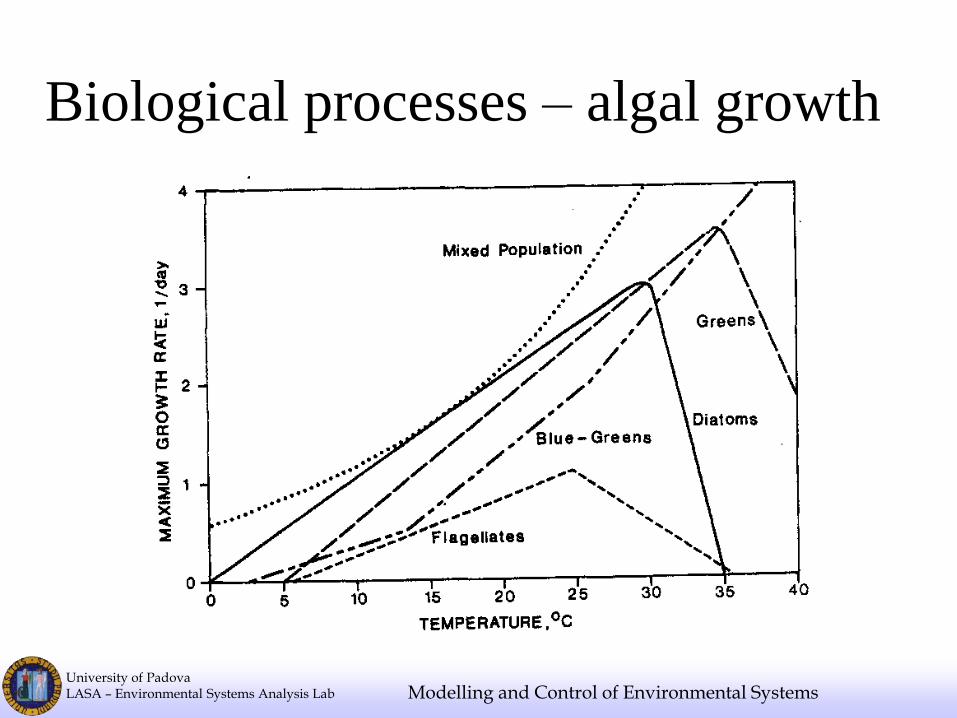
Biological processes – algal growth
University of Padova LASA – Environmental Systems Analysis Lab Modelling and Control of Environmental Systems
Biological processes – algal growth