Embed Size (px)
Citation preview

C H A P T E R S E V E N T E E N
Light Control of PlasmaMembrane Recruitment Usingthe Phy–PIF System
Jared E. Toettcher,*,† Delquin Gong,* Wendell A. Lim,†,‡
and Orion D. Weiner*
Contents1. Introduction 410
2. Light-Controlled Phy–PIF Interaction 411
3. Genetic Constructs Encoding Phy and PIF Components 412
4. Purification of PCB from Spirulina 415
4.1. Protocol 415
5. Cell Culture Preparation for Phy–PIF Translocation 418
5.1. Protocol 418
6. Imaging PIF Translocation Using Spinning Disk ConfocalMicroscopy 419
6.1. Protocol 421
Acknowledgments 421References 421
AbstractThe ability to control the activity of intracellular signaling processes in livecells would be an extraordinarily powerful tool. Ideally, such an intracellularinput would be (i) genetically encoded, (ii) able to be turned on and off in definedtemporal or spatial patterns, (iii) fast to switch between on and off states, and (iv)orthogonal to other cellular processes. The light-gated interaction between frag-ments of two plant proteins—termed Phy and PIF—satisfies each of these con-straints. In this system, Phy can be switched between two conformations usingred and infrared light, while PIF only binds one of these states. This chapterdescribes known constraints for designing genetic constructs using Phy and PIFand provides protocols for expressing these constructs in mammalian cells,
Methods in Enzymology, Volume 497 # 2011 Elsevier Inc.ISSN 0076-6879, DOI: 10.1016/B978-0-12-385075-1.00017-2 All rights reserved.
* Cardiovascular Research Institute and Department of Biochemistry, University of California San Francisco,San Francisco, California
{ Department of Cellular and Molecular Pharmacology, University of California San Francisco, San Francisco,California
{ Howard Hughes Medical Institute, University of California San Francisco, San Francisco, California
409
purifying the small molecule chromophore required for the system’s light respon-sivity, and measuring light-gated binding by microscopy.
1. Introduction
In recent years, tremendous strides have been made in developingquantitative readouts that report on live cell activity at the molecular scale.Time-lapse microscopy has been combined with fluorescent detection ofprotein concentration (Heim and Tsien, 1996; Michalet et al., 2005) andprotein–protein association (Truong and Ikura, 2001), enabling studies ofthe temporal dynamics (Lahav et al., 2004; Nelson et al., 2004) and spatialorganization (Ilani et al., 2009) of complex signaling pathways. Thesetechniques have also been instrumental in characterizing complex emergentproperties such as perfect adaptation (Cohen-Saidon et al., 2009; Shimizuet al., 2010). All of these advances rely on the ability to quantitativelymeasure signaling outputs—the concentration or activity of various pathwaycomponents—with precision in living cells.
The ability to quantitatively vary intracellular signaling inputs in timeand space, in a user controlled way, would be equally revolutionary,allowing researchers to better manipulate and probe the cellular processesthey study. However, comparatively few technologies are available toachieve the goal of manipulation as compared to measurement in livingcells. Microfluidic devices are limited to controlling the spatial and temporalpattern of extracellular inputs (Paliwal et al., 2007; Tay et al., 2010).For intracellular inputs, the rapamycin-inducible FRB/FKBPprotein–proteininteraction (Spencer et al., 1993) offers the opportunity to activate the associa-tion of two intracellular species.However, this high-affinity interaction is slowto dissociate, and thus the resulting control is poorly reversible (Terrillon andBouvier, 2004). More recently, inputs have been designed that utilize light-induced conformational changes in naturally light-responsive proteins such aschannelrhodopsin (Gunaydin et al., 2010) LOV domains (Strickland et al.,2008), or proteins incorporating photocaged amino acids (Gautier et al., 2010;Lemke et al., 2007), although each has limitations. Applying light-activatableLOV domains to control additional signaling processes requires considerableprotein engineering, and LOV domain inactivation occurs spontaneously butcannot be directly controlled by light. Uncaging of photocaged proteins canbe performed quickly and selectively, but is an irreversible modification.Finally, light control of channelrhodopsin is fast and reversible but limited tocontrolling transmembrane cation flux, a specific signaling currency.
Ideally, a controllable intracellular signaling input would be geneticallyencoded (easily “wired in” to control a variety of proteins), photoreversible,nontoxic to the cell, and high resolution in both time and space. A recently
410 Jared E. Toettcher et al.
developed light-dependent binding interaction using plant phytochromeproteins satisfies each of these constraints (Levskaya et al., 2009; Ni et al.,1999). This interaction has already proven useful for applying complextemporal and spatial intracellular inputs to live cells in a variety of species(Levskaya et al., 2009; Shimizu-Sato et al., 2002). In principle, this approachcould be used for spatiotemporal control over any cellular process that isdependent on association of two proteins. Because induced protein inter-action is such a common mechanism for controlling molecular activity, thismethod has the potential to be highly generalizable.
Despite these advantages, it can be challenging to prepare light-gatedgenetic constructs, purify the small molecule chromophore required fortheir function, and assay the function of all these components inside livingcells. In this chapter, we address these challenges by presenting a detailedand optimized methodology based on that introduced in Levskaya et al.(2009) for visualizing light-induced binding in mammalian cells. After abrief introduction to the system (Section 2) we present methods for geneti-cally encoding the light-responsive protein domains (Section 3), purifyingthe small-molecule chromophore that is required for their interaction(Section 4), and validating the light-mediated protein translocation inmammalian cells (Sections 5 and 6).
2. Light-Controlled Phy–PIF Interaction
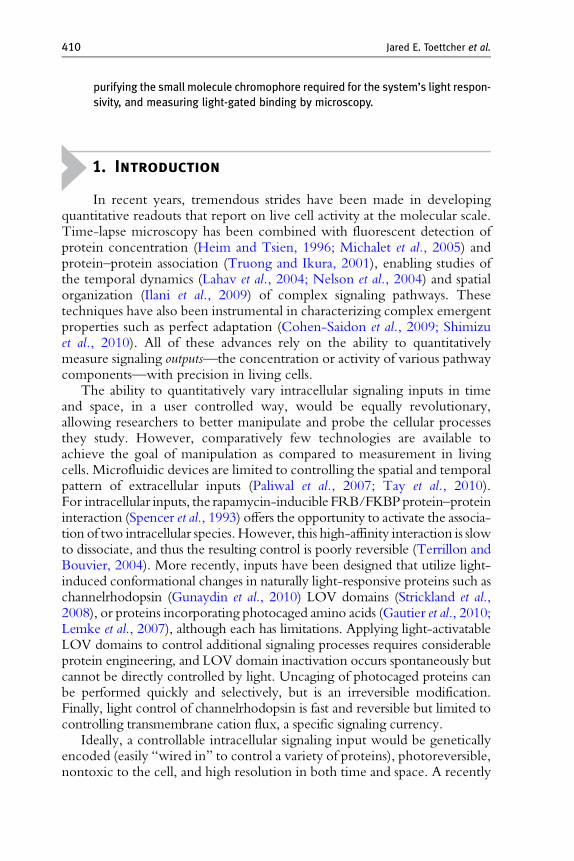
The Phy–PIF system takes advantage of a light-controllable bindinginteraction between two genetically encoded components: a fragment ofArabidopsis thaliana phytochrome B, referred to here as Phy; and a fragmentof phytochrome interaction factor 6, referred to here as PIF. Phy becomeslight-responsive following conjugation to the membrane-permeable smallmolecule chromophore, phycocyanobilin (PCB). Exposure to 650 nminduces association of PIF and Phy, while exposure to 750 nm light inducesdissociation of PIF from Phy (Fig. 17.1A). Phy can be reversibly switchedbetween PIF-interacting and -noninteracting states using light withinseconds, and switching can be performed for hundreds of cycles withouttoxicity to the cell or any measurable degradation of the system’s performance(Levskaya et al., 2009).
How can this system be used to enable light control of a range of cellularactivities? Because protein association and dissociation is such a generalcurrency of cell signaling, this light-gated heterodimerization scheme hasbeen applied to a broad range of signaling processes such as transcription,splicing, plasma membrane signaling, and modulating actin assembly in vitro(Leung et al., 2008). It was first used outside of its native context in atwo-hybrid approach, in which the split DNA binding and transcriptional
Light Control of Plasma Membrane Recruitment Using the Phy–PIF System 411
activation domains of Gal4 were fused to Phy and PIF to enable light-gatedtranscriptional control in yeast (Shimizu-Sato et al., 2002). A similar conceptusing a split protein (intein) was used to activate splicing in yeast using light(Tyszkiewicz and Muir, 2008). The first application of this system tomammalian cell signaling used Phy and PIF to activate GTPase signalingin mouse fibroblasts by recruiting a constitutively active GEF to its Gprotein target on the plasma membrane (Levskaya et al., 2009). In thischapter, we focus on a simple, direct assay of light-controllable Phy–PIFbinding, in which a fluorescently tagged Phy directed to the plasma mem-brane where it can act as a light-controlled binding site for cytoplasmicfluorescently tagged PIF. To observe this localization change, we will focuson a typical experimental context for using the Phy–PIF system, in whichPhy and PIF constructs are introduced into mammalian cells by retroviralinfection and imaged by fluorescence microscopy.
3. Genetic Constructs Encoding Phy andPIF Components
The Phy and PIF components of the light system can be expressed asfusions to other proteins of interest to elicit binding and activation of a varietyof intracellular signaling processes. However, care must be taken to validatePhy and PIF expression and localization for each fusion construct. In this
PhyB
PCB
PIF
650nm
750nm
A
PAS
GAF PHY
Cph1 phytochromephotosensory core
B
Figure 17.1 Schematic of the Phy–PIF interaction. (A) After incorporation of thechromophore PCB, the conformation of Phy can be controlled by exposure to twowavelengths of light (650 and 750 nm). The PIF domain binds only one of thesedomains with high affinity. By controlling the ratio of 650:750 nm light, the fractionof Phy in a state permissive for binding can be tuned, modulating the total amount ofPIF recruitment. (B) Crystal structure of a fragment of the cyanobacterial phytochromeprotein Cph1 bound to the small molecule chromophore PCB (shown as licorice) (PDBID: 2VEA) (Essen et al., 2008). The PAS, GAF, and PHY domains, each required forPhy–PIF interaction, are shown in purple, orange, and red, respectively, while the Nterminal 26 amino acids are shown in green.
412 Jared E. Toettcher et al.
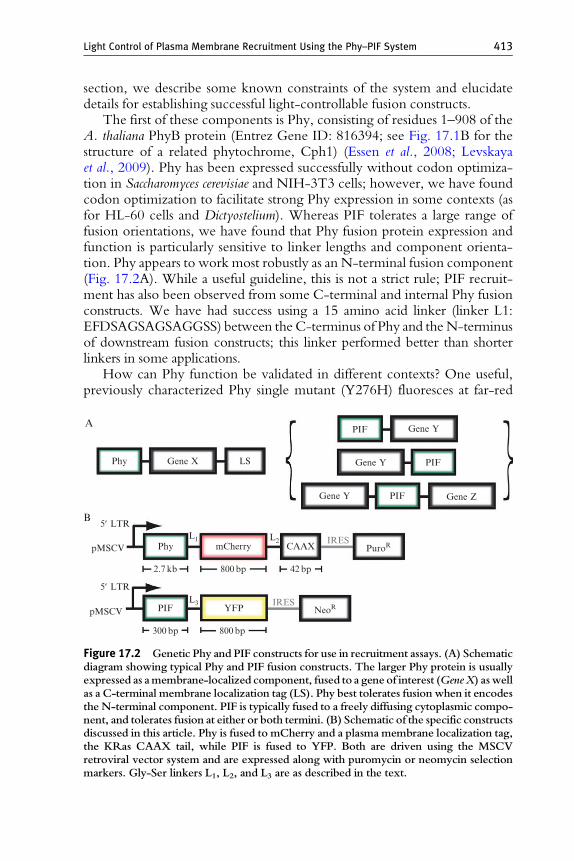
section, we describe some known constraints of the system and elucidatedetails for establishing successful light-controllable fusion constructs.
The first of these components is Phy, consisting of residues 1–908 of theA. thaliana PhyB protein (Entrez Gene ID: 816394; see Fig. 17.1B for thestructure of a related phytochrome, Cph1) (Essen et al., 2008; Levskayaet al., 2009). Phy has been expressed successfully without codon optimiza-tion in Saccharomyces cerevisiae and NIH-3T3 cells; however, we have foundcodon optimization to facilitate strong Phy expression in some contexts (asfor HL-60 cells and Dictyostelium). Whereas PIF tolerates a large range offusion orientations, we have found that Phy fusion protein expression andfunction is particularly sensitive to linker lengths and component orienta-tion. Phy appears to work most robustly as an N-terminal fusion component(Fig. 17.2A). While a useful guideline, this is not a strict rule; PIF recruit-ment has also been observed from some C-terminal and internal Phy fusionconstructs. We have had success using a 15 amino acid linker (linker L1:EFDSAGSAGSAGGSS) between the C-terminus of Phy and theN-terminusof downstream fusion constructs; this linker performed better than shorterlinkers in some applications.
How can Phy function be validated in different contexts? One useful,previously characterized Phy single mutant (Y276H) fluoresces at far-red
LSPhy
PIF
PIFGene Y
PIFGene Y
Gene Y
Gene Z
Gene X
IRES
mCherry CAAXL2
L1
L3
IRESPuroR
NeoR
Phy
2.7 kb 800bp 42bp
PIFpMSCV YFP
pMSCV
5¢ LTR
800bp300bp
A
B5¢ LTR
Figure 17.2 Genetic Phy and PIF constructs for use in recruitment assays. (A) Schematicdiagram showing typical Phy and PIF fusion constructs. The larger Phy protein is usuallyexpressed as amembrane-localized component, fused to a geneof interest (GeneX) aswellas a C-terminal membrane localization tag (LS). Phy best tolerates fusion when it encodesthe N-terminal component. PIF is typically fused to a freely diffusing cytoplasmic compo-nent, and tolerates fusion at either or both termini. (B) Schematic of the specific constructsdiscussed in this article. Phy is fused to mCherry and a plasma membrane localization tag,the KRas CAAX tail, while PIF is fused to YFP. Both are driven using the MSCVretroviral vector system and are expressed along with puromycin or neomycin selectionmarkers. Gly-Ser linkers L1, L2, and L3 are as described in the text.
Light Control of Plasma Membrane Recruitment Using the Phy–PIF System 413
frequencies only in the chromophore-bound state (Su and Lagarias, 2007).We previously demonstrated that NIH-3T3 cells expressing this mutantexhibit bright fluorescence after 30 min of incubation with PCB (Levskayaet al., 2009). Thus, the ability of a Phy fusion construct to bind PCB can betested directly, independently of the recruitment assay described inSection 6. Phy-Y276H can also be used to test the quality of purifiedPCB (Section 4).
Phy interacts in a light-dependent fashion with PIF, a second compo-nent consisting of residues 1–100 of A. thaliana PIF6 protein. PIF does notexhibit any preference toward N or C terminal fusions and also toleratesfusions on both termini simultaneously (Fig. 17.2A). We have not observedany dependence of PIF–Phy binding on linker length within PIF fusionconstructs. Typically, Gly-Ser spacers of 10 amino acids are placed betweenPIF and its fusion partners.
When using the Phy–PIF system to induce binding between membrane-tethered and cytoplasmic proteins, we typically attach Phy to the membranecomponent and PIF to the cytoplasmic component (Fig. 17.2A), as thesmaller PIF domain is less likely to significantly affect diffusion of its fusionpartner. Phy can be tethered to the plasma membrane using a linkerfollowed by the KRas “CAAX tail” plasma membrane localization signal(linker L2: SAGSAGKASG; CAAX tag: KKKKKKSKTKCVIM). This taghas been validated in both yeast and mammalian cells (Clarke et al., 1988).Although this CAAX sequence can be used to induce robust membranelocalization in NIH-3T3 cells, phosphorylation at its serine residue by PKCcauses dissociation from the membrane in some cell types (Bivona et al.,2006); incorporating a Ser-Ala mutation (unphosphorylatable CAAX tag:KKKKKKAKTKCVIM) can be used to stabilize membrane association inthese contexts.
We have demonstrated light-controlled Phy–PIF interaction in a num-ber cell lines, and NIH-3T3 cells (ATCC catalog number CRL-1658)continue to be our gold standard for these studies. Transient transfectionof fluorescently tagged Phy and PIF constructs works for some applications,but we find that generating stable cell lines from retroviral constructs greatlyenriches the population of cells expressing both Phy and PIF and alsofacilitates robust recruitment. Furthermore, these stable cell lines maintainexpression in long-term culture and thus cells can be sorted by expressionlevel to hone in on the optimal recruiting population for each application.
To establish stable cell lines, we typically clone Phy and PIF constructsinto the pMSCV retroviral vector system (Clontech catalogue number634401), in which each construct is driven from the viral LTR promoter.These constructs also contain an internal ribosomal entry site (IRES),followed by neomycin/G418 or puromycin antibiotic resistance to allowselection for the stably infected population (Fig. 17.2B). To produce virus,we transfect each construct into 293-GPG cells, a standard retrovirus
414 Jared E. Toettcher et al.
packaging cell line (Ory et al., 1996) using the TransIT 293 transfection kit(Mirus catalog number 2700). NIH-3T3 cells should be sequentiallyinfected with Phy and PIF viral constructs at a high enough multiplicityof infection (MOI) to lead to>70% infected cells. There is no need to selectusing antibiotics before assaying recruitment, although this selection can beperformed to enrich for doubly infected cells.
Phy–PIF recruitment is easiest to observe if Phy expression levels arehigh (see Section 6). For more effective viral transduction, it can be helpfulto concentrate Phy-containing retrovirus (Kanbe and Zhang, 2004).Briefly, the collected retrovirus is spun at max speed in 1.5 mL centrifugetubes in a table top microcentrifuge (Eppendorf Centrifuge model 5415Dor similar) at 4 !C for 1 h. After centrifugation, discard all but 100 mL or soof the supernatant, and pool together the “invisible” pellets for infection.
4. Purification of PCB from Spirulina
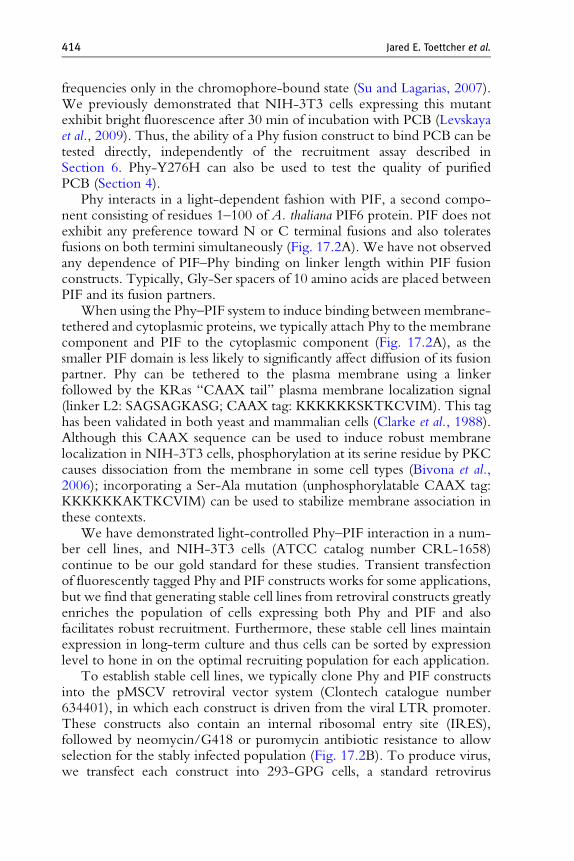
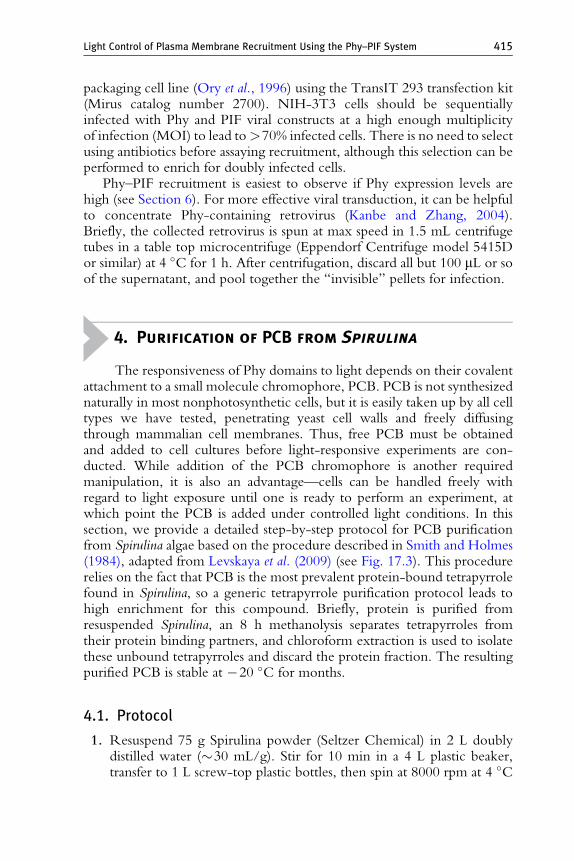
The responsiveness of Phy domains to light depends on their covalentattachment to a small molecule chromophore, PCB. PCB is not synthesizednaturally in most nonphotosynthetic cells, but it is easily taken up by all celltypes we have tested, penetrating yeast cell walls and freely diffusingthrough mammalian cell membranes. Thus, free PCB must be obtainedand added to cell cultures before light-responsive experiments are con-ducted. While addition of the PCB chromophore is another requiredmanipulation, it is also an advantage—cells can be handled freely withregard to light exposure until one is ready to perform an experiment, atwhich point the PCB is added under controlled light conditions. In thissection, we provide a detailed step-by-step protocol for PCB purificationfrom Spirulina algae based on the procedure described in Smith and Holmes(1984), adapted from Levskaya et al. (2009) (see Fig. 17.3). This procedurerelies on the fact that PCB is the most prevalent protein-bound tetrapyrrolefound in Spirulina, so a generic tetrapyrrole purification protocol leads tohigh enrichment for this compound. Briefly, protein is purified fromresuspended Spirulina, an 8 h methanolysis separates tetrapyrroles fromtheir protein binding partners, and chloroform extraction is used to isolatethese unbound tetrapyrroles and discard the protein fraction. The resultingpurified PCB is stable at "20 !C for months.
4.1. Protocol
1. Resuspend 75 g Spirulina powder (Seltzer Chemical) in 2 L doublydistilled water (#30 mL/g). Stir for 10 min in a 4 L plastic beaker,transfer to 1 L screw-top plastic bottles, then spin at 8000 rpm at 4 !C
Light Control of Plasma Membrane Recruitment Using the Phy–PIF System 415
for 1 h (we use a Sorvall RC5C Plus centrifuge with a FiberliteF9S-4x1000y rotor).
2. Collect the supernatant, discarding the dark green pellet. Precipitatesoluble protein from the supernatant by adding 20 g TCA (finalsolution: 1%, w/v, TCA). Wrap the beaker in foil to protect fromlight and stir solution at 4 !C for 1 h. Centrifuge in 1 L screw-topplastic bottles at 3000 rpm for 10 min (Sorvall RC5C Plus centrifuge;Fiberlite F9S-4x1000y rotor).
A
1 2 3 4 5 6 7 8
B
C
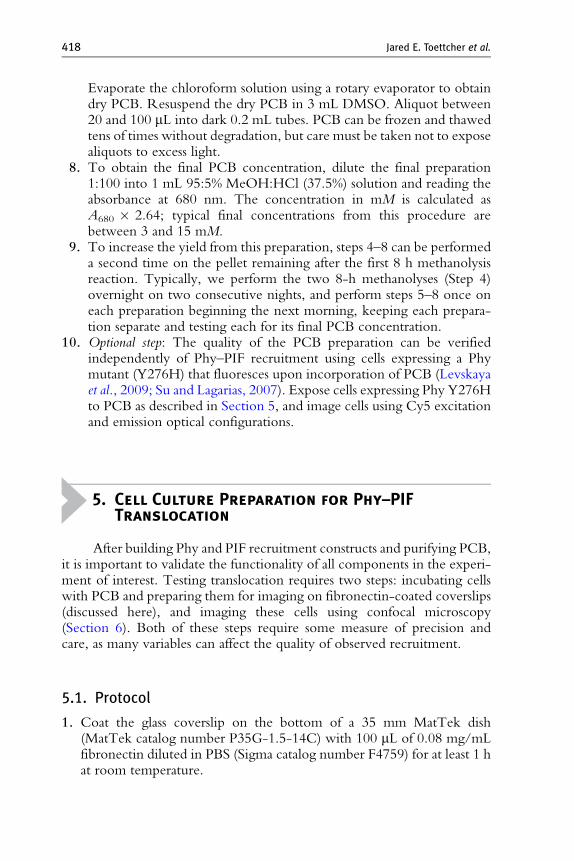
Figure 17.3 Key steps involved in the purification of PCB. (A) Samples collected atdifferent stages of the PCB preparation procedure. Tubes contain the Spirulina-watermixture (1); the green supernatant after the first spin (2); the TCA protein precipitation,containing supernatant and pellet (3); the supernatant after each of three methanolwashes (4–6); and the supernatant after the first and second 8 h methanolysis (7–8). (B)The assembled methanol reflux apparatus. The two thermometers should be placed inthe vapor and fluid phases of the PCB-containing solution, respectively. Adjust heatinguntil the temperature in both phases is the same, and the methanol solution is at a lowboil. To prevent methanol loss through evaporation, flow cold water through thecondenser (middle column of the apparatus). (C) Chloroform separation of PCBfrom the protein phase, photographed under a green safelight. Separation should resultin a white, cloudy aqueous phase (red arrow) above a dark green chloroform phase(black arrow). If the aqueous phase retains a green color, add hydrochloric aciddropwise to acidify the solution, shake vigorously, and allow separation to occur again.
416 Jared E. Toettcher et al.
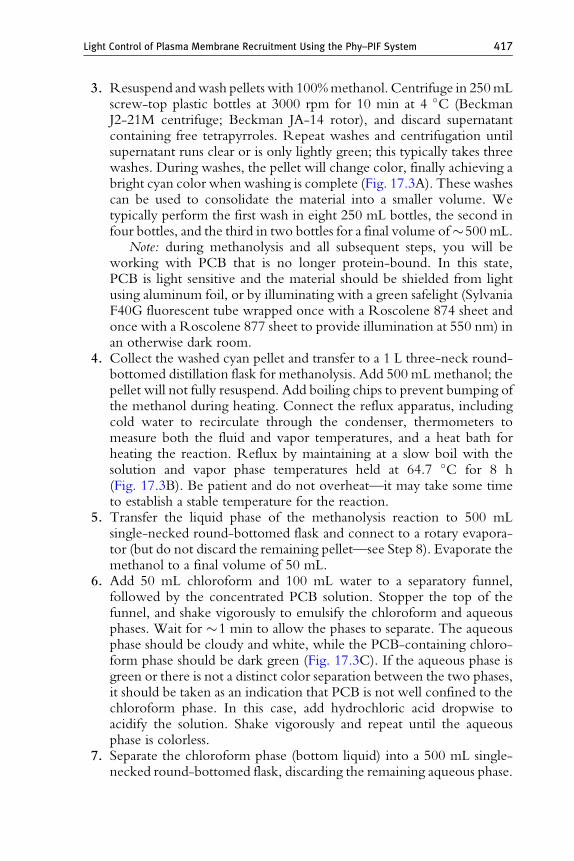
3. Resuspend andwash pellets with 100%methanol. Centrifuge in 250mLscrew-top plastic bottles at 3000 rpm for 10 min at 4 !C (BeckmanJ2-21M centrifuge; Beckman JA-14 rotor), and discard supernatantcontaining free tetrapyrroles. Repeat washes and centrifugation untilsupernatant runs clear or is only lightly green; this typically takes threewashes. During washes, the pellet will change color, finally achieving abright cyan color when washing is complete (Fig. 17.3A). These washescan be used to consolidate the material into a smaller volume. Wetypically perform the first wash in eight 250 mL bottles, the second infour bottles, and the third in two bottles for a final volume of#500 mL.
Note: during methanolysis and all subsequent steps, you will beworking with PCB that is no longer protein-bound. In this state,PCB is light sensitive and the material should be shielded from lightusing aluminum foil, or by illuminating with a green safelight (SylvaniaF40G fluorescent tube wrapped once with a Roscolene 874 sheet andonce with a Roscolene 877 sheet to provide illumination at 550 nm) inan otherwise dark room.
4. Collect the washed cyan pellet and transfer to a 1 L three-neck round-bottomed distillation flask for methanolysis. Add 500 mL methanol; thepellet will not fully resuspend. Add boiling chips to prevent bumping ofthe methanol during heating. Connect the reflux apparatus, includingcold water to recirculate through the condenser, thermometers tomeasure both the fluid and vapor temperatures, and a heat bath forheating the reaction. Reflux by maintaining at a slow boil with thesolution and vapor phase temperatures held at 64.7 !C for 8 h(Fig. 17.3B). Be patient and do not overheat—it may take some timeto establish a stable temperature for the reaction.
5. Transfer the liquid phase of the methanolysis reaction to 500 mLsingle-necked round-bottomed flask and connect to a rotary evapora-tor (but do not discard the remaining pellet—see Step 8). Evaporate themethanol to a final volume of 50 mL.
6. Add 50 mL chloroform and 100 mL water to a separatory funnel,followed by the concentrated PCB solution. Stopper the top of thefunnel, and shake vigorously to emulsify the chloroform and aqueousphases. Wait for #1 min to allow the phases to separate. The aqueousphase should be cloudy and white, while the PCB-containing chloro-form phase should be dark green (Fig. 17.3C). If the aqueous phase isgreen or there is not a distinct color separation between the two phases,it should be taken as an indication that PCB is not well confined to thechloroform phase. In this case, add hydrochloric acid dropwise toacidify the solution. Shake vigorously and repeat until the aqueousphase is colorless.
7. Separate the chloroform phase (bottom liquid) into a 500 mL single-necked round-bottomed flask, discarding the remaining aqueous phase.
Light Control of Plasma Membrane Recruitment Using the Phy–PIF System 417
Evaporate the chloroform solution using a rotary evaporator to obtaindry PCB. Resuspend the dry PCB in 3 mL DMSO. Aliquot between20 and 100 mL into dark 0.2 mL tubes. PCB can be frozen and thawedtens of times without degradation, but care must be taken not to exposealiquots to excess light.
8. To obtain the final PCB concentration, dilute the final preparation1:100 into 1 mL 95:5% MeOH:HCl (37.5%) solution and reading theabsorbance at 680 nm. The concentration in mM is calculated asA680 $ 2.64; typical final concentrations from this procedure arebetween 3 and 15 mM.
9. To increase the yield from this preparation, steps 4–8 can be performeda second time on the pellet remaining after the first 8 h methanolysisreaction. Typically, we perform the two 8-h methanolyses (Step 4)overnight on two consecutive nights, and perform steps 5–8 once oneach preparation beginning the next morning, keeping each prepara-tion separate and testing each for its final PCB concentration.
10. Optional step: The quality of the PCB preparation can be verifiedindependently of Phy–PIF recruitment using cells expressing a Phymutant (Y276H) that fluoresces upon incorporation of PCB (Levskayaet al., 2009; Su and Lagarias, 2007). Expose cells expressing Phy Y276Hto PCB as described in Section 5, and image cells using Cy5 excitationand emission optical configurations.
5. Cell Culture Preparation for Phy–PIFTranslocation
After building Phy and PIF recruitment constructs and purifying PCB,it is important to validate the functionality of all components in the experi-ment of interest. Testing translocation requires two steps: incubating cellswith PCB and preparing them for imaging on fibronectin-coated coverslips(discussed here), and imaging these cells using confocal microscopy(Section 6). Both of these steps require some measure of precision andcare, as many variables can affect the quality of observed recruitment.
5.1. Protocol
1. Coat the glass coverslip on the bottom of a 35 mm MatTek dish(MatTek catalog number P35G-1.5-14C) with 100 mL of 0.08 mg/mLfibronectin diluted in PBS (Sigma catalog number F4759) for at least 1 hat room temperature.
418 Jared E. Toettcher et al.
2. Wash dish twice with 3 mL of Dulbecco’s PBS (D-PBS). Plate cellsimmediately, or store dishes in PBS at 4 !C for no longer than 2 daysprior to use.
3. Trypsinize and count NIH-3T3 cells expressing Phy and PIF constructs(Section 3) from an existing culture (maintained as described by ATCC).Plate 150,000 cells in 2 mL media on the fibronectin-coated MatTekdish. Place dish in incubator for 30 min to allow cells to adhere.
4. Note: this step is light-sensitive and care should be taken to minimizePCB’s exposure to light. Perform under low light conditions or under agreen safelight (see Step 3). In this step, media and PCB are premixedbefore adding to cell culture to ensure that cells are not exposed to highconcentrations of DMSO. Transfer 100 mL media from the MatTek dishto a 1.5 mL tube. Pipet 4 nmol of PCB (about 1 mL of the 4 mM stockfrom Step 3) into the tube, and mix well. Add the PCB–media mixtureback to dish; swirl to mix. Wrap dish in aluminum foil and place inincubator for at least 30min. Plates can bemaintained in PCB-containingmedia for a few hours, so multiple plates can be prepared simultaneouslyand imaged sequentially.
5. Before imaging, exchange the PCB-containing media for an imagingsolution containing 3 mL modified Hank’s balanced salt solution(mHBSS) supplemented with 2% FBS. NIH-3T3 cells should remainhealthy at room temperature without supplemental CO2 for at least 6 hunder these conditions. For prolonged imaging, replace imaging solutionto combat evaporation.
6. Imaging PIF Translocation Using SpinningDisk Confocal Microscopy
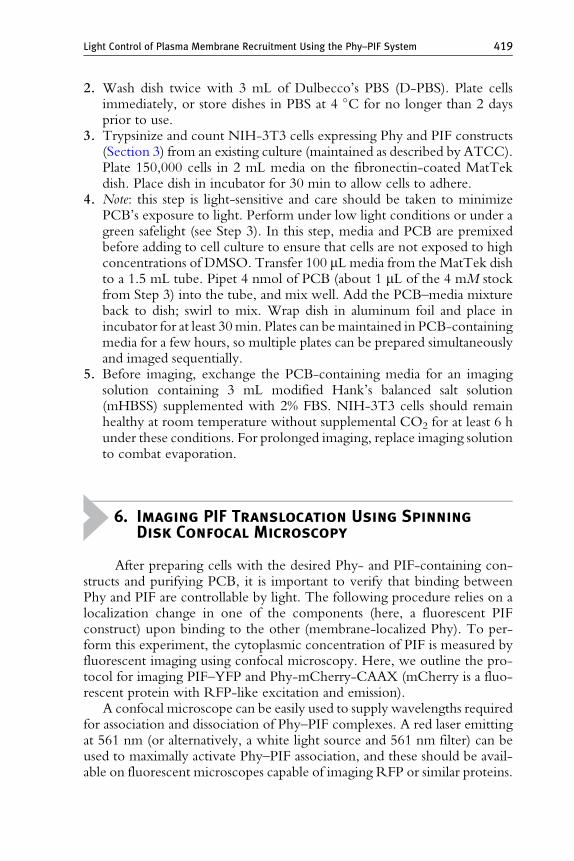
After preparing cells with the desired Phy- and PIF-containing con-structs and purifying PCB, it is important to verify that binding betweenPhy and PIF are controllable by light. The following procedure relies on alocalization change in one of the components (here, a fluorescent PIFconstruct) upon binding to the other (membrane-localized Phy). To per-form this experiment, the cytoplasmic concentration of PIF is measured byfluorescent imaging using confocal microscopy. Here, we outline the pro-tocol for imaging PIF–YFP and Phy-mCherry-CAAX (mCherry is a fluo-rescent protein with RFP-like excitation and emission).
A confocal microscope can be easily used to supply wavelengths requiredfor association and dissociation of Phy–PIF complexes. A red laser emittingat 561 nm (or alternatively, a white light source and 561 nm filter) can beused to maximally activate Phy–PIF association, and these should be avail-able on fluorescent microscopes capable of imaging RFP or similar proteins.
Light Control of Plasma Membrane Recruitment Using the Phy–PIF System 419

However, because the transition to the PIF-binding state is so sensitive,unfiltered brightfield light is sufficient to generate measurable Phy–PIFrecruitment, as described in the protocol below. To elicit Phy–PIF dissoci-ation, place a 750 nm long-pass filter (Newport, model FSQ-RG9) on topof the microscope’s condenser (in the brightfield imaging light path) andturn on brightfield illumination (Fig. 17.4A). It is important to ensure thatno filters are present in the light path that could interfere with infrared lighttransmission. It is possible to use a 750 nm filter in conjunction with otherlight sources (e.g., mercury halide arc lamp; DG4 light source). However,care must be taken to ensure that all optical components are capable oftransmitting infrared light (e.g., mirrors, filters, liquid light guides), and thatno infrared-blocking filters are present in the light path.
A
B
Figure 17.4 Confocal microscopy to image Phy–PIF translocation. (A) A 750 nm filtercan be placed in the brightfield light path to elicit Phy–PIF dissociation. With this filterin place, illuminating with brightfield light leads to Phy–PIF dissociation. Simplyremoving the filter provides enough activating light to induce Phy–PIF translocation.Alternatively, RFP excitation light (650 nm) can be used to induce association.(B) A montage of confocal images of a NIH-3T3 cell showing PIF–YFP translocationin response to light. Cells were prepared harboring the genetic constructs described inSection 3. The upper panel shows PIF–YFP fluorescence after sequential 30 s exposuresof activating (brightfield) and inactivating (750 nm filtered) light. Phy-mCherry levelsin corresponding timepoints are shown in the lower panels.
420 Jared E. Toettcher et al.
Observing high-quality light-dependent recruitment depends stronglyon the expression levels of both Phy and PIF fluorescent fusion proteins.Because this assay relies on observing PIF changing localization fromcytoplasm to cell membrane, there must be enough Phy on the membraneto appreciably deplete cytoplasmic PIF levels during exposure to activatinglight. Thus, it is crucial to select cells with high membrane expression of Phyand low to moderate PIF levels. Cell geometry can also play a crucial role:because small cells have a higher surface area to volume ratio than large cells,smaller cells are further enriched for an excess of Phy molecules comparedto PIF, leading to better PIF depletion upon activation.
6.1. Protocol
1. Select a cell for imaging based on the criteria described above (high Phy-mCherry membrane expression, moderate PIF–YFP expression, andsmall cell volume).
2. For the best contrast between recruitment and release, choose an imag-ing plane in the lower half of the cell, just above the coverslip. Such afocal plane should be close to a large pool of membrane-bound Phy,where PIF cytoplasmic depletion should be maximal. If available, initiatethe microscope’s autofocus system to prevent focal plane drift.
3. Place a 750 nm square filter on top of the microscope condenser, in thebrightfield imaging light path (Fig. 17.4A).
4. Alternate 30 s exposures of brightfield light with and without the750 nm filter. After each 30 s brightfield exposure, take single PIF–YFP translocation images using the confocal microscope’s YFP imagingmode. A typical series of NIH-3T3 cell images showing recruitment bythis technique is shown in Fig. 17.4B.
ACKNOWLEDGMENTS
We thank Anselm Levskaya for advice on PCB purification and light system manipulation.This work was partially supported by the National Institutes of Health grant GM084040, theCancer Research Institute Postdoctoral Fellowship ( J. E. T.), the American Cancer SocietyFellowship (D. G.).
REFERENCES
Bivona, T. G., Quatela, S. E., Bodemann, B. O., Ahearn, I. M., Soskis, M. J., Mor, A.,Miura, J., Wiener, H. H., Wright, L., Saba, S. G., Yim, D., Fein, A., et al. (2006). PKCregulates a farnesyl-electrostatic switch on K-Ras that promotes its association with Bcl-XL on mitochondria and induces apoptosis. Mol. Cell 21, 481–493.
Light Control of Plasma Membrane Recruitment Using the Phy–PIF System 421
Clarke, S., Vogel, J. P., Deschenes, R. J., and Stock, J. (1988). Posttranslational modificationof the Ha-ras oncogene protein: evidence for a third class of protein carboxyl methyl-transferases. Proc. Natl. Acad. Sci. USA 85, 4643–4647.
Cohen-Saidon, C., Cohen, A. A., Sigal, A., Liron, Y., and Alon, U. (2009). Dynamics andVariability of ERK2 Response to EGF in Individual Living Cells.Mol. Cell 36, 885–893.
Essen, L. O., Mailliet, J., and Hughes, J. (2008). The structure of a complete phytochromesensory module in the Pr ground state. Proc. Natl. Acad. Sci. USA 105, 14709–14714.
Gautier, A., Nguyen, D. P., Lusic, H., An, W., Deiters, A., and Chin, J. W. (2010).Genetically encoded photocontrol of protein localization in mammalian cells. J. Am.Chem. Soc. 132, 4086–4088.
Gunaydin, L. A., Yizhar, O., Berndt, A., Sohal, V. S., Deisseroth, K., and Hegemann, P.(2010). Ultrafast optogenetic control. Nat. Neurosci. 13, 387–392.
Heim, R., and Tsien, R. Y. (1996). Engineering green fluorescent protein for improvedbrightness, longer wavelengths and fluorescence resonance energy transfer. Curr. Biol. 6,178–182.
Ilani, T., Vasiliver-Shamis, G., Vardhana, S., Bretscher, A., and Dustin, M. L. (2009). T cellantigen receptor signaling and immunological synapse stability require myosin IIA. Nat.Immunol. 10, 531–539.
Kanbe, E., and Zhang, D. E. (2004). A simple and quick method to concentrate MSCVretrovirus. Blood Cells Mol. Dis. 33, 64–67.
Lahav, G., Rosenfeld, N., Sigal, A., Geva-Zatorsky, N., Levine, A. J., Elowitz, M. B., andAlon, U. (2004). Dynamics of the p53-Mdm2 feedback loop in individual cells. Nat.Genet. 36, 147–150.
Lemke, E. A., Summerer, D., Geierstanger, B. H., Brittain, S. M., and Schultz, P. G. (2007).Control of protein phosphorylation with a genetically encoded photocaged amino acid.Nat. Chem. Biol. 3, 769–772.
Leung, D. W., Otomo, C., Chory, J., and Rosen, M. K. (2008). Genetically encodedphotoswitching of actin assembly through the Cdc42-WASP-Arp2/3 complex pathway.Proc. Natl. Acad. Sci. USA 105(2008), 12797–12802.
Levskaya, A., Weiner, O. D., Lim, W. A., and Voigt, C. A. (2009). Spatiotemporal controlof cell signalling using a light-switchable protein interaction. Nature 461, 997–1001.
Michalet, X., Pinaud, F. F., Bentolila, L. A., Tsay, J. M., Doose, S., Li, J. J., Sundaresan, G.,Wu, A. M., Gambhir, S. S., and Weiss, S. (2005). Quantum dots for live cells, in vivoimaging, and diagnostics. Science 307, 538–544.
Nelson, D. E., Ihekwaba, A. E., Elliott, M., Johnson, J. R., Gibney, C. A., Foreman, B. E.,Nelson, G., See, V., Horton, C. A., Spiller, D. G., Edwards, S. W., McDowell, H. P.,et al. (2004). Oscillations in NF-kappaB signaling control the dynamics of gene expres-sion. Science 306, 704–708.
Ni, M., Tepperman, J. M., and Quail, P. H. (1999). Binding of phytochrome B to its nuclearsignalling partner PIF3 is reversibly induced by light. Nature 400, 781–784.
Ory, D. S., Neugeboren, B. A., and Mulligan, R. C. (1996). A stable human-derivedpackaging cell line for production of high titer retrovirus/vesicular stomatitis virus Gpseudotypes. Proc. Natl. Acad. Sci. USA 93, 11400–11406.
Paliwal, S., Iglesias, P. A., Campbell, K., Hilioti, Z., Groisman, A., and Levchenko, A.(2007). MAPK-mediated bimodal gene expression and adaptive gradient sensing in yeast.Nature 446, 46–51.
Shimizu, T. S., Tu, Y., and Berg, H. C. (2010). A modular gradient-sensing network forchemotaxis in Escherichia coli revealed by responses to time-varying stimuli. MolecularSyst. Biol. 6(382), 1–14.
Shimizu-Sato, S., Huq, E., Tepperman, J. M., and Quail, P. H. (2002). A light-switchablegene promoter system. Nat. Biotech. 20, 1041–1044.
422 Jared E. Toettcher et al.
Smith, H., and Holmes, M. G. (1984). Techniques in Photomorphogenesis. Academic Press,Orlando, FL.
Spencer, D. M., Wandless, T. J., Schreiber, S. L., and Crabtree, G. R. (1993). Controllingsignal transduction with synthetic ligands. Science 262, 1019–1024.
Strickland, D., Moffat, K., and Sosnick, T. R. (2008). Light-activated DNA binding in adesigned allosteric protein. Proc. Natl. Acad. Sci. USA 105, 10709–10714.
Su, Y. S., and Lagarias, J. C. (2007). Light-independent phytochrome signaling mediated bydominant GAF domain tyrosine mutants of Arabidopsis phytochromes in transgenicplants. Plant Cell 19, 2124–2139.
Tay, S., Hughey, J. J., Lee, T. K., Lipniacki, T., Quake, S. R., and Covert, M. W. (2010).Single-cell NF-kappaB dynamics reveal digital activation and analogue informationprocessing. Nature 466, 267–271.
Terrillon, S., and Bouvier, M. (2004). Receptor activity-independent recruitment ofbetaarrestin2 reveals specific signalling modes. EMBO J. 23, 3950–3961.
Truong, K., and Ikura, M. (2001). The use of FRET imaging microscopy to detect protein-protein interactions and protein conformational changes in vivo. Curr. Opin. Struct. Biol.11, 573–578.
Tyszkiewicz, A. B., and Muir, T. W. (2008). Activation of protein splicing with light inyeast. Nat. Methods 5, 303–305.
Light Control of Plasma Membrane Recruitment Using the Phy–PIF System 423


![Plasma Membrane [7.2] Goals: Understand the concept of homeostasis in relation to the plasma membrane Demonstrate and understand how the plasma membrane](https://img.pdfslide.us/doc/110x75/5697c01d1a28abf838cd0a9a/plasma-membrane-72-goals-understand-the-concept-of-homeostasis-in-relation.jpg)