Embed Size (px)
Citation preview
Light and Posidonia sinuosa seagrass meadows in the temperate coastal waters of Western
Australia
II. Effect of epiphyte species assemblage and biomass on attenuating light to the leaf surface
A contribution to the Southern Metropolitan Coastal Waters Study (1991-1994)
Department of Environmental Protection Perth, Western Australia
Technical Series 62 December 1995
ISBN. 0 7309 5762 4
ISSN. 1030 - 0600
Light and Posidonia sinuosa seagrass meadows in the temperate coastal waters of Western Australia
II. Effect of epiphyte species assemblage and biomass on attenuating light to the leaf surface
J S Burtl, G. A. Kendrick^, R J Masini^, C J Simpson 1
1 Department of Environmental Protection, Perth, Western Australia 6000.
2 CSIRO, Division of Fisheries, Marmion, Western Australia 6020.
Contents
Acknowledgments Abstract 1= Introduction 2. Materials and methods
2.1 Statistical treatment
3. Results 3.1 Epiphyte assemblages
3.2 Epiphyte biomass
3.3 Nutrient regime
3.4 Periphyton biomass-light reduction relationship
4. Discussion 4.1 Epiphyte assemblages
4.2 Epiphyte biomass
4.3 Periphyton biomass-light reduction relationship
4.4 Implications for management
5. References
Page
1
3
5
6
6
7
10 11
13
13
15
16
16 17
Tables
1. Number of macroalgal species on 12 leaves of P. sinuosa during summer and winter, at sites 1 and 2.
2. Percent occurrence of epiphyte taxa on 12 leaves of P. sinuosa during summer and winter, at sites 1 and 2.
3. Mean epiphyte biomass expressed as either chlorophyll a, total dry weight or the organic, carbonate and refractory components, at sites 1 and 2 during the annual, winter and non-winter periods.
Epiphyte biomass expressed as (a) mean with standard errors (in parentheses) and as a percentage of total dry weight, and (b) ranges
4. Summary of correlation analyses (r2) between percent light reduction and log transformed periphyton biomass expressed as either chlorophyll a, total dry weight or the organic, carbonate and refractory components, at sites 1 and 2 during the annual, winter and non-winter periods. All correlations were significant at p < 0.05, except the refractory component during non-winter, at site 1. n = sample size.
11
L
*
Contents Page
5. Comparisons between the slopes of the periphyton biomass-light reduction relationships between sites and, between seasons at each site, were determined by comparing slopes of linear regressions between log transformed periphyton biomass and percent light reduction, over comparable ranges in biomass values. Significance level; * * p < 0.01; NSD = not significantly different. 12
Figures
1. Location map of (a) the study sites and (b) schematic of Success Bank showing the distribution of the seagrass meadow, water depth and sediment type at the two sites. 2
2. Apparatus for (a) measuring light transmission through the periphyton assemblage growing on artificial seagrass leaves and (b) detailed cross section ^ of the water bath and light sensor.
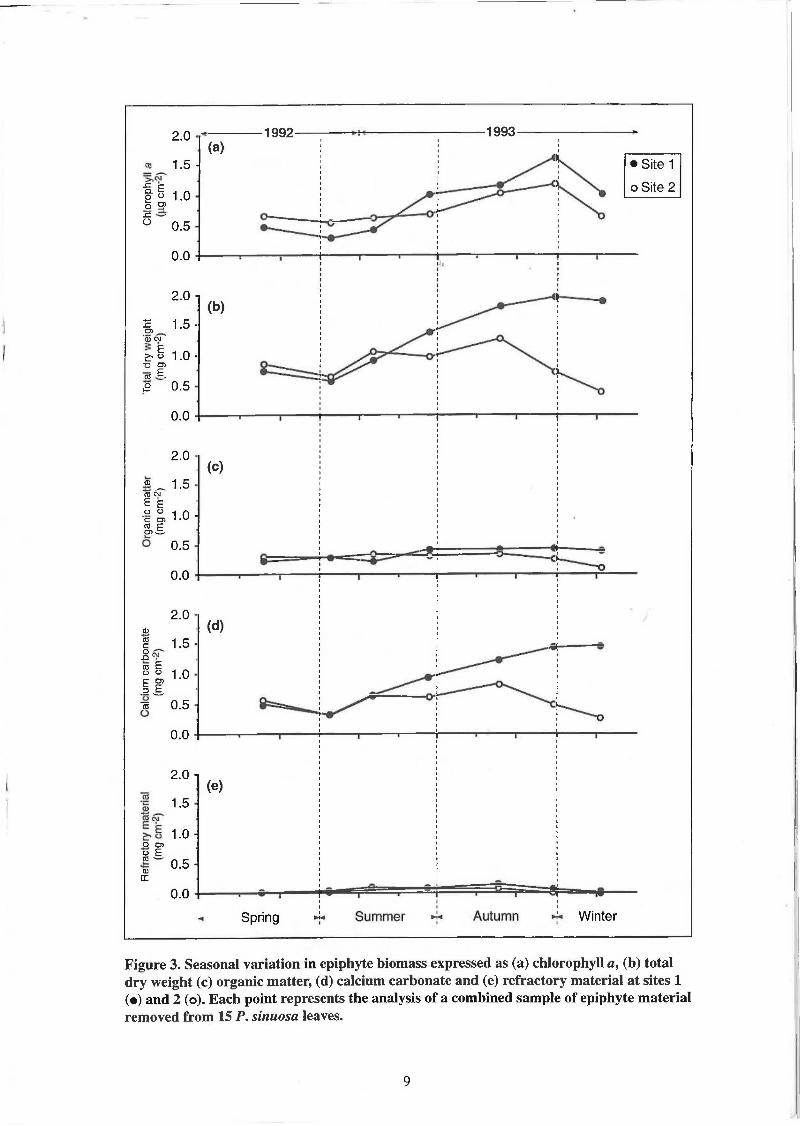
3. Seasonal variation in epiphyte biomass expressed as (a) chlorophyll a, (b) total dry weight, (c) organic matter, (d) calcium carbonate and (e) refractory material at sites 1 (•) and 2 (o). Each point represents the analysis of a combined sample of epiphyte material removed from 15 P. sinuosa leaves.
4. Composite annual cycle of total inorganic nitrogen concentrations in the bottom waters at sites 1 (n = 44) and 2 (n = 46) derived from data collected between jq June 1992 and July 1993.
5. The relationship between periphyton biomass expressed as total dry weight and light reduction, at sites 1 (squares) and 2 (circles) during the winter (shaded) and non-winter (unshaded) periods. For graphical purposes the standard errors have been omitted but were generally less than 10 % (Burt, 1994).
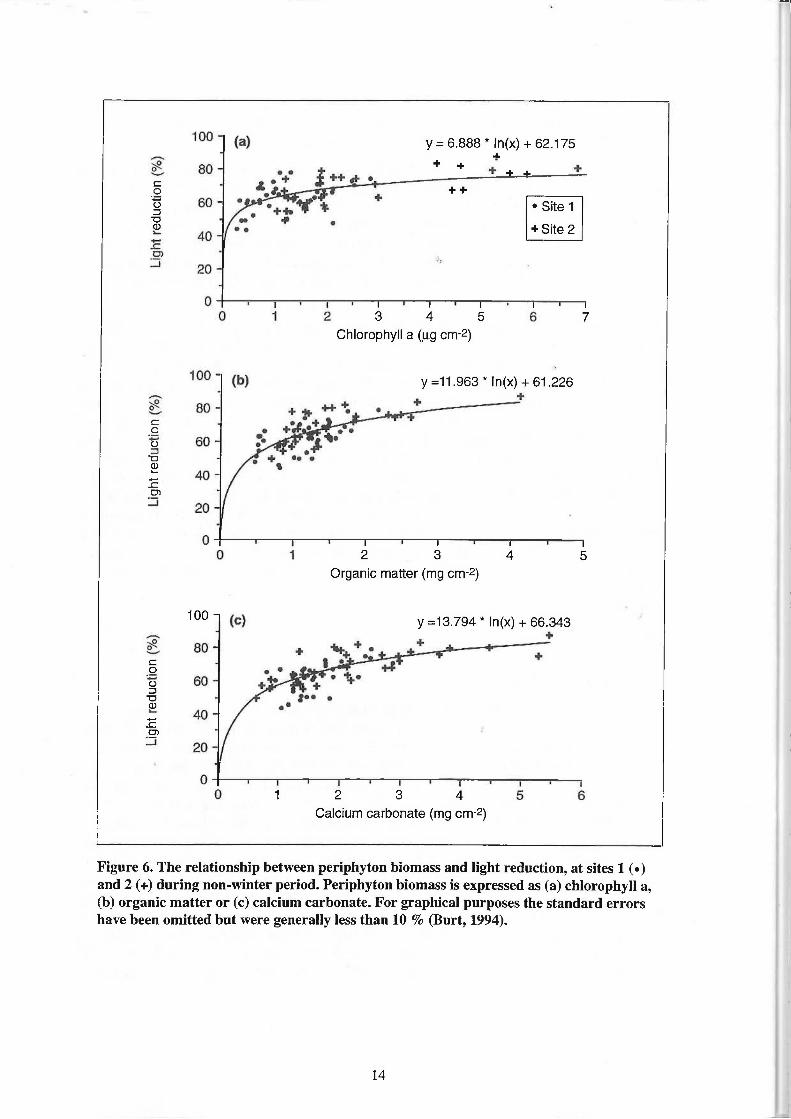
6. The relationship between periphyton biomass and light reduction, at sites 1 (•) and 2 (+) during the non-winter period. Periphyton biomass is expressed as (a) chlorophyll a, (b) organic matter or (c) calcium carbonate. For graphical purposes the standard errors have been omitted but were generally less than 10 % (Burt, 1994). 14
12
Appendices
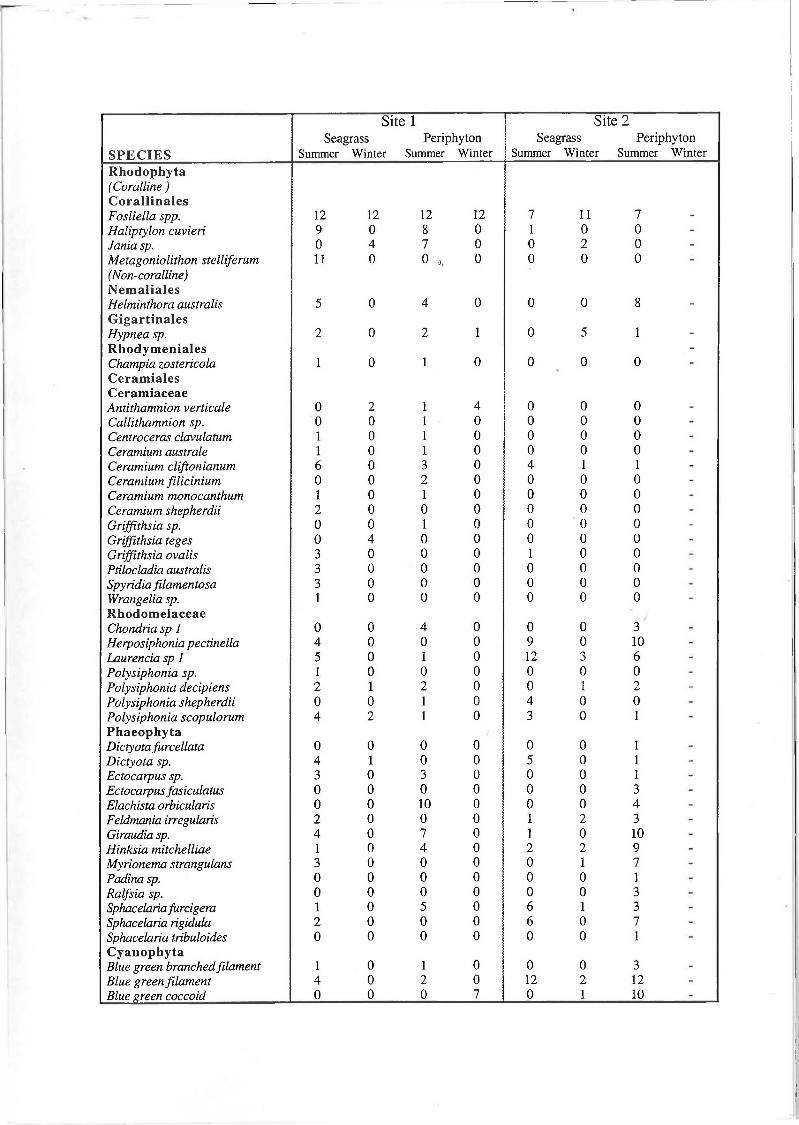
I. Occurrence of macroalgal species on 12 leaves of P. sinuosa and on 12 artificial seagrass leaves (plastic strips), at sites 1 and 2 during summer and winter. Species occurrence on a seagrass leaf or artificial leaf scores 1.
Acknowledgments We thank Jeremy Fitzpatrick (CSIRO, Division of Fisheries, Marmion, WA) for his assistance with the identification of epiphyte/periphyton species; the Nutrient Analysis Laboratory, Murdoch University, for photosynthetic pigment and dry weight analyses; Peter Jolly for the design and construction of the light transmission apparatus and Tim Daly for his invaluable field and laboratory assistance.
Dr Scoresby Shepherd (South Australian Research and Development Institute) and Dr Vic Neverauskas (Primary Industries, South Australia, Fisheries) provided critical comments on the penultimate draft. This assistance is gratefully acknowledged.
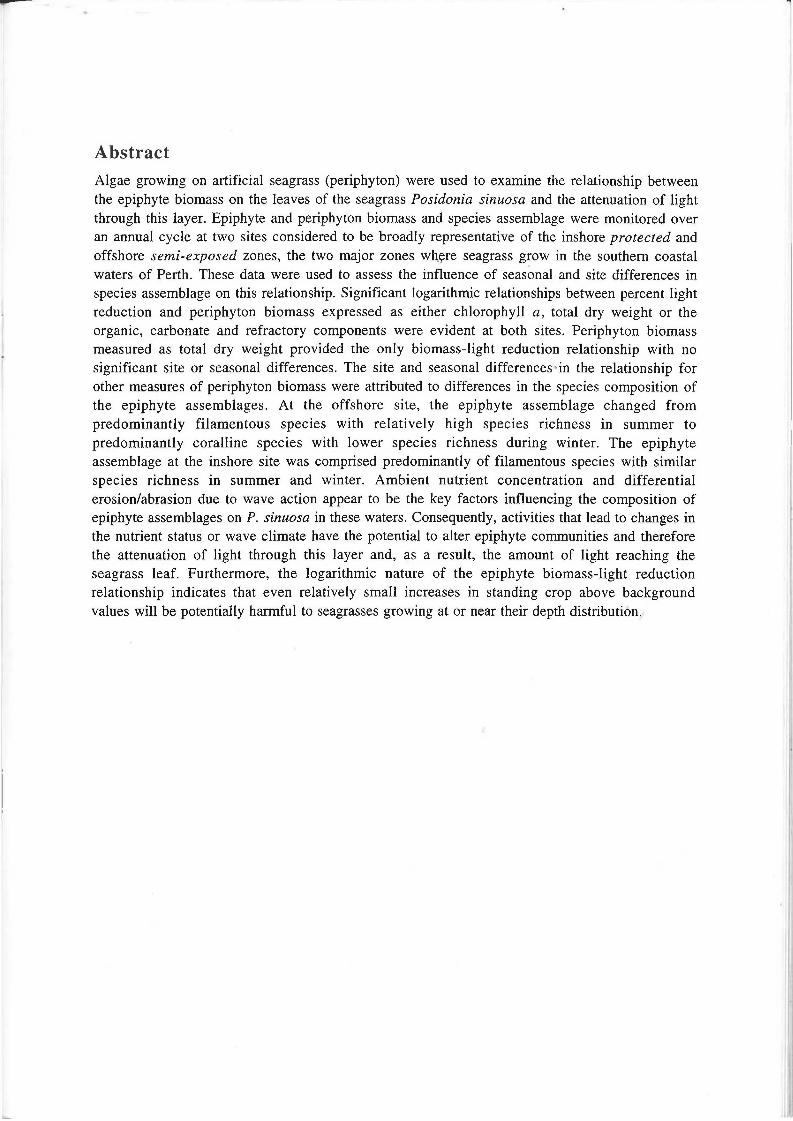
Abstract Algae growing on artificial seagrass (periphyton) were used to examine the relationship between the epiphyte biomass on the leaves of the seagrass Posidonia sinuosa and the attenuation of light through this layer. Epiphyte and periphyton biomass and species assemblage were monitored over an annual cycle at two sites considered to be broadly representative of the inshore protected and offshore semi-exposed zones, the two major zones where seagrass grow in the southern coastal waters of Perth. These data were used to assess the influence of seasonal and site differences in species assemblage on this relationship. Significant logarithmic relationships between percent light reduction and periphyton biomass expressed as either chlorophyll a, total dry weight or the organic, carbonate and refractory components were evident at both sites. Periphyton biomass measured as total dry weight provided the only biomass-light reduction relationship with no significant site or seasonal differences. The site and seasonal differences in the relationship for other measures of periphyton biomass were attributed to differences in the species composition of the epiphyte assemblages. At the offshore site, the epiphyte assemblage changed from predominantly filamentous species with relatively high species richness in summer to predominantly coralline species with lower species richness during winter. The epiphyte assemblage at the inshore site was comprised predominantly of filamentous species with similar species richness in summer and winter. Ambient nutrient concentration and differential erosion/abrasion due to wave action appear to be the key factors influencing the composition of epiphyte assemblages on P. sinuosa in these waters. Consequently, activities that lead to changes in the nutrient status or wave climate have the potential to alter epiphyte communities and therefore the attenuation of light through this layer and, as a result, the amount of light reaching the seagrass leaf. Furthermore, the logarithmic nature of the epiphyte biomass-light reduction relationship indicates that even relatively small increases in standing crop above background values will be potentially harmful to seagrasses growing at or near their depth distribution.
1. Introduction The survival of benthic plants in the marine environment is related to the amount of light reaching their leaves (Dennison, 1987; Carter and Rybicki, 1990; Kenworthy and Haunert, 1991; Chesapeake Bay Programme, 1992) and growth occurs where light levels ensure photosynthetic production exceeds respiratory losses (Dennison and Alberte, 1982; Masini et al., 1995b). Light availability to benthic plants is determined by factors attenuating light through the water column (Chesapeake Bay Programme, 1992; Dennison et al., 1993) and by epiphytic algae attached to the leaf surface (Silberstein et al., 1986; Dennison, 1992).
Spatial and temporal changes in epiphyte assemblages ate influenced by numerous biological and physical factors such as epifaunal grazing (Steneck 1983; Nielsen and Lethbridge 1989; Steneck et al., 1991), the overall algal diversity in an area (Borowitzka and Lethbridge, 1989), the proximity to sources of algal epiphyte propagules (West, 1990), the availability of light (Cambridge et al., 1986) and water temperature (Heijs, 1985). However changes in species composition and biomass of epiphyte assemblages is a typical response to changing nutrient status and, to a lesser extent, wave energy of the waters over benthic plant communities (May et al., 1978; Cambridge, 1979; Harlin and Thorne-Miller, 1981; Cambridge et al., 1986; Hillman et al., 1991). There are numerous instances in Western Australia where nutrient enrichment of coastal waters has led to an excessive growth of epiphytes attached to seagrass leaves, contributing to a decreased in photosynthesis and subsequent decline of the seagrass communities due to light starvation (eg. Cambridge et al., 1986; Hillman, 1986; Simpson and Masini, 1990). The relationship between the epiphyte assemblage and light reduction through this layer is, therefore, important in understanding the effects of nutrient enrichment on seagrass communities.
Seagrasses, particularly the meadow forming Posidonia, are among the most productive and important components of the temperate coastal ecosystems off Western Australia (Kirkman, 1992). The distribution of Posidonia meadows is generally restricted to low energy coastal lagoons and embayments with relatively clear, oligotrophic waters (Clarke and Kirkman, 1989). The relatively poor flushing rates of these areas resulting in longer retention times of nutrients in the water column, coupled with low rates of meadow expansion, make Posidonia seagrasses particularly vulnerable to the effects of nutrient enrichment (Simpson and Masini, 1990). These seagrasses have morphological and physiological adaptations (eg. rhizomes with soluble carbohydrate reserves) to recover from relatively short periods (weeks-months) of light reduction (Gordon et al., 1994). However chronic reductions in available light will affect seagrasses growing at or near their depth limits, especially species such as P. sinuosa that have a low net photosynthesis to respiration ratio (Masini et al., 1995a, b). Extensive meadows of Posidonia seagrasses occur in the protected embayments and lagoons of Perth's southern coastal waters.
The primary objective of this study was to examine the relationship between epiphyte biomass on the leaves of the seagrass Posidonia sinuosa Cambridge & Kuo and light attenuation through this layer. Epiphyte and periphyton biomass and species assemblage were monitored over an annual cycle at two sites considered to be broadly representative of the inshore protected and offshore semi-exposed zones, the two major zones where seagrass grows in the southern coastal waters of Perth. These data were used to assess the influence of seasonal and site differences in species assemblage on the biomass-light reduction relationship. A secondary objective was to quantify the epiphyte biomass-light reduction relationship for input to a nutrient-effects ecological model being developed as part of the Southern Metropolitan Coastal Waters Study (1991-1994), by the Western Australian Department of Environmental Protection, with the aim of developing an understanding of the cumulative environmental impacts of waste discharges to Perth's coastal waters (Simpson et al., 1993). Companion studies were also conducted at these sites and examined the physical and biological processes that influence water column light attenuation (Burt et al., 1995a) and quantified the minimum light requirements of P. sinuosa (Masini et al., 1995a).
L
Sparsely vegetated, course sandy slope
20 m 14 m
T 2 - 4 m
Seagrass meadow, predominantly Posidonia sinuosa
15m
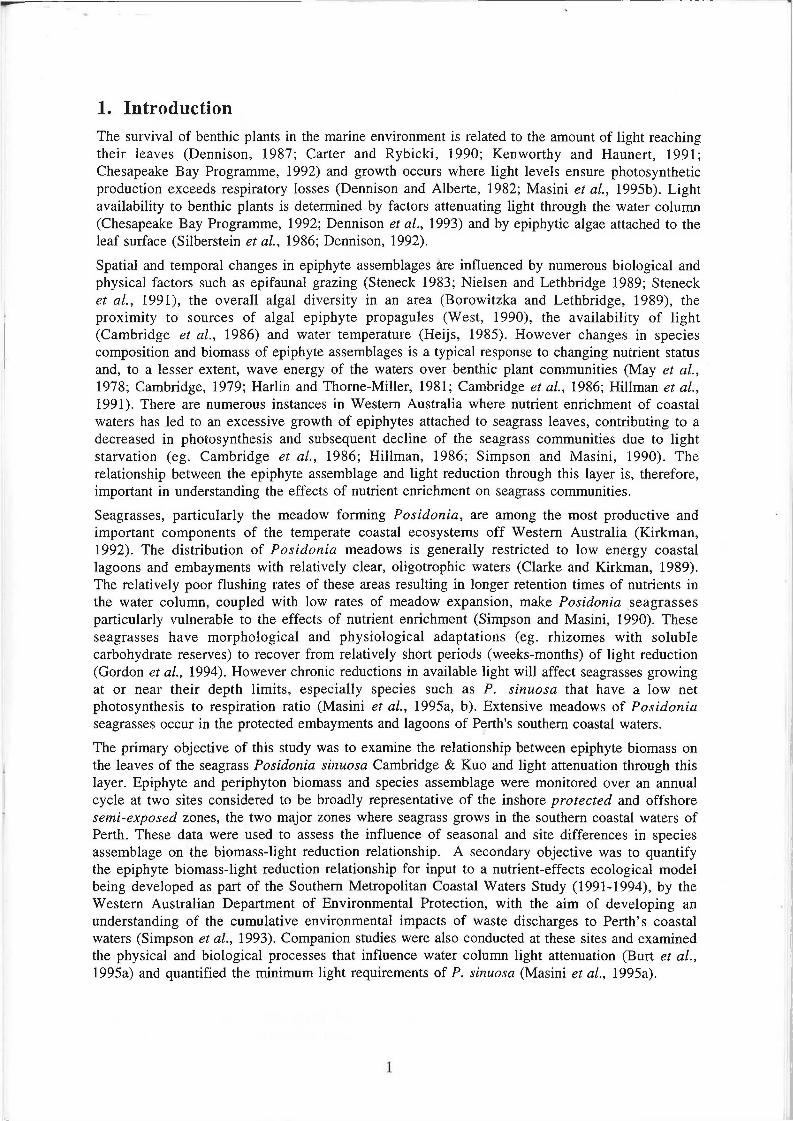
Figure 1. Location map of (a) the study sites and (b) schematic of Success Bank showing the vertical distribution of the seagrass meadow, water depth and sediment type at the two sites.
2
2. Methods
The study was conducted at two sites on the slopes of Success Bank, a shallow (< 5 m depth) sill located between the Owen Anchorage basin (~ 12 m depth) to the south and Gage Roads (~ 20 m depth) to the north (Fig. la). Much of Success Bank is covered with seagrass meadows dominated by Posidonia species (LeProvost Environmental Consultants, 1991). Posidonia sinuosa dominates the meadows on the slopes of the Bank in the vicinity of the study sites. Site 1 is located in 15 m water depth on the relatively exposed north-west side of Success Bank and is considered to be representative of the offshore semi-exposed zone. By contrast site 2, which is situated in 12 m water depth on the south-east side of Success Bank, is relatively sheltered from ocean swells by Success Bank to the north and a chain of reefs and islands to the west and south-west. This site is considered to be representative of the inshore protected zone. Both sites were located at the local depth limit of a P. sinuosa meadow (Fig. lb).
The design of the artificial seagrass leaves used in this study was based on the morphometries and mean shoot densities of P. sinuosa growing at both sites in June 1992. To mimic the relatively long primary and shorter secondary leaves of P. sinuosa, 5 mm wide strips of polyurethane plastic (0.9 mm thick) were cut to lengths of 280 mm and 130 mm for site 1 and 380 mm and 200 mm for site 2 and stapled together to form an artificial seagrass shoot. Shoots were stapled to square's (25 cm x 25 cm) of plastic coated steel mesh, termed periphyton collectors, at densities of 256 m-2 and 184 m~2 for sites 1 and 2 respectively.
Four periphyton collectors were deployed at both sites on six occasions at intervals of 30 to 40 days between August 1992 and June 1993. The collectors were left in-situ for approximately 80 days, the estimated mean age of P. sinuosa leaves (Hugh Kirkman, personal communication). Divers deployed the collectors within the seagrass meadow by pegging the base of the collectors to the seabed. The collectors were retrieved in separate plastic bags to minimise abrasion of the periphyton material, refrigerated, and light transmission determined within 24 hours of retrieval from the field.
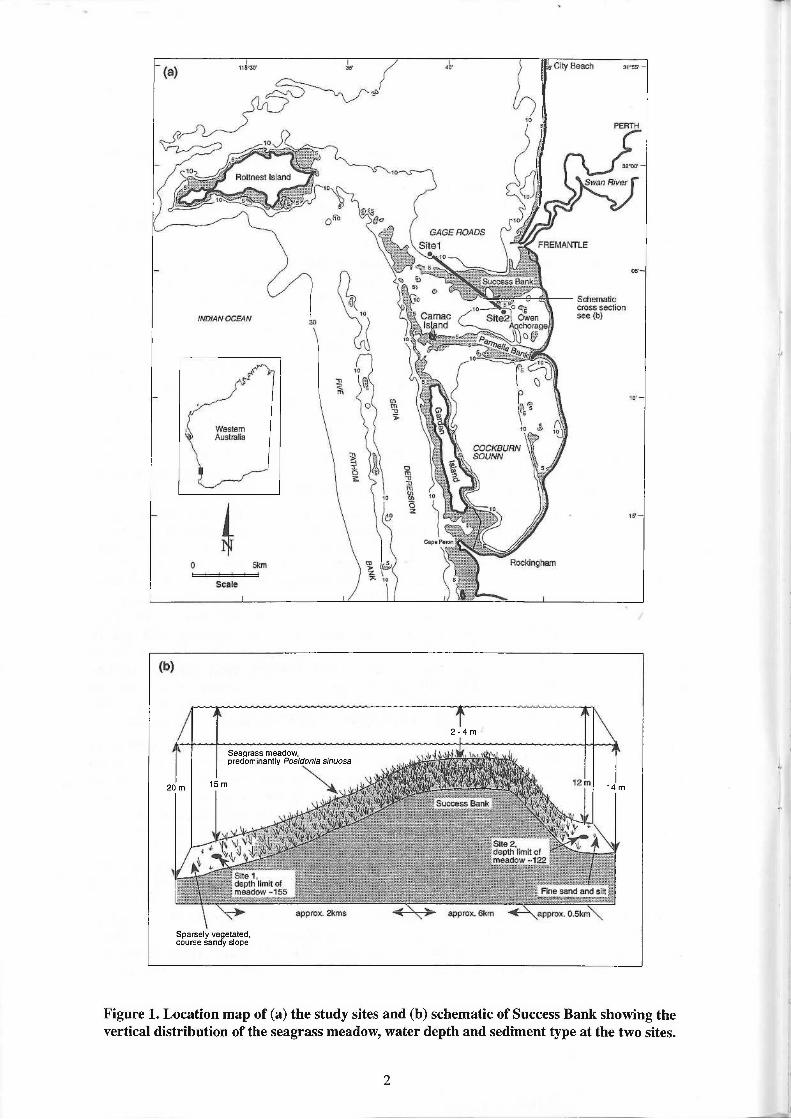
The apparatus for measuring transmission of photosynthetically active radiation (PAR, 400-700 nm waveband) through the plastic strips consisted of a tungsten filament incandescent light source (Crompton Ltd, Edison screw, 45 mm round pearl lamp 1J, 40 W, 240 V) positioned approximately 150 mm above an integrating quantum light sensor (Li-cor, LI-192S; ± 5 %; Fig. 2a). To determine light transmission a strip was pinned down in a glass bottom cartridge, under approximately 25 mm of seawater, and measurements of light intensity were recorded at regular intervals along the length of the strip by passing the cartridge between the light source and the sensor (Fig. 2b). Ten strips, five long and five short, were randomly chosen from each periphyton collector and trimmed to equal length. The mean of five light intensity measurements was recorded every 30 mm along the length of a strip and these values were averaged to provide the mean light intensity for a strip. The same procedure was used to measure light intensity through five unused 'control' strips. Light reduction through periphyton assemblages was calculated by subtracting light intensity values from the mean 'control' value and expressed as a percentage.
After the light transmission measurements were completed, each strip was rinsed in distilled water to remove salts, laid flat on a glass slab and both sides scraped with a razor blade to remove the periphyton. Scrapings of the long and short strips were combined to form an homogeneous slurry. The homogenate was approximately halved, placed in pre-weighed centrifuge tubes, re-weighed and frozen for chlorophyll a and dry weight analyses. The remaining strips from each collector were frozen for determination of species composition.
3
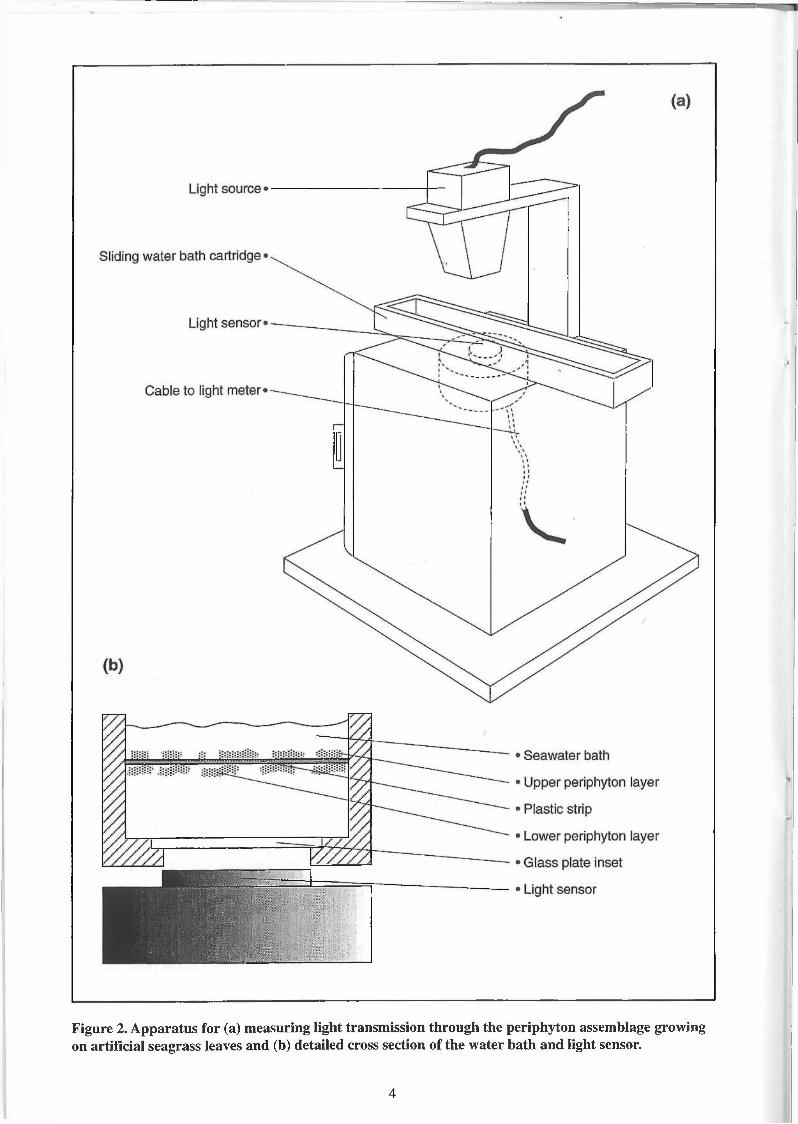
Figure 2. Apparatus for (a) measuring light transmission through the periphyton assemblage growing on artificial seagrass leaves and (b) detailed cross section of the water bath and light sensor.
4
r
Approximately 20 seagrass shoots from both sites were harvested on seven occasions at intervals of about 60 days and analysed for epiphyte macroalgal species composition and epiphyte biomass. Fifteen undamaged seagrass leaves were rinsed in distilled water and the epiphytes scraped from the area of living tissue (non-necrotic). The scrapings were bulked, divided into pre-weighed centrifuge tubes, re-weighed and frozen for chlorophyll a and dry weight analyses. The mean width, length of living leaf tissue and total length (including necrotic tissue) of each leaf were recorded. The remaining seagrass leaves were fixed in 10% formalin for 24 hours, then frozen for subsequent determination of species composition.
Chlorophyll a and phaeophyton concentrations (± 0.06 (ig l-1) were determined using the acetone extraction method (Jeffery and Humphrey, 1975) and applying a phaeophyton correction (Strickland and Parsons, 1972). Total dry weight was determined by drying samples to a constant weight at 105°C and the organic and carbonate fractions determined by subsequent weight losses at 550°C and 1050°C respectively. A correction factor of 2.27 was applied to the carbonate fraction to account for the residual calcium oxide. The 'refractory fraction' (inorganic, non-carbonate material) was calculated by subtracting the organic and calcium carbonate fractions from the total dry weight.
Species richness of the epiphyte and periphyton assemblages in summer and winter were determined by recording the presence of macroalgae species growing on 12 seagrass leaves and 12 plastic strips collected from both sites between (December, 1992 - February, 1993) and between (June, 1993 - July, 1993) respectively. Presence of a species on a leaf or plastic strip scored one and these scores were summed with a maximum score of 12. Species occurrences were summarized as percentage occurrence for the divisions Rhodophyta, Phaeophyta and Cyanophyta and for coralline and non-coralline algae within the Rhodophyta.
Samples of seawater were collected for nutrient analysis at both sites every 5-7 days, during six periods of approximately 42 days between March 1992 and June 1993. Ten-litre samples were collected from approximately 3 m below the water surface and approximately 3 m and 5 m above the seabed at sites 1 and 2 respectively, using a Niskin bottle. Approximately five litres were filtered through a 1.2|0.m G/FC millipore filter (Whatman Ltd, England) at a maximum negative pressure of 75 KPa and subsampled for analysis of inorganic nitrogen (ammonia and nitrate-plus-nitrite). In the field, water samples were placed in 150 ml polyethylene bags (Whirlpak, Nasco Ltd, Kansas, USA.) and temporarily stored in darkness and on ice. In the laboratory samples were frozen and analysed within one month of collection. Ammonia-nitrogen (± 5 |J.g 1"*) was measured using the isocyanurate method (Dal Pont et al., 1974). Nitrate+nitrite-nitrogen (± 2 |Lig l'l) was determined with a Technicon Autoanalyser II after copper-cadmium reduction (Technicon Industrial Systems, 1972).
2.1 Statistical treatments
Parametric (Student's t-test, tp) and non-parametric (Mann-Whitney U-test) statistical analyses were used to determine if pairs of sample means were significantly different (Snedecor and Cochran, 1967). Differences in the slopes of the periphyton biomass-light reduction relationships between sites and between seasons at each site, were determined by comparing slopes of linear regressions between log transformed periphyton biomass and percent light reduction, over comparable ranges in biomass values (Sokal and Rohlf, 1969). Probabilities of < 0.05 were taken as significant unless stated otherwise
To assess seasonal trends in epiphyte biomass, the study period was divided into four seasons: winter (June 1 - August 31), spring (September 1 - November 30), summer (December 1 -February 28) and autumn (March 1 - May 31). Periphyton biomass-light reduction relationships were analysed for winter (June 1 - August 31) and non-winter (September 1 - May 31) periods.
5
3. Results
3.1 Epiphyte assemblages
Seasonal comparisons
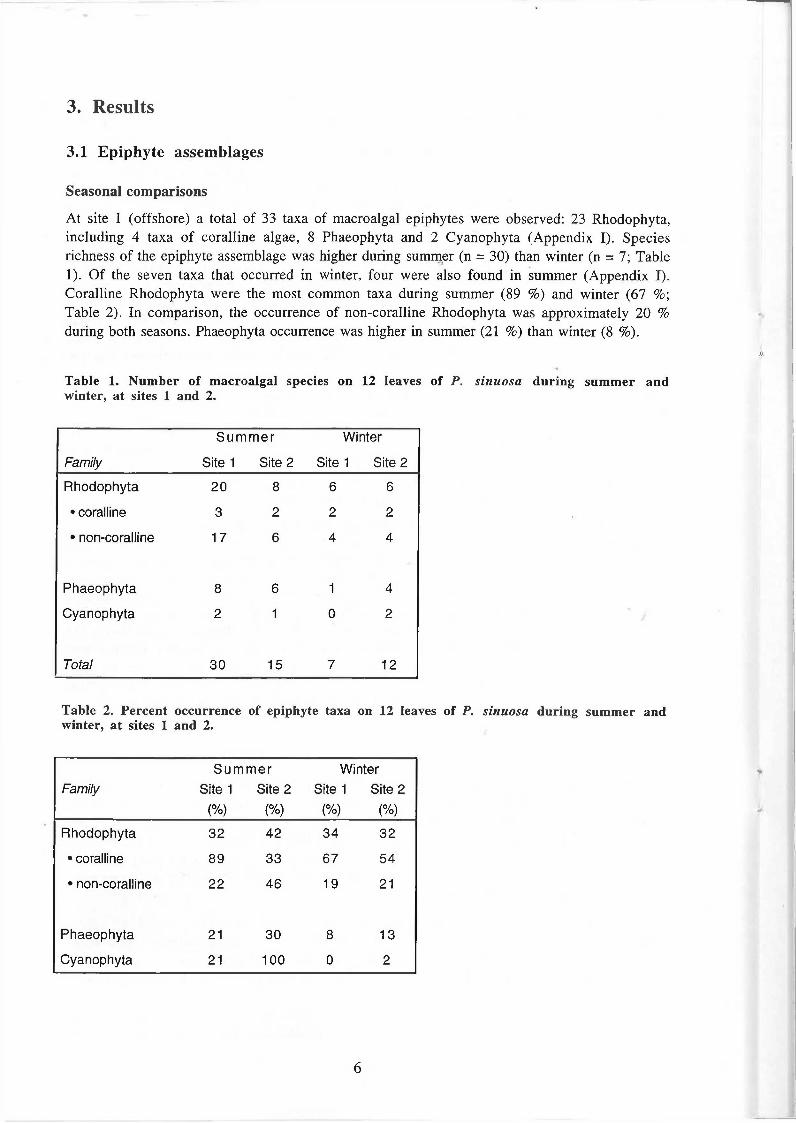
At site 1 (offshore) a total of 33 taxa of macroalgal epiphytes were observed: 23 Rhodophyta, including 4 taxa of coralline algae, 8 Phaeophyta and 2 Cyanophyta (Appendix I). Species richness of the epiphyte assemblage was higher during summer (n = 30) than winter (n = 7; Table 1). Of the seven taxa that occurred in winter, four were also found in summer (Appendix I). Coralline Rhodophyta were the most common taxa during summer (89 %) and winter (67 %; Table 2). In comparison, the occurrence of non-coralline Rhodophyta was approximately 20 % during both seasons. Phaeophyta occurrence was higher in summer (21 %) than winter (8 %).
*>
Table 1. Number of macroalgal species on 12 leaves of P. sinuosa during summer and winter, at sites 1 and 2.
Summer Winter
Family Site 1 Site 2 Site 1 Site 2
Rhodophyta 20 8 6 6
• coralline 3 2 2 2
• non-coralline 17 6 4 4
Phaeophyta 8 6 1 4
Cyanophyta 2 1 0 2
Total 30 15 7 12
Table 2. Percent occurrence of epiphyte taxa on 12 leaves of P. sinuosa during summer and winter, at sites 1 and 2.
Family Summer
Site 1 Site 2 (%) (%)
Winter Site 1 Site 2
(%) (%)
Rhodophyta 32 42 34 32
• coralline 89 33 67 54
• non-coralline 22 46 19 21
Phaeophyta 21 30 8 13
Cyanophyta 21 100 0 2
6
At site 2 (inshore) a total of 20 taxa of macroalgal epiphytes were observed: 11 Rhodophyta, including 3 taxa of coralline algae, 7 Phaeophyta and 2 Cyanophyta (Appendix I). Species richness of the epiphyte assemblage was similar between summer (n = 15) and winter (n = 12; Table 1) and of the 12 taxa that occurred in winter, seven also occurred in summer (Appendix I). Non-coralline Rhodophyta were the most commonly occurring taxa at site 2 during summer 50 % (Table 2). By comparison coralline Rhodophyta and Phaeophyta had similar occurrences of about 30 %. During winter the occurrence of all epiphytic taxa were relatively low except the articulated coralline algae Fosliella spp. which occurred on over 95 % of the leaves.
Spatial comparisons •>,.
Species richness of the epiphyte assemblage at site 1 was higher than site 2 during summer but lower during winter (Table 1). During summer all but one of the 14 taxa that occurred at site 2 were common to both sites (Appendix I). In contrast during winter only 3 of the 12 taxa that occurred at site 2 were common to both sites and 2 of these taxa were coralline algae. Species of Rhodophyta and Phaeophyta were the main components of the epiphyte assemblages at the two sites during summer (Table 1). During winter, species composition at site 1 was dominated by Rhodophyta, especially coralline algae, in contrast to site 2 where Rhodophyta and Phaeophyta both remained major components of the epiphyte assemblages. The occurrence of Phaeophyta and non-calcareous Rhodophyta species during summer were lower at site 1, however over the same period, the mean occurrence of coralline Rhodophyta was higher (Table 2). During winter the occurrence of non-coralline Rhodophyta species was similar at the two sites, however site 1 continued to have a lower occurrence of Phaeophyta species and a higher occurrence of coralline Rhodophyta species.
3.2 Epiphyte biomass
Seasonal comparisons
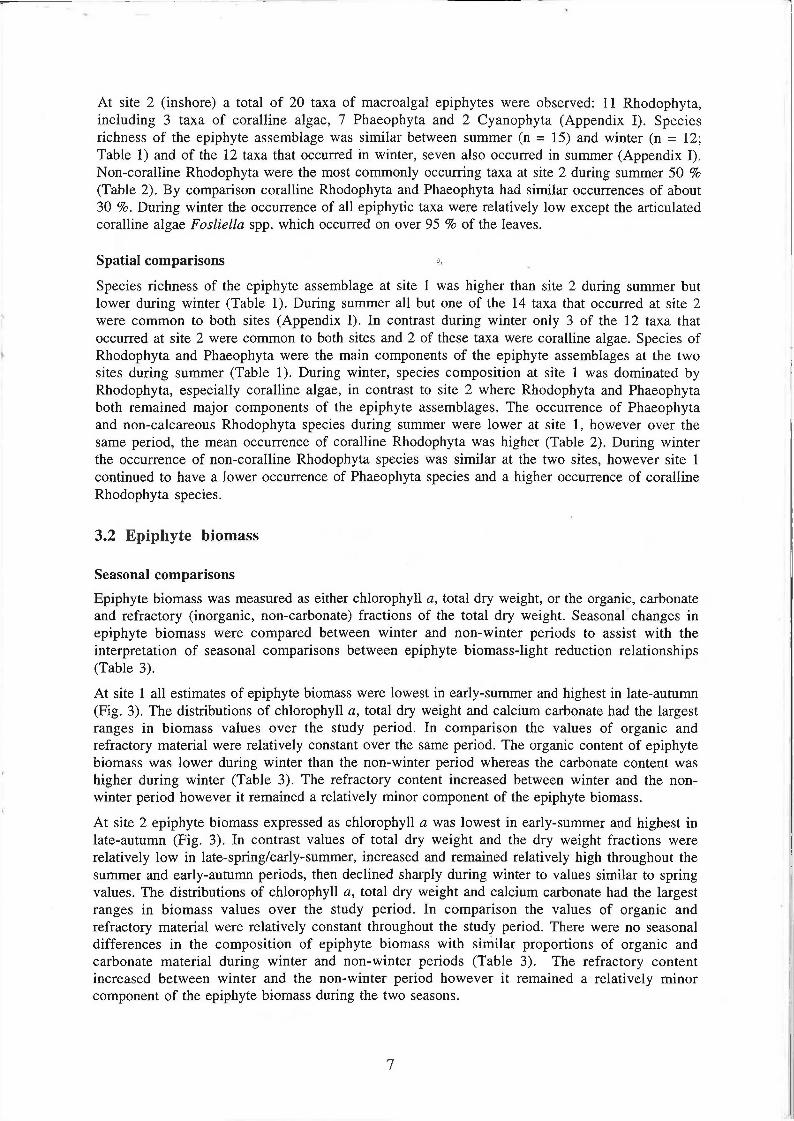
Epiphyte biomass was measured as either chlorophyll a, total dry weight, or the organic, carbonate and refractory (inorganic, non-carbonate) fractions of the total dry weight. Seasonal changes in epiphyte biomass were compared between winter and non-winter periods to assist with the interpretation of seasonal comparisons between epiphyte biomass-light reduction relationships (Table 3).
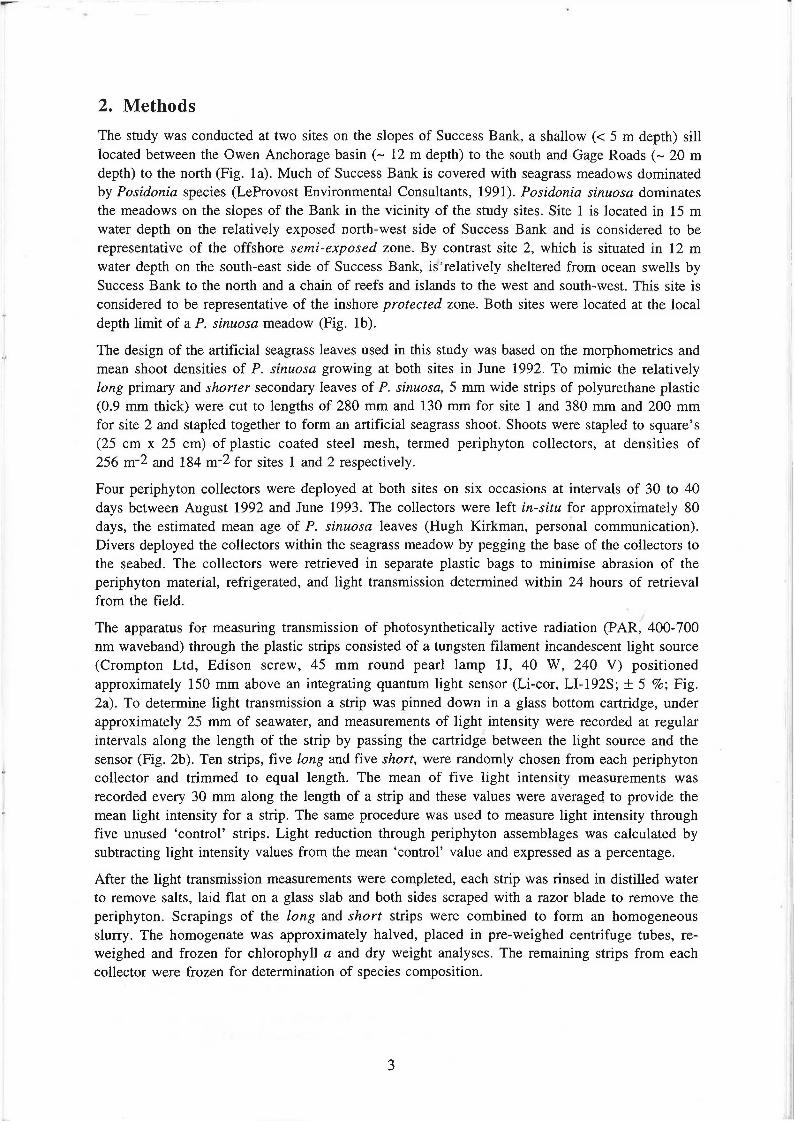
At site 1 all estimates of epiphyte biomass were lowest in early-summer and highest in late-autumn (Fig. 3). The distributions of chlorophyll a, total dry weight and calcium carbonate had the largest ranges in biomass values over the study period. In comparison the values of organic and refractory material were relatively constant over the same period. The organic content of epiphyte biomass was lower during winter than the non-winter period whereas the carbonate content was higher during winter (Table 3). The refractory content increased between winter and the non-winter period however it remained a relatively minor component of the epiphyte biomass.
At site 2 epiphyte biomass expressed as chlorophyll a was lowest in early-summer and highest in late-autumn (Fig. 3). In contrast values of total dry weight and the dry weight fractions were relatively low in late-spring/early-summer, increased and remained relatively high throughout the summer and early-autumn periods, then declined sharply during winter to values similar to spring values. The distributions of chlorophyll a, total dry weight and calcium carbonate had the largest ranges in biomass values over the study period. In comparison the values of organic and refractory material were relatively constant throughout the study period. There were no seasonal differences in the composition of epiphyte biomass with similar proportions of organic and carbonate material during winter and non-winter periods (Table 3). The refractory content increased between winter and the non-winter period however it remained a relatively minor component of the epiphyte biomass during the two seasons.
7
Table 3. Mean epiphyte biomass expressed as either chlorophyll a, total dry weight or the organic, carbonate and refractory components, at sites 1 and 2 during the annual, winter and non-winter periods. Epiphyte biomass expressed as (a) mean with standard errors (in parentheses) and as a percentage of total dry weight, and (b) ranges.
Site Epiphyte Annual % Winter % Non-winter % biomass
1 Chlorophyll a a 0.87 (0.19) - 1.35 (0.29) - 0.67 (0.18) -
(ng cm"2) b 0.28 - 1.64 1.05 - 1.64 0.28 - 1.19
Total Dry weight a 1.33 (0.22) 100 1.93 (0.02) 100 1.09 (0.22) 100 (mg cm"2) b 0.61 - 1.9 1.90 - 1.95 0.61 - 1.80
Organic matter a 0.34 (0.04) 26 0.43 (0.02) 22 0.31 (0.04) 30 (mg cm"2) b 0.23 - 0.45 0.40 - 0.45 0.23 - 0.42
Calcium a 0.92 (0.17) 69 1.43 (0.02) 74 0.72 (0.16) 64 carbonate (mg cm"2) b 0.31 - 1.45 1.41 - 1.45 0.31 - 1.22
Refractory a 0.08 (0.02) 5 0.073 (0.02) 4 0.08 (0.03) 6 material (mg cm"2) b 0.04-0.16 0.05 - 0.09 0.04 - 0.16
2 Chlorophyll a a 0.77 (0.09) - 0.93 (0.26) - 0.71 (0.09) -
(|ig cm"2) b 0.53 - 1.20 0.67 - 1.19 0.53 - 1.05
Total Dry weight a 0.85 (0.11) 100 0.57 (0.17) 100 0.96 (0.11) 100 (mg cm"2) b 0.40 - 1.29 0.40 - 0.74 0.65 - 1.29
Organic matter a 0.28 (0.03) 34 0.20 (0.07) 34 0.32 (0.02) 34 (mg cm"2) b 0.13 - 0.34 0.13 - 0.27 0.28 - 0.37
Calcium a 0.53 (0.07) 61 0.36 (0.09) 63 0.59 (0.08) 60 carbonate (mg cm"2) b 0.26 - 0.80 0.26 - 0.45 0.33 - 0.80
Refractory a 0.06 (0.02) 5 0.02 (0.01) 3 0.08 (0.02) 6 material (mg cm"2) b 0.01 - 0.12 0.01 - 0.03 0.02 - 0.12
8
2.0
1.5-1
11 1.0 o 9> sz -O 0.5
0.0
(a)
2.0
E 1.5 • O) *<D OJ e- i 1 .o -~o O) m E. a 0.5
<D re cT-E E o o 'c: ra ro F o>-S
0.0
2.0
1.5
1.0 -
0.5
0.0
2.0 0) ro c £• si if
1.5
1.0
s 0.5
0.0
2.0 n
1.5
O O) O E CO ' o DC
1.0 •
0.5 -
0.0
(b)
(c)
(d)
(e)
1992 1993
Spring
® Site 1
o Site 2
Winter
Figure 3. Seasonal variation in epiphyte biomass expressed as (a) chlorophyll a, (b) total dry weight (c) organic matter, (d) calcium carbonate and (e) refractory material at sites 1 (•) and 2 (o). Each point represents the analysis of a combined sample of epiphyte material removed from 15 P. sinuosa leaves.
9
Spatial comparisons
The seasonal distributions of epiphyte biomass expressed as total dry weight and calcium carbonate were similar between sites 1 and 2 during late spring/early summer but diverged markedly during autumn and winter (Fig. 3). In contrast values of epiphyte biomass expressed as either chlorophyll a, organic or refractory material were similar between the two sites throughout the study period.
During the non-winter period the total dry weight of epiphytes at sites 1 and 2 were similar. In contrast, during winter the total dry weight of epiphytes 'at site 1 was more than three times higher than site 2 (Table 3). The epiphytic assemblage at site 1 had a lower organic content and a higher carbonate content than site 2 during both the winter and non-winter periods. Differences between the sites in the percentages of organic and carbonate material were greatest during the winter period.
CD 3 c CD O) O 'c y 'c Cti O) t— o
oj £
60
50 -
40 -
30 -
20 -
10 -
0
• Site 1
+ Site 2
&%* •• *• v* . •+ * +%t •T ee
0 61 122
Summer <-< Autumn
183 244 305 i 366 Julian day • j
« Winter 4" Spring 4" Summer
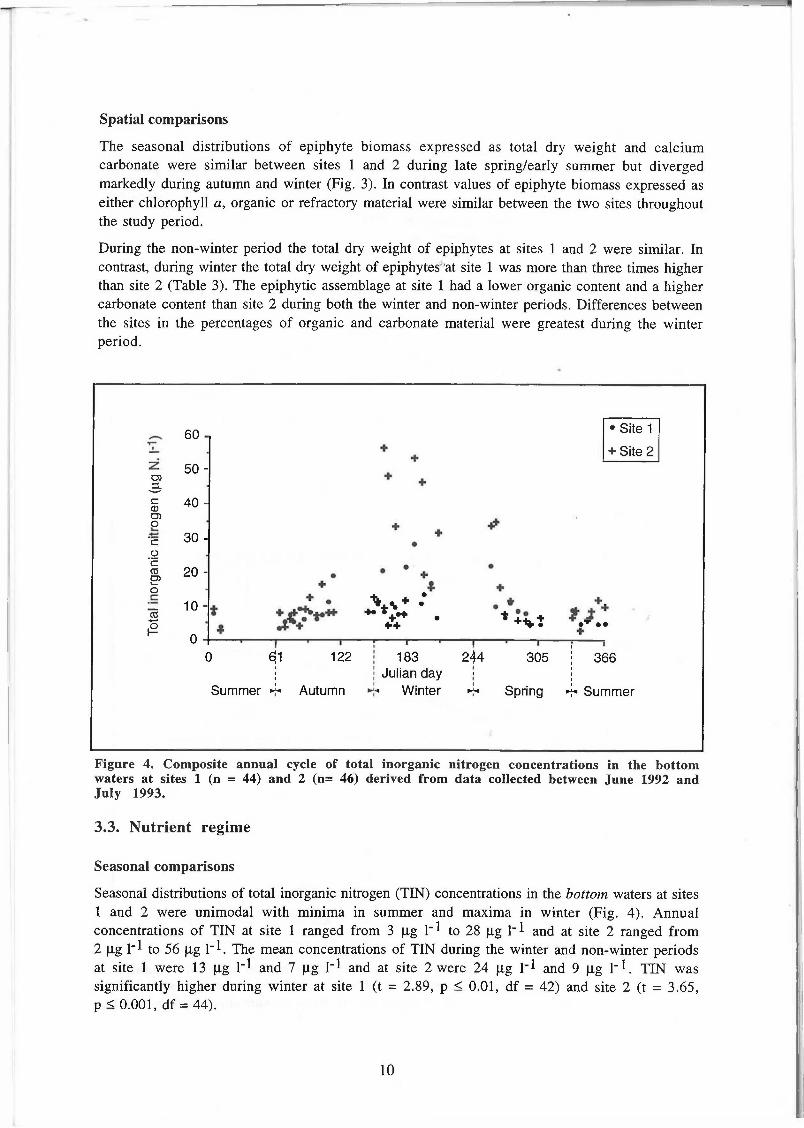
Figure 4. Composite annual cycle of total inorganic nitrogen concentrations in the bottom waters at sites 1 (n = 44) and 2 (n= 46) derived from data collected between June 1992 and July 1993.
3.3. Nutrient regime
Seasonal comparisons
Seasonal distributions of total inorganic nitrogen (TIN) concentrations in the bottom waters at sites 1 and 2 were unimodal with minima in summer and maxima in winter (Fig. 4). Annual concentrations of TIN at site 1 ranged from 3 jig 1~* to 28 (Xg 1"! and at site 2 ranged from 2 jig H to 56 jig I"1. The mean concentrations of TIN during the winter and non-winter periods at site 1 were 13 |Xg H and 7 jxg 1~1 and at site 2 were 24 |xg 1"! and 9 jag 1~1. TIN was significantly higher during winter at site 1 (t = 2.89, p < 0.01, df = 42) and site 2 (t = 3.65, p < 0.001, df = 44).
10
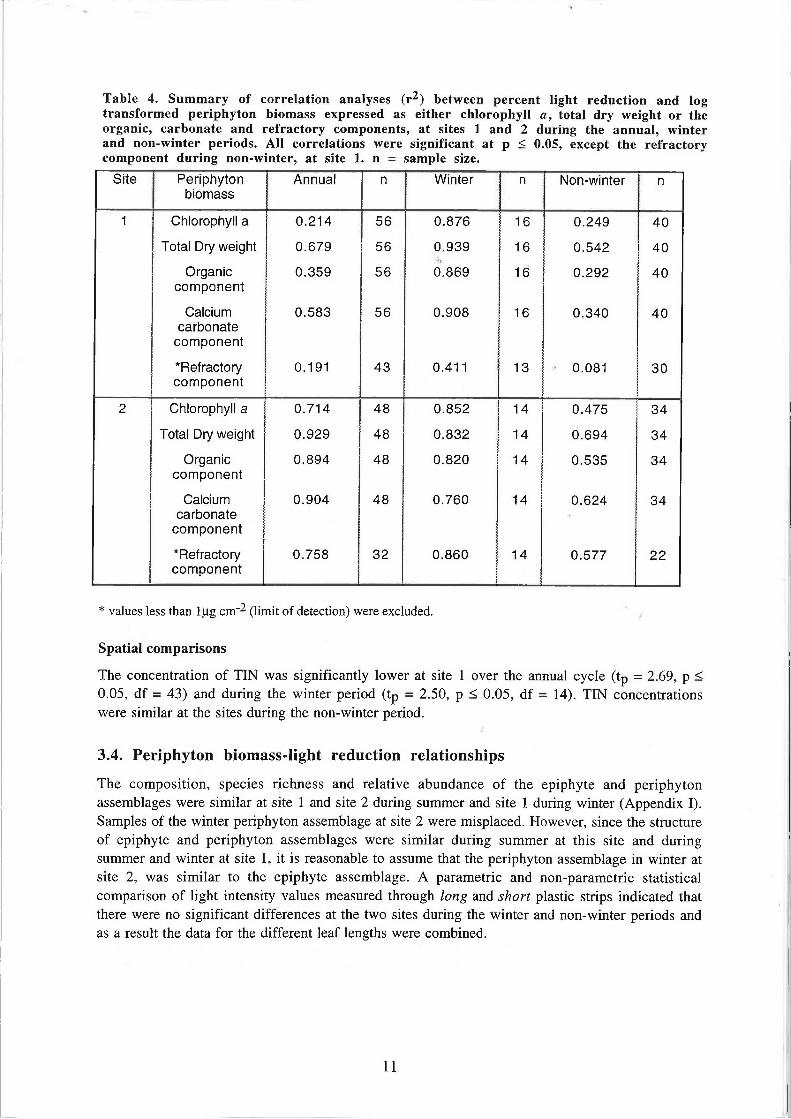
Table 4. Summary of correlation analyses (r2) between percent light reduction and log transformed periphyton biomass expressed as either chlorophyll a, total dry weight or the organic, carbonate and refractory components, at sites 1 and 2 during the annual, winter and non-winter periods. All correlations were significant at p < 0.05, except the refractory component during non-winter, at site 1. n = sample size.
Site Periphyton biomass
Annual n Winter n Non-winter n
1 Chlorophyll a 0.214 56 0.876 16 0.249 40
Total Dry weight 0.679 56 0.939 16 0.542 40
Organic component
0.359 56 0.869 16 0.292 40
Calcium carbonate component
0.583 56 0.908 16 0.340 40
"Refractory component
0.191 43 0.411 13 0.081 30
2 Chlorophyll a 0.714 48 0.852 14 0.475 34
Total Dry weight 0.929 48 0.832 14 0.694 34
Organic component
0.894 48 0.820 14 0.535 34
Calcium carbonate
component
0.904 48 0.760 14 0.624 34
"Refractory component
0.758 32 0.860 14 0.577 22
* values less than l|J.g cm"2 (limit of detection) were excluded.
Spatial comparisons
The concentration of TIN was significantly lower at site 1 over the annual cycle (tp = 2.69, p < 0.05, df = 43) and during the winter period (tp = 2.50, p < 0.05, df = 14). TEN concentrations were similar at the sites during the non-winter period.
3.4. Periphyton biomass-light reduction relationships
The composition, species richness and relative abundance of the epiphyte and periphyton assemblages were similar at site 1 and site 2 during summer and site 1 during winter (Appendix I). Samples of the winter periphyton assemblage at site 2 were misplaced. However, since the structure of epiphyte and periphyton assemblages were similar during summer at this site and during summer and winter at site 1, it is reasonable to assume that the periphyton assemblage in winter at site 2, was similar to the epiphyte assemblage. A parametric and non-parametric statistical comparison of light intensity values measured through long and short plastic strips indicated that there were no significant differences at the two sites during the winter and non-winter periods and as a result the data for the different leaf lengths were combined.
11
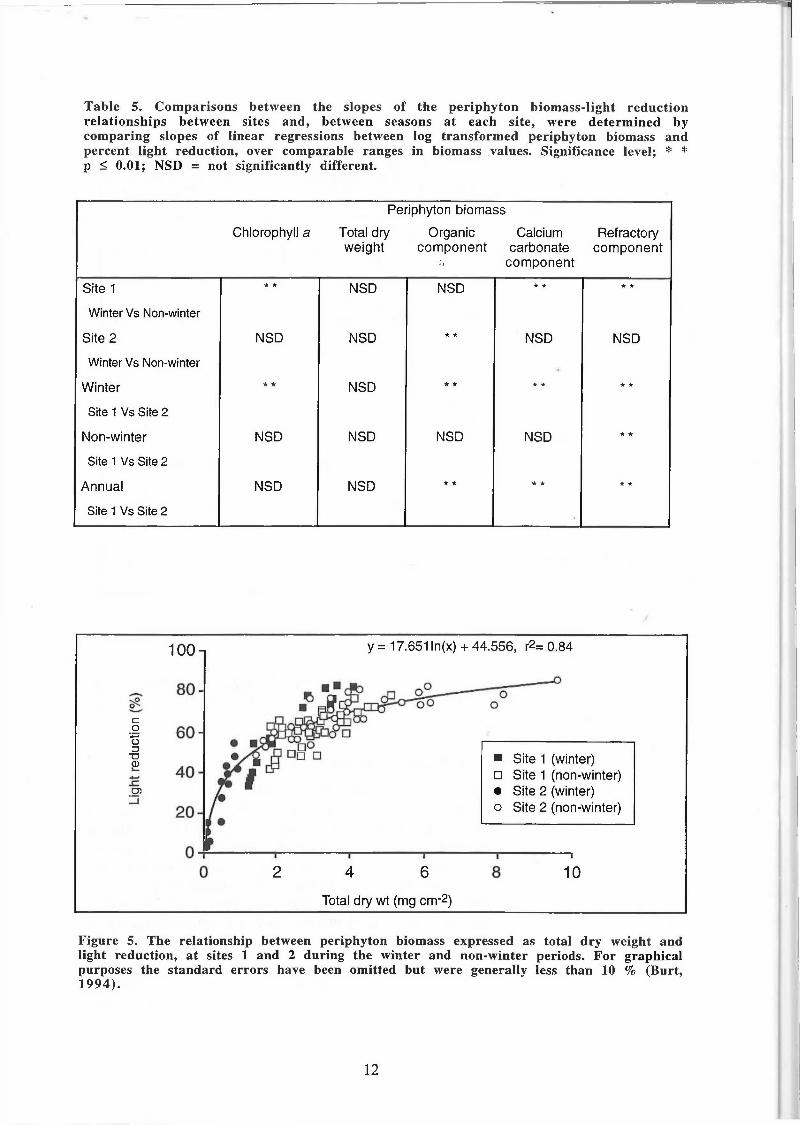
Table 5. Comparisons between the slopes of the periphyton biomass-light reduction relationships between sites and, between seasons at each site, were determined by comparing slopes of linear regressions between log transformed periphyton biomass and percent light reduction, over comparable ranges in biomass values. Significance level; * * p < 0.01; NSD = not significantly different.
Periphyton biomass
Chlorophyll a Total dry weight
Organic component
•J,
Calcium carbonate component
Refractory component
Site 1 * * NSD NSD * * * *
Winter Vs Non-winter
Site 2 NSD NSD * * NSD NSD
Winter Vs Non-winter
Winter * * NSD * * * * * *
Site 1 Vs Site 2
Non-winter NSD NSD NSD NSD * *
Site 1 Vs Site 2
Annual NSD NSD * * * * * *
Site 1 Vs Site 2
100-1 y = 17.651 ln(x) + 44.556, r2= 0.84
c o
"•+—> o Z3 "O CD
O)
2 4 6 Total dry wt (mg cm-2)
• Site 1 (winter) • Site 1 (non-winter) e Site 2 (winter) o Site 2 (non-winter)
i 10
Figure 5. The relationship between periphyton biomass expressed as total dry weight and light reduction, at sites 1 and 2 during the winter and non-winter periods. For graphical purposes the standard errors have been omitted but were generally less than 10 % (Burt, 1994).
12
The relationship between percentage light reduction and periphyton biomass can be described by a logarithmic function. The slope and intercept of this relationship were determined by applying a simple linear regression to log transformed periphyton biomass values.
Percent light reduction and periphyton biomass expressed as either chlorophyll a, total dry weight or the organic, carbonate and refractory fractions were significantly correlated during the winter and non-winter periods at sites 1 and 2, except for the refractory component during the non-winter period at site 1 (Table 4). Correlation coefficients were higher during winter than non-winter at both sites. In winter the fraction of total dry weight with the most significant correlation with percent light reduction occurred when biomass was expressed as calcium carbonate at site 1 and refractory material at site 2, whereas during the non-winter period, the primary correlate at both sites was calcium carbonate.
There were no significant site or seasonal differences between the slopes of the light reduction relationships for periphyton biomass expressed as total dry weight (Table 5) enabling site and seasonal data to be pooled to establish a single relationship for the two study sites (Fig. 5). Site and seasonal differences in the light reduction relationship were found however when periphyton biomass was expressed as either chlorophyll a, organic, carbonate or refractory material (Table 5). At site 1, there were significant differences in the relationship between seasons for biomass expressed as chlorophyll a, calcium carbonate and refractory material. In contrast, at site 2 the only significant seasonal difference in the light reduction relationship expressed periphyton biomass as organic matter. During winter, there were significant differences in the relationship between sites for all measures of periphyton biomass, except total dry weight. By contrast, during the non-winter period there were no significant sites differences in the light reduction relationship, except for biomass expressed as refractory material. Values of periphyton biomass expressed as either chlorophyll a, organic or carbonate material at the two sites could therefore be pooled over the non-winter period to provide a common light-reduction relationship for the two study sites (Fig. 6).
4. Discussion
4.1. Epiphyte assemblages
At the offshore site (site 1) the species composition of the epiphyte assemblage changed from non-coralline dominated during summer to coralline dominated during winter. Epiphyte assemblages with high proportions of coralline algae are considered to be indicative of oligotrophic conditions (May et al., 1978; Harlin and Thorne-Miller, 1981; Hillman et al., 1991). However, ambient concentrations of total inorganic nitrogen in the 'bottom' waters at this site were significantly higher, not lower, during winter than summer suggesting that nutrients were not influencing the seasonal changes in epiphyte assemblage. Previous studies have reported differential erosion of epiphytes by wave action with higher erosion rates for filamentous and erect foliose species compared to 'low profile' encrusting coralline species (Cambridge, 1979; Burt et al., 1995b). Consequently, under conditions of high wave energy coralline algae can become the dominant epiphytic taxa on seagrass leaves (Kendrick, 1991). Wave energy is significantly higher in the study area during winter and is approximately 50 % higher offshore compared to the inshore site (Burt et al., 1995a). Thus the most likely explanation for the seasonal change in the species composition of the offshore assemblage is that higher wave energy during winter removes more filamentous species providing the coralline species with a competitive advantage.
13
"I
c o
*-f—' o r3 •O 0)
y = 6.888 * ln(x) + 62.175 j. + +
+ +. + +
• Site 1
+ Site 2
_r 3
"T" 4
~r 5
1 r- "1 7
Chlorophyll a (|xg cm-2)
C .O
o "O CD L-•*—> sz CD
y =11.963 * ln(x) + 61.226
_r 2
"T" 3
Organic matter (mg cm-2)
1 4
n 5
100 i
c .0 o 3 •o 0) £ CO
y =13.794 *ln(x) + 66.343
12 3 4 Calcium carbonate (mg cm-2)
Figure 6. The relationship between periphyton biomass and light reduction, at sites 1 (•) and 2 (+) during non-winter period. Periphyton biomass is expressed as (a) chlorophyll a, (b) organic matter or (c) calcium carbonate. For graphical purposes the standard errors have been omitted but were generally less than 10 % (Burt, 1994).
14
The epiphyte assemblage at the inshore site (site 2) consisted mainly of filamentous species, with a similar species richness, composition, and species occurrence during summer and winter. Epiphyte assemblages dominated by filamentous species are considered to be characteristic of eutrophic conditions (May et al., 1978; Harlin and Thorne-Miller, 1981; Cambridge et al., 1986; Hillman et al., 1991) suggesting that the species composition of the inshore assemblage is primarily nutrient induced. Previous studies indicate that in general the coastal waters of Perth are oligotrophic and suggest that nitrogen is usually the macro-nutrient limiting plant growth (Pearce, 1991; Simpson et al., 1993; Gary et al., 1995a). The mean concentration of total inorganic nitrogen of 'bottom' waters at the inshore site during most of the year (qon-winter) was 9 |ig H and was similar to background concentrations (6 (ig H) in Perth's coastal waters (Gary et al., 1995b). However, during winter at the same site, the mean concentration of total inorganic nitrogen was four times background. These data indicate that the occurrence of elevated nitrogen concentrations at the inshore site is restricted to winter. Ambient nitrogen concentrations however are not considered to be the most useful index of eutrophication in predominantly oligotrophic ecosystems due to the rapid assimilation of available nitrogen by primary producers (Gary et al., 1995a). Under these conditions, the biomass of phytoplankton is considered to be a better indicator of eutrophication than dissolved nutrient concentrations (ANZECC, 1992). The mean concentration of chlorophyll a (a measure of phytoplankton biomass) at the inshore site were higher than the offshore site during winter and the non-winter period (Burt et al., 1995a) suggesting that this site is relatively 'eutrophic' throughout the year, and supports the suggestion that the composition of the epiphyte assemblage at the inshore site is primarily nutrient-induced.
Species composition and biomass of epiphyte assemblages are influenced by numerous factors such as the availability of light (Cambridge et al., 1986), water temperature (Heijs, 1985), epifaunal grazing (Steneck 1983; Nielsen and Lethbridge 1989; Steneck et al., 1991), the overall algal diversity in an area (Borowitzka and Lethbridge, 1989) and the proximity to sources of algal epiphyte propagules (West, 1990). However, the results in this study suggest that differential erosion due to wave action and nutrient concentrations in the water column are the key determinants of species composition of epiphyte assemblages growing on P. sinuosa in the southern coastal waters of Perth.
4.2. Epiphyte biomass
Seasonal patterns of epiphyte biomass on Posidonia seagrasses in temperate coastal waters of Western Australia are generally unimodal with minima in late-summer and maxima in late-winter or early spring, with an annual variation in biomass of four to six-fold (Kirkman, 1981; Silberstein, 1985; Hillman et al., 1991). In the present study, the seasonal changes of epiphyte biomass at the offshore site followed this general pattern however at the inshore site the maximum values of epiphyte biomass are reached by early autumn and then decline sharply during late autumn with minima in mid-winter. This sharp decrease in epiphyte biomass at the inshore site coincided with the occurrence of the first winter storm (Burt et al., 1993). Cambridge (1979) found that strong wave action can 'strip' large quantities of 'loosely' attached filamentous algae from seagrass leaves. In a recent field study in Cockburn Sound Burt et al. (1995b) found that over a 26-day deployment the biomass of periphyton on artificial seagrass leaves that were tethered (i.e. protected from abrasion/erosion) was up to 100 times greater than untethered leaves that were allowed to move freely. These results suggest that the discontinuity between the sites in epiphyte biomass is most likely due to higher rates of erosion for the filamentous dominated inshore assemblage compared to the coralline dominated offshore assemblage.
15
Silberstein et al. (1986) found the biomass of epiphytes on P. australis seagrass growing in the same area at relatively protected sites was correlated with nutrient concentrations in the water column. However, the results of this study suggest that the biomass of epiphytes on Posidonia seagrasses in more exposed locations in Perth's coastal waters is the result of the interaction between the ambient nutrient regime and erosion/abrasion due to wave action.
4.3. Periphyton biomass-light reduction relationships
Comparisons between epiphyte assemblages on seagrass leaves and periphyton assemblages on artificial seagrass showed there were no significant substrate effects on species composition and biomass. This finding is consistent with numerous studies that have used the same technique (Silberstein et al., 1986; Neverauskas, 1987; Horner, 1987; Lethbridge et al., 1988) and allows the relationship derived between periphyton biomass and percent light reduction to be used for epiphyte assemblages.
During the non-winter period, when the species assemblages at the two sites were similar, there were no significant differences in the light reduction relationships between the sites, except when biomass was expressed as refractory (inorganic, non-carbonate) material. In contrast, during winter when coralline species dominated the offshore assemblage and filamentous species dominated the inshore assemblage, there were significant differences in the light reduction relationships between sites for all relative measures of biomass, except total dry weight. These results suggest that differences in species composition of epiphyte assemblages can significantly change the relationship between epiphyte biomass and light attenuation.
A secondary objective of this study was to derive a epiphyte biomass-light reduction relationship for input into a nutrient effects ecological model being developed as part of the SMCWS (Simpson et al., 1993). Most biological and physical relationships used in ecological models need to be generic so they apply over the entire model domain and for the annual cycle. In this study, periphyton biomass expressed as total dry weight was the only biomass-light reduction relationship with no significant site or seasonal differences. This general relationship is very similar to functions derived in the same area by Silberstein et al. (1986) for P. australis and in Perth's northern coastal waters by Manning (1994) for P. sinuosa. Therefore it would be reasonable, in the absence of other site-specific information, to use this relationship to estimate percentage light reduction through the epiphyte layer of P. sinuosa throughout Perth's coastal waters.
There were no significant differences in light reduction relationship between the sites during the non-winter period for periphyton expressed as chlorophyll a, organic matter and calcium carbonate. The availability of light during the non-winter period is considered to be critical to the production of non-structural carbohydrate energy reserves that are used for growth and survival of P. sinuosa seagrasses in winter (Masini et al., 1995a, b). The generic light reduction relationships derived in this study for the non-winter period provide a number of biomass indices that can be used to determine the effect of epiphyte loads on light attenuation during this period. However these relationships should be applied with some caution, due to the absence of data at relatively low biomass values where subtle changes in the slope of the light-reduction relationship may significantly alter the amount of light reaching the seagrass leaf.
4.4. Implications for management
In Perth's coastal waters species composition and biomass of epiphyte assemblages are key factors influencing light attenuation through the epiphytic layer on leaves of P. sinuosa seagrasses. The
16
relative contribution of these factors is the result of the interaction between the ambient nutrient regime and erosion/abrasion due to wave action. Consequently, activities that lead to changes in the nutrient status or wave climate of these waters have the potential to alter the attenuation of light through the epiphyte layer and therefore the amount of light reaching the seagrass leaf.
The relationship between periphyton biomass and percent light reduction indicates that a small increase in epiphyte biomass on the leaves of seagrasses can significantly reduce the light reaching the surface of the leaf. The logarithmic nature of the light reduction relationship means that the relative effect of a given increase in biomass on percent light reduction is higher at relatively low biomass values. For example, in this study periphyton biomass expressed as total dry weight ranged between 0.5 to 2.0 mg cm"2. An increase of 1.0, mg cm™2 in epiphyte biomass at the lower end of the range (ie. 0.5 to 1.5 mg cm"2) would increase the attenuation of light through the epiphyte layer from 32 % to 52 %. An equivalent 1.0 mg cm"^ increase at the higher end of the range (ie. 1.5 to 2.5 mg cm"2) results in a relatively small increase in light attenuation from 52 % to 61 %. This further illustrates why seagrass meadows growing at their depth limits in clear oligotrophic waters, with relatively low standing crops of epiphytes, are very susceptible to even small increases in the biomass of epiphytes.
5. References Australian & New Zealand Environment & Conservation Council (1992). National water quality
management strategy. Australian water quality guidelines for fresh and marine waters. Australian & New Zealand Environment & Conservation Council. Pp. 204.
Borowitzka M A and Lethbridge R C (1989). Seagrass epiphytes. In: 'Seagrasses: A Treatise on seagrasses with special reference to the Australian region' (eds. A W D Larkum, A J McComb and S A Shepherd). Elsevier, Amsterdam. Pp. 304-345.
Burt J S, Daly T and Pannel M (1993). Light climate, variation in vertical light attenuation coefficent and sediment deposition at two sites at the depth limit of Posidonia seagrass meadows off Fremantle, between March 1992-July 1993. (Environmental Protection Authority, Perth, Western Australia, 6000). Data Report SMCWS ECOL-6. Pp. 100.
Burt J S (1994). The effect of epiphyte species assemblage and biomass on reducing light to the leaf surface of the seagrass Posidonia sinuosa. (Environmental Protection Authority, Perth, Western Australia, 6000). Data Report SMCWS ECOL-7. Pp. 22.
Burt J S, Masini R J and Simpson C J (1995a). Light and Posidonia sinuosa seagrass meadows in the temperate coastal waters of Western Australia: I. Factors influencing water column light attenuation. (Environmental Protection Authority, Perth, Western Australia, 6000). Technical Series 61. (In press).
Burt J S, Daly T and Cousins M D (1995b). Benthic site model validation experiment: May 1994. (Environmental Protection Authority, Perth, Western Australia, 6000). Data Report SMCWS ECOL-15.
Cambridge M L (1979). Technical report on seagrasses. (Department of Conservation and Environment, Perth, Western Australia, 6000). Cockburn Sound Environmental Study Report, No 7. Pp. 100.
Cambridge M L, Chiffings A W, Brittan C, Moore L and McComb A J (1986). The loss of seagrass in Cockburn Sound, Western Australia. II. Possible causes of seagrass decline. Aquatic Botany 24: 269-285.
17
Carter V and Rybicki N B (1990). Light attenuation and submerged macrophyte distribution in the tidal Potomic River and estuary. Estuaries 13: 441-452.
Cary J L, Masini R J and Simpson C J (1995a). Long-term variation in water quality of the southern metropolitan waters of Perth, Western Australia. (Environmental Protection Authority, Perth, Western Australia, 6000). Technical Series 63. (In press).
Cary J L, Masini R J and Simpson C J (1995b). The water quality of the southern metropolitan waters of Perth, Western Australia: The influence of regional and local scale forcings. (Environmental Protection Authority, Perth, Western Australia, 6000). Technical Series 64. (In press).
Chesapeake Bay Programme (1992). Chesapeake Bay submerged aquatic vegetation habitat requirement and restoration targets: a technical synthesis. (Chesapeake Bay Programme, Annapolis, Maryland, USA, 21403). CBP/TRS 83/92. Pp. 186.
Clarke S M and Kirkman H (1989). Seagrass Dynamics. In: 'Seagrasses: A Treatise on Seagrasses with Special Reference to the Australian Region' (eds. A W D Larkum, A J McComb and S A Shepherd), Elsevier, Amsterdam: 304-345.
Dal Pont G K, Hogan M and Newell B (1974). Laboratory techniques in marine chemistry. II-A manual. (Commonwealth Scientific and Industrial Research Organisation of Australia. Division of Oceanography, Cronulla, New South Wales, 2230). Report No 55: 1-5.
Dennison W C (1987). Effects of light on seagrass photosynthesis, growth and depth distribution. Aquatic Botany 27: 15-26.
Dennison W C (1992). SAY and water quality relationships. In: 'Submerged aquatic vegetation habitat requirements and restoration targets: A technical synthesis' (Chesapeake Bay Programme, Annapolis, Maryland, USA, 21403). CBP/TRS 83/92: 3-13.
Dennison W C and Alberte R S (1982). Photosynthetic response of Zostera marina L. (eelgrass) to insitu manipulations of light intensity. Oecologia 55: 137-144.
Dennison W C, Orth R J, Moore K A, Stevenson J C, Carter V, Kollar S, Bergstrom P W and Batiuk R A (1993). Assessing water quality with submerged aquatic vegetation. Bioscience 43: 86-94.
Gordon D M, Chase S C, Grey K A and Simpson C J (1994). Changes to the structure and productivity of a Posidonia sinuosa seagrass meadow in Princess Royal Harbour, Western Australia, during and after imposed shading. (Environmental Protection Authority, Perth, Western Australia, 6000). Aquatic Botany 47: 265-275.
Harlin M M and Thorne-Miller B (1981). Nutrient enrichment of seagrass beds in a Rhode Island coastal lagoon. Marine Biology 65: 221-229.
Heijs F M L (1985). Some structural and functional aspects of the epiphytic component of four seagrass species (Cymodoceoideae) from Papua New Guinea. Aquatic Botany 23: 225-248.
Hillman K(1986). Nutrient load reduction, water quality and seagrass dieback in Cockburn Sound 1984-1985. (Department of Conservation and Environmental, Perth, Western Australia, 6000). Technical Series 5. Pp. 25.
Hillman K, Lukatelich R J, Bastyan G, and McComb A J (1991). Water quality and seagrass biomass, productivity and epiphyte load in Princess Royal Harbour, Oyster Harbour and King George Sound. (Environmental Protection Authority, Perth, Western Australia, 6000). Technical Series 39. Pp. 44.
18
Horner S M J (1987). Similarity of epiphyte biomass distribution on Posidonia and artificial seagrass leaves. Aquatic Botany 27: 159-167.
Jeffrey S W and Humphrey G F (1975). New Spectrophotometric Equations for Determining Chlorophylls 'a', 'b', 'cl' and 'c2' in Higher Plants, Algae and Natural Phytoplankton. Biochemie und Physiologie der Pflanzen 167: 191-194.
Kendrick G A (1991) Recruitment of coralline crusts and filamentous turf algae in the Galapagos archipelago: effect of simulated scour, erosion and accretion. Journal of Experimental Marine Biology and Ecology 147: 47-63.
Ken worthy W J and Haunert D E (1991). The light requirements of seagrasses: proceedings of a worksop to examine the capability of water quality criteria, standards and monitoring programs to protect seagrasses. (eds. W J Kenworthy and D E Haunert). NOAA Technical Memorandum NMFS-SERC-287.
Kirkman H (1981). The biology of Ecklonia radiata and other macrophytes of the sublittoral of southwestern Western Australia. (PhD thesis, Botany Department, University of Western Australia, Crawley, Western Australia, 6009). Pp. 256.
Kirkman H (1992). Large-scale restoration of seagrass meadows. In: Restoring the Nation's Marine Environment, (eds. G. W. Thayer). Maryland Sea Grant College, Maryland: 111-140.
LeProvost Environmental Consultants (1991). Seagrass density on Success Bank: Preliminary ground truthing and evaluation of sampling methods. (LeProvost Environmental Consultants, Como, Western Australia 6152). Report No. R341. Pp. 45.
Lethbridge R C, Borowitzka M A and Benjamin K J (1988). The development of an artificial, Amphibolis-like seagrass of complex morphology and preliminary data on its colonisation by epiphytes. Aquatic Botany 31: 153-168.
Manning C (1994). Light attenuation epiphyte biomass relationship. Report to the Water Authority of Western Australia. (Water Authority of Western Australia, Leederville, Western Australia, 6007). Pp. 6.
Masini R J, Burt J S and Simpson C J (1995a). Light and Posidonia sinuosa seagrass meadows in the temperate coastal waters of Western Australia: III. Minimum light requirements. (Environmental Protection Authority, Perth, Western Australia, 6000). Technical Series 65. (In press).
Masini R J, Cary J L, Simpson C J and McComb A J (1995b). Effects of light and temperature on the photosynthesis of temperate meadow-forming seagrasses in Western Australia. Aquatic Botany 49: 239-254.
May V, Collins A J, and Collett L C (1978). A comparative study of epiphytic algal communities of two common genera of seagrass in eastern Australia. Australian Journal of Ecology 3: 91-104.
Neverauskas V P (1987). Accumulation of periphyton biomass on artificial substrates deployed near a sewage sludge outfall in South Australia. Estuarine, Coastal and Shelf Science 25: 509-517.
Nielsen J and Lethbridge R (1989). Feeding and the epiphyte food resource of gastropods living on the leaves of the seagrass Amphibolis griffithii in south-western Australia. Journal of the Malacological Society of Australia 10: 47-58.
19
Orth R J and Moore K A (1983). Chesapeake Bay: an unprecedented decline in submerged aquatic vegetation. Science 222: 51-53.
Pearce R J (1991). Management of the marine environment in Western Australia: An ecosystem approach. Marine Pollution Bulletin 23: 567-572.
Silberstein K (1985). The effects of epiphytes on seagrasses in Cockburn Sound. (Environmental Protection Authority, Perth, Western Australia, 6000). Bulletin 135. Pp. 63.
Silberstein K, Chiffings A W and McComb A J (1986). The loss of seagrass in Cockburn Sound, Western Australia. III. The of epiphytes on productivity of Posidonia australis Hook. f. Aquatic Botany 24: 355-371.
Simpson C J and Masini R J (1990). (Ed) Albany Harbours Environmental Study. 1988-1989. (Environmental Protection Authority, Perth, Western Australia, 6000). Bulletin 412. Pp. 83.
Simpson C J, Burt J S, Cary J L, D'Adamo N, Masini R J and Mills D A (1993). Southern Metropolitan Coastal Waters Study - Progress report. (Environmental Protection Authority, Perth, Western Australia, 6000). Technical Series 53. Pp. 66.
Snedecor G W and Cochran W G (1967). Statistical methods. The Iowa State University Press, Ames, Iowa, USA. Pp. 593.
Sokal R R and Rohlf F J (1969). Biometry. The principle and practice of statistics in biological research. W. H. Freeman and Co, San Francisco. Pp. 776.
Steneck R S (1983). Escalating herbivory and resulting adaptive trends in calcareous algal crusts. Paleobiology 9: 44-61.
Steneck R S, Hacker S D and Dethier M W (1991). Mechanism of competitive dominance between crustose coralline algae: an herbivore-mediated competitive-reversal. Ecology 72: 938-950.
Strickland J D H and Parsons T R (1972). A practical handbook of seawater analysis. Second edition (Fisheries Research Board of Canada, Ottawa). Bulletin 167. Pp. 310.
Technicon Industrial Systems (1972). Nitrate + nitrite in water and seawater. Technicon Industrial Method 158-71 W / preliminary. Technicon Industrial Systems, Tarrytown, New York.
West R J (1990). Depth-related structural and morphological variations in an Australian Posidonia seagrass bed. Aquatic Botany 36: 153-166.
20
Appendix I Occurrence of macroalgal species on 12 leaves of P. sinuosa and on 12
artificial seagrass leaves, at sites 1 and 2 during summer and winter. Species occurrence on a seagrass leaf or plastic strip scores 1.
Site 1 Site 2 Seagrass Periphyton Seagrass Periphyton
SPECIES Summer Winter Summer Winter Summer Winter Summer Winter Rhodophyta (Coralline) Corallinales Fosliella spp. 12 12 12 12 7 11 7 Haliptylon cuvieri 9 0 8 0 1 0 0 Jania sp. 0 4 7 0 0 2 0 Metagoniolithon stelliferum 11 0 0 ,, 0 0 0 0 (Non-coralline) Nemaliales Helminthora australis 5 0 4 0 0 0 8 Gigartinales Hypnea sp. 2 0 2 1 0 5 1 Rhodymeniales -
Champia zostericola 1 0 1 0 0 0 0 Ceramiales Ceramiaceae Antithamnion verticale 0 2 1 4 0 0 0 Callithamnion sp. 0 0 1 0 0 0 0 Centroceras clavulatum 1 0 1 0 0 0 0 Ceramium australe 1 0 1 0 0 0 0 Ceramium cliftonianum 6 0 3 0 4 1 1 Ceramium filicinium 0 0 2 0 0 0 0 Ceramium monocanthum 1 0 1 0 0 0 0 Ceramium shepherdii 2 0 0 0 0 0 0 Griffithsia sp. 0 0 1 0 0 0 0 Griffithsia teges 0 4 0 0 0 0 0 Griffithsia ovalis 3 0 0 0 1 0 0 Ptilocladia australis 3 0 0 0 0 0 0 Spyridia filamentosa 3 0 0 0 0 0 0 Wrangelia sp. 1 0 0 0 0 0 0 Rhodomelaceae Chondria sp 1 0 0 4 0 0 0 3 Herposiphonia pectinella 4 0 0 0 9 0 10 Laurencia sp 1 5 0 1 0 12 3 6 Polysiphonia sp. 1 0 0 0 0 0 0 Polysiphonia decipiens 2 1 2 0 0 1 2 Polysiphonia shepherdii 0 0 1 0 4 0 0 Polysiphonia scopulorum 4 2 1 0 3 0 1 Phaeophyta Dictyotafurcellata 0 0 0 0 0 0 1 Dictyota sp. 4 1 0 0 5 0 1 Ectocarpus sp. 3 0 3 0 0 0 1 Ectocarpus fasiculatus 0 0 0 0 0 0 3 Elachista orbicularis 0 0 10 0 0 0 4 Feldmania irregularis 2 0 0 0 1 2 3 Giraudia sp. 4 0 7 0 1 0 10 Hinksia mitchelliae 1 0 4 0 2 2 9 Myrionema strangulans 3 0 0 0 0 1 7 Padina sp. 0 0 0 0 0 0 1 Ralfsia sp. 0 0 0 0 0 0 3 Sphacelariafurcigera 1 0 5 0 6 1 3 Sphacelaria rigidula 2 0 0 0 6 0 7 Sphacelaria tribuloides 0 0 0 0 0 0 1 Cyanophyta Blue green branched filament 1 0 1 0 0 0 3 Blue green filament 4 0 2 0 12 2 12 Blue green coccoid 0 0 0 7 0 1 10