Embed Size (px)
Citation preview
LIFO Adoption by Industry
Micah Frankel California State University, East Bay
Pei-Hui Hsu
California State University, East Bay
We use proxies representing different aspects of industries' production and investment opportunity set to gain insight regarding the variation in the use of LIFO among industries. We find that industry-average effective tax rate significantly affects the tendency toward the use of LIFO. We further find that firms in industry with lower inventory turnover rate and increasing price level are more likely to apply LIFO. Consistent with positive theory, we find that firms in industry with higher leverage ratio are less likely to adopt LIFO while firms in industry that rely heavily on CEO compensation are more likely to adopt LIFO. INTRODUCTION
A common phenomenon in LIFO adoption studies is the clustering of LIFO adoptions by firms in the same industry (Eggleton et al., 1976; Gosman, 1973). Although prior studies provide some insight on why firms select LIFO, the understanding as to why there is a cluster of LIFO adopters in some specific industry is still unclear (Biddle, 1980; Christie et al., 1994; Cushing et al., 1992; Gul, 2001; Niehaus, 1989). Given on the controversy over the recent repeal of LIFO, it is also not clear why firms remain on LIFO. Positive economic theory suggests that accounting methods are systematically related to certain characteristics of the firm and its industry (Watts et al, 1986). In this paper, we use proxies representing different aspects of industries' production/investment/financing opportunity set and examine how these factors affect the variation in the use of LIFO among diverse industries.
In contrast to past studies which use a firm's industry as an explanatory variable and measure whether or not a firm uses LIFO with a simple dichotomous response variable, we use the percentage of firms in a particular industry which use LIFO as the response variable and proxies for the industries' production and/or investment opportunity sets as predictor variables. For the ten industries in our sample, consistent with prior studies, we first find that industry average effective tax rate, and inventory turnover rate, appear to account for the variation in the use of LIFO among different industries (Cushing et al, 1992). Specifically, industry average effective tax rate plays an important role on mangers’ accounting choice. 1% increase in industry average GAAP effective tax rate results in 1.49% increase in the percentage of LIFO adoption in the industry.
International Financial Reporting Standards (IFRS) explicitly prohibits the use of LIFO after the revision of International Accounting Standards (IAS) in 2003, which result in a debate regarding the potential repeal of LIFO in U.S. Considering the cost of reconciliation to IFRS, we find that extent of foreign operation adversely influences the adoption of LIFO in a given industry. Besides, we examine how macroeconomic variables affect firms’ tendency toward LIFO. Our evidence suggests that change in industry specific
42 Journal of Accounting and Finance Vol. 15(5) 2015
inflation rate (PPI) significantly influence firms’ decision to use LIFO. When introducing leverage and management compensation variable in our test, we find that firms in industry with lower leverage and higher CEO compensation are more likely to use LIFO, which are consistent with the prediction of positive accounting theory.
We contribute to literature in two ways. First, we contribute to the literature examining the factors that affect the LIFO adoption among industries. Although earlier studies examine the economic factors that affect the LIFO adoption at the firm level, it is unclear why different industries have different rates of LIFO use. This paper extends the work of previous studies and provides evidence regarding the variation in the use of LIFO among diverse industries. We incorporate a wide range of variables and provide a comprehensive analyses regarding how firms’ accounting choice affected by industry characteristics. Consistent with prior study and positive accounting theory, we find that firms in industry with higher effective tax rate, lower inventory turnover rate, increasing price, lower leverage ratio, and higher CEO compensation are more likely to adopt LIFO.
Second, we contribute to the LIFO-related research. Although prior studies have noted the large clusters of LIFO firms, industry characteristics are either omitted or only taken into consideration by adding industry dummies in the regression (Cushing et al., 1992; Houmes et al., 2012; Jennings et al., 1996). Since our findings suggest that the adoption of LIFO is significantly affected by various industry characteristics, when conducting LIFO-related research, it is necessary to include industry characteristics. Researchers should include other industry macroeconomics characteristics, such as change in industry-specific production price.
The remainder of the paper is organized as follows. Section 2 discusses the background of LIFO and hypotheses development. Section 3 discusses our sample selection procedure and variable definitions, and provides summary statistics. In section 4, we outline the research design and present empirical results. Section 5 presents conclusions.
BACKGROUND AND HYPOTHESES DEVELOPMENT Historical Background and Recent Debate on LIFO
The theoretical basis for LIFO, the base stock method has been in use in the United Kingdom since the late 1800s (Davis, 1982). The theoretical motivation of the base stock method is that a company must maintain a certain minimum quantity (base stock) of inventory just to meet minimal operational needs. Consequently, this base stock will never be liquidated so long as the business is not liquidated. Under this premise, the inventory base stock is similar in nature to a fixed asset and therefore should be valued at the acquisition cost of the initial stock of inventory. Implementation of the base stock method requires management to designate how much of its inventory is base stock and what historical cost amount should be used to value the base stock.
Although LIFO has been adopted for years, recently, LIFO becomes an important topic because the potential repeal of LIFO (either directly or indirectly) as a consequence of adopting IFRS, is being considered by U.S. policymakers. The proponent of LIFO repeal believes that the elimination of LIFO could enhance financial reporting comparability by reducing the number of alternative accounting treatments available to firms. Arguments for LIFO abolishment also include that certain industries with little or no Cost of Goods Sold are unable to avail themselves of the potentially favorable tax effects of LIFO.1 The move towards adoption of IFRS in the US also presents a clear threat to the continued use of LIFO for U.S. companies. The other threat to LIFO’s existence comes from the current budget crisis in the U.S. and the related need to increase tax revenues. Since the primary benefit of LIFO is the deferral of taxes, it stands to reason that it would be an attractive target for those who are seeking means of closing the current budget deficit. In recent years, such calls for LIFO’s repeal for budgetary reasons have occurred with increasing frequency.
On the other hand, the opponents of LIFO repeal assert that the tax effect on certain industries could be unprecedented. In defending LIEO repeal, the LIFO Coalition argues that LIFO makes sense for companies that have large inventories with rising costs over time, or inventories that are held for a long time. Some specific examples would be oil, automobile or consumer goods companies. The opponents of LIFO repeal also believe that LIFO helps to eliminate phantom profits. FIFO does not take into account the increasing
Journal of Accounting and Finance Vol. 15(5) 2015 43
costs of replacing inventory, and therefore, often reports phantom profits.2 Finally, the LIFO Coalition argues that losing the tax benefits of LIFO and having to take back their LIFO reserves into income would cause substantial tax expenditures.3 Literature Review
Prior studies have examined factors influencing inventory accounting policy choice. Eggleton et al.(1976) has identified an association between industry membership and LIFO-FIFO choices. However, the paper reveals few if any reasons why different industries have different rates of LIFO use. Later on, Biddle (1980) examines the properties of year-end inventories and document that choices between LIFO and FIFO are influenced by managers' forecasts of associated future cash flows. He also finds that managers' decisions regarding year-end inventory levels are influenced by the tax-related cash-flow incentives provided by the LIFO and FIFO. Consistent with the findings from prior studies, Biddle et al.(1982) find that larger LIFO tax savings are found to be associated with larger cumulative excess returns over the year to which a LIFO adoption first applied.
Similarly, by focusing on firm-level analyses, Dopuch et al. (1988) find evidence that inventory choice is highly correlated to firms tax saving. They also find that the characteristics of firms’ operating, investment, and financing decisions affects the choice of accounting methods. More recently, Cushing et al.(1992) find that anticipated tax savings is the primary reason firms use LIFO. The larger the estimated tax saving, the more likely the firm adopts LIFO. They also provide evidence regarding the choice of LIFO and leverage. Firms with higher leverage are less likely to use LIFO method. Gul (2001) examines Jensen’s free cash flow hypothesis in managers’ choice of LIFO versus FIFO. He finds that firms with high free cash flow and high debt are less likely to choose FIFO than firms with high free cash flow and low debt.
In contrast to past studies which use a firm's industry as an explanatory variable and measure whether or not a firm uses LIFO with a simple dichotomous response variable, this study uses the percent of firms in a particular industry which use LIFO as the response variable and proxies for the industries' production and/or investment opportunity sets as predictor variables. Hypotheses Development
Since LIFO inventory accounting assumes that the newest (oldest) items purchased are the first to be sold. Under LIFO, a company’s ending inventory consists of the oldest-priced items on hand, and the cost of goods sold consists of the newest-priced items. As a result, relative to non-LIFO cost flow assumptions, in general, the use of LIFO will yield positive tax benefits under the following three conditions: Increasing prices for the inventory item, Positive effective tax rates, and Non-decreasing inventory levels.
Because the first necessary conditions for LIFO tax benefits is non-decreasing production prices, we hypothesize that, ceteris paribus, the rate of increase in industry-specific production price levels should be positively correlated with the proportion of firms using LIFO in that industry. LIFO tax savings are a function of the rate at which inventory costs are increasing, as a result, firms experiencing higher rates of inflation would have greater incentives to adopt LIFO. We use change in industry-specific production price (PPI) to proxy for production price level. Our hypothesis H1A is as follows.
H1A: Change in industry-specific production price level is positively related to the proportion of firms using LIFO in a specific industry.
The second necessary condition for LIFO tax benefits is a positive effective tax rate. LIFO firm can enjoy
the tax benefit only when it has positive effective tax rate, this implies the firm is currently paying taxes or expects to pay taxes in the near future. There is no tax advantage if the LIFO firm has negative tax rate. On the contrary, the higher the effective rate is, the more tax benefit the LIFO firm can generates. Therefore, we hypothesize that the higher the industry average effective tax rate is, the larger proportion of firms uses LIFO in that industry. Empirically we use industry average GAAP ETR and Cash ETR as measurement of effective tax rate for each industry. Our hypothesis H1B is as follows.
44 Journal of Accounting and Finance Vol. 15(5) 2015
H1B: Industry average GAAP ETR and Cash ETR are positively related to the proportion of firms using LIFO in a specific industry.
A third group of factors which affects the cash-flow benefits of LIFO use is future sales, profitability, and
inventory levels. In a growing company the tax benefits of LIFO could become a permanent tax deferral (Dopuch & Pincus, 1988). If industry inventory levels are expected to increase in the future, ceteris paribus given a positive effective tax rate and rising inventory prices, adoption of LIFO would be advantageous. However, a decrease in year-end inventory levels could cause a firm to eat into one or more LIFO layers and thus increase the amount of taxes the firm pays assuming the firm has a positive effective tax-rate. As a result, inventory turnover rate should be negative correlated with the proportion of firms using LIFO in that industry. We hypothesize ceteris paribus, that the industry-specific inventory turnover rate should be positively correlated with the proportion of firms using LIFO in that industry. Our hypothesis H1C is as follows.
H1C: Industry average inventory turnover rate is negatively related to the proportion of firms using LIFO in that industry.
As discuss above, in juxtaposition with the current international movement towards a global unification
of accounting standards, there has also been considerable domestic political debate regarding the potential repeal of LIFO. Since IFRS prohibits the use of LIFO, U.S. firms which operate internationally need to comply with IFRS by preparing the other set of financial statements, which is costly. As a result, we argue that firms in an industry which tend to have more foreign business are less likely to adopt LIFO. We use foreign sale (scaled by prior year total assets) to proxy for the extent of foreign business and our hypothesis two is as follows.
H2: Industry average foreign sale is negatively related to the proportion of firms using LIFO in that industry.
Positive accounting theory recognizes that accounting information is useful in contracting and that the
demands of contracting parties shape its properties (Watts and Zimmerman, 1986). When a firm approaches financial distress, debt covenant restricts a firm’s asset sales, mergers and acquisitions, or lines of business reduce the likelihood of asset substitution, etc. LIFO produces lower reported earnings. In order to avoid the violation of debt covenant, firms in industry with higher leverage ratio should be less likely to use LIFO. Thus, we hypothesize that firms in an industry with higher leverage level will be less likely to adopt LIFO. Empirically we use industry average debt to asset ratio as measurement of leverage level for each industry. This discussion leads to our hypothesis H3A.
H3A: Industry average debt to asset is negatively related to the proportion of firms using LIFO in that industry.
We are also interested in the effect of CEO compensation on the adoption of LIFO. Prior studies have
found a positive association between the switch to LIFO and security price (Biddle et al., 1982). Because mangers’ compensation plan is linked to firm’s security price, firms in industry that use substantial amount of compensation plan are more likely to adopt LIFO in order to boost their stock price. Although firms that adopt LIFO might report lower income, there is evidence indicates that the FIFO-based income continues to be used in determining the annual bonus after the firm switch from FIFO to LIFO (Abdel-Khalik, 1985). Furthermore, there is evidence that LIFO provides managers more opportunity to manage reported earnings (Hunt et al., 1996). Put together, we argue that firms in industry that use more bonus incentives are more likely to adopt LIFO. We use CEO cash compensation (salary plus bonus) as the proxy for CEO compensation and hypothesize that, on average, firms in an industry that use more cash compensation are be less likely to adopt LIFO.
Journal of Accounting and Finance Vol. 15(5) 2015 45
H3B: Industry average cash compensation is negatively related to the proportion of firms using LIFO in that industry.
DATA COLLECTION AND DESCRIPTIVE STATISTICS Data Collection
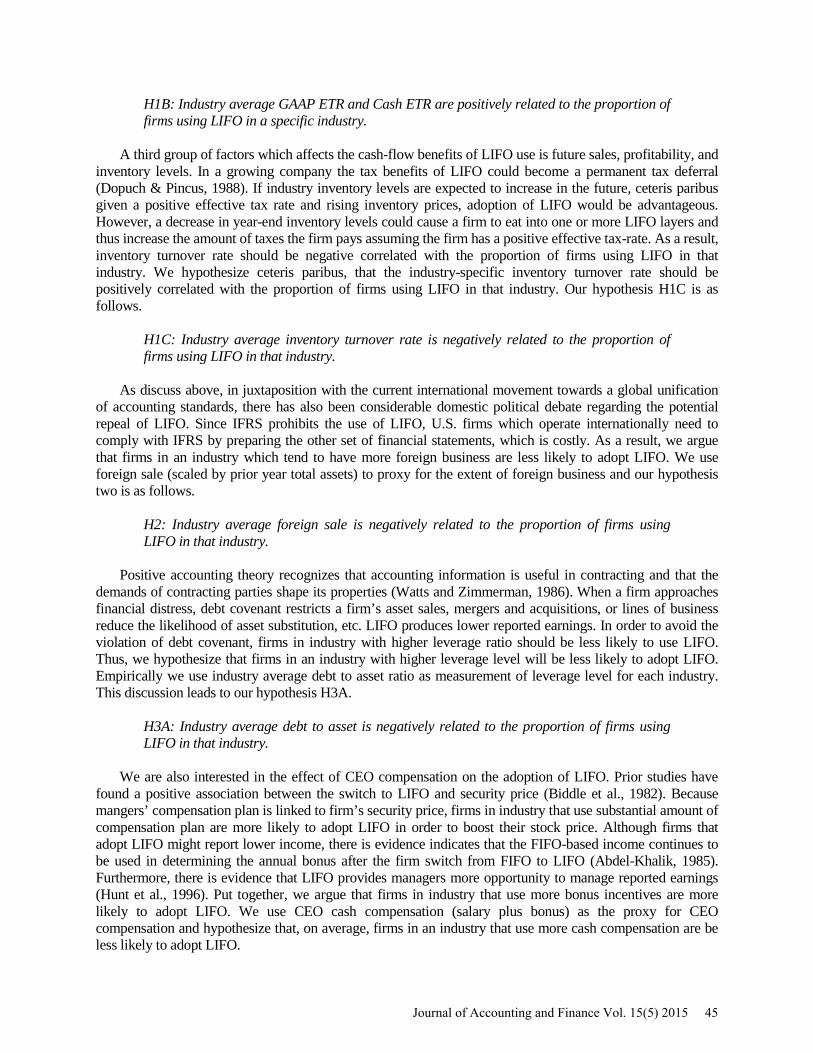
Data on our response variable - the proportion of firms using LIFO in specific industries - is obtained from Compustat during 1987 to 2012. We classify a firm as LIFO adopter if the firm discloses the amount of LIFO reverse in the current year. We eliminate utility and financial services industry because the LIFO reverse variable is not available. The industry producer price index (PPI) is obtained from Bureau of Labor Statistic (BLS). In this study, we focus on 10 industries that have 25 years PPI data from BLS database (1987-2012). Our final sample has 250 observations. See Table 1 for10 industries used in this study. COMPUSTAT provides firm-specific financial information to calculate all other variables.
TABLE 1
INDUSTRY USED
Industry NAICS Code 1 Oil and Gas extraction 211 2 Food manufacturing 311 3 Leather and allied production Manufacturing 316 4 Petroleum and coal products manufacturing 324 5 Chemicals manufacturing 325 6 Plastics and rubber products manufacturing 326 7 Nonmetallic mineral product manufacturing 327 8 Primary metal manufacturing 331 9 Fabricated metal product manufacturing 332 10 Furniture & related product manufacturing 337
Dependent Variables Measure
As a proxy for industry-specific production prices, we used the U.S. Department of Labor's industry-specific producer price indices. These indices are based on the net-output-weighted price index. The PPI measures the average change over time in the selling prices received by domestic producers for their output. The prices included in the PPI are from the first commercial transaction for many products and some services. The industry classification is based on the 3-digit categories in NAICS.4 We first find the listing of industry from the latest PPI News Release (http://www.bls.gov/news.release/ppi.t04.htm).By using one-screen/multi-screen data search tools for Industry Data (http://www.bls.gov/ppi/data.htm), we obtain the historical PPI data for each industry-year. The percentage change in PPI is measured as current year PPI minus previous year PPI and dividend by previous year PPI. Ceteris paribus, we expect that the percentage change in industry-specific PPI to be positively correlated with the proportion of firms in that industry using LIFO.
As a proxy for an industry's effective tax rate, we calculate industry average GAAP effective tax rate (GAAP ETR) and cash effective tax rate (CASH ETR). Following recent studies (Dyreng et al, 2010; McGuire et al., 2012), we calculate GAAP ETR by using the total tax expense divided by the sum of pre-tax book income before special items and CASH ETR by using the cash tax paid divided by the sum of pre-tax book income before special items.5 We then follow BLS Industry Classification and calculate the industry average CASH ETR and GAAP ETR for each year. Ceteris paribus, we expect the industry-specific CASH ETR and GAAP ETR to be positively correlated with the proportion of firms in that industry using LIFO.
46 Journal of Accounting and Finance Vol. 15(5) 2015
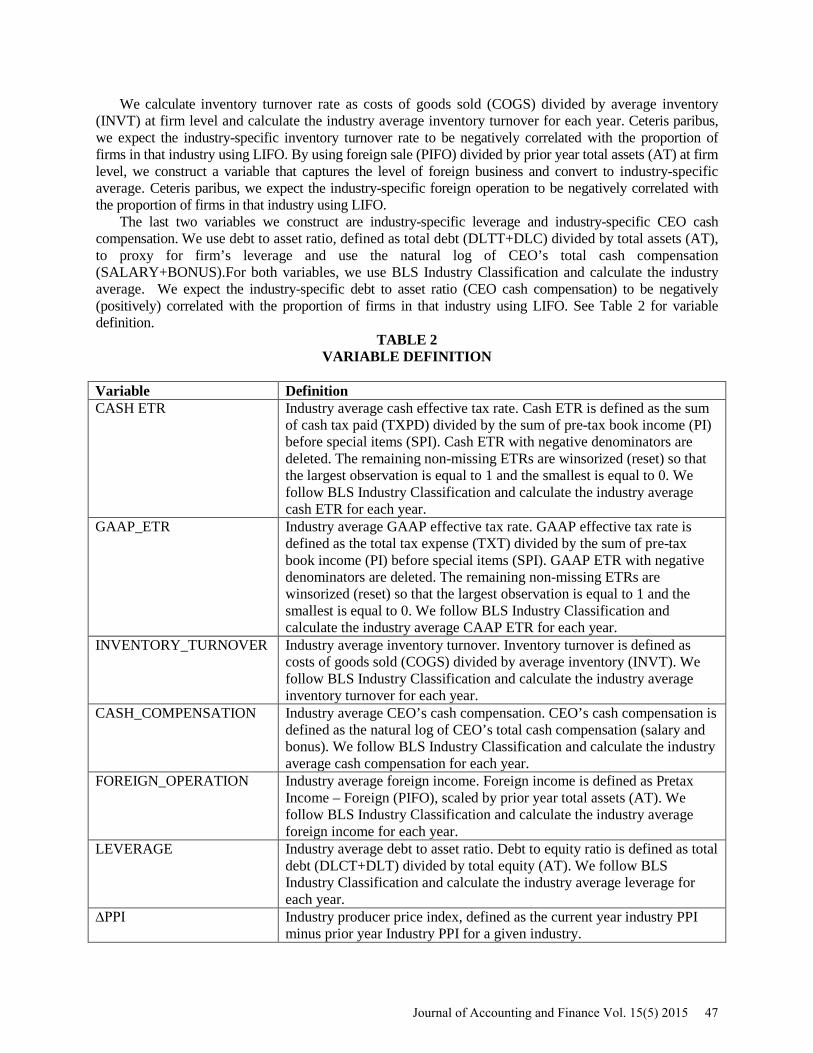
We calculate inventory turnover rate as costs of goods sold (COGS) divided by average inventory (INVT) at firm level and calculate the industry average inventory turnover for each year. Ceteris paribus, we expect the industry-specific inventory turnover rate to be negatively correlated with the proportion of firms in that industry using LIFO. By using foreign sale (PIFO) divided by prior year total assets (AT) at firm level, we construct a variable that captures the level of foreign business and convert to industry-specific average. Ceteris paribus, we expect the industry-specific foreign operation to be negatively correlated with the proportion of firms in that industry using LIFO.
The last two variables we construct are industry-specific leverage and industry-specific CEO cash compensation. We use debt to asset ratio, defined as total debt (DLTT+DLC) divided by total assets (AT), to proxy for firm’s leverage and use the natural log of CEO’s total cash compensation (SALARY+BONUS).For both variables, we use BLS Industry Classification and calculate the industry average. We expect the industry-specific debt to asset ratio (CEO cash compensation) to be negatively (positively) correlated with the proportion of firms in that industry using LIFO. See Table 2 for variable definition.
TABLE 2 VARIABLE DEFINITION
Variable Definition CASH ETR Industry average cash effective tax rate. Cash ETR is defined as the sum
of cash tax paid (TXPD) divided by the sum of pre-tax book income (PI) before special items (SPI). Cash ETR with negative denominators are deleted. The remaining non-missing ETRs are winsorized (reset) so that the largest observation is equal to 1 and the smallest is equal to 0. We follow BLS Industry Classification and calculate the industry average cash ETR for each year.
GAAP_ETR Industry average GAAP effective tax rate. GAAP effective tax rate is defined as the total tax expense (TXT) divided by the sum of pre-tax book income (PI) before special items (SPI). GAAP ETR with negative denominators are deleted. The remaining non-missing ETRs are winsorized (reset) so that the largest observation is equal to 1 and the smallest is equal to 0. We follow BLS Industry Classification and calculate the industry average CAAP ETR for each year.
INVENTORY_TURNOVER Industry average inventory turnover. Inventory turnover is defined as costs of goods sold (COGS) divided by average inventory (INVT). We follow BLS Industry Classification and calculate the industry average inventory turnover for each year.
CASH_COMPENSATION Industry average CEO’s cash compensation. CEO’s cash compensation is defined as the natural log of CEO’s total cash compensation (salary and bonus). We follow BLS Industry Classification and calculate the industry average cash compensation for each year.
FOREIGN_OPERATION Industry average foreign income. Foreign income is defined as Pretax Income – Foreign (PIFO), scaled by prior year total assets (AT). We follow BLS Industry Classification and calculate the industry average foreign income for each year.
LEVERAGE Industry average debt to asset ratio. Debt to equity ratio is defined as total debt (DLCT+DLT) divided by total equity (AT). We follow BLS Industry Classification and calculate the industry average leverage for each year.
∆PPI Industry producer price index, defined as the current year industry PPI minus prior year Industry PPI for a given industry.
Journal of Accounting and Finance Vol. 15(5) 2015 47
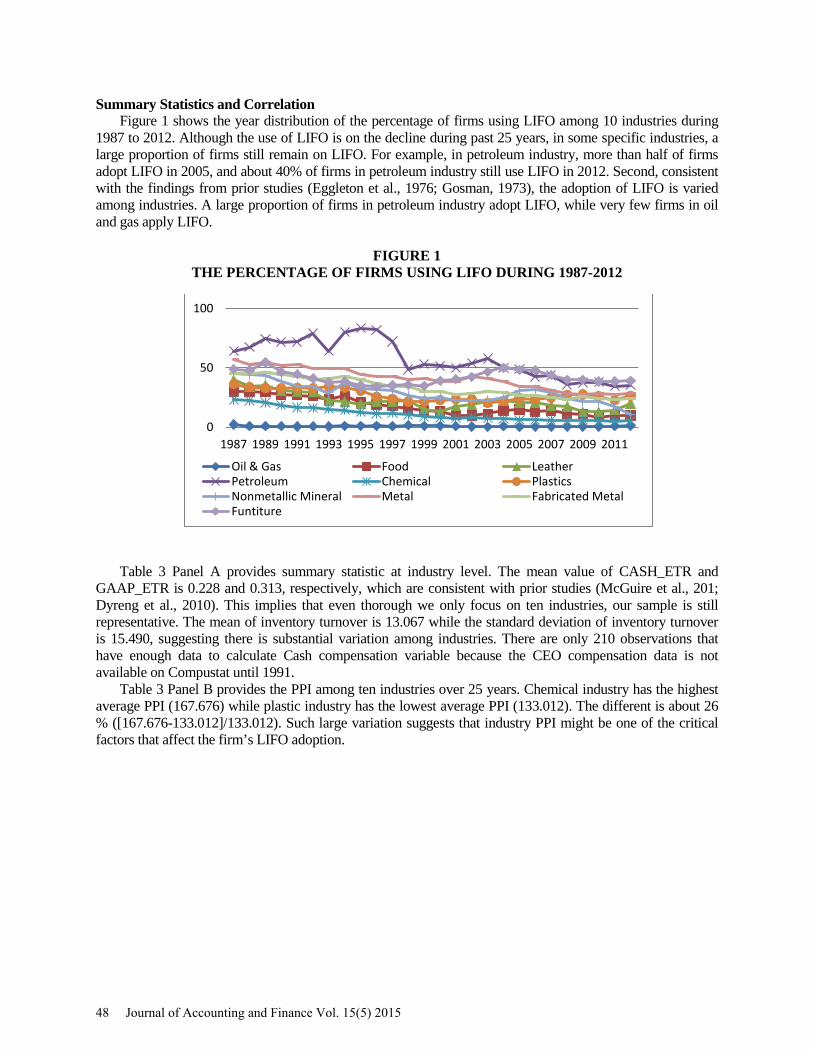
Summary Statistics and Correlation Figure 1 shows the year distribution of the percentage of firms using LIFO among 10 industries during
1987 to 2012. Although the use of LIFO is on the decline during past 25 years, in some specific industries, a large proportion of firms still remain on LIFO. For example, in petroleum industry, more than half of firms adopt LIFO in 2005, and about 40% of firms in petroleum industry still use LIFO in 2012. Second, consistent with the findings from prior studies (Eggleton et al., 1976; Gosman, 1973), the adoption of LIFO is varied among industries. A large proportion of firms in petroleum industry adopt LIFO, while very few firms in oil and gas apply LIFO.
FIGURE 1 THE PERCENTAGE OF FIRMS USING LIFO DURING 1987-2012
Table 3 Panel A provides summary statistic at industry level. The mean value of CASH_ETR and
GAAP_ETR is 0.228 and 0.313, respectively, which are consistent with prior studies (McGuire et al., 201; Dyreng et al., 2010). This implies that even thorough we only focus on ten industries, our sample is still representative. The mean of inventory turnover is 13.067 while the standard deviation of inventory turnover is 15.490, suggesting there is substantial variation among industries. There are only 210 observations that have enough data to calculate Cash compensation variable because the CEO compensation data is not available on Compustat until 1991.
Table 3 Panel B provides the PPI among ten industries over 25 years. Chemical industry has the highest average PPI (167.676) while plastic industry has the lowest average PPI (133.012). The different is about 26 % ([167.676-133.012]/133.012). Such large variation suggests that industry PPI might be one of the critical factors that affect the firm’s LIFO adoption.
0
50
100
1987 1989 1991 1993 1995 1997 1999 2001 2003 2005 2007 2009 2011
Oil & Gas Food Leather Petroleum Chemical Plastics Nonmetallic Mineral Metal Fabricated Metal Funtiture
48 Journal of Accounting and Finance Vol. 15(5) 2015
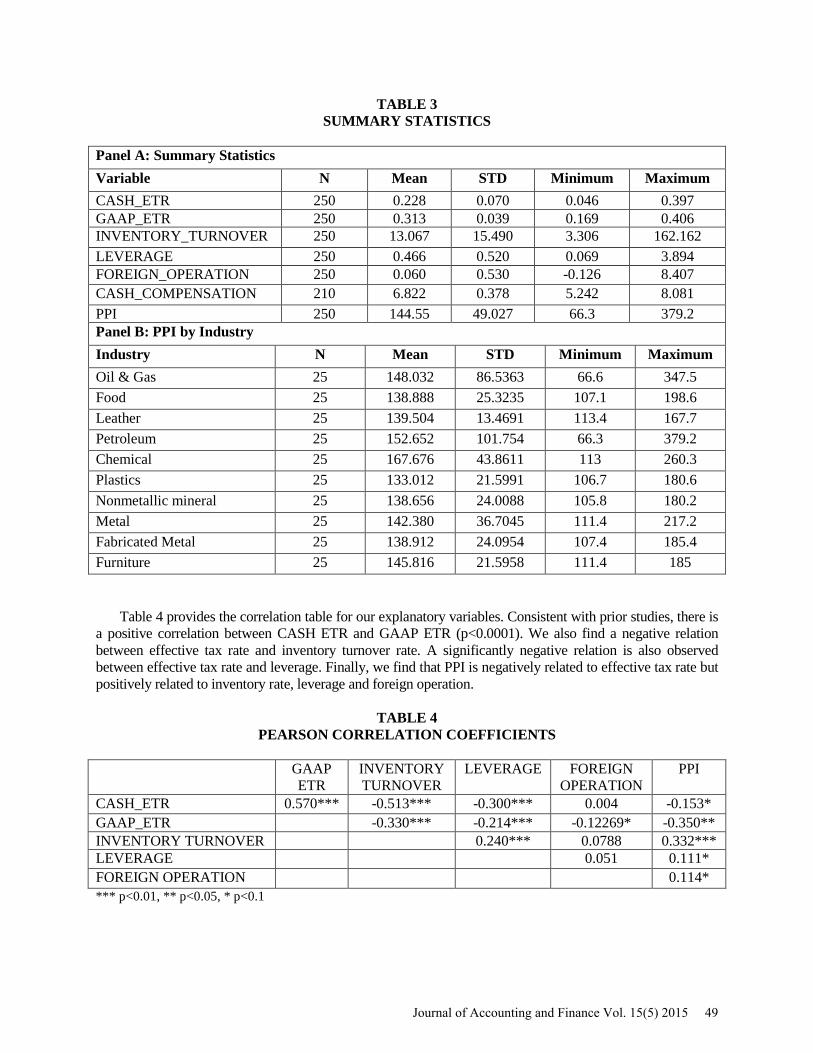
TABLE 3 SUMMARY STATISTICS
Panel A: Summary Statistics Variable N Mean STD Minimum Maximum CASH_ETR 250 0.228 0.070 0.046 0.397 GAAP_ETR 250 0.313 0.039 0.169 0.406 INVENTORY_TURNOVER 250 13.067 15.490 3.306 162.162 LEVERAGE 250 0.466 0.520 0.069 3.894 FOREIGN_OPERATION 250 0.060 0.530 -0.126 8.407 CASH_COMPENSATION 210 6.822 0.378 5.242 8.081 PPI 250 144.55 49.027 66.3 379.2 Panel B: PPI by Industry Industry N Mean STD Minimum Maximum Oil & Gas 25 148.032 86.5363 66.6 347.5 Food 25 138.888 25.3235 107.1 198.6 Leather 25 139.504 13.4691 113.4 167.7 Petroleum 25 152.652 101.754 66.3 379.2 Chemical 25 167.676 43.8611 113 260.3 Plastics 25 133.012 21.5991 106.7 180.6 Nonmetallic mineral 25 138.656 24.0088 105.8 180.2 Metal 25 142.380 36.7045 111.4 217.2 Fabricated Metal 25 138.912 24.0954 107.4 185.4 Furniture 25 145.816 21.5958 111.4 185
Table 4 provides the correlation table for our explanatory variables. Consistent with prior studies, there is
a positive correlation between CASH ETR and GAAP ETR (p<0.0001). We also find a negative relation between effective tax rate and inventory turnover rate. A significantly negative relation is also observed between effective tax rate and leverage. Finally, we find that PPI is negatively related to effective tax rate but positively related to inventory rate, leverage and foreign operation.
TABLE 4
PEARSON CORRELATION COEFFICIENTS
GAAP ETR
INVENTORY TURNOVER
LEVERAGE FOREIGN OPERATION
PPI
CASH_ETR 0.570*** -0.513*** -0.300*** 0.004 -0.153* GAAP_ETR -0.330*** -0.214*** -0.12269* -0.350** INVENTORY TURNOVER 0.240*** 0.0788 0.332*** LEVERAGE 0.051 0.111* FOREIGN OPERATION 0.114* *** p<0.01, ** p<0.05, * p<0.1
Journal of Accounting and Finance Vol. 15(5) 2015 49
EMPIRICAL MODELS AND RESULTS Test of Hypothesis 1
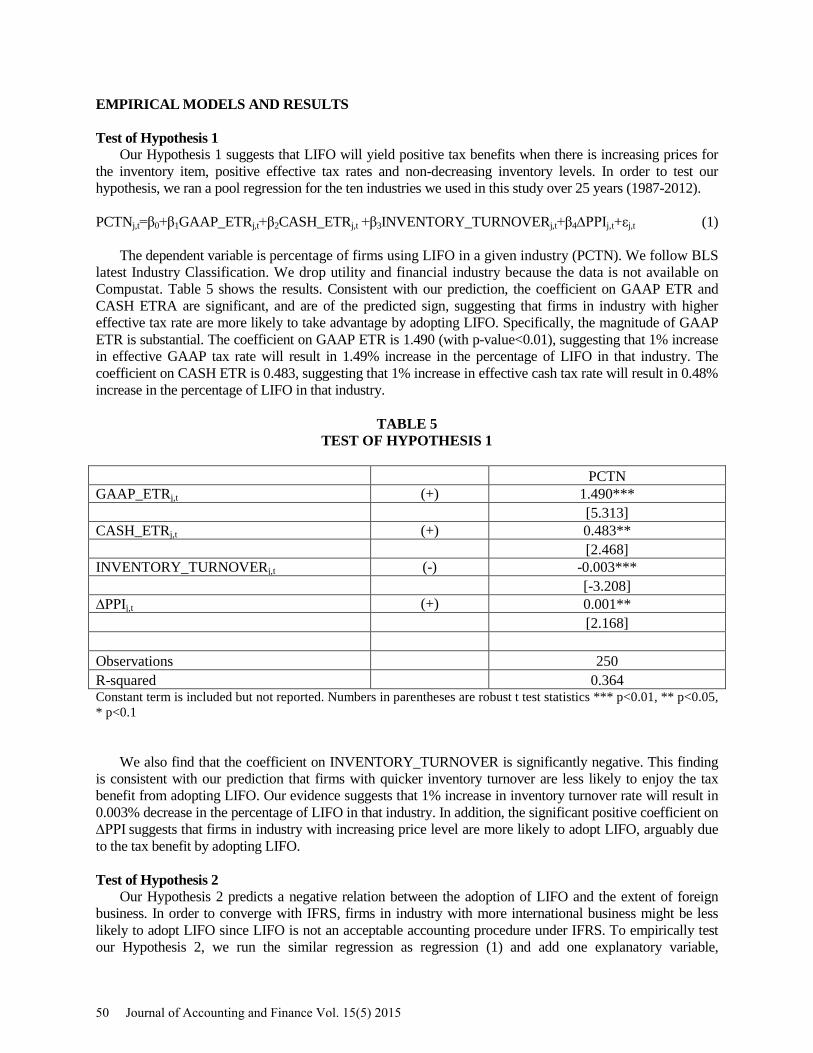
Our Hypothesis 1 suggests that LIFO will yield positive tax benefits when there is increasing prices for the inventory item, positive effective tax rates and non-decreasing inventory levels. In order to test our hypothesis, we ran a pool regression for the ten industries we used in this study over 25 years (1987-2012).
PCTNj,t=β0+β1GAAP_ETRj,t+β2CASH_ETRj,t +β3INVENTORY_TURNOVERj,t+β4∆PPIj,t+εj,t (1)
The dependent variable is percentage of firms using LIFO in a given industry (PCTN). We follow BLS latest Industry Classification. We drop utility and financial industry because the data is not available on Compustat. Table 5 shows the results. Consistent with our prediction, the coefficient on GAAP ETR and CASH ETRA are significant, and are of the predicted sign, suggesting that firms in industry with higher effective tax rate are more likely to take advantage by adopting LIFO. Specifically, the magnitude of GAAP ETR is substantial. The coefficient on GAAP ETR is 1.490 (with p-value<0.01), suggesting that 1% increase in effective GAAP tax rate will result in 1.49% increase in the percentage of LIFO in that industry. The coefficient on CASH ETR is 0.483, suggesting that 1% increase in effective cash tax rate will result in 0.48% increase in the percentage of LIFO in that industry.
TABLE 5
TEST OF HYPOTHESIS 1
PCTN GAAP_ETRj,t (+) 1.490***
[5.313]
CASH_ETRj,t (+) 0.483**
[2.468]
INVENTORY_TURNOVERj,t (-) -0.003***
[-3.208]
∆PPIj,t (+) 0.001** [2.168]
Observations 250 R-squared 0.364 Constant term is included but not reported. Numbers in parentheses are robust t test statistics *** p<0.01, ** p<0.05, * p<0.1
We also find that the coefficient on INVENTORY_TURNOVER is significantly negative. This finding
is consistent with our prediction that firms with quicker inventory turnover are less likely to enjoy the tax benefit from adopting LIFO. Our evidence suggests that 1% increase in inventory turnover rate will result in 0.003% decrease in the percentage of LIFO in that industry. In addition, the significant positive coefficient on ∆PPI suggests that firms in industry with increasing price level are more likely to adopt LIFO, arguably due to the tax benefit by adopting LIFO. Test of Hypothesis 2
Our Hypothesis 2 predicts a negative relation between the adoption of LIFO and the extent of foreign business. In order to converge with IFRS, firms in industry with more international business might be less likely to adopt LIFO since LIFO is not an acceptable accounting procedure under IFRS. To empirically test our Hypothesis 2, we run the similar regression as regression (1) and add one explanatory variable,
50 Journal of Accounting and Finance Vol. 15(5) 2015
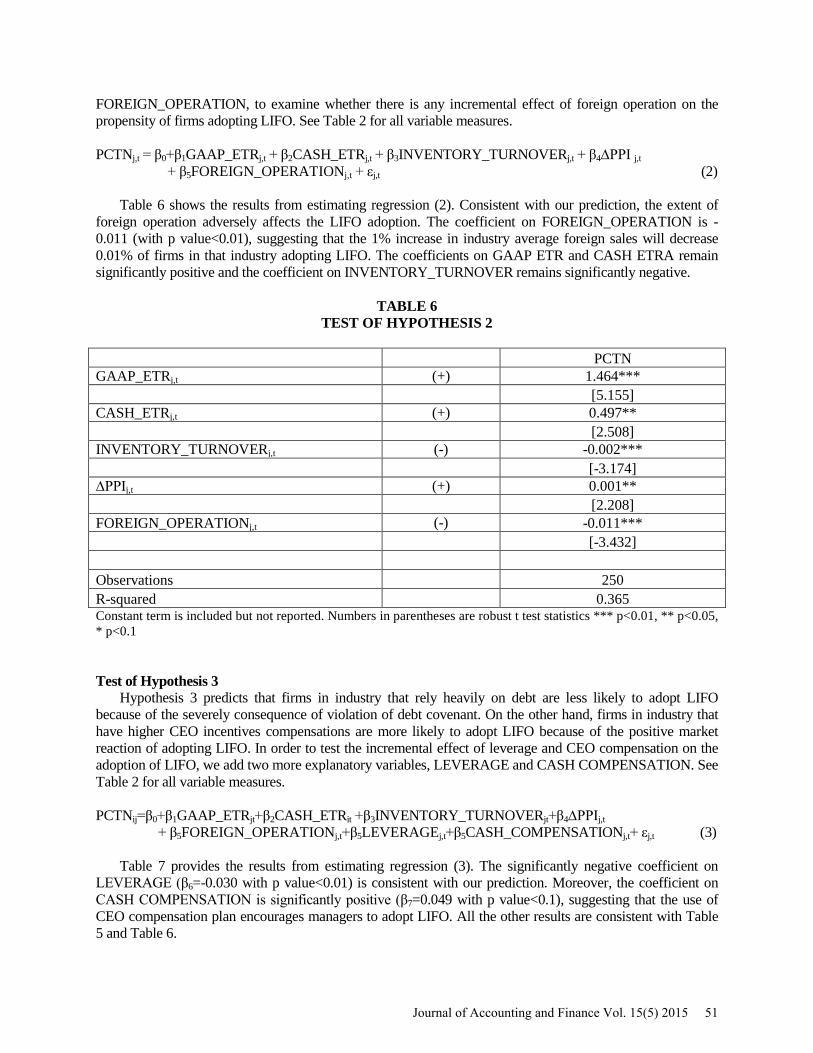
FOREIGN_OPERATION, to examine whether there is any incremental effect of foreign operation on the propensity of firms adopting LIFO. See Table 2 for all variable measures.
PCTNj,t = β0+β1GAAP_ETRj,t + β2CASH_ETRj,t + β3INVENTORY_TURNOVERj,t + β4∆PPI j,t + β5FOREIGN_OPERATIONj,t + εj,t (2)
Table 6 shows the results from estimating regression (2). Consistent with our prediction, the extent of foreign operation adversely affects the LIFO adoption. The coefficient on FOREIGN_OPERATION is -0.011 (with p value<0.01), suggesting that the 1% increase in industry average foreign sales will decrease 0.01% of firms in that industry adopting LIFO. The coefficients on GAAP ETR and CASH ETRA remain significantly positive and the coefficient on INVENTORY_TURNOVER remains significantly negative.
TABLE 6
TEST OF HYPOTHESIS 2
PCTN GAAP_ETRj,t (+) 1.464***
[5.155]
CASH_ETRj,t (+) 0.497**
[2.508]
INVENTORY_TURNOVERj,t (-) -0.002***
[-3.174]
∆PPIj,t (+) 0.001**
[2.208]
FOREIGN_OPERATIONj,t (-) -0.011*** [-3.432]
Observations 250 R-squared 0.365 Constant term is included but not reported. Numbers in parentheses are robust t test statistics *** p<0.01, ** p<0.05, * p<0.1 Test of Hypothesis 3
Hypothesis 3 predicts that firms in industry that rely heavily on debt are less likely to adopt LIFO because of the severely consequence of violation of debt covenant. On the other hand, firms in industry that have higher CEO incentives compensations are more likely to adopt LIFO because of the positive market reaction of adopting LIFO. In order to test the incremental effect of leverage and CEO compensation on the adoption of LIFO, we add two more explanatory variables, LEVERAGE and CASH COMPENSATION. See Table 2 for all variable measures. PCTNij=β0+β1GAAP_ETRjt+β2CASH_ETRit +β3INVENTORY_TURNOVERjt+β4∆PPIj,t
+ β5FOREIGN_OPERATIONj,t+β5LEVERAGEj,t+β5CASH_COMPENSATIONj,t+ εj,t (3)
Table 7 provides the results from estimating regression (3). The significantly negative coefficient on LEVERAGE (β6=-0.030 with p value<0.01) is consistent with our prediction. Moreover, the coefficient on CASH COMPENSATION is significantly positive (β7=0.049 with p value<0.1), suggesting that the use of CEO compensation plan encourages managers to adopt LIFO. All the other results are consistent with Table 5 and Table 6.
Journal of Accounting and Finance Vol. 15(5) 2015 51
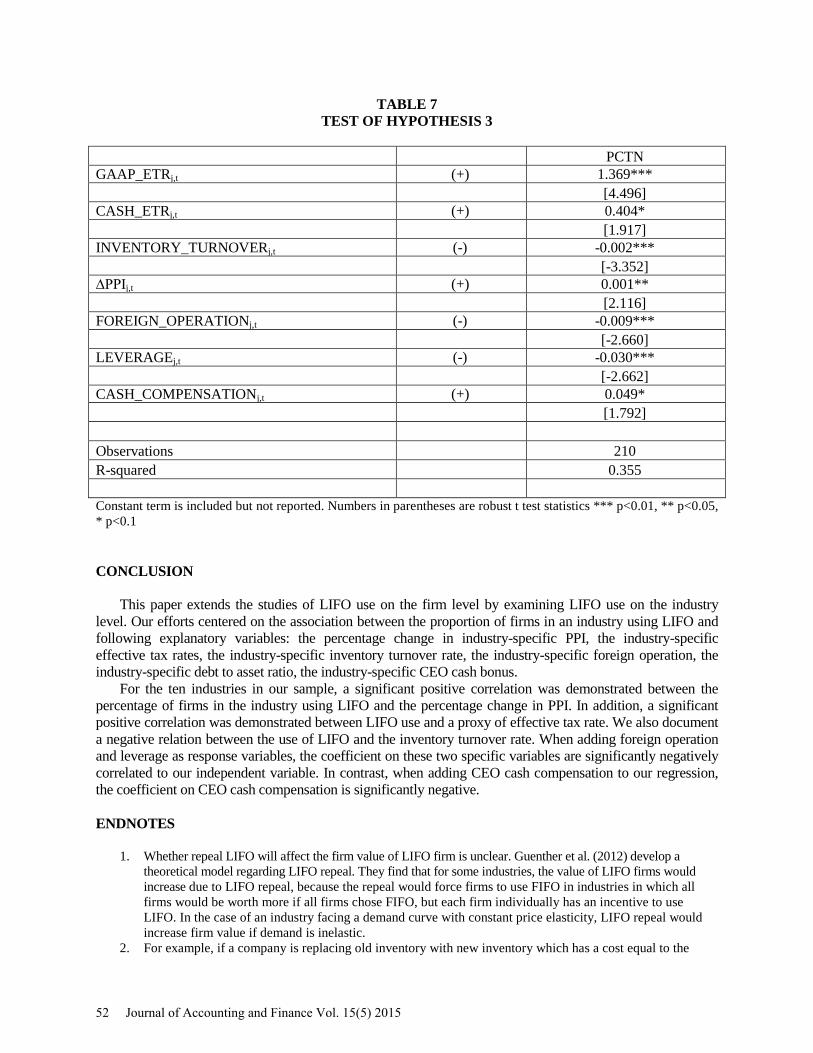
TABLE 7 TEST OF HYPOTHESIS 3
PCTN
GAAP_ETRj,t (+) 1.369***
[4.496]
CASH_ETRj,t (+) 0.404*
[1.917]
INVENTORY_TURNOVERj,t (-) -0.002***
[-3.352]
∆PPIj,t (+) 0.001** [2.116] FOREIGN_OPERATIONj,t (-) -0.009***
[-2.660]
LEVERAGEj,t (-) -0.030*** [-2.662] CASH_COMPENSATIONj,t (+) 0.049* [1.792]
Observations 210 R-squared 0.355 Constant term is included but not reported. Numbers in parentheses are robust t test statistics *** p<0.01, ** p<0.05, * p<0.1 CONCLUSION
This paper extends the studies of LIFO use on the firm level by examining LIFO use on the industry
level. Our efforts centered on the association between the proportion of firms in an industry using LIFO and following explanatory variables: the percentage change in industry-specific PPI, the industry-specific effective tax rates, the industry-specific inventory turnover rate, the industry-specific foreign operation, the industry-specific debt to asset ratio, the industry-specific CEO cash bonus.
For the ten industries in our sample, a significant positive correlation was demonstrated between the percentage of firms in the industry using LIFO and the percentage change in PPI. In addition, a significant positive correlation was demonstrated between LIFO use and a proxy of effective tax rate. We also document a negative relation between the use of LIFO and the inventory turnover rate. When adding foreign operation and leverage as response variables, the coefficient on these two specific variables are significantly negatively correlated to our independent variable. In contrast, when adding CEO cash compensation to our regression, the coefficient on CEO cash compensation is significantly negative.
ENDNOTES
1. Whether repeal LIFO will affect the firm value of LIFO firm is unclear. Guenther et al. (2012) develop a theoretical model regarding LIFO repeal. They find that for some industries, the value of LIFO firms would increase due to LIFO repeal, because the repeal would force firms to use FIFO in industries in which all firms would be worth more if all firms chose FIFO, but each firm individually has an incentive to use LIFO. In the case of an industry facing a demand curve with constant price elasticity, LIFO repeal would increase firm value if demand is inelastic.
2. For example, if a company is replacing old inventory with new inventory which has a cost equal to the
52 Journal of Accounting and Finance Vol. 15(5) 2015
current selling price, the company would not actually be making any profit. However, if the company were using FIFO rather than LIFO, they would be reporting cost of goods sold at past prices, and presenting an unfair portrayal of profits; thus, phantom profits.
3. West, Jade C. "Response to Request for Comment Included in May 26, 2011, Securities and Exchange Commission Staff Paper." Letter to Security and Exchange Commission. 12 Aug. 2011. MS.
4. Where further aggregation of industries is not available, it is because PPI does not have complete coverage of the sector (Lana Borgie Economist, Producer Price Index).
5. Cash ETR and GAAP ETR with negative denominators are deleted. The remaining non-missing ETRs are winsorized (reset) so that the largest observation is equal to 1 and the smallest is equal to 0.
REFERENCES Abdel-Khalik, A. R. (1985). The effect of LIFO-switching and firm ownership on executives' pay.
Journal of Accounting Research, 23(2), 427-447. Biddle, C., & Lindahl, F. W. (1982). Stock Price Reactions to LIFO Adoptions: The Association between
Excess Returns and LIFO Tax Savings. Journal of Accounting Research, 20(2), 551-588. doi: 10.2307/2490886
Biddle, G. C. (1980). Accounting methods and management decisions: The case of inventory costing and inventory policy. Journal of Accounting Research, 235-280.
Christie, A. A., & Zimmerman, J. L. (1994). Efficient and Opportunistic Choices of Accounting Procedures: Corporate Control Contests. The Accounting Review, 69(4), 539-566. doi: 10.2307/248431
Cushing, B. E., & LeClere, M. J. (1992). Evidence on the Determinants of Inventory Accounting Policy Choice. The Accounting Review, 67(2), 355-366. doi: 10.2307/247729
Cushing, B. E., & LeClere, M. J. (1992). Evidence on the determinants of inventory accounting policy choice. Accounting Review, 355-366.
Davis, H. Z. (1982). HISTORY OF LIFO. The Accounting Historians Journal, 9(1), 1-23. doi: 10.2307/40697709
Dopuch, N., & Pincus, M. (1988). Evidence on the choice of inventory accounting methods: LIFO versus FIFO. Journal of Accounting Research, 26(1), 28-59.
Dyreng, S. D., Hanlon, M., & Maydew, E. L. (2010). The Effects of Executives on Corporate Tax Avoidance. The Accounting Review, 85(4), 1163-1189. doi: 10.2308/accr.2010.85.4.1163
Eggleton, I. R., Penman, S. H., & Twombly, J. R. (1976). Accounting changes and stock prices: an examination of selected uncontrolled variables. Journal of Accounting Research, 66-88.
Gosman, M. L. (1973). Characteristics of firms making accounting changes. The Accounting Review, 48(1), 1-11.
Gul, F. A. (2001). Free cash flow, debt-monitoring and managers' LIFO/FIFO policy choice. Journal of Corporate Finance, 7(4), 475-492. doi: http://dx.doi.org/10.1016/S0929-1199(01)00037-2
Houmes, R., Dickins, D., & O'Keefe, R. (2012). New evidence on the incremental information content of earnings reported using the LIFO inventory method. Advances in Accounting, 28(2), 235-242. doi: http://dx.doi.org/10.1016/j.adiac.2012.09.005
Hunt, A., Moyer, S. E., & Shevlin, T. (1996). Managing interacting accounting measures to meet multiple objectives: a study of LIFO firms. Journal of Accounting and Economics, 21(3), 339-374.
Jennings, R., Simko, P. J., & Robert, B. T., II. (1996). Does LIFO Inventory Accounting Improve the Income Statement at the Expense of the Balance Sheet? Journal of Accounting Research, 34(1), 85-109. doi: 10.2307/2491333
McGuire, S. T., Omer, T. C., & Wang, D. (2012). Tax Avoidance: Does Tax-Specific Industry Expertise Make a Difference? The Accounting Review, 87(3), 975-1003. doi: 10.2308/accr-10215
Niehaus, G. R. (1989). Ownership structure and inventory method choice. Accounting Review, 269-284. Watts, R., & Zimmerman, J. (1986). Positive accounting theory.
Journal of Accounting and Finance Vol. 15(5) 2015 53