Embed Size (px)
Citation preview

Annual Report2013
Together… wherever
Lifelong Relationship...عالقة ُعُمر...

Fenicia Bank Annual Report
2013
3
FENICIA BANK S.A.L.Annual Report 2013

Fenicia Bank Annual Report2013
4
TABLE OF CONTENTS
Fenicia Bank Annual Report
2013
5
Chairman’s Letter 06
Board of Directors & Management 08
Corporate Governance 14
Highlights, Charts and Performance Review 26
Financial Statements & Notes 38
Correspondent Banks & Addresses 112

Fenicia Bank Annual Report2013
6
INTRODUCTION

Fenicia Bank Annual Report
2013
7
Fifty is the age where we reflect upon our achievements. Where we accept our failures and finally take pride in our successes. Where our soft spots become strengths and our shortcomings, mere stepping stones towards higher grounds. Most of all, we think about the people that have crossed our path, appreciating the way we have grown together and mutually enriched one another.
At Fenicia Bank, we can proudly say after half a century that we build our relationships on the long run, with well-earned trust, constant availability and a flexibility that fits every client’s personal needs. We strive to support you in your achievements and life realizations, guided only by our integrity and high quality standards.
No detail is small enough, no task too difficult when it comes to your satisfaction. Every person that crosses our door is a potential friend, one that we intend to keep close and happy, For generations to come.

Fenicia Bank Annual Report2013
8
Dear Stakeholders,
As we disclose the bank financial performance for 2013, we feel proud to record another successful year where our figures grew notably compared to 2012. During last year, we invigorated our potentials and utilized the opportunities to achieve our objectives, guided by the visionary yet pragmatic strategy and the scrupulous yet dynamic management.
The mission was not simple, especially with the continued state of tumult in the region. The Lebanese banking sector retained its ability to serve both the private and public sectors adequately, hence achieving a healthy growth in its balance sheet of 8.5% to reach almost USD 165 billion by the end of 2013. Fenicia Bank, in parallel with the sector, registered a growth rate of 9%. Our customer deposit base expanded by 7% to almost USD 1.2 billion and it composed a significant 83% of the balance sheet.
As for our loan portfolio, the growth of 14.5% was momentous in 2013 and way ahead of the sector. We outperformed ourselves relative to 2012 where the portfolio increased then by a mere 4%. This resulted in a noteworthy Loan to Deposit ratio of 32%. A simple analysis of this improvement will certainly highlight the effects of our in-house restructuring of the different loan related divisions at all levels. In parallel, we utilized efficiently the new loans offered by the Central Bank to the commercial banks based on intermediate circular 313 and its subsequences, especially that they were deployed to stimulate the different productive and residential economic sectors, which aligns with our mission of contributing to
CHAIRMAN’S LETTER
Fenicia Bank Annual Report
2013
9
our economy. The expansion in the loan portfolio was not at the detriment of its quality. The non-performing loans constituted around 6% of total loans with provisions against those NPLs reaching 53% excluding cash collaterals and real estate guarantees. Within the same context and retail wise, we revived a marketing campaign for our products and services and launched a new specialized car-loan program with advantageous conditions.
On the profitability front, our net profits rose by 6% to almost USD 14 million, leading to considerable post-tax ROaE and ROaA of 12.49% and 1.02% respectively. The shareholders’ equity balance boosted by around 10% characterized by its 100% CET1 components. Furthermore, the bank revealed an assuring capital adequacy ratio of 16.06% and a convenient leverage ratio of 7.52%.
2013 was complementary to its precedent in our rigorous efforts to affirm governance practices. We established the Compliance Unit and enriched it with distinguished management from the field, stressing our strategic priority of complying with local regulations and international best practices on one hand, and combating money laundering and crime financing on the other hand. Furthermore, we updated several policies and procedures and smoothly communicated them to our staff, namely “Code of Conduct Policy”, “Whistle blowing Policy” and “Conflict of Interest Policy”. Finally, we restructured our organizational hierarchy to better facilitate the flow of operations and the communication among the various business lines.
Given the dynamic banking industry, we have always considered empowering our human capital with updated knowledge and skills as a strategic objective. Throughout 2013, our staff attended numerous courses and training programs with top notch local and international firms. In addition to the in-house training sessions and workshops which facilitated the exchange of knowledge and expertise among all employees.
Within our business strategies and plans, our corporate social responsibility has always been at the core. In 2013, we were privileged to support several organizations and participate in many events that enhanced social and cultural interaction, educational and academic incentives, and athletic spirit.
As a final note, we are grateful to our shareholders for their support and trust, our employees for their incessant efforts and most importantly our clients for their confidence and loyalty by which we have built a lifelong relationship that we cherish as our utmost wealth.
Abdul Razzak AchourChairman and General Manager

Fenicia Bank Annual Report2013
10
BOARD OF DIRECTORS& MANAGEMENT

Fenicia Bank Annual Report
2013
11
• Lebanese, born in 1938. • Non Executive Board Member at Fenicia Bank s.a.l. and member of the Audit
Committee.• Board Member of Bellevue Company s.a.l. (Real Estate Company). • Driven by ambition and entrepreneurship, he is the owner of a recognizable
company chain in Africa (DRC), (Manufacturing, Electronic Devices, Clothes, and Shoes).
• Pioneer investor in the Lebanese real estate sector through financing the construction of a variety of big projects all across Lebanon.
• Lebanese, born in 1965. • Chairman of the Board of Directors and General Manager of Fenicia Bank s.a.l.
since 1994.• Chairman of several committees namely: Assets and Liabilities (ALCO), Anti Money
Laundry, Credit Rating, and Credit.• Chairman of the Board and General Manager of Bellevue Company s.a.l (Real
Estate Company).• Board member of Trust Construction Company s.a.l. (Construction Company).• Board member in Achour Group (Trade, Manufacturing, Transportation and
Construction).• Member of World Union of Arab Bankers.• Board member of the Lebanese Banking Association for more than 15 years.• Committed to the civil society and to social responsibility, Mr. Achour serves as a
Board Member in the Children Cancer Center – Lebanon (CCCL).• Through his career in the banking and non banking sector, Mr. Achour is recognized
for his strategic vision, leadership skills, and innovative way of doing business.• Holder of Bachelor Degree in Business Administration and Accounting from Lucien
Coormans Institute - Brussels and a degree in International Commerce Studies from ICAD – Paris.
• Lebanese, born in 1958. • Major shareholder at Fenicia Bank s.a.l.• Non Executive Board Member of Fenicia Bank s.a.l.• Board Member at Bellevue Co. s.a.l. (Real Estate Company). Also a Board Member
in Achour Group, managing and co-managing several affiliated companies dealing with different lines of business with international trade exposure.
• Serves as a Board Member in different organizations specifically in sports field. He is currently the president of “Al Sadaka” sporting club (Beirut-Lebanon) and the President of The Handball Federation in Lebanon.
Mr. Abdul Razzak Mahmoud Achour
Mr. AbdallahMahmoud Achour
Mr. YoussefAbbas Merhi

Fenicia Bank Annual Report2013
12
• Lebanese, born in 1940. • Non Executive Board Member at Fenicia Bank s.a.l. and member of the Audit
Committee.• Board Member of Bellevue Company s.a.l. (Real Estate Company). • Being an ambitious businessman and bold entrepreneur, he owns a Farm and Real
Estate agency in the region of Bekaa – Lebanon. Also, Owner of Dada Company in DRC, and owner of a recognizable company chain in Africa (DRC), (Manufacturing, Electronic Devices, Clothes, Shoes).
• Holder of several rewards including the highest reward in DRC: “Chevalier de l’ordre National du Leopard” as an appreciation of his achievements in the commerce and industry sectors.
• Lebanese born in 1938. • Independent Board Member at Fenicia Bank s.a.l.• Chairman of several committees namely: Governance & Remuneration, Audit.• Chairman & General Manager of Intra Investment Co s.a.l.• Member of the Board of Directors of Jammal Trust Bank s.a.l., Byblos Bank DRC
and Casino du Liban.• Member of World Union of Arab Bankers.• Fifty-three years of experience in several banking and financial institutions, where
he served as the general manager or director in the board.• Professor at the Lebanese University, Faculty of Economics and Business
Administration.• Holder of PHD in Business and Economics from Aix-En Provence – France.
• Lebanese, born in 1953. • Assistant General Manager of Fenicia Bank since 2002, executive member of its
Board of Directors since 2012, and member of several committees.• Held leading positions in different local and international banks: Al Ahli Bank of
Qatar- Doha, Mashreq Bank - Doha, Mashreq Bank – Dubai. Also in the non banking sector: Geonex International Incorporated, Florida, USA, and Middle East Banking Company, Beirut, Lebanon.
• Professor in different universities: Lebanese University, Islamic University of Lebanon and Lebanese International University.
• Holder of PHD in Economics from the American University of London, MBA from University of New Hampshire, BA in Accounting & Finance and BA in Marketing & Administration from the Lebanese University, and Diploma in Banking studies and Central Bank Regulations from Saint Joseph University.
Dr. Mohamed AbdulHassan Cheaib
Mr. Aziz Nadra Macaron
dr. Asaad AbdelHassan Koshaish

Fenicia Bank Annual Report
2013
13
• Lebanese, born in 1946. • Assistant General Manager of Fenicia Bank since 2002, executive member of its
Board of Directors since 2012.• Member of several committees namely: Risk and Governance Committies.• Joined Fenicia Bank s.a.l. in July 1992 and held the position of Branches and
Organization Manager.• Held many senior positions in different banks: Jammal Trust Bank s.a.l., Bank of
Beirut s.a.l., Societe Nouvelle de la Banque de Syrie et du Liban. • Holder a Bachelor Degree in Chemistry from the Lebanese University.
• Lebanese, born in 1948. • Independent Board Member of Fenicia Bank s.a.l. since 2012.• Chairman of Risk Committee and member of Governance committee.• He currently holds several senior positions in different Academic institutions
namely: Provost for Faculty Affairs at the Lebanese American University, Professor of strategic Management, Advisor to the President of AACSB (The US-based Business School Accreditation Body) in the Middle East and Africa. Also, member of the Board of trustees of several GCC universities in Bahrain, UAE and Oman.
• Member of the Board of the National Bank of Kuwait (Lebanon).• Holder of PHD in General Management from the University of Southern California,
MBA Degree from the American University of Beirut.• Holder of John Fernandes Strategic leadership award by the academy of Strategic
and Entrepreneurial Leadership in the US for the year 2012.
• Lebanese-French born in 1949. • Independent Board Member of Fenicia Bank s.a.l. since 2012.• Member of the Risk and Audit Committees.• Chairman and General Manager of the Société Financière du Liban (Group of 40
Banks). Also a Board member of Intra Investment Company, Casino Du Liban, Jammal Trust Bank s.a.l., Ameen s.a.l., Société Foncière et Financière du Port de Beyrouth, Société Mixte du Froid, Société Foncière du Liban, and Société Foncière Franco Libanaise.
• Had an extensive financial consulting experience for more than 20 years in Merrill Lynch in Lebanon and France.
• Holder of Bachelor Degree in Business Administration from the American University of Beirut.
Dr. GeorgeKhalil Najjar
Mr. MohsenChafic Naamani
Mr. MichelFouad Ferneini

Fenicia Bank Annual Report2013
14
Mr. Abdul Razzak ACHOURChairman - General Manager
Mr. Mohsen NAAMANIAssistant General Manager
Dr. Asaad KOSHAISHAssistant General Manager
Mr. Muhieddine ARNAOUTLegal Affairs - Senior Manager
Mrs. Hala Achour SAFIEDDINEAdministration & H.R. Manager
Mr. Izzat MSHEIKRisk Manager
Mr. Bilal SBEITYInternal Audit Unit Manager
Dr. Paul MORCOSHead of Compliance Dept.
Shareholders
Achour GroupMaacaron GroupMerhi GroupDr. Mohamad CheaibOthers
Shares in Capital
74.00 %15.00 %10.00 %0.98 %0.02 %
Nationality
LebaneseLebaneseLebaneseLebanese
-
BANK’S OWNERSHIP
MANAGEMENT
Mr. Hachem FADLALLAHInternational Trade Manager
Mrs. Nada KARAKIOperations & Treasury Manager
Mrs Samar HAMDANAccounting Manager
Dr. Antoine KARAMRetail Banking Manager
Mr. Sami BACHIRCorporate & SME Credit Manager
Dr. Samir BARAKATSpecialized Loans Manager
Mr. Houssam RAMADANInformation Technology Manager
Mrs. Rania SAABProduct Development Manager

Fenicia Bank Annual Report
2013
15
ADVISOR TO THE CHAIRMAN
BRANCHES NETWORK
LEGAL ADVISORS
AUDITORS
Me. Charles GHAFARI
Me. Waddah EL-CHAER
Grant Thornton
PricewaterhouseCoopers
Dr. Ibrahim HAMMOUDCredit
Mr. Ali BADRANBranches Network Manager
Mr. Maroun MAKHOULRegional Manager [Bekaa]
Mr. Mohamad HAMADEHRegional Manager [South]

Fenicia Bank Annual Report2013
16
CORPORATE GOVERNANCE

Fenicia Bank Annual Report
2013
17
A legacy worth the whileThe one heritage we are always proud of is a true bond.
At Fenicia Bank, we build on the long run, to keep our clients close, one generation after the other.
Fenicia Bank Annual Report2013
18
CORPORATE GOVERNANCE
I. Corporate Governance Initiatives During 2013
The initiative to reshape the corporate governance structure and upgrade its standards and practices was one of the key milestones achieved by Fenicia Bank S.A.L. in 2013. The Bank embarked on a broad corporate governance restructuring program during the year. The program went in parallel with Fenicia Bank’s ongoing transformation, followed the board level governance revamp that was launched in 2012, and aimed at reinforcing the Bank’s wider commitment to good governance. Following the election of new board members, the reinforcement of board independence, and the establishment of the Governance and Remuneration Committee in 2012, the corporate governance action plan launched and accomplished in its majority in 2013 tackled every pillar of the governance framework. The Bank recognizes that the commitment to governance standards is an ongoing process and will continue to carry out its efforts to nurture a culture of governance across the Bank.
The Corporate Governance Code which sets forth the framework of the governance structure at the Bank and delineates its governance practices was revised during the year to ensure alignment of the Bank’s practices with the latest and leading international standards as well as the regulatory and industry requirements. The revisions tackled the composition of the Board of directors and Board committees and the responsibilities of the major governance organs at the Bank including the Board and its committees, top management, risk management, and internal and external audit, and incorporated the criteria for director independence.
The charter of the Board Risk Committee was reviewed and updated as well to ensure consistency with the revised Corporate Governance Code and alignment with regulatory requirements and international best practices in corporate governance. Within the same framework, the charters of the Audit Committee and the Governance & Remuneration Committee were updated and will be presented to the Board of Directors for discussion and approval.
In order to instill a culture of ethical behavior and compliance with the highest governance and legal principles, the Bank developed a Whistleblowing Policy which was approved by the Board of Directors. The policy encourages proper and prompt dealing with actual or perceived violations of any nature. The Bank also updated its Code of Conduct Policy to ensure consistency of the underlying principles across all codes and policies. These policies were communicated to all staff through correspondence followed by seminars and workshops to promote awareness, highlight their importance, and provide the necessary clarifications.
The Board of Directors approved as well the Conflict of Interest & Related Party Transactions Policy which aims at limiting conflict of interest and related party transactions and promoting transparency, fairness, and disclosure in issues underlying such incidents.
A plan was initiated as well during the year to update the Bank’s Policies and Procedures’ Guide in line with the best industry practices and allowing for efficiency in operations while maintaining proper control and compliance. The new organizational structure at the Bank reflected the establishment of the Compliance Department comprising the Legal Compliance Unit and the Anti-Money Laundry Compliance Unit and having within its mandates the

Fenicia Bank Annual Report
2013
19
responsibility of ensuring the implementation of these policies and monitoring the compliance with the underlying legal, regulatory, and governance principles.
One of the pillars of the governance undertaking tackled the risk management framework at the Bank. A Risk Strategy and a Risk Policy laying down solid foundations for risk management at the Bank were approved by the Board of Directors. The Risk Strategy sets forth the general framework of risk management, the risk management objectives, the risk governance structure, the Bank’s risk tolerance indicators, and the methodologies for identifying, measuring and assessment, monitoring, mitigating, and reporting the various risks.With the aim of ensuring the ongoing development of the Board members and the update of their knowledge and skills in areas essential to the exercise of judgment and decision making, the Bank approved a comprehensive Board Training Program covering topics such as corporate governance, financial statements analysis, risk management, audit, compliance, and strategy. Two sessions aiming at strengthening the Board’s background in the areas of corporate governance and finance were delivered in 2013. The rest of the program is planned to be delivered over the next year.
II. Corporate Governance Plan for the Period 2014 - 2015
Fenicia Bank S.A.L. commits to its ongoing advancement in good governance conduct. Within this framework, the Bank plans to keep on reinforcing the governance principles it had set forth and on upgrading its practices to keep pace of developments in the field. Fenicia Bank’s corporate governance plan for the 2014/2015 period will tackle various governance pillars with primary focus on:• Approving and adopting the updated charters of the Audit Committee and the Governance and Remuneration
Committee by the Board of Directors;• Completing the remaining sessions of the Board Training Program initiated in 2013 and covering the topics of
Corporate Governance, Finance, Risk Management, Audit, Compliance and Strategy;• Accomplishing the Work Plan for updating the Bank’s Policies and Procedures Guide initiated in 2013 and
putting the new Guide into practice; • Ensuring that the recently established Compliance Department is fully functional and has the adequate staff
and other resources, including access to continuous training, in a way that facilitates the proper exercise of its compliance monitoring functions;
• Adopting a Board assessment procedure which would be carried out on an annual basis to evaluate the functioning of the Board and attempt to continuously improve its governance practices;
• Succession planning for the top executive positions at the Bank in order to ensure continuous sustainability in operations;
• Regular review and update of the various corporate governance principles to keep pace of the developments in the regulatory requirements as well as in the industry and international best practices;
• Promoting a culture of good governance across the Bank through the planning of awareness programs and improved communication of governance principles to all employees, among other initiatives.
Fenicia Bank Annual Report2013
20
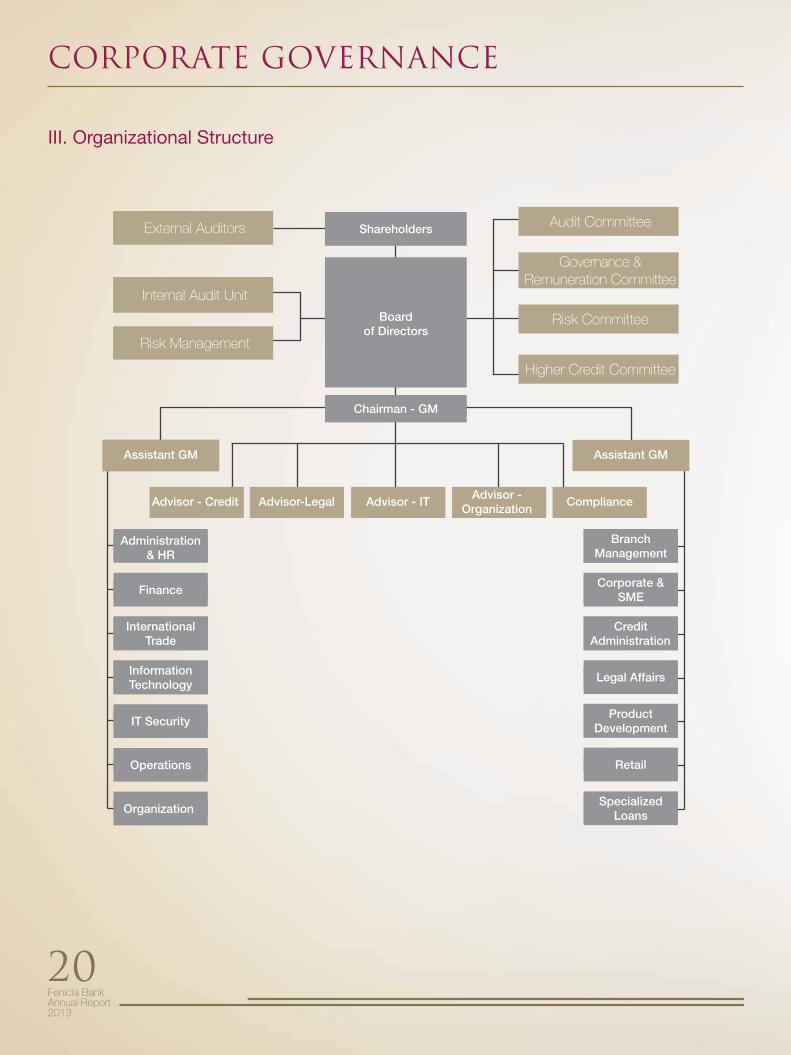
III. Organizational Structure
Higher Credit Committee
Audit Committee
Risk Committee
Governance & Remuneration Committee
Internal Audit Unit
External Auditors
Risk Management
Chairman - GM
Shareholders
Boardof Directors
Assistant GM
Advisor - Credit Advisor - Organization
Advisor-Legal Advisor - IT Compliance
Assistant GM
Branch Management
Product Development
Credit Administration
SpecializedLoans
Corporate & SME
Retail
Legal Affairs
Administration & HR
Information Technology
International Trade
Operations
Finance
IT Security
Organization
CORPORATE GOVERNANCE
Fenicia Bank Annual Report
2013
21
IV. Bank Committees
• BoardCommittees: o Audit Committee o Governance and Remuneration Committee o Risk Committee o Higher Credit Committee
• ManagementCommittees: o Anti-Money Laundry Committee o Assets & Liabilities Committee o Credit Committees (3 sub-committees) o Credit Rating Committee o FATCA Committee o Financial & Estate Placements Committee o Information Security Committee o Procedures & Internal Control Committee o Training Committee o Archiving Committee
V. Fenicia Bank Board Governance
V.1 Board of Directors’ Roles and Responsibilities
Fenicia Bank’s Board of Directors has wide authorities to implement the decisions of the General Assembly and to exercise the non day-to-day activities required to run the business normally. The Board of Directors supervises the setting of the Bank’s strategy and its implementation, oversees the performance of the Bank’s management in alignment with the strategy and objectives, and sets standards for evaluations and remunerations.
The Board ensures proper care of the legitimate interests of the shareholders, depositors, and stakeholders and the building of trust in the Bank and ensures that proper governance procedures are in place and abided by. The Board ensures the proper implementation of the required control procedures and oversees the financial reporting and audit systems and follows up on the work of the internal audit unit and the external auditors.
The Board of Directors sets the general policy of risk management at the Bank and ensures its efficiency and proper implementation. It is responsible for the transparency of its activities’ results and for the Bank’s abidance by the applicable laws and circulars.

Fenicia Bank Annual Report2013
22
CORPORATE GOVERNANCE
V.2 Responsibilities of the Chairman
The Chairman of the Board of Directors represents the Bank to third parties and executes the Board’s decisions and facilitates the daily operations of the Bank, as stated by the bylaws, and under the supervision and control of the Board of Directors. The Chair provides leadership to the Board and is responsible for the Board’s effective overall
functioning.
V.3 Composition of the Board
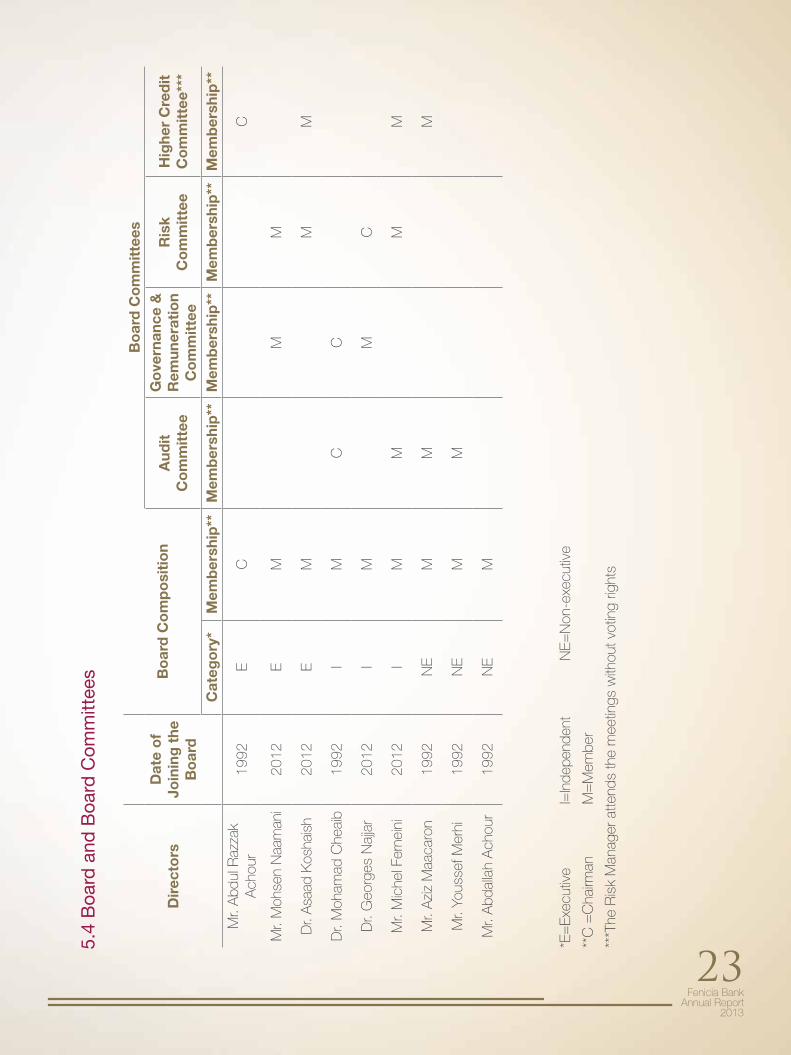
The Bank’s Board of Directors is composed of nine members, of whom three are independent, three are non-executive, and three are executive directors.
We believe that the mix of expertise at the Board level brings a wide range of diversity to the Board and its committees and contributes to a sound and informed judgment and decision making.
Fenicia Bank Annual Report
2013
23
Dir
ecto
rsD
ate
of
Join
ing
the
B
oar
d
Bo
ard
Co
mp
osi
tio
n
Bo
ard
Co
mm
itte
es
Aud
it
Co
mm
itte
e
Go
vern
ance
&
Rem
uner
atio
n C
om
mit
tee
Ris
k C
om
mit
tee
Hig
her
Cre
dit
C
om
mit
tee*
**
Cat
ego
ry*
Mem
ber
ship
**M
emb
ersh
ip**
Mem
ber
ship
**M
emb
ersh
ip**
Mem
ber
ship
**M
r. A
bdul
Raz
zak
Ach
our
1992
EC
C
Mr.
Moh
sen
Naa
man
i20
12E
MM
M
Dr.
Asa
ad K
osha
ish
2012
EM
MM
Dr.
Moh
amad
Che
aib
1992
IM
CC
Dr.
Geo
rges
Naj
jar
2012
IM
MC
Mr.
Mic
hel F
erne
ini
2012
IM
MM
M
Mr.
Azi
z M
aaca
ron
1992
NE
MM
M
Mr.
Yous
sef M
erhi
1992
NE
MM
Mr.
Abd
alla
h A
chou
r19
92N
EM
5.4
Boa
rd a
nd B
oard
Com
mitt
ees
*E=
Exec
utiv
e
I=In
depe
nden
t
NE=
Non
-exe
cutiv
e
**C
=C
hairm
an
M=
Mem
ber
***T
he R
isk
Man
ager
atte
nds
the
mee
tings
with
out v
otin
g rig
hts

Fenicia Bank Annual Report2013
24
CORPORATE GOVERNANCE
V.5 Board Committees
The Board delegates some of its responsibilities to its committees and maintains the duty to follow up on the actions, findings, and recommendations of these committees and taking the actions deemed appropriate.
V.5.1 Audit Committee
V.5.1.1 Membership
The Audit Committee consists of four non-executive directors, two of whom are independent. The Chairman of the Committee is considered by the Board to be independent.The Board has determined that the Committee Chair, Dr. Mohamad Cheaib, possesses relevant financial and audit
experience required for the Audit Committee to fulfill its tasks.
V.5.1.2 Roles and Responsibilities
The main mission of the Audit Committee is to assist the board in fulfilling its supervisory role and responsibilities mainly related to:• The independence and qualifications of the External Auditors and the Internal Audit Unit.• Oversight of the financial reporting process and accounting policies, control of financial statements’ soundness,
and review of the disclosure standards adopted by the Bank.• The adequacy and effectiveness of the audit systems and the internal control policies and procedures.• The follow up on any observations, violations, or recommendations highlighted by the External Auditors, supervisory
authorities, the Internal Audit Unit, or the Compliance Department and follow-up on the implementation of the remedial measures.
• The assurance of proper oversight over the compliance systems and the procedures to address any reported non-compliance.
• The abidance by the Central Bank circulars and the Banking Control Commission circulars and reports and all other applicable regulations.
V.5.2 Governance and Remuneration Committee
V.5.2.1 Membership
The Governance and Remuneration Committee consists of two independent members and one executive member. The Chairman of the Committee is considered by the Board to be independent.
The Board has determined that the Committee Chair, Dr. Mohamad Cheaib, possesses the experience required for the Governance and Remuneration Committee to fulfill its tasks.
Fenicia Bank Annual Report
2013
25
V.5.2.2 Roles and Responsibilities
The main roles of the Governance and Remuneration Committee are as follows:• Assistance in setting the various corporate governance policies at the Bank and follow-up on their implementation.• Clarification of the roles and responsibilities of the Board of Directors and its committees and assurance of their
proper exercise.• Verifying that the Bank is operating within the frame of the corporate governance principles.• Regular review and update of the corporate governance code and principles in compliance with the guidelines
issued by the Basel Committee and the supervisory authorities and in line with international best practices.
V.5.3 Risk Committee
V.5.3.1 Membership
The Board Risk Committee consists of two independent members and two executive members. The Chairman of the Committee is considered by the Board to be independent.The Board has determined that the Committee’s Chair, Dr. George Khalil Najjar, possesses the experience required for the Board Risk Committee to fulfill its tasks.
V.5.3.2 Roles and Responsibilities
The main roles of the Risk Committee are as follows:
• Assisting the Board in setting the risk strategy and policies and in determining, measuring, monitoring, and managing all the risks that the Bank is exposed to.
• Advising the Board on the Bank’s overall current and future risk tolerance. • Verifying that the Bank operations and goals stay within its risk appetite.• Supervising the sound adoption of the risk management principles in abidance by the regulations of the Central
Bank, the Banking Control Commission, and the Basel Committee.• Ensuring the independence and competence of the risk management unit and overseeing its activities. • Verifying that the risk management implementation is compliant with the Bank’s risk strategy.
V.5.4 Higher Credit Committee
V.5.4.1 Membership
The Board Higher Credit Committee consists of two executive, one independent and one non-executive member. The Chairman of the Committee is the Chairman of the Bank.The Board has determined that the Committee’s Chair, Mr. Abdul Razzak Achour, possesses the experience required for the Board Higher Credit Committee to fulfill its tasks.The Risk Manager attends the meetings of the Higher Credit Committee for risk assessment and consultations but
does not have a voting right.

Fenicia Bank Annual Report2013
26
CORPORATE GOVERNANCE
V.5.4.2 Roles and Responsibilities
The main role of the Higher Credit Committee is to examine the credit files that are presented to it based on the criteria set by the Board of Directors. The committee provides opinion on all direct and indirect credit files whose value exceeds USD five millions.
VI. External Auditors
The External Auditors of Fenicia Bank S.A.L. are Grant Thornton and PricewaterhouseCoopers. The External Auditors were appointed by Board of Directors upon a recommendation by the Audit Committee. The External Auditors are independent from the Bank and its directors. The Audit Committee is responsible for ensuring that the External Auditors remain independent.
VII. Conflict of Interest and Related Party Transactions
The Bank has developed a Conflict of Interest Policy that promotes transparency, fairness and disclosure in issues underlying a conflict of interest or related party transactions. The Policy delineates the procedures for avoiding conflicts of interest to the extent possible with the appropriate disclosure mechanisms, and for identifying and dealing
with actual, potential, or perceived conflicts of interest, and disclosing them where un-prevented.
VIII. Professional Conduct Rules
Fenicia Bank S.A.L. ensures that the Bank at all employee levels abides by the highest standards of legal and ethical conduct. The Bank has developed a Code of Conduct and established mechanisms for monitoring compliance by it and all applicable laws and regulations. It has developed procedures for employees to confidentially report any violations and for the Bank to act upon and resolve the faced issues. Fenicia Bank S.A.L. is strongly committed to the following values that frame the scheme of its activities within and outside the work environment:
Fast Service (We satisfy customer needs at the time they need the service)
Efficiency (We execute operations within a small margin of error)
Neutrality (We show no favors and engage in no discriminatory behavior)
Integrity (We act ethically and honestly towards our organization and stakeholders)
Consistency (We maintain uniformity across our products and services to ensure customer satisfaction)
Innovation (We propose new ideas and/or ways of doing things)
Accountability (We hold the responsibility for and consequences of our actions)

Fenicia Bank Annual Report
2013
27

Fenicia Bank Annual Report2013
28
HIGHLIGHTS, CHARTS & PERFORMANCE REVIEW

Fenicia Bank Annual Report
2013
29
The shop around the cornerThat old grocery shop Yasmeen inherited from her stepfather
could not be more exotic to her. But with the support of Fenicia Bank, she can already imagine the gourmet deli shop it will soon turn into.
Fenicia Bank Annual Report2013
30
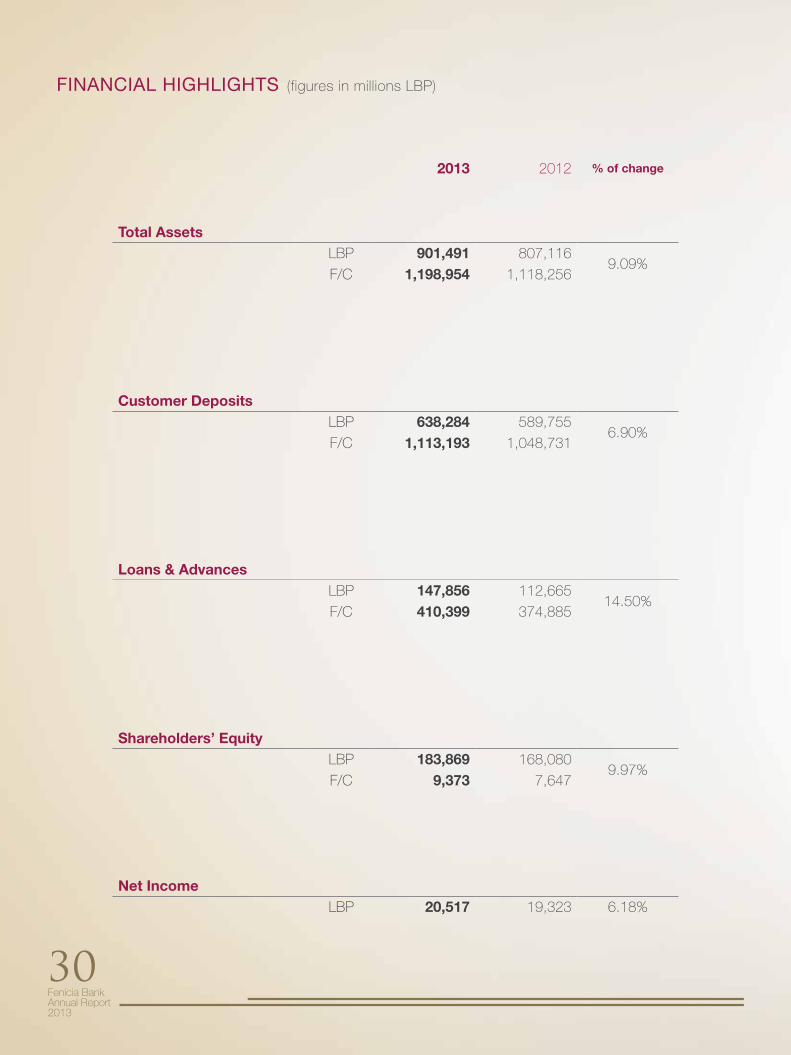
FINANCIAL HIGHLIGHTS (figures in millions LBP)
2013 2012 % of change
Total AssetsLBP 901,491 807,116
9.09%F/C 1,198,954 1,118,256
Customer DepositsLBP 638,284 589,755
6.90%F/C 1,113,193 1,048,731
Loans & AdvancesLBP 147,856 112,665
14.50%F/C 410,399 374,885
Shareholders’ EquityLBP 183,869 168,080
9.97%F/C 9,373 7,647
Net IncomeLBP 20,517 19,323 6.18%
Fenicia Bank Annual Report
2013
31
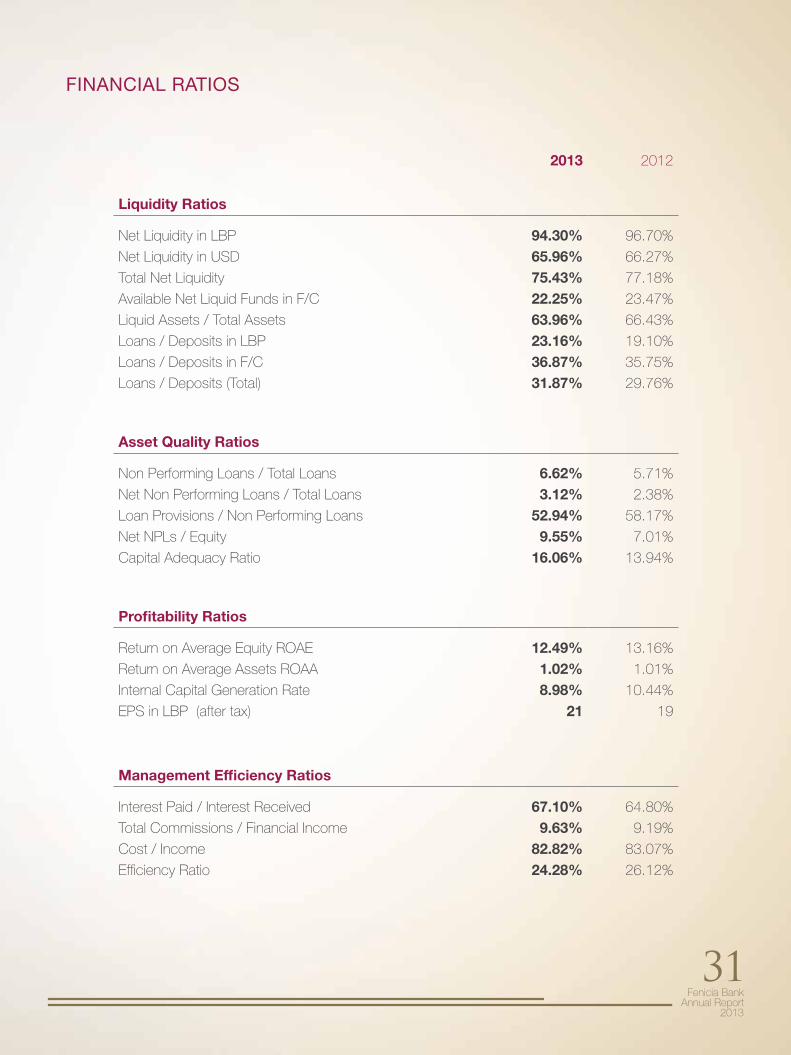
FINANCIAL RATIOS
2013 2012
Liquidity Ratios
Net Liquidity in LBP 94.30% 96.70%
Net Liquidity in USD 65.96% 66.27%
Total Net Liquidity 75.43% 77.18%
Available Net Liquid Funds in F/C 22.25% 23.47%
Liquid Assets / Total Assets 63.96% 66.43%
Loans / Deposits in LBP 23.16% 19.10%
Loans / Deposits in F/C 36.87% 35.75%
Loans / Deposits (Total) 31.87% 29.76%
Asset Quality Ratios
Non Performing Loans / Total Loans 6.62% 5.71%
Net Non Performing Loans / Total Loans 3.12% 2.38%
Loan Provisions / Non Performing Loans 52.94% 58.17%
Net NPLs / Equity 9.55% 7.01%
Capital Adequacy Ratio 16.06% 13.94%
Profitability Ratios
Return on Average Equity ROAE 12.49% 13.16%
Return on Average Assets ROAA 1.02% 1.01%
Internal Capital Generation Rate 8.98% 10.44%
EPS in LBP (after tax) 21 19
Management Efficiency Ratios
Interest Paid / Interest Received 67.10% 64.80%
Total Commissions / Financial Income 9.63% 9.19%
Cost / Income 82.82% 83.07%
Efficiency Ratio 24.28% 26.12%
Fenicia Bank Annual Report2013
32
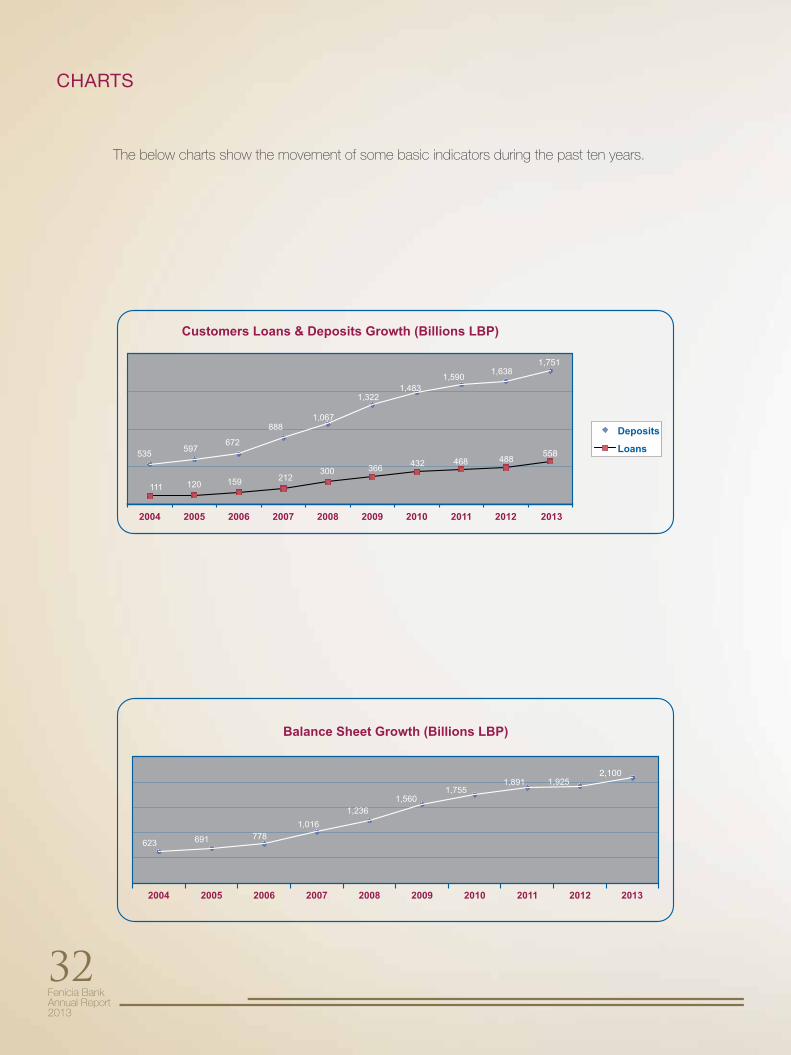
CHARTS
The below charts show the movement of some basic indicators during the past ten years.
558
1,751
2,100
Fenicia Bank Annual Report
2013
33
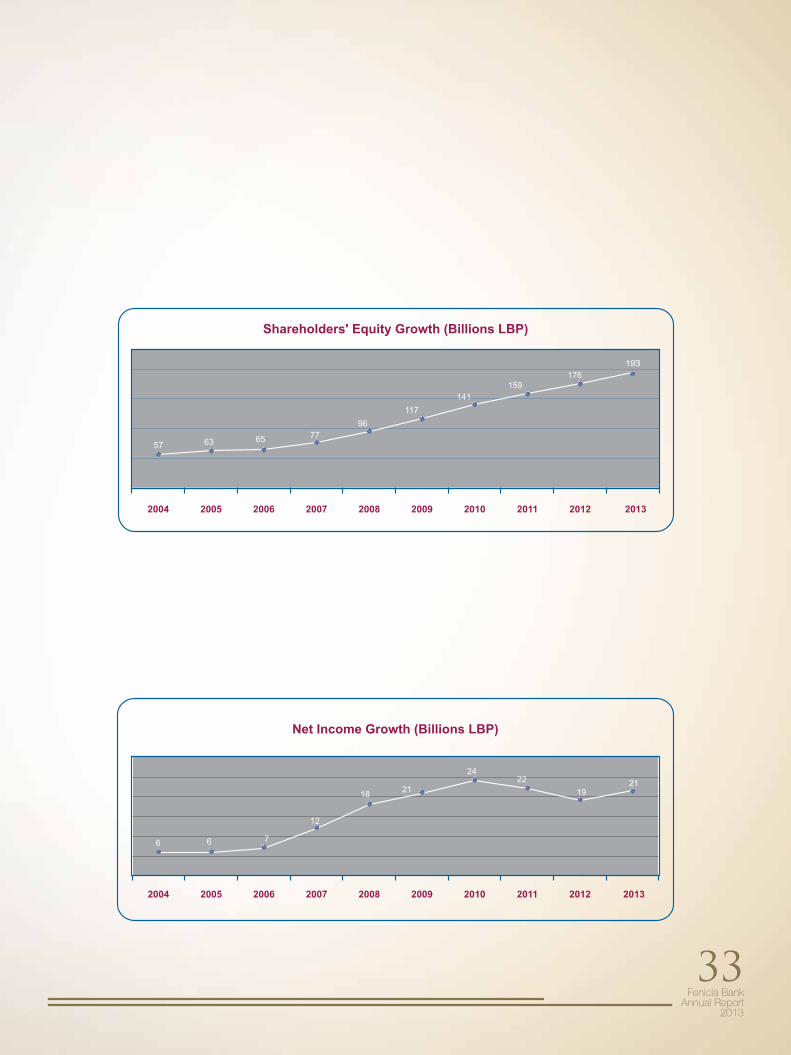
193
21
Fenicia Bank Annual Report2013
34
Deposits from Central Bank
Deposits from banks
Deposits from customers
Shareholders’ equity
Other liabilities
2012
85%
9%
1%3%
2%
2013
83%
9%
1%4% 3%
FINANCIAL PERFORMANCE REVIEW OF 2013
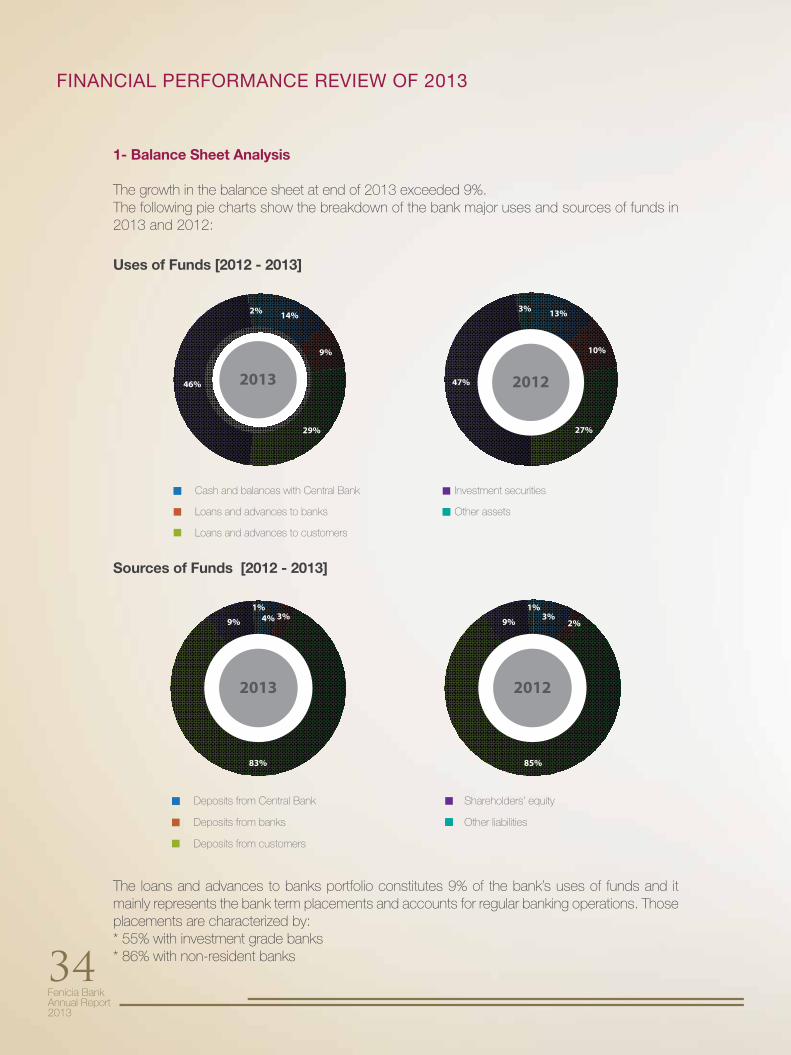
1- Balance Sheet Analysis
The growth in the balance sheet at end of 2013 exceeded 9%.The following pie charts show the breakdown of the bank major uses and sources of funds in 2013 and 2012:
The loans and advances to banks portfolio constitutes 9% of the bank’s uses of funds and it mainly represents the bank term placements and accounts for regular banking operations. Those placements are characterized by: * 55% with investment grade banks* 86% with non-resident banks
Cash and balances with Central Bank
Loans and advances to banks
Loans and advances to customers
Investment securities
Other assets
2012
27%
10%
13%3%
47%2013
29%
9%
14%2%
46%
Uses of Funds [2012 - 2013]
Sources of Funds [2012 - 2013]
Fenicia Bank Annual Report
2013
35
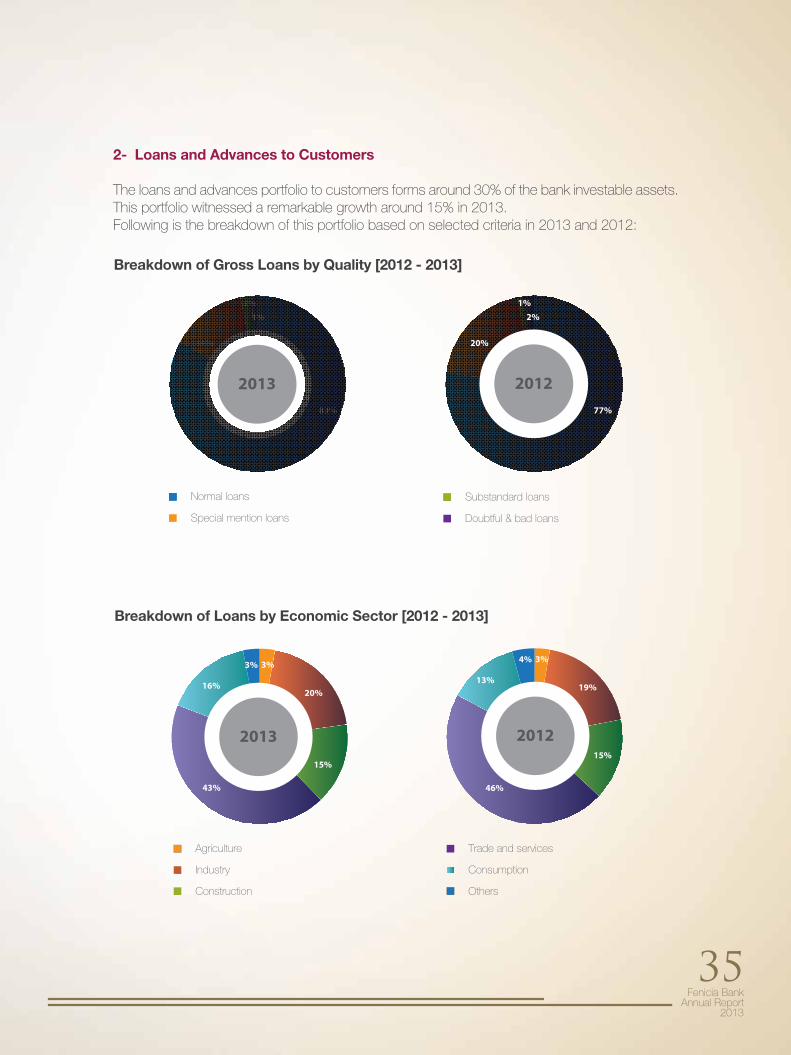
Breakdown of Gross Loans by Quality [2012 - 2013]
2- Loans and Advances to Customers
The loans and advances portfolio to customers forms around 30% of the bank investable assets. This portfolio witnessed a remarkable growth around 15% in 2013.Following is the breakdown of this portfolio based on selected criteria in 2013 and 2012:
201277%
2%1%
20%
Normal loans
Special mention loans
Substandard loans
Doubtful & bad loans
201383%
1%2%
14%
Agriculture
Industry
Construction
Trade and services
Consumption
Others
201315%
20%
3%3%
16%
43%
2012
19%
15%
3%4%
13%
46%
Breakdown of Loans by Economic Sector [2012 - 2013]
Fenicia Bank Annual Report2013
36
FINANCIAL PERFORMANCE REVIEW OF 2013
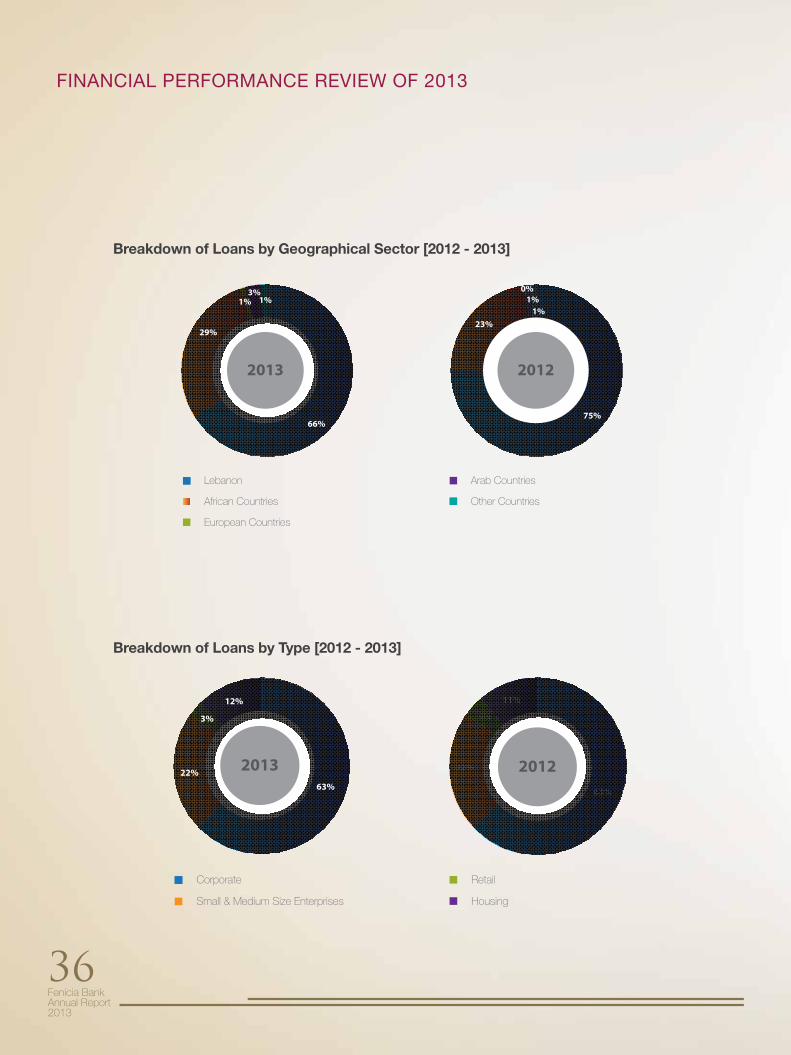
Breakdown of Loans by Geographical Sector [2012 - 2013]
Lebanon
African Countries
European Countries
Arab Countries
Other Countries
2012
75%
23%1%
1%0%
2013
66%
29%
1% 1%3%
Breakdown of Loans by Type [2012 - 2013]
63%
11%
4%
22% 2012
Corporate
Small & Medium Size Enterprises
Retail
Housing
201363%
22%
3%
12%
Fenicia Bank Annual Report
2013
37
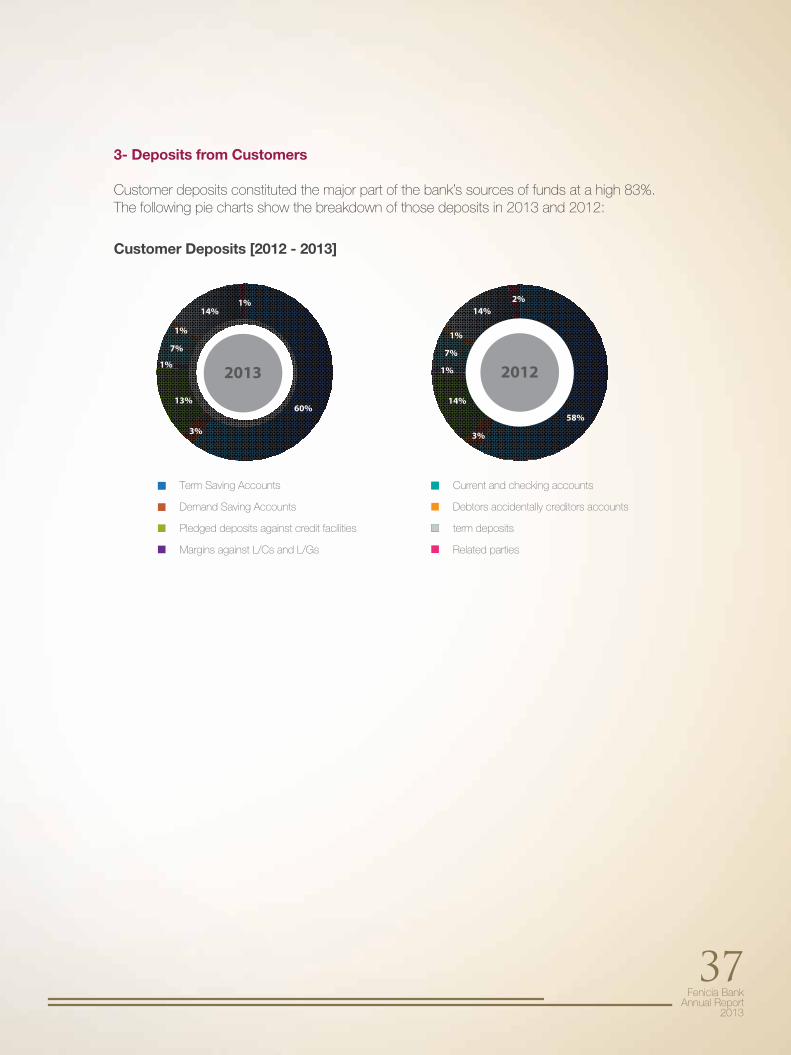
3- Deposits from Customers
Customer deposits constituted the major part of the bank’s sources of funds at a high 83%.The following pie charts show the breakdown of those deposits in 2013 and 2012:
Customer Deposits [2012 - 2013]
Term Saving Accounts
Demand Saving Accounts
Pledged deposits against credit facilities
Margins against L/Cs and L/Gs
Current and checking accounts
Debtors accidentally creditors accounts
term deposits
Related parties
2012
58%
3%
14%
14%
1%
7%
1%
2%
2013
1%
1%
1%
3%
13%
14%
60%
7%
Fenicia Bank Annual Report2013
38
FINANCIAL PERFORMANCE REVIEW OF 2013
Total Expenses [2012 - 2013]
Interest expenses
Fees and Commissions
Loan impairment losses
Personnel expenses
General & administrative expenses
Income tax expenses
2012
68%
4%10%
14%
3%1%
201370%1%
1%
14%
10%4%
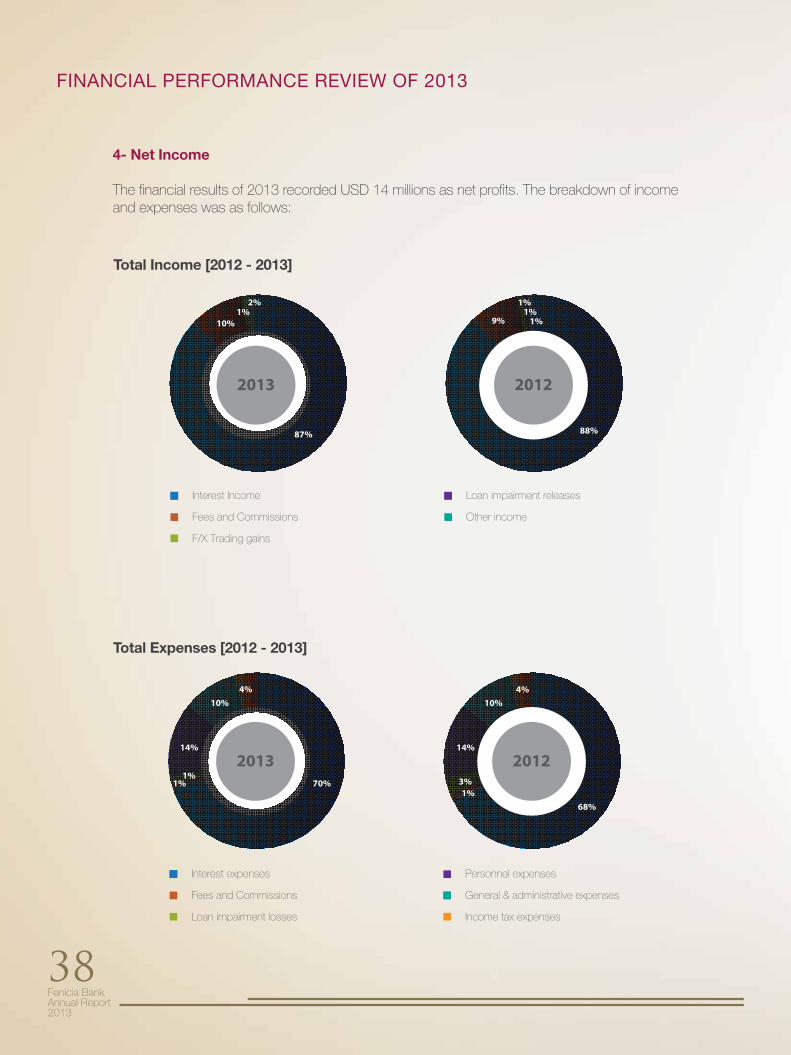
4- Net Income
The financial results of 2013 recorded USD 14 millions as net profits. The breakdown of income and expenses was as follows:
Total Income [2012 - 2013]
Interest Income
Fees and Commissions
F/X Trading gains
Loan impairment releases
Other income
2012
88%
9%
1%1%1%
2013
87%
10%1%
2%
Fenicia Bank Annual Report
2013
39
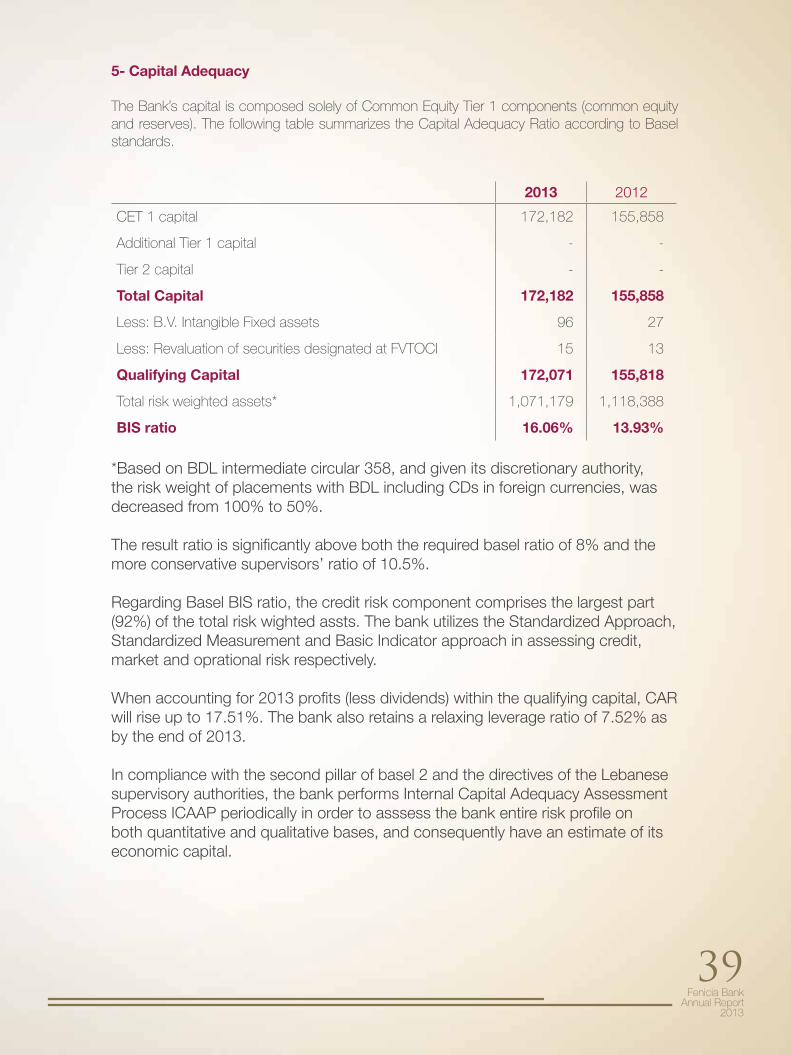
5- Capital Adequacy
The Bank’s capital is composed solely of Common Equity Tier 1 components (common equity and reserves). The following table summarizes the Capital Adequacy Ratio according to Basel standards.
2013 2012
CET 1 capital 172,182 155,858
Additional Tier 1 capital - -
Tier 2 capital - -
Total Capital 172,182 155,858
Less: B.V. Intangible Fixed assets 96 27
Less: Revaluation of securities designated at FVTOCI 15 13
Qualifying Capital 172,071 155,818
Total risk weighted assets* 1,071,179 1,118,388
BIS ratio 16.06% 13.93%
*Based on BDL intermediate circular 358, and given its discretionary authority, the risk weight of placements with BDL including CDs in foreign currencies, was decreased from 100% to 50%.
The result ratio is significantly above both the required basel ratio of 8% and the more conservative supervisors’ ratio of 10.5%.
Regarding Basel BIS ratio, the credit risk component comprises the largest part (92%) of the total risk wighted assts. The bank utilizes the Standardized Approach, Standardized Measurement and Basic Indicator approach in assessing credit, market and oprational risk respectively.
When accounting for 2013 profits (less dividends) within the qualifying capital, CAR will rise up to 17.51%. The bank also retains a relaxing leverage ratio of 7.52% as by the end of 2013.
In compliance with the second pillar of basel 2 and the directives of the Lebanese supervisory authorities, the bank performs Internal Capital Adequacy Assessment Process ICAAP periodically in order to asssess the bank entire risk profile on both quantitative and qualitative bases, and consequently have an estimate of its economic capital.

Fenicia Bank Annual Report2013
40
Financial Statements & Notes

Fenicia Bank Annual Report
2013
41
Everything starts smallWhen great aunt Edna decided to leave her beloved car to little Samer, little did
she know he would grow into this lovable giant. At Fenicia bank, we know that everything small can grow big, and our car loan will turn any car into the one
you dream of.
Fenicia Bank Annual Report2013
42
INDEPENDENT AUDITOR’S REPORT
Independent Auditors’ Reportto the shareholders of Fenicia Bank S.A.L.
Report on the financial statements
We have audited the accompanying financial statements of Fenicia Bank S.A.L.(“the Bank”) which comprise the balance sheet as of 31 December 2013 and the statementsof comprehensive income, changes in equity and cash flows for the year then ended, and asummary of significant accounting policies and other explanatory notes.
Management’s responsibility for the financial statements
Management is responsible for the preparation and fair presentation of these financialstatements in accordance with International Financial Reporting Standards (IFRSs), and forsuch internal control as management determines is necessary to enable the preparation offinancial statements that are free from material misstatement, whether due to fraud or error.
Auditors’ responsibility
Our responsibility is to express an opinion on these financial statements based on our audit.We conducted our audit in accordance with International Standards on Auditing. Thosestandards require that we comply with ethical requirements and plan and perform the auditto obtain reasonable assurance about whether the financial statements are free frommaterial misstatement.
An audit involves performing procedures to obtain audit evidence about the amounts anddisclosures in the financial statements. The procedures selected depend on the auditors’judgment, including the assessment of the risks of material misstatement of the financialstatements, whether due to fraud or error. In making those risk assessments, the auditorconsiders internal control relevant to the Bank’s preparation and fair presentation of thefinancial statements in order to design audit procedures that are appropriate in thecircumstances, but not for the purpose of expressing an opinion on the effectiveness of theBank’s internal control. An audit also includes evaluating the appropriateness of accountingpolicies used and the reasonableness of accounting estimates made by management, aswell as evaluating the overall presentation of the financial statements.
We believe that the audit evidence we have obtained is sufficient and appropriate toprovide a basis for our audit opinion.

Fenicia Bank Annual Report
2013
43
Independent Auditors’ Report (continued)to the shareholders of Fenicia Bank S.A.L.
Opinion
In our opinion, the accompanying financial statements present fairly, in all materialrespects, the financial position of Fenicia Bank S.A.L. as at 31 December 2013, and itsfinancial performance and its cash flows for the year then ended in accordance withInternational Financial Reporting Standards
PricewaterhouseCoopers Grand Thornton
Beirut, Lebanon5 June 2014
Fenicia Bank Annual Report2013
44
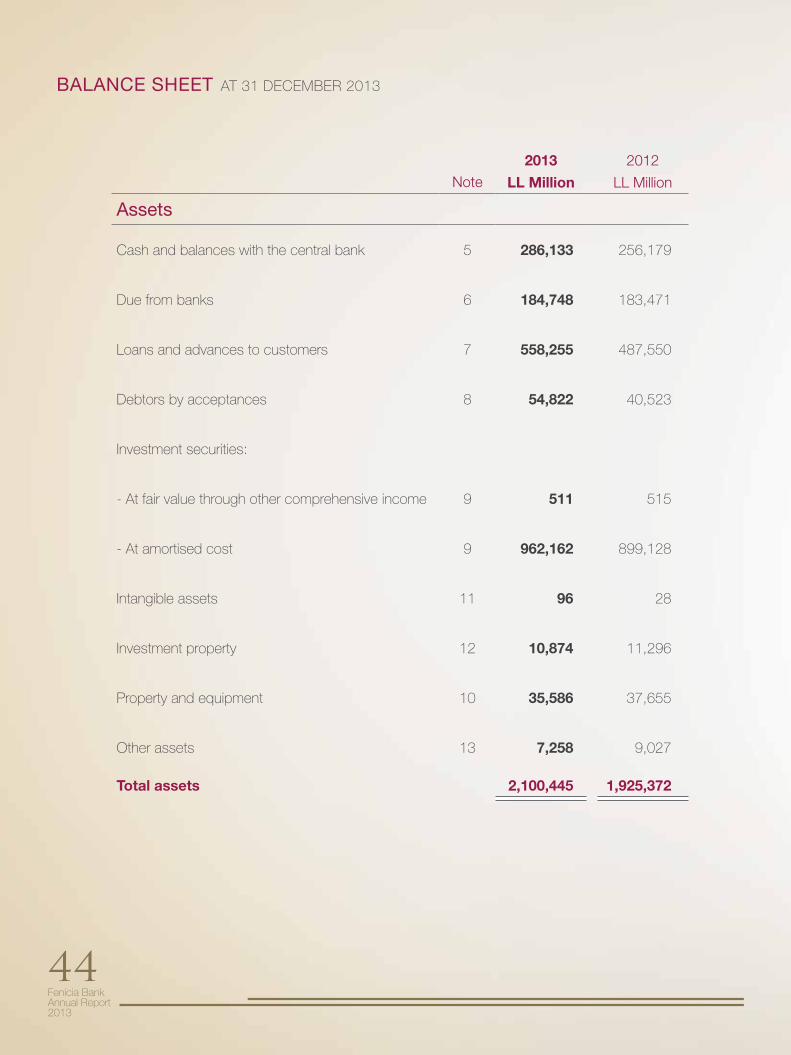
BALANCE SHEET AT 31 DECEMBER 2013
2013 2012Note LL Million LL Million
Assets
Cash and balances with the central bank 5 286,133 256,179
Due from banks 6 184,748 183,471
Loans and advances to customers 7 558,255 487,550
Debtors by acceptances 8 54,822 40,523
Investment securities:
- At fair value through other comprehensive income 9 511 515
- At amortised cost 9 962,162 899,128
Intangible assets 11 96 28
Investment property 12 10,874 11,296
Property and equipment 10 35,586 37,655
Other assets 13 7,258 9,027
Total assets 2,100,445 1,925,372
Fenicia Bank Annual Report
2013
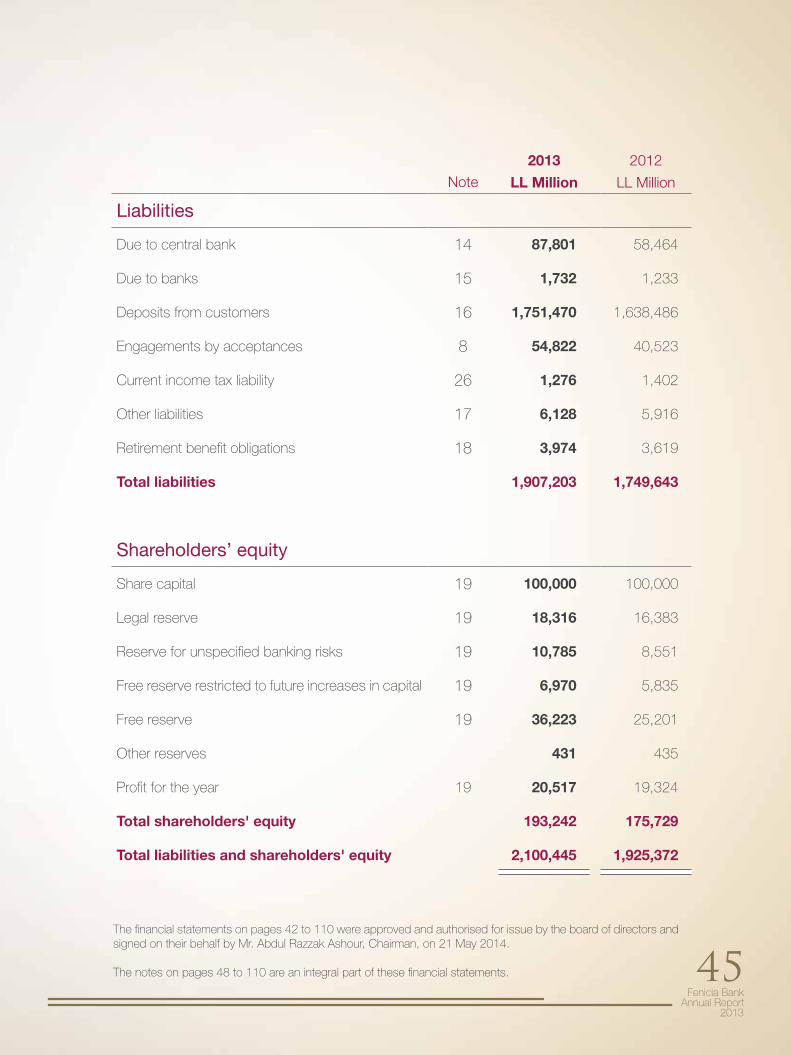
45The financial statements on pages 42 to 110 were approved and authorised for issue by the board of directors and signed on their behalf by Mr. Abdul Razzak Ashour, Chairman, on 21 May 2014.
The notes on pages 48 to 110 are an integral part of these financial statements.
2013 2012Note LL Million LL Million
Liabilities
Due to central bank 14 87,801 58,464
Due to banks 15 1,732 1,233
Deposits from customers 16 1,751,470 1,638,486
Engagements by acceptances 8 54,822 40,523
Current income tax liability 26 1,276 1,402
Other liabilities 17 6,128 5,916
Retirement benefit obligations 18 3,974 3,619
Total liabilities 1,907,203 1,749,643
Shareholders’ equity
Share capital 19 100,000 100,000
Legal reserve 19 18,316 16,383
Reserve for unspecified banking risks 19 10,785 8,551
Free reserve restricted to future increases in capital 19 6,970 5,835
Free reserve 19 36,223 25,201
Other reserves 431 435
Profit for the year 19 20,517 19,324
Total shareholders' equity 193,242 175,729
Total liabilities and shareholders' equity 2,100,445 1,925,372
Fenicia Bank Annual Report2013
46
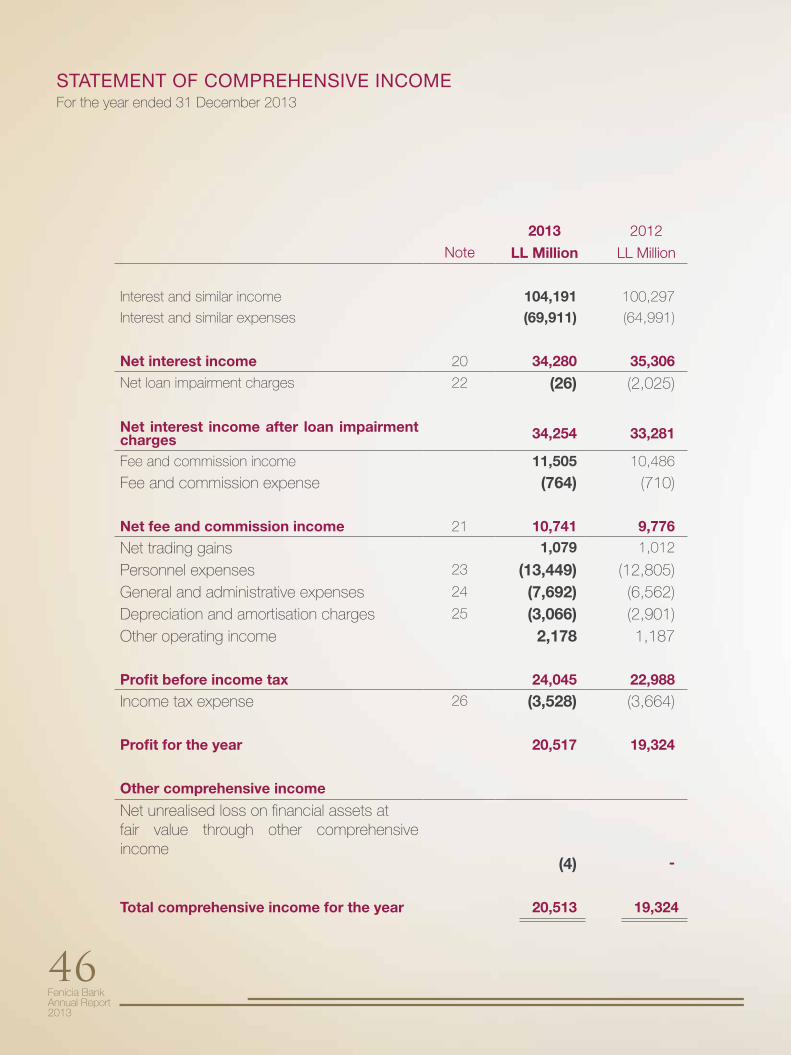
2013 2012Note LL Million LL Million
Interest and similar income 104,191 100,297
Interest and similar expenses (69,911) (64,991)
Net interest income 20 34,280 35,306Net loan impairment charges 22 (26) (2,025)
Net interest income after loan impairment charges 34,254 33,281
Fee and commission income 11,505 10,486
Fee and commission expense (764) (710)
Net fee and commission income 21 10,741 9,776
Net trading gains 1,079 1,012
Personnel expenses 23 (13,449) (12,805)General and administrative expenses 24 (7,692) (6,562)Depreciation and amortisation charges 25 (3,066) (2,901)Other operating income 2,178 1,187
Profit before income tax 24,045 22,988
Income tax expense 26 (3,528) (3,664)
Profit for the year 20,517 19,324
Other comprehensive income
Net unrealised loss on financial assets atfair value through other comprehensive income
(4) -
Total comprehensive income for the year 20,513 19,324
STATEMENT OF COMPREHENSIVE INCOMEFor the year ended 31 December 2013
Fenicia Bank Annual Report
2013
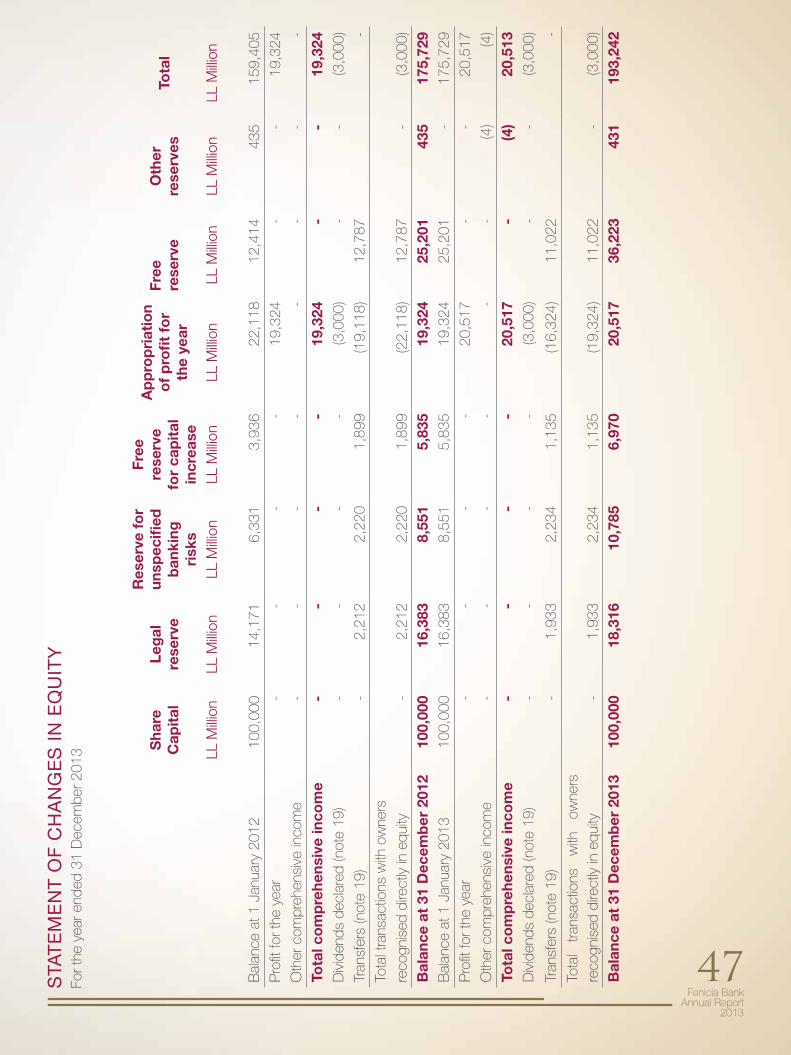
47STA
TE
ME
NT
OF
CH
AN
GE
S I
N E
QU
ITY
For t
he y
ear e
nded
31
Dec
embe
r 201
3 Sha
re
Cap
ital
Leg
al
rese
rve
Res
erve
fo
r un
spec
ified
b
anki
ng
risk
s
Free
re
serv
e fo
r ca
pit
al
incr
ease
Ap
pro
pri
atio
n o
f p
rofi
t fo
r th
e ye
ar
Free
re
serv
eO
ther
re
serv
esTo
tal
LL M
illion
LL M
illion
LL M
illion
LL M
illion
LL M
illion
LL M
illion
LL M
illion
LL M
illion
Bal
ance
at 1
Jan
uary
201
2 10
0,00
0 14
,171
6,
331
3,93
6 22
,118
12
,414
435
159,
405
Pro
fit fo
r the
yea
r -
--
-19
,324
-
-19
,324
Oth
er c
ompr
ehen
sive
inco
me
--
--
--
--
Tota
l co
mp
rehe
nsiv
e in
com
e -
--
-19
,324
-
-19
,324
Div
iden
ds d
ecla
red
(not
e 19
) -
--
-(3
,000
) -
-(3
,000
)
Tran
sfer
s (n
ote
19)
-2,
212
2,22
0 1,
899
(19,
118)
12
,787
-
Tota
l tra
nsac
tions
with
ow
ners
reco
gnis
ed d
irect
ly in
equ
ity
-2,
212
2,22
0 1,
899
(22,
118)
12
,787
-(3
,000
)
Bal
ance
at
31 D
ecem
ber
201
2 10
0,00
0 16
,383
8,
551
5,83
5 19
,324
25
,201
435
175,
729
Bal
ance
at 1
Jan
uary
201
3 10
0,00
0 16
,383
8,
551
5,83
5 19
,324
25
,201
-17
5,72
9
Pro
fit fo
r the
yea
r -
--
-20
,517
-
-20
,517
Oth
er c
ompr
ehen
sive
inco
me
--
--
--
(4)
(4)
Tota
l co
mp
rehe
nsiv
e in
com
e -
--
-20
,517
-
(4)
20,5
13D
ivid
ends
dec
lare
d (n
ote
19)
--
--
(3,0
00)
--
(3,0
00)
Tran
sfer
s (n
ote
19)
-1,
933
2,23
4 1,
135
(16,
324)
11
,022
-
Tota
l tra
nsac
tions
w
ith
owne
rs
reco
gnis
ed d
irect
ly in
equ
ity
-1,
933
2,23
4 1,
135
(19,
324)
11
,022
-(3
,000
)
Bal
ance
at
31 D
ecem
ber
201
3 10
0,00
0 18
,316
10
,785
6,
970
20,5
17
36,2
2343
119
3,24
2
Fenicia Bank Annual Report2013
48
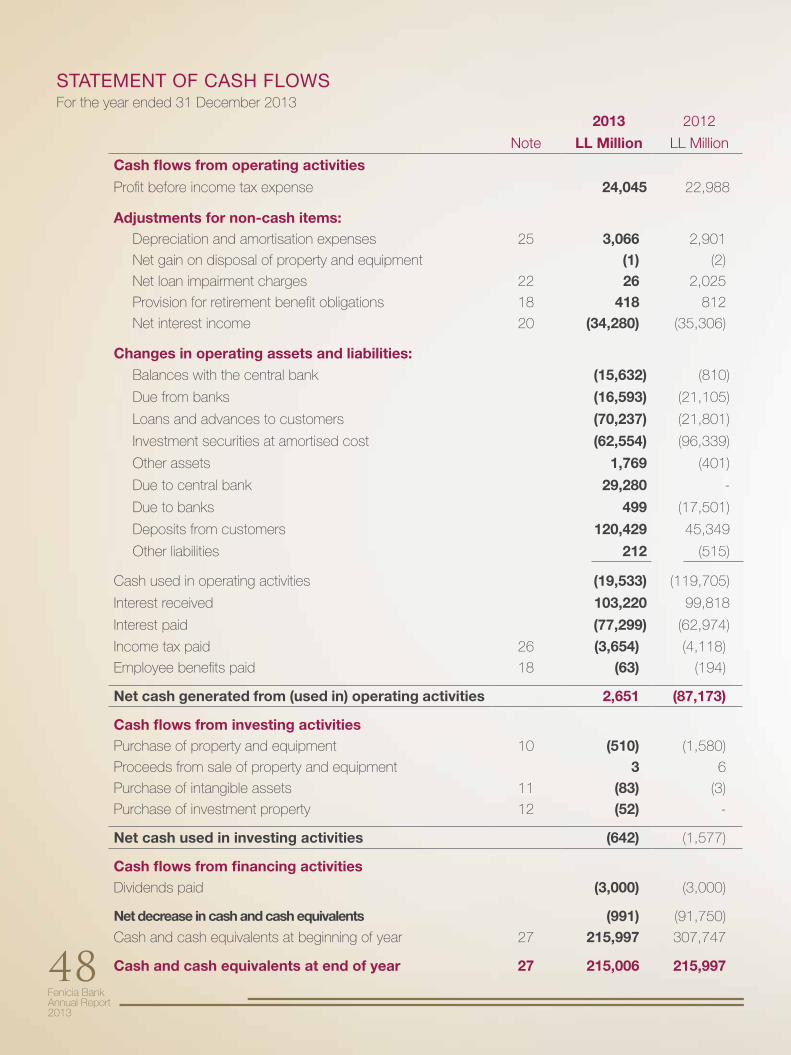
STATEMENT OF CASH FLOWSFor the year ended 31 December 2013
2013 2012
Note LL Million LL Million
Cash flows from operating activities
Profit before income tax expense 24,045 22,988
Adjustments for non-cash items: Depreciation and amortisation expenses 25 3,066 2,901
Net gain on disposal of property and equipment (1) (2)
Net loan impairment charges 22 26 2,025
Provision for retirement benefit obligations 18 418 812
Net interest income 20 (34,280) (35,306)
Changes in operating assets and liabilities: Balances with the central bank (15,632) (810)
Due from banks (16,593) (21,105)
Loans and advances to customers (70,237) (21,801)
Investment securities at amortised cost (62,554) (96,339)
Other assets 1,769 (401)
Due to central bank 29,280 -
Due to banks 499 (17,501)
Deposits from customers 120,429 45,349
Other liabilities 212 (515)
Cash used in operating activities (19,533) (119,705)
Interest received 103,220 99,818
Interest paid (77,299) (62,974)
Income tax paid 26 (3,654) (4,118)
Employee benefits paid 18 (63) (194)
Net cash generated from (used in) operating activities 2,651 (87,173)
Cash flows from investing activitiesPurchase of property and equipment 10 (510) (1,580)
Proceeds from sale of property and equipment 3 6
Purchase of intangible assets 11 (83) (3)
Purchase of investment property 12 (52) -
Net cash used in investing activities (642) (1,577)
Cash flows from financing activitiesDividends paid (3,000) (3,000)
Net decrease in cash and cash equivalents (991) (91,750)
Cash and cash equivalents at beginning of year 27 215,997 307,747
Cash and cash equivalents at end of year 27 215,006 215,997

Fenicia Bank Annual Report
2013
49
Fenicia Bank Annual Report2013
50
through other comprehensive income.
The financial statements comprise the balance sheet, the statement of comprehensive income, the statement of changes in equity, the statement of cash flows and the notes. The Bank classif ies its expenses by the nature of expense method.
The financial statements are presented in Lebanese Pounds, which is the Bank’s functional and presentation currency. The figures shown in the financial statements are stated in mil l ions of Lebanese Pounds (“LL Mil l ion”) except when otherwise indicated. The disclosures on risks from financial instruments are presented in the financial r isk management report contained in note 3.
The statement of cash flows shows the changes in cash and cash equivalents arising during the year from operating activit ies, investing activit ies and financing activit ies. Cash and cash equivalents include highly l iquid investments. Note 27 shows the balance sheet captions in which cash and cash equivalents items are included.
The cash flows from operating activit ies are determined by using the indirect method. Net income is therefore adjusted by non-cash items, such as measurement gains or losses, changes in provisions, as well as changes from receivables and l iabil i t ies. In addition, al l the income and expense from cash transactions that are attr ibutable to investing or f inancing activit ies are eliminated. Interest received or paid is classif ied as operating cash flows.
1 | General information
Fenicia Bank S.A.L. (the “Bank”) offers a ful l range of retai l, private and commercial banking activit ies to its customers. The Bank’s operations cover al l districts in Lebanon.
The Bank was incorporated in Lebanon in 1962 and registered at the Lebanese Commercial Register in Beirut under No. 11923 in the name of Bank of Kuwait and the Arab World S.A.L. It is l isted under number 58 in the l ist of Lebanese banks regulated by the Central Bank of Lebanon. The Bank has changed its name to Fenicia Bank S.A.L. on 20 December 2010.
2 | Summary of significant accounting policies
The principal accounting policies applied in the preparation of these financial statements are set out below. These policies have been consistently applied to al l the years presented, unless otherwise stated.
2.1 | Basis of preparation The financial statements have been prepared in accordance with International Financial Reporting Standards (“IFRS”) and IFRS Interpretation Committee (“IFRS IC”) as issued by the International Accounting Standards Board (“IASB”). The financial statements have been prepared under the historical cost convention, as modified by the revaluation of f inancial instruments at fair value
Notes to the financial statements for the year ended 31 December 2013
Fenicia Bank Annual Report
2013
51
a signif icant impact on the Bank’s f inancial statements.
– Amendment to IAS 1, ‘Clarif ication of the Requirement for Comparative Information’. The amendment to IAS 1 clarif ies the difference between voluntary additional comparative information and the minimum required comparative information. An entity must include comparative information in the related notes to the financial statements when it voluntari ly provides comparative information beyond the minimum required comparative period.
– An opening statement of f inancial posit ion (known as the ‘third balance sheet’) must be presented when an entity applies an accounting policy retrospectively, makes retrospective restatements, or reclassif ies items in its f inancial statements, provided any of those changes has a material effect on the statement of f inancial posit ion at the beginning of the preceding period.
– The amendment clarif ies that a third balance sheet does not have to be accompanied by comparative information in the related notes. The adoption of this amendment is not applicable and accordingly, did not have any impact on the Bank’s f inancial statements.
– -IFRS 13, ‘Fair Value Measurement’ ( issued in May 2011 and effective for annual periods beginning on or after 1 January 2013) improved consistency and reduced complexity by providing a revised definit ion of fair value, and a single source of fair value
The cash flows from investing and financing activit ies are determined by using the direct method. The Bank’s assignment of the cash flows to operating, investing and financing categories depends on the Bank’s business model (management approach). The preparation of f inancial statements in conformity with IFRS requires the use of certain crit ical accounting estimates. It also requires management to exercise its judgement in the process of applying the Bank’s accounting policies. The areas involving a higher degree of judgement or complexity, or areas where assumptions and estimates are signif icant to the financial statements are disclosed in Note 4.
2.1.1 | Changes in accounting policies and disclosures
(a) Standards, amendments and interpretations effective on or after 1 January 2013
The fol lowing standards and amendments, which became effective in 2013, are relevant to the Bank:
– Amendment to IAS 1, ‘Financial statement presentation’ regarding other comprehensive income, (revised in May 2011 and effective for annual period beginning on or after 1 January 2013). The main change result ing from these amendments is a requirement for Banks to group items presented in ‘other comprehensive income’ (OCI) on the basis of whether they are potential ly reclassif iable to profit or loss subsequently (reclassif ication adjustments). The amendment did not have
Fenicia Bank Annual Report2013
52
measurement and disclosure requirements for use across IFRSs. The amendment of this standard did not have a signif icant impact on the Bank’s f inancial statements.
– Amendment to IFRS 7, ‘Financial instruments’: Disclosures’ on derecognition, (effective from 1 July 2012). The amendment requires an entity to disclose information about rights to set-off f inancial instruments and related arrangements (e.g., collateral agreements). The disclosures would provide users with information that is useful in evaluating the effect of netting arrangements on an entity’s f inancial posit ion. The new disclosures are required for al l recognised financial instruments that are set off in accordance with IAS 32. The disclosures also apply to recognised financial instruments that are subject to an enforceable master netting arrangement or similar agreement, irrespective of whether the financial instruments are set off in accordance with IAS 32. As the Bank is not setting off f inancial instruments in accordance with IAS 32 and does not have relevant offsetting arrangements, the amendment does not have any impact on the Bank.
– Amendment to IAS 32, ‘Financial Instruments: Presentation’ clarif ies that income taxes arising from distributions to equity holders are accounted for in accordance with IAS 12 Income Taxes. The amendment removes existing income tax requirements from IAS 32 and requires entit ies to apply the requirements in IAS 12 to any income tax arising from distributions to equity holders. The amendment did not have an impact on the Bank’s f inancial statements.
– Amendment to IAS 27, ‘Separate Financial Statements’ (revised in May 2011 and effective for annual periods beginning on or after 1 January 2013) was changed and its objective is now to prescribe the accounting
and disclosure requirements for investments in subsidiaries, joint ventures and associates when an entity prepares separate financial statements.
– IFRS 12, ‘Disclosure of Interests in Other Entit ies’ ( issued in May 2011 and effective annual periods beginning on or after 1 January 2013) sets out the requirements for disclosures relating to an entity’s interests in subsidiaries, joint arrangements, associates and structured entit ies. The requirements in IFRS 12 are more comprehensive than the previously existing disclosure requirements for subsidiaries. For example, where a subsidiary is controlled with less than a majority of voting rights. The adoption of this amendment did not have any impact on the financial posit ion or performance of the Bank.
b) Standards, amendments and interpretations issued but not yet effective
– Amendment to IAS 36, ‘ Impairment of assets’ ( issued in May 2013 and effective for annual period beginning 1 January 2014), on the recoverable amount disclosures for non-financial assets. This amendment removed certain disclosures of the recoverable amount of CGUs which had been included in IAS 36 by the issue of IFRS 13. This amendment is not expected to have an impact on the Bank’s f inancial statements.
– Amendments to IAS 32, ‘Offsetting Financial Assets and Financial Liabil i t ies’ ( issued in December 2011 and effective for annual periods beginning on or after 1 January 2014). The amendment added application guidance to IAS 32 to address inconsistencies identif ied in applying some of the offsetting criteria. This includes clarifying the meaning of ‘currently has a legally enforceable right of set-off ’ and that some gross settlement systems may be considered equivalent to net
Fenicia Bank Annual Report
2013
53
settlement. This amendment is not expected to have an impact on the Bank’s f inancial performance or posit ion.
– Amendments to IAS 39, ‘Novation of Derivatives and Continuation of Hedge Accounting’. The amendment provided rel ief from discontinuing hedge accounting when novation of a derivative designated as a hedging instrument meets certain criteria. This amendment is not expected to have an impact on the Bank’s f inancial performance or posit ion.
2.2 Foreign currency translation (a) Functional and presentation currency
I tems included in the financial statements of the Bank are measured using the currency of the primary economic environment in which the Bank operates (‘the functional currency’). The financial statements are presented in Lebanese pounds, which is the Bank’s functional and presentation currency.
(b) Transactions and balances
Foreign currency transactions are translated into the functional currency using the exchange rates prevail ing at the dates of the transactions. Monetary items denominated in foreign currency are translated with the closing rate as at the reporting date. Non-monetary items measured at historical cost denominated in a foreign currency are translated with the exchange rate as at the date of init ial recognition; non-monetary items in a foreign currency that are measured at fair value are translated using the exchange rates at the date when the fair value was determined. Foreign exchange gains and losses result ing from the settlement of such transactions and from the translation at year-end exchange rates of monetary assets and l iabil i t ies denominated in foreign currencies are recognised in the statement of comprehensive income.
Changes in the fair value of monetary securit ies denominated in foreign currency are analysed between translation differences result ing from changes in amortised cost of the security and other changes in the carrying amount of the security. Translation differences related to changes in amortised cost are recognised in profit or loss.
Translation differences on non-monetary f inancial assets and l iabil i t ies are recognised in the profit or loss as part of the fair value gain or loss. Translation differences on non-monetary f inancial instruments such as equities measured at fair value through other comprehensive income are included in other comprehensive income.
2.3 | Financial assets and liabilities
In accordance with IFRS 9, al l f inancial assets and l iabil i t ies have to be recognised in the balance sheet and measured in accordance with their assigned category.
2.3.1 | Date of recognition
All f inancial assets and l iabil i t ies are init ial ly recognised on the trade date, i.e. the date that the Bank becomes a party to the contractual provisions of the instrument. This includes purchases or sales of f inancial assets that require delivery of assets within the time frame generally established by regulation or convention in the market place.
2.3.2 | Classification and measurement a. Financial assets
The Bank classif ies its f inancial assets as measured at fair value or at amortised cost. The classif ication depends on the purpose for which the financial assets were acquired. Management determines the classif ication of its f inancial assets at init ial recognition.
Fenicia Bank Annual Report2013
54
(i) Financial assets at amortised cost
Debt instruments are subsequently measured at amortised cost less any impairment loss (except for debt instruments that are designated at fair value through profit or loss upon init ial recognition) if they meet the fol lowing two conditions:
- The asset is held within a business model whose objective is to hold assets in order to collect contractual cash flows; and
- The contractual terms of the instrument give rise on specif ied dates to cash flows that are solely payments of principal and interest on the principal amount outstanding.
These financial assets are init ial ly recognised at cost, being the fair value of the consideration paid for the acquisit ion of the investment. All transaction costs directly attr ibuted to the acquisit ion are also included in the cost of investment. After init ial measurement, these financial assets are measured at amortised cost using the effective interest rate method (EIR), less allowance for impairment. Amortised cost is calculated by taking into account any discount of premium on acquisit ion and fees and costs that are an integral part of the effective interest rate. The amortisation is included in “Interest and similar income” in the statement of comprehensive income. The losses arising from impairment are recognised in the statement of comprehensive income in “Net gains/losses on financial assets at amortised cost”.
Gains and losses arising from the derecognition of f inancial assets measured at amortised cost are reflected under “Net gain ( loss) from sale of f inancial assets at amortised cost” in the statement of comprehensive income.
(ii) Financial assets at fair value
Included in this category are those debt instruments that do not meet the conditions in
“Financial assets at amortised cost” above, debt instruments designated at fair value through profit or loss upon init ial recognition, and equity instruments at fair value through profit or loss.
Debt instruments at fair value through profit or loss
The Bank has not designated any debt instruments as measured at fair value through profit or loss to eliminate or signif icantly reduce an accounting mismatch.
Equity instruments at fair value through profit or loss
Investments in equity instruments are classif ied at fair value through profit or loss, unless the Bank designates at init ial recognition an investment that is not held for trading as at fair value through other comprehensive income.
b. Financial l iabil it ies
Liabil it ies are init ial ly measured at fair value plus, in the case of a f inancial l iabil i ty not at fair value through profit or loss, particular transaction costs. Liabil i t ies are subsequently measured at amortised cost or fair value.
The Bank classif ies al l f inancial l iabil i t ies as subsequently measured at amortised cost using the effective interest method, except for:
- f inancial l iabil i t ies at fair value through profit or loss (including derivatives);
- f inancial l iabil i t ies that arise when a transfer of a f inancial asset does not qualify for derecognition or when the continuing involvement approach applies;
- f inancial guarantee contracts and commitments to provide a loan at a below-market interest rate which after init ial recognition are subsequently measured at the higher of the amount determined
Fenicia Bank Annual Report
2013
55
in accordance with IAS 37 Provisions, Contingent Liabil i t ies and Contingent Assets and the amount init ial ly recognised less, when appropriate, cumulative amortisation recognised in accordance with IAS 18 Revenue.
After init ial measurement, due to central bank, due to banks and deposits from customers are measured at amortised cost less amounts repaid using the effective interest rate method. Amortised cost is calculated by taking into account any discount or premium on the issue and costs that are an integral part of the effective interest rate method.
2.3.3 | Derecognition of financial assets and financial liabilities
(i) Financial assets
A financial asset (or, where applicable a part of a financial asset or part of a group of similar financial assets) is derecognised when:
- the rights to receive cash flows from the asset have expired;
- the Bank has transferred its rights to receive cash flows from the asset or has assumed an obligation to pay the received cash flows in full without material delay to a third party under a ‘pass-through’ arrangement; and either:
(a) the Bank has transferred substantially all the risks and rewards of the asset, or
(b) the Bank has neither transferred nor retained substantially all the risks and rewards of the asset, but has transferred control of the asset.
When the Bank has transferred its rights to receive cash flows from an asset or has entered into a pass-through arrangement, and has neither transferred nor retained substantially all the risks and rewards of the asset nor transferred control of the asset, the asset is recognised to the extent of the Bank’s continuing involvement in the asset. In that case, the Bank also recognizes an associated liability. The transferred asset and the
associated liability are measured on a basis that reflects rights and obligations that the Bank has retained.
Continuing involvement that takes the form of a guarantee over the transferred asset is measured at the lower of the original carrying amount of the asset and the maximum amount of consideration that the Bank could be required to repay.
A financial liability is derecognised when the obligation under the liability is discharged or cancelled or expires. Where an existing financial liability is replaced by another from the same lender on substantially different terms, or the terms of an existing liability are substantially modified, such an exchange or modification is treated as a derecognition of the original liability and the recognition of a new liability. The difference between the carrying value of the original financial liability and the consideration paid is recognized in the statement of comprehensive income.
2.4 | Offsetting financial instruments
Financial assets and liabilities are offset and the net amount is reported in the balance sheet when there is a legally enforceable right to offset the recognised amounts or there is an intention to settle on a net basis, or realise the asset and settle the liability simultaneously.
Income and expenses are presented on a net basis only when permitted under IFRS, or for gains and losses arising from a group of similar transactions such as in the Bank’s trading activity.
2.5 | Fair value measurement
The Bank measures financial instruments and non-financial assets, at fair value at each statement of financial position date. Also, fair values of financial instruments measured at amortised cost are disclosed in the notes.
Fair value is the price that would be received to sell an asset or paid to transfer a liability in an orderly transaction between market participants at the measurement date. The fair value measurement is based on the presumption that the transaction to sell the asset or transfer the liability
Fenicia Bank Annual Report2013
56
takes place either:
- In the principal market for the asset or liability, or - In the absence of a principal market, in the most advantageous market for the asset or liability
The principal or the most advantageous market must be accessible by the Bank. The fair value of an asset or a liability is measured using the assumptions that market participants would use when pricing the asset or liability, assuming that market participants act in their economic best interest.
A fair value measurement of a non-financial asset takes into account a market participant’s ability to generate economic benefits by using the asset in its highest and best use or by selling it to another market participant that would use the asset in its highest and best use.
The Bank uses valuation techniques that are appropriate in the circumstances and for which sufficient data are available to measure fair value, maximising the use of relevant observable inputs and minimising the use of unobservable inputs.
All assets and liabilities for which fair value is measured or disclosed in the financial statements are categorised within the fair value hierarchy, described as follows, based on the lowest level input that is significant to the fair value measurement as a whole:
- Level 1 – Quoted (unadjusted) market prices in active markets for identical assets or liabilities - Level 2 – Valuation techniques for which the lowest level input that is significant to the fair value measurement is directly or indirectly observable - Level 3 – Valuation techniques for which the lowest level input that is significant to the fair value measurement is unobservable
For assets and liabilities that are recognised in the financial statements on a recurring basis, the Bank determines whether transfers have occurred between Levels in the hierarchy by re¬assessing categorisation (based on the lowest level input that is significant to the fair value measurement as a whole) at the end of each reporting period.
Management determines the policies and procedures for both recurring fair value measurement, such as investment properties and unquoted financial assets, and for non¬recurring measurement.
At each reporting date, the management analyses the movements in the values of assets and liabilities which are required to be re-measured or re-assessed as per the Bank’s accounting policies. For this analysis, the management verifies the major inputs applied in the latest valuation by agreeing the information in the valuation computation to contracts and other relevant documents.
For the purpose of fair value disclosures, the Bank has determined classes of assets and liabilities on the basis of the nature, characteristics and risks of the asset or liability and the level of the fair value hierarchy as explained above.
2.6 | Impairment of financial assets
The Bank assesses at each statement of financial position date whether there is any objective evidence that a financial asset or a group of financial assets is impaired. A financial asset or a group of financial assets is deemed to be impaired if, and only if, there is objective evidence of impairment as a result of one or more events that has occurred after the initial recognition of the asset (an incurred ‘loss event’) and that loss event (or events) has an impact on the estimated future cash flows of the financial asset or the group of financial assets that can be reliably estimated.
The criteria that the Bank uses to determine whether there is objective evidence of an impairment loss include:
a) significant financial difficulty of the issuer or obligor;
b) a breach of contract, such as a default or delinquency in interest or principal payments;
c) the lender, for economic or legal reasons relating to the borrower’s financial difficulty, granting to the borrower a concession that the lender would not otherwise consider;
d) it becomes probable that the borrower will enter bankruptcy or other financial reorganisation;
Fenicia Bank Annual Report
2013
57
e) the disappearance of an active market for that financial asset because of financial difficulties; or
f) observable data indicating that there is a measurable decrease in the estimated future cash flows from a portfolio of financial assets since the initial recognition of those assets, although the decrease cannot yet be identified with the individual financial assets in the portfolio, including:
(i) adverse changes in the payment status of borrowers in the portfolio; and
(ii) national or local economic conditions that correlate with defaults on the assets in the portfolio.
Financial assets carried at amortised cost
For financial assets carried at amortised cost, the Bank first assesses individually whether objective evidence of impairment exists for financial assets that are individually significant, or collectively for financial assets that are not individually significant. If the Bank determines that no objective evidence of impairment exists for an individually assessed financial asset, it includes the asset in a group of financial assets with similar credit risk characteristics and collectively assesses them for impairment. Assets that are individually assessed for impairment and for which an impairment loss is, or continues to be, recognised are not included in a collective assessment of impairment.
If there is objective evidence that an impairment loss has been incurred, the amount of the loss is measured as the difference between the asset’s carrying amount and the present value of estimated future cash flows (excluding future expected credit losses that have not yet been incurred). The carrying amount of the asset is reduced through the use of an allowance account and the amount of the loss is recognized in the statement of comprehensive income.
Loans together with the associated allowance are written off when there is no realistic prospect of future recovery and all collateral has been realized or has been transferred to the Bank. If, in a subsequent year,
the amount of the estimated impairment loss increases or decreases because of an event occurring after the impairment was recognized, the previously recognized impairment loss is increased or reduced by adjusting the allowance account. If a future write-off is later recovered, the recovery is credited to the ‘Net loan impairment charges’ in the statement of comprehensive income.
The present value of the estimated future cash flows is discounted at the financial asset’s original effective interest rate. If a loan has a variable interest rate, the discount rate for measuring any impairment loss is the current effective interest rate. The calculation of the present value of the estimated future cash flows of a collateralised financial asset reflects the cash flows that may result from foreclosure less costs of obtaining and selling the collateral, whether or not the foreclosure is probable.
For the purpose of a collective evaluation of impairment, financial assets are grouped on the basis of the Bank’s internal credit grading system, that considers credit risk characteristics such as asset type, industry, geographical location, collateral type, past-due status and other relevant factors.
Future cash flows on a group of financial assets that are collectively evaluated for impairment are estimated on the basis of historical loss experience for assets with credit risk characteristics similar to those in the Bank. Historical loss experience is adjusted on the basis of current observable data to reflect the effects of current conditions on which the historical loss experience is based and to remove the effects of conditions in the historical period that do not exist currently.
Estimates of changes in future cash flows reflect, and are directionally consistent with, changes in related observable data from year to year (such as changes in unemployment rates, property prices, commodity prices, payment status, or other factors that are indicative of incurred losses in the Bank and their magnitude). The methodology and assumptions used for estimating future cash flows are reviewed regularly to reduce any differences between loss estimates and actual loss experience.
Fenicia Bank Annual Report2013
58
Renegotiated loans
Loans that are either subject to collective impairment assessment or individually significant and whose terms have been renegotiated are no longer considered to be past due but are treated as new loans. In subsequent years, the asset is considered to be past due and disclosed only if renegotiated again.
2.7 Leases
The leases entered into by the Bank, are principally operating leases. Leases in which a significant portion of the risks and rewards of ownership are retained by another party, the lessor, are classified as operating leases. Payments made under operating leases (net of any incentives received from the lessor) are charged to the profit or loss on a straight-line basis over the period of the lease. The total payments made under operating leases are charged to other operating expenses in the statement of comprehensive income on a straight-line basis over the period of the lease. When an operating lease is terminated before the lease period has expired, any payment required to be made to the lessor by way of penalty is recognised as an expense in the period in which termination takes place.
2.8 Recognition of income and expenses
Revenue is recognised to the extent that it is probable that the economic benefits will flow to the Bank and the revenue can be reliably measured. The following specific recognition criteria must also be met before revenue is recognised.
(i) Interest and similar income and expenses
For all financial instruments measured at amortised cost, and financial instruments designated at fair value through profit or loss, interest income or expense is recorded using the effective interest rate, which is the rate that exactly discounts estimated future cash payments or receipts through the expected life of the financial instrument or
a shorter period, where appropriate, to the net carrying amount of the financial asset or financial liability. The calculation takes into account all contractual terms of the financial instrument and includes any fees or incremental costs that are directly attributable to the instrument and are an integral part of the effective interest rate, but not future credit losses.
The carrying amount of the financial asset or financial liability is adjusted if the Bank revises its estimates of payments or receipts. The adjusted carrying amount is calculated based on the original effective interest rate and the change in the carrying amount is recorded as “Interest and similar income” for financial assets and “Interest and similar expense” for financial liabilities.
Once the recorded value of a financial asset or a group of similar financial assets has been reduced due to an impairment loss, interest income continues to be recognised using the rate of interest used to discount the future cash flows for the purpose of measuring the impairment loss.
(ii) Fee and commission income
The Bank earns fee and commission income from a diverse range of services it provides to its customers.
Fees earned for the provision of services over a period of time are accrued over that period. These fees include private banking, custody and other management and advisory fees.
Loan commitment fees for loans that are likely to be drawn down and other credit related fees are deferred (together with any incremental costs) and recognised as an adjustment to the effective interest rate on the loan. When it is unlikely that a loan be drawn down, the loan commitment fees are recognised over the commitment period on a straight line basis.
2.9 | Cash and cash equivalents
Cash and cash equivalents comprise balances with less than three months’ maturity from the date of acquisition,
Fenicia Bank Annual Report
2013
59
including cash in hand, deposits held at call with banks and other short-term highly liquid investments with original maturities of three months or less.
2.10 | Property and equipment
Land and buildings comprise mainly branches and offices. All property and equipment is stated at historical cost less depreciation. Historical cost includes expenditure that is directly attributable to the acquisition of the items.
Subsequent expenditures are included in the asset’s carrying amount or are recognised as a separate asset, as appropriate, only when it is probable that future economic benefits associated with the item will flow to the Bank and the cost of the item can be measured reliably. The carrying amount of the replaced part is derecognised. All other repair and maintenance costs are charged to other operating expenses during the financial period in which they are incurred.
Land is not depreciated. Depreciation of other assets is calculated using the straight-line method to allocate their cost to their residual values over their estimated useful lives, as follows: Years
Buildings 50Leaseholds improvements 7Office and computer equipment 5-7Furniture and fixtures 13Vehicles 17
The assets’ residual values and useful lives are reviewed, and adjusted if appropriate, at each date of the balance sheet. Assets are reviewed for impairment whenever events or changes in circumstances indicate that the carrying amount may not be recoverable.
An asset’s carrying amount is written down immediately to its recoverable amount if the asset’s carrying amount is greater than its estimated recoverable amount. The recoverable amount is the higher of the asset’s fair value less costs to sell and value in use.
Gains and losses on disposals are determined by
comparing proceeds with carrying amount. These are included in other operating income in the statement of comprehensive income.
2.11 | Intangible assets
Intangible assets comprise mainly computer software licences. Intangible assets are stated at cost. Intangible assets with a definite useful life are amortised using the straight-line method over their estimated useful economic life. Intangible assets with an indefinite useful life are not amortised. At each date of the balance sheet, intangible assets are reviewed for indications of impairment or changes in estimated future economic benefits. If such indications exist, the intangible assets are analysed to assess whether their carrying amount is fully recoverable. An impairment loss is recognised if the carrying amount exceeds the recoverable amount.
Computer software licences
Acquired computer software licences are capitalised on the basis of the costs incurred to acquire and bring to use the specific software. These costs are amortised on the basis of the expected useful lives. Software has a maximum expected useful life of 5 years.
2.12 | Investment properties
Properties that are held for long-term rental yields or for capital appreciation or both, and that are not occupied by the Bank, are classified as investment properties. Investment properties comprise office buildings leased out under operating lease agreements.
Some properties may be partially occupied by the Bank, with the remainder being held for rental income or capital appreciation. If that part of the property occupied by the Bank can be sold separately, the Bank accounts for the portions separately. The portion that is owner-occupied is accounted for as property and equipment, and the portion that is held for rental income or capital appreciation or both is treated as investment property. When the portions cannot be sold separately, the whole property is treated as investment property only if an insignificant portion is owner-occupied. In order to
Fenicia Bank Annual Report2013
60
determine the percentage of the portions, the Bank uses the size of the property measured in square meter.
Investment properties are measured initially at cost, including transaction costs. The carrying amount includes the cost of replacing parts of an existing investment property at the time the cost has incurred if the recognition criteria are met; and excludes the costs of day-to-day servicing of an investment property. Subsequent to initial recognition, investment properties are stated at cost less accumulated depreciation and impairment, if any. Subsequent expenditure is included in the asset’s carrying amount only when it is probable that future economic benefits associated with the item will flow to the Bank and the cost of the item can be measured reliably. All other repairs and maintenance costs are charged to the statement of comprehensive income during the financial period in which they are incurred.
Depreciation is calculated using the straight-line method to allocate their cost to their residual values over their estimated useful lives of 50 years.
The assets’ residual values and useful lives are reviewed, and adjusted if appropriate, at each date of the balance sheet. Assets are reviewed for impairment whenever events or changes in circumstances indicate that the carrying amount may not be recoverable.
An asset’s carrying amount is written down immediately to its recoverable amount if the asset’s carrying amount is greater than its estimated recoverable amount. The recoverable amount is the higher of the asset’s fair value less costs to sell and value in use.
Gains and losses on disposals are determined by comparing proceeds with carrying amount. These are included in other operating income in the statement of comprehensive income.
2.13 | Impairment of non-financial assets
The Bank assesses at each reporting date whether there is an indication that an asset may be impaired. If
any indication exists, or when annual impairment testing for an asset is required, the Bank estimates the asset’s recoverable amount. An asset’s recoverable amount is the higher of an asset’s or cash-generating unit’s fair value less costs to sell and its value in use. Where the carrying amount of an asset or cash-generating unit exceeds its recoverable amount, the asset is considered impaired and is written down to its recoverable amount. In assessing the value in use, the estimated future cash flows are discounted to their present value using a pre-tax discount rate that reflects current market assessments of the time value of money and the risks specific to the asset.
In determining fair value less costs to sell, an appropriate valuation model is used. These calculations are corroborated by valuation multiples, quoted share prices for publicly traded subsidiaries or other available fair value indicators.
For assets excluding goodwill, an assessment is made at each reporting date as to whether there is any indication that previously recognized impairment losses may no longer exist or may have decreased. If such indication exists, the recoverable amount is estimated. A previously recognised impairment loss is reversed only if there has been a change in the assumptions used to determine the asset’s recoverable amount since the last impairment loss was recognised.
The reversal is limited so that the carrying amount of the asset does not exceed its recoverable amount, nor exceeds the carrying amount that would have been determined, net of depreciation, had no impairment loss been recognized for the asset in prior years. Such reversal is recognised in the statement of comprehensive income.
Impairment losses relating to goodwill cannot be reversed in future periods.
2.14 | Financial guarantee contracts
Financial guarantee contracts are contracts that require the issuer to make specified payments to reimburse the
Fenicia Bank Annual Report
2013
61
holder for a loss it incurs because a specified debtor fails to make payments when due, in accordance with the terms of a debt instrument. Such financial guarantees are given to banks, financial institutions and other bodies on behalf of customers to secure loans, overdrafts and other banking facilities.
Financial guarantees are initially recognised in the financial statements at fair value on the date the guarantee was given. The fair value of a financial guarantee at the time of signature is zero because all guarantees are agreed on arm’s length terms and the value of the premium agreed corresponds to the value of the guarantee obligation. No receivable for the future premiums is recognised. Subsequent to initial recognition, the Bank’s liabilities under such guarantees are measured at the higher of the initial amount, less amortisation of fees recognised in accordance with IAS 18, and the best estimate of the amount required to settle the guarantee. These estimates are determined based on experience of similar transactions and history of past losses, supplemented by the judgement of management. The fee income earned is recognised on a straight-line basis over the life of the guarantee. Any increase in the liability relating to guarantees is reported in the statement of comprehensive income within other operating expenses.
2.15 | Retirement benefit obligation
The Bank is subscribed to the compulsory defined benefit plan of the national social security fund.
IAS 19 ‘Employee benefits’ requirements:
A defined benefit plan is a pension plan that defines an amount of pension benefit that an employee will receive on retirement, usually dependent on one or more factors such as age, years of service or compensation. The liability recognised in the balance sheet in respect of the defined benefit plan is the present value of the defined benefit obligation at the balance sheet date less contributions to the fund. The present value of the defined benefit obligation is determined by discounting the estimated future cash outflows using interest rates of government securities that have terms to maturity
approximating the terms of the related pension liability.
Local requirements:
The compulsory defined benefit plan varies according to each employee’s final salary and length of service, subject to the completion of a minimum service period. The provision is calculated based on the difference between total indemnities due and total monthly contributions paid to National Social Security Fund (‘’NSSF’’), End-of-Service Indemnity contributions paid to NSSF represents 8.5 percent of employee benefits.
2.16 Taxation
Taxation is provided for in accordance with the fiscal regulations applicable in Lebanon.
(a) Current income tax
Current tax assets and liabilities for the current and prior years are measured at the amount expected to be recovered from or paid to the taxation authorities. The tax rates and tax laws used to compute the amount are those that are enacted or substantively enacted by the reporting date.
The Bank’s profits from operations in Lebanon are subject to a tax rate of 15% after deducting the 5% tax on interest received according to Law no. 497/2003 dated 30 January 2003.
The Bank is also subject to distribution tax of 10% on net profit after allocation to legal reserve.
(b) Deferred income tax
Deferred tax is provided on temporary differences at the reporting date between the tax bases of assets and liabilities and their carrying amounts for financial reporting purposes. Deferred tax liabilities are recognized for all taxable temporary differences, except:
- Where the deferred tax liability arises from the initial recognition of goodwill or of an asset or liability in a transaction that is not a business combination and, at the time of the transaction, affects neither the accounting profit nor taxable profit or loss.
Fenicia Bank Annual Report2013
62
- In respect of taxable temporary differences associated with investments in subsidiaries, where the timing of the reversal of the temporary differences can be controlled and it is probable that the temporary differences will not reverse in the foreseeable future.
Deferred tax assets are recognised for all deductible temporary differences, carry forward of unused tax credits and unused tax losses, to the extent that it is probable that taxable profit will be available against which the deductible temporary differences, and the carry forward of unused tax credits and unused tax losses can be utilised except:
- Where the deferred tax asset relating to the deductible temporary difference arises from the initial recognition of an asset or liability in a transaction that is not a business combination and, at the time of the transaction, affects neither the accounting profit nor taxable profit or loss.
- In respect of deductible temporary differences associated with investments in subsidiaries, deferred tax assets are recognised only to the extent that it is probable that the temporary differences will reverse in the foreseeable future and taxable profit will be available against which the temporary differences can be utilised.
The carrying amount of deferred tax assets is reviewed at each statement of financial position date and reduced to the extent that it is no longer probable that sufficient taxable profit will be available to allow all or part of the deferred tax asset to be utilised. Unrecognised deferred tax assets are reassessed at each statement of financial position date and are recognised to the extent that it has become probable that future taxable profit will allow the deferred tax asset to be recovered.
Deferred tax assets and liabilities are measured at the tax rates that are expected to apply in the year when the asset is realised or the liability is settled, based on tax rates (and tax laws) that have been enacted or substantively enacted at the statement of financial position date.
Current tax and deferred tax relating to items recognised directly in equity are also recognised in equity and not in the statement of comprehensive income.
Deferred tax assets and deferred tax liabilities are offset if a legally enforceable right exists to set off current tax assets against current tax liabilities and the deferred taxes relate to the same taxable entity and the same taxation authority.
2.17 | Provisions for risk and charges
Provisions for restructuring costs and legal claims are recognised when the Bank has a present legal or constructive obligation as a result of past events; it is probable that an outflow of resources will be required to settle the obligation; and the amount has been reliably estimated. Provisions are not recognised for future operating losses.
Where there are a number of similar obligations, the likelihood that an outflow will be required in settlement is determined by considering the class of obligations as a whole. A provision is recognised even if the likelihood of an outflow with respect to any one item included in the same class of obligations may be small.
Provisions are measured at the present value of the expenditures expected to be required to settle the obligation using a pre-tax rate that reflects current market assessments of the time value of money and the risks specific to the obligation. The increase in the provision due to passage of time is recognised as interest expense.
2.18 | Share capital
Ordinary shares are classified as equity. Incremental costs directly attributable to the issue of new shares are shown in equity as a deduction, net of tax, from the proceeds.
2.19 | Dividend distribution
Dividend distribution to the Bank’s shareholders is recognised as a liability in the period in which the dividends are approved by the Bank’s shareholders.
3 | Financial risk management
The Bank’s business involves taking on risks in a targeted manner and managing them professionally. The core
Fenicia Bank Annual Report
2013
63
functions of the Bank’s risk management are to identify all key risks for the Bank, measure these risks, manage the risk positions and determine the capital allocations. The Bank regularly reviews its risk management policies and systems to reflect changes in markets, products, and best market practice.
The Bank’s aim is to achieve an appropriate balance between risk and return to minimise potential adverse effects on the Bank’s financial performance.
The Bank defines risk as the possibility of losses incurred or profits foregone, which may be caused by internal or external factors.
Risk management is carried out by the Bank’s risk management department under policies approved by the Board of Directors. The risk management department evaluates and hedges financial risks in close co-operation with the Bank’s operating units. The Board provides principles for overall risk management, as well as policies covering specific areas, such as foreign exchange risk, interest rate risk, credit risk, use of derivative financial instruments and non-derivative financial instruments The Bank’s Audit committee is responsible for monitoring compliance with the Bank’s risk management policies and procedures, and for reviewing the adequacy of the risk management framework in relation to the risks faced by the Bank. The Bank’s Audit committee is assisted in these functions by the internal audit department.
Internal audit undertakes both regular and ad-hoc reviews for risk management controls and procedures, the results of which are reported to the Bank’s Audit committee.
The risks arising from financial instruments to which the Bank is exposed are financial risks, which include credit risk, market risk, liquidity risk and operational risk (which are discussed below).
3.1 | Credit risk
Credit risk is the risk of suffering financial loss, should any of the Bank’s customers, clients or market counterparties
fail to fulfill their contractual obligations to the Bank. Credit risk arises mainly from commercial and retail loans and advances, and undrawn credit facilities arising from such lending activities, but can also arise from credit enhancement provided, such as financial guarantees, letters of credit, and acceptances.
The Bank is also exposed to other credit risks arising from investments in debt securities and balances with banks.
Credit risk is the largest risk for the Bank’s business; management therefore carefully manages its exposure to credit risk.
3.1.1 | Credit risk measurement
The estimation of credit exposure is complex and requires the use of models, as the value of a product varies with the changes in market variables, expected cash flows and the passage of time.
(a) Loans and advances (including undrawn credit facilities and guarantees)
To measure the credit risk of loans and advances to customers, the Bank rates its counterparties based on the rating models as defined by the Central Bank of Lebanon (“BDL”) basic circular no. 58:
(b) Debt securities and other bills
For debt securities and other bills, external rating such as Standard & Poor›s («S&P») rating or their equivalents are
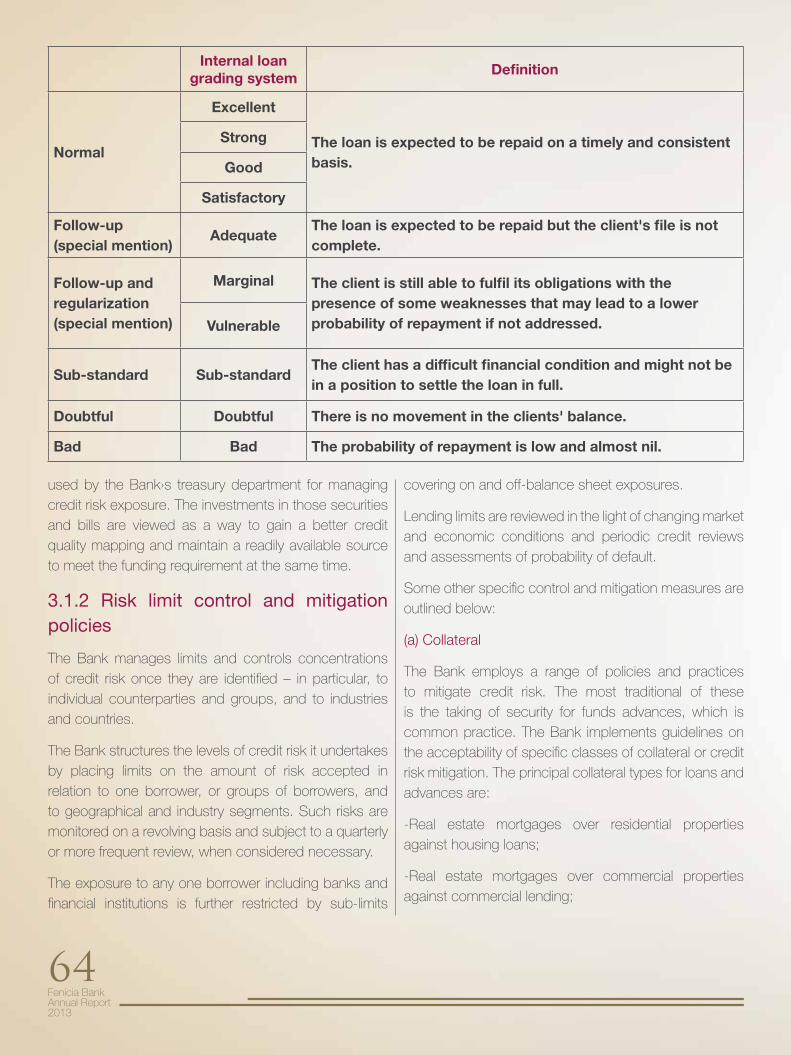
Fenicia Bank Annual Report2013
64
Internal loan grading system
Definition
Normal
Excellent
The loan is expected to be repaid on a timely and consistent basis.
Strong
Good
Satisfactory
Follow-up (special mention)
Adequate The loan is expected to be repaid but the client's file is not complete.
Follow-up and regularization (special mention)
Marginal The client is still able to fulfil its obligations with the presence of some weaknesses that may lead to a lower probability of repayment if not addressed.Vulnerable
Sub-standard Sub-standard The client has a difficult financial condition and might not be in a position to settle the loan in full.
Doubtful Doubtful There is no movement in the clients' balance.
Bad Bad The probability of repayment is low and almost nil.
used by the Bank›s treasury department for managing credit risk exposure. The investments in those securities and bills are viewed as a way to gain a better credit quality mapping and maintain a readily available source to meet the funding requirement at the same time.
3.1.2 Risk limit control and mitigation policies
The Bank manages limits and controls concentrations of credit risk once they are identified – in particular, to individual counterparties and groups, and to industries and countries.
The Bank structures the levels of credit risk it undertakes by placing limits on the amount of risk accepted in relation to one borrower, or groups of borrowers, and to geographical and industry segments. Such risks are monitored on a revolving basis and subject to a quarterly or more frequent review, when considered necessary.
The exposure to any one borrower including banks and financial institutions is further restricted by sub-limits
covering on and off-balance sheet exposures.
Lending limits are reviewed in the light of changing market and economic conditions and periodic credit reviews and assessments of probability of default.
Some other specific control and mitigation measures are outlined below:
(a) Collateral
The Bank employs a range of policies and practices to mitigate credit risk. The most traditional of these is the taking of security for funds advances, which is common practice. The Bank implements guidelines on the acceptability of specific classes of collateral or credit risk mitigation. The principal collateral types for loans and advances are:
-Real estate mortgages over residential properties against housing loans;
-Real estate mortgages over commercial properties against commercial lending;
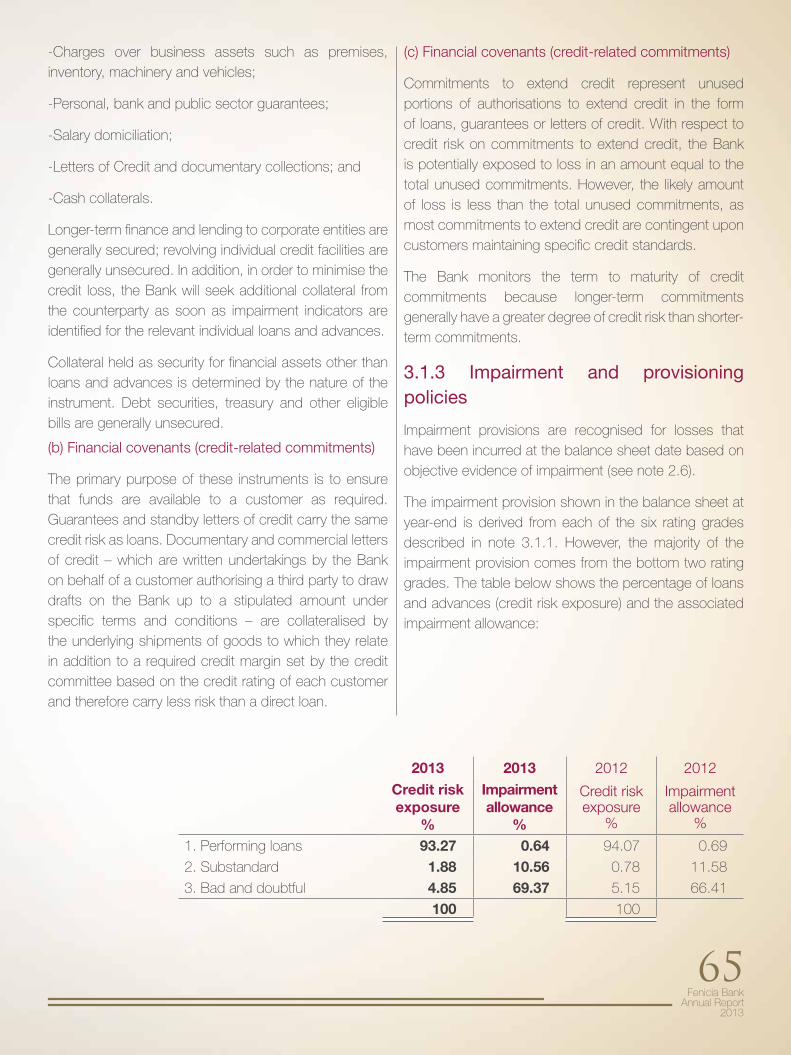
Fenicia Bank Annual Report
2013
65
-Charges over business assets such as premises, inventory, machinery and vehicles;
-Personal, bank and public sector guarantees;
-Salary domiciliation;
-Letters of Credit and documentary collections; and
-Cash collaterals.
Longer-term finance and lending to corporate entities are generally secured; revolving individual credit facilities are generally unsecured. In addition, in order to minimise the credit loss, the Bank will seek additional collateral from the counterparty as soon as impairment indicators are identified for the relevant individual loans and advances.
Collateral held as security for financial assets other than loans and advances is determined by the nature of the instrument. Debt securities, treasury and other eligible bills are generally unsecured.
(b) Financial covenants (credit-related commitments)
The primary purpose of these instruments is to ensure that funds are available to a customer as required. Guarantees and standby letters of credit carry the same credit risk as loans. Documentary and commercial letters of credit – which are written undertakings by the Bank on behalf of a customer authorising a third party to draw drafts on the Bank up to a stipulated amount under specific terms and conditions – are collateralised by the underlying shipments of goods to which they relate in addition to a required credit margin set by the credit committee based on the credit rating of each customer and therefore carry less risk than a direct loan.
2013 2013 2012 2012Credit risk exposure
%
Impairment allowance
%
Credit risk exposure
%
Impairment allowance
%
1. Performing loans 93.27 0.64 94.07 0.69
2. Substandard 1.88 10.56 0.78 11.58
3. Bad and doubtful 4.85 69.37 5.15 66.41
100 100
(c) Financial covenants (credit-related commitments)
Commitments to extend credit represent unused portions of authorisations to extend credit in the form of loans, guarantees or letters of credit. With respect to credit risk on commitments to extend credit, the Bank is potentially exposed to loss in an amount equal to the total unused commitments. However, the likely amount of loss is less than the total unused commitments, as most commitments to extend credit are contingent upon customers maintaining specific credit standards.
The Bank monitors the term to maturity of credit commitments because longer-term commitments generally have a greater degree of credit risk than shorter-term commitments.
3.1.3 Impairment and provisioning policies
Impairment provisions are recognised for losses that have been incurred at the balance sheet date based on objective evidence of impairment (see note 2.6).
The impairment provision shown in the balance sheet at year-end is derived from each of the six rating grades described in note 3.1.1. However, the majority of the impairment provision comes from the bottom two rating grades. The table below shows the percentage of loans and advances (credit risk exposure) and the associated impairment allowance:
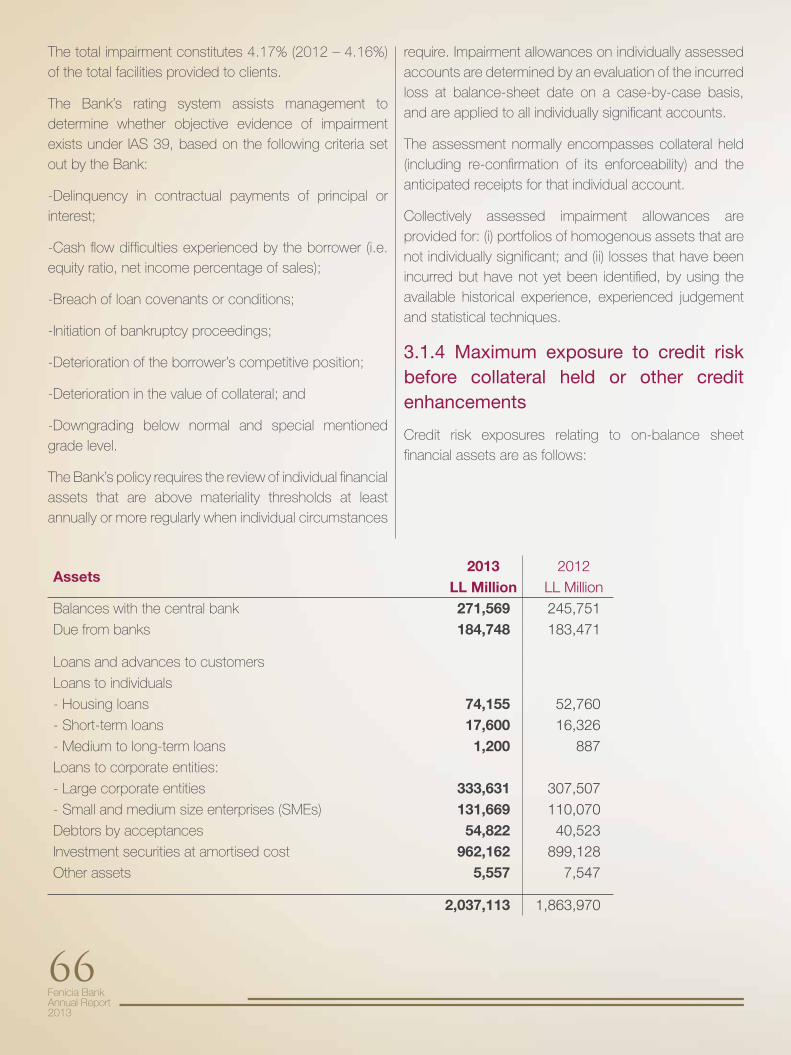
Fenicia Bank Annual Report2013
66
The total impairment constitutes 4.17% (2012 – 4.16%) of the total facilities provided to clients.
The Bank’s rating system assists management to determine whether objective evidence of impairment exists under IAS 39, based on the following criteria set out by the Bank:
-Delinquency in contractual payments of principal or interest;
-Cash flow difficulties experienced by the borrower (i.e. equity ratio, net income percentage of sales);
-Breach of loan covenants or conditions;
-Initiation of bankruptcy proceedings;
-Deterioration of the borrower’s competitive position;
-Deterioration in the value of collateral; and
-Downgrading below normal and special mentioned grade level.
The Bank’s policy requires the review of individual financial assets that are above materiality thresholds at least annually or more regularly when individual circumstances
require. Impairment allowances on individually assessed accounts are determined by an evaluation of the incurred loss at balance-sheet date on a case-by-case basis, and are applied to all individually significant accounts.
The assessment normally encompasses collateral held (including re-confirmation of its enforceability) and the anticipated receipts for that individual account.
Collectively assessed impairment allowances are provided for: (i) portfolios of homogenous assets that are not individually significant; and (ii) losses that have been incurred but have not yet been identified, by using the available historical experience, experienced judgement and statistical techniques.
3.1.4 Maximum exposure to credit risk before collateral held or other credit enhancements
Credit risk exposures relating to on-balance sheet financial assets are as follows:
Assets2013 2012
LL Million LL MillionBalances with the central bank 271,569 245,751Due from banks 184,748 183,471
Loans and advances to customers
Loans to individuals
- Housing loans 74,155 52,760- Short-term loans 17,600 16,326- Medium to long-term loans 1,200 887Loans to corporate entities:
- Large corporate entities 333,631 307,507- Small and medium size enterprises (SMEs) 131,669 110,070Debtors by acceptances 54,822 40,523Investment securities at amortised cost 962,162 899,128Other assets 5,557 7,547
2,037,113 1,863,970
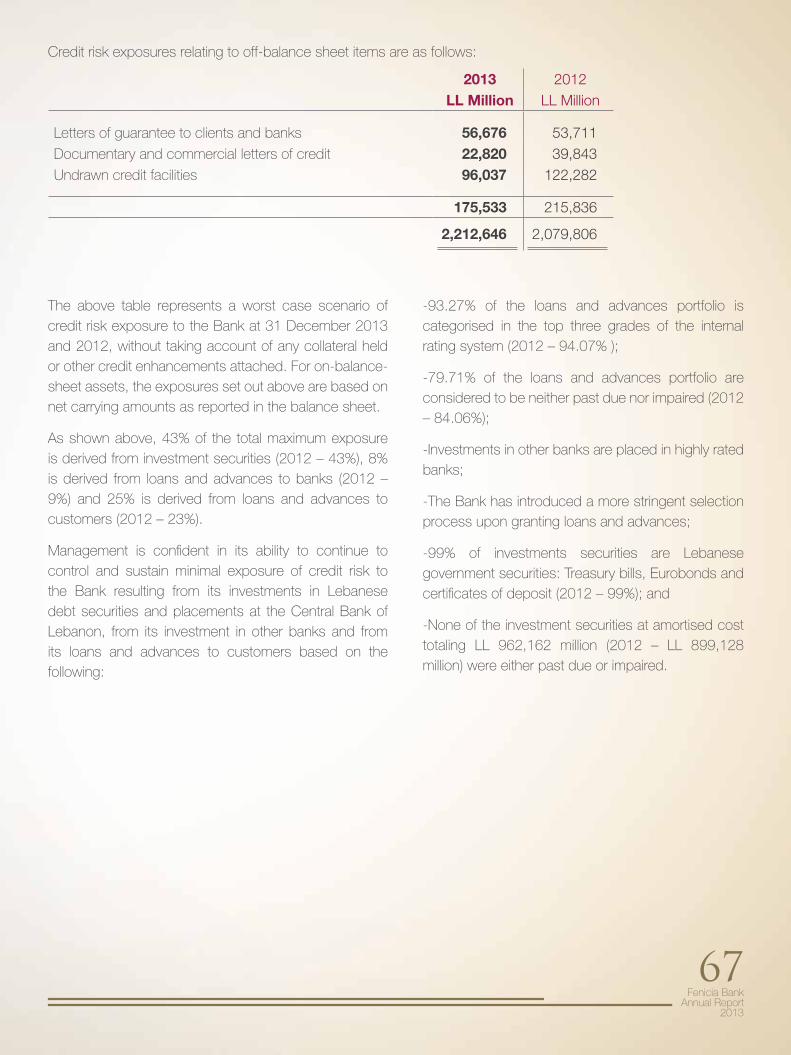
Fenicia Bank Annual Report
2013
67
2013 2012LL Million LL Million
Letters of guarantee to clients and banks 56,676 53,711Documentary and commercial letters of credit 22,820 39,843Undrawn credit facilities 96,037 122,282
175,533 215,836
2,212,646 2,079,806
Credit risk exposures relating to off-balance sheet items are as follows:
The above table represents a worst case scenario of credit risk exposure to the Bank at 31 December 2013 and 2012, without taking account of any collateral held or other credit enhancements attached. For on-balance-sheet assets, the exposures set out above are based on net carrying amounts as reported in the balance sheet.
As shown above, 43% of the total maximum exposure is derived from investment securities (2012 – 43%), 8% is derived from loans and advances to banks (2012 – 9%) and 25% is derived from loans and advances to customers (2012 – 23%).
Management is confident in its ability to continue to control and sustain minimal exposure of credit risk to the Bank resulting from its investments in Lebanese debt securities and placements at the Central Bank of Lebanon, from its investment in other banks and from its loans and advances to customers based on the following:
-93.27% of the loans and advances portfolio is categorised in the top three grades of the internal rating system (2012 – 94.07% );
-79.71% of the loans and advances portfolio are considered to be neither past due nor impaired (2012 – 84.06%);
-Investments in other banks are placed in highly rated banks;
-The Bank has introduced a more stringent selection process upon granting loans and advances;
-99% of investments securities are Lebanese government securities: Treasury bills, Eurobonds and certificates of deposit (2012 – 99%); and
-None of the investment securities at amortised cost totaling LL 962,162 million (2012 – LL 899,128 million) were either past due or impaired.
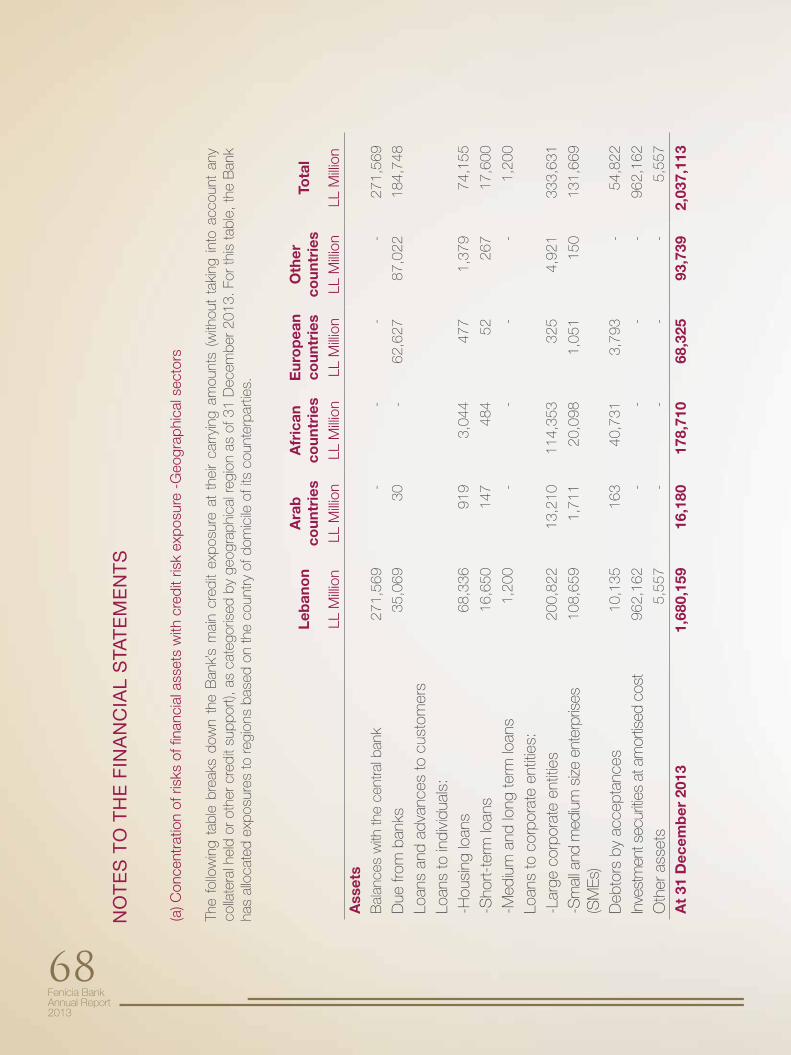
Fenicia Bank Annual Report2013
68
(a) C
once
ntra
tion
of r
isks
of fi
nanc
ial a
sset
s w
ith c
redi
t ris
k ex
posu
re -
Geo
grap
hica
l sec
tors
The
follo
win
g ta
ble
brea
ks d
own
the
Ban
k’s
mai
n cr
edit
expo
sure
at
thei
r ca
rryi
ng a
mou
nts
(with
out
taki
ng in
to a
ccou
nt a
ny
colla
tera
l hel
d or
oth
er c
redi
t sup
port)
, as
cate
goris
ed b
y ge
ogra
phic
al re
gion
as
of 3
1 D
ecem
ber 2
013.
For
this
tabl
e, th
e B
ank
has
allo
cate
d ex
posu
res
to re
gion
s ba
sed
on th
e co
untry
of d
omic
ile o
f its
cou
nter
parti
es.
NO
TE
S T
O T
HE
FIN
AN
CIA
L S
TAT
EM
EN
TS
Leb
ano
nA
rab
coun
trie
sA
fric
anco
untr
ies
Eur
op
ean
coun
trie
sO
ther
coun
trie
sTo
tal
LL M
illion
LL M
illion
LL M
illion
LL M
illion
LL M
illion
LL M
illion
Ass
ets
Bal
ance
s w
ith th
e ce
ntra
l ban
k 27
1,56
9 -
--
-27
1,56
9
Due
from
ban
ks
35,0
69
30
-62
,627
87
,022
18
4,74
8
Loan
s an
d ad
vanc
es to
cus
tom
ers
Loan
s to
indi
vidu
als:
-H
ousi
ng lo
ans
68,3
36
919
3,04
4 47
7 1,
379
74,1
55
-Sho
rt-te
rm lo
ans
16,6
50
147
484
52
267
17,6
00
-Med
ium
and
long
term
loan
s 1,
200
--
--
1,20
0
Loan
s to
cor
pora
te e
ntiti
es:
-Lar
ge c
orpo
rate
ent
ities
20
0,82
2 13
,210
11
4,35
3 32
5 4,
921
333,
631
-Sm
all a
nd m
ediu
m s
ize e
nter
pris
es
(SM
Es)
108,
659
1,71
1 20
,098
1,
051
150
131,
669
Deb
tors
by
acce
ptan
ces
10,1
35
163
40,7
31
3,79
3 -
54,8
22
Inve
stm
ent s
ecur
ities
at a
mor
tised
cos
t 96
2,16
2 -
--
-96
2,16
2
Oth
er a
sset
s 5,
557
--
--
5,55
7
At
31 D
ecem
ber
201
3 1,
680,
159
16,1
80
178,
710
68,3
25
93,7
39
2,03
7,11
3
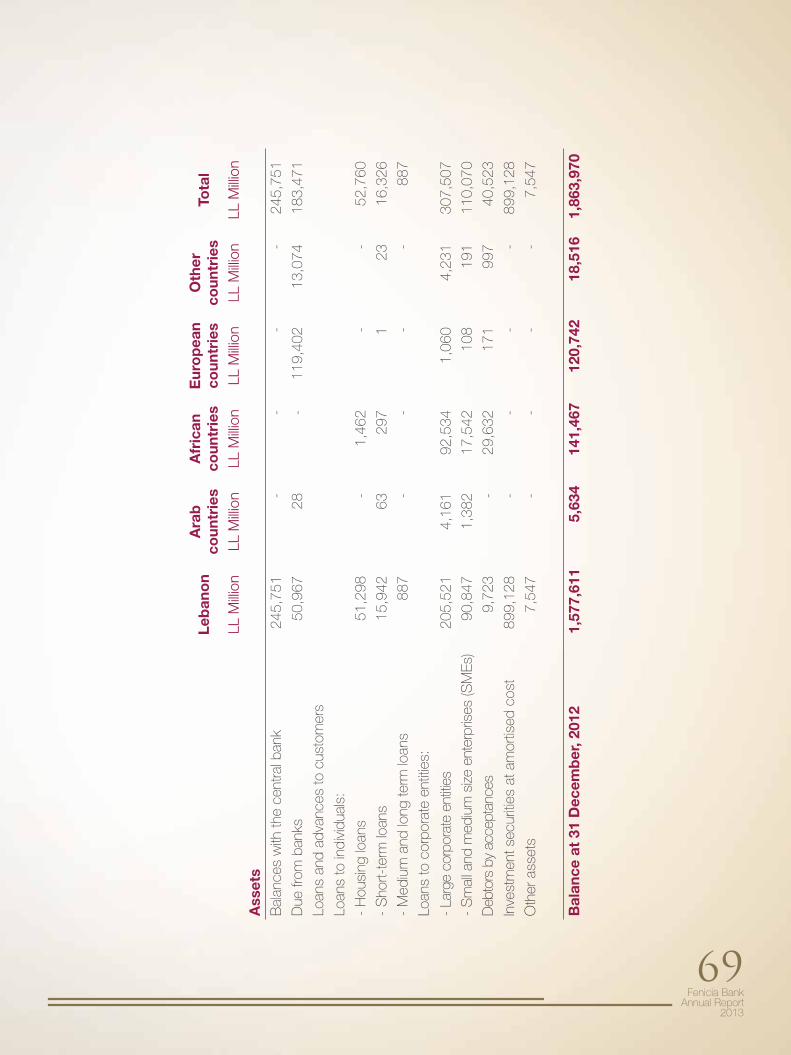
Fenicia Bank Annual Report
2013
69
Leb
ano
nA
rab
coun
trie
sA
fric
anco
untr
ies
Eur
op
ean
coun
trie
sO
ther
coun
trie
sTo
tal
LL M
illion
LL M
illion
LL M
illion
LL M
illion
LL M
illion
LL M
illion
Ass
ets
Bal
ance
s w
ith th
e ce
ntra
l ban
k24
5,75
1-
--
-24
5,75
1
Due
from
ban
ks50
,967
28-
119,
402
13,0
7418
3,47
1
Loan
s an
d ad
vanc
es to
cus
tom
ers
Loan
s to
indi
vidu
als:
- H
ousi
ng lo
ans
51,2
98-
1,46
2-
-52
,760
- S
hort-
term
loan
s15
,942
6329
71
2316
,326
- M
ediu
m a
nd lo
ng te
rm lo
ans
88
7-
--
-88
7
Loan
s to
cor
pora
te e
ntiti
es:
- La
rge
corp
orat
e en
titie
s20
5,52
14,
161
92,5
341,
060
4,23
130
7,50
7
- S
mal
l and
med
ium
siz
e en
terp
rises
(SM
Es)
90,8
471,
382
17,5
4210
819
111
0,07
0
Deb
tors
by
acce
ptan
ces
9,72
3-
29,6
3217
199
740
,523
Inve
stm
ent s
ecur
ities
at a
mor
tised
cos
t89
9,12
8-
--
-89
9,12
8
Oth
er a
sset
s7,
547
--
--
7,54
7
Bal
ance
at
31 D
ecem
ber
, 201
21,
577,
611
5,63
414
1,46
712
0,74
218
,516
1,86
3,97
0
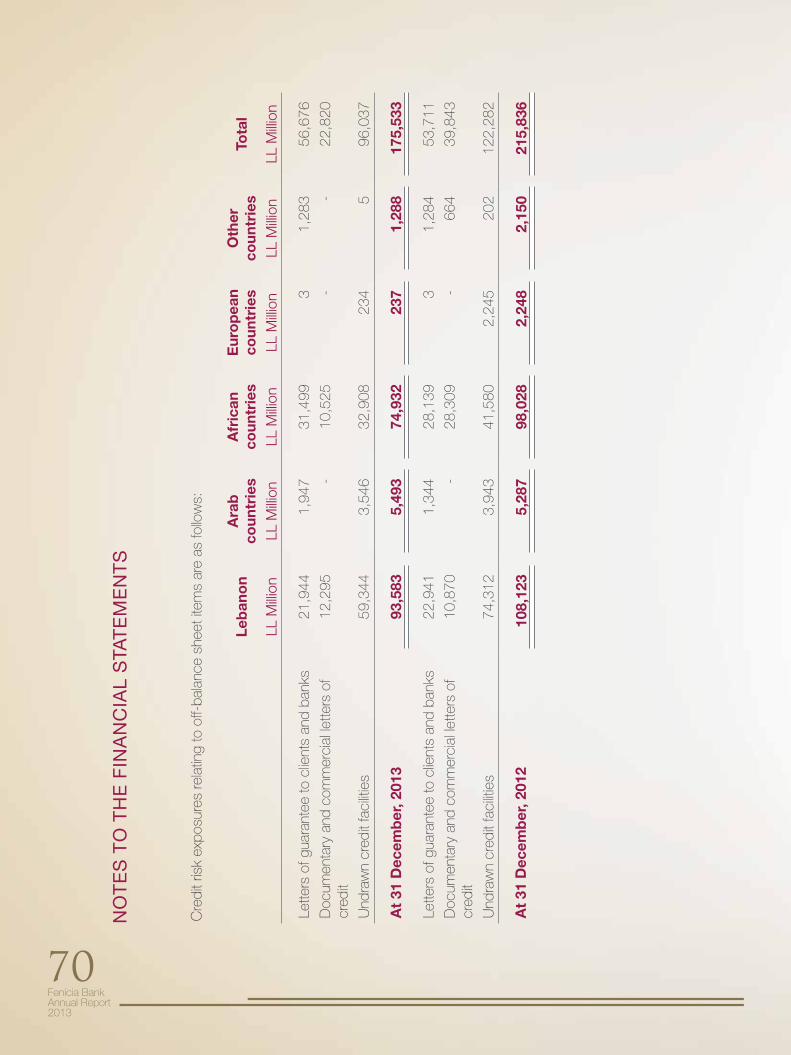
Fenicia Bank Annual Report2013
70
Cre
dit r
isk
expo
sure
s re
latin
g to
off-
bala
nce
shee
t ite
ms
are
as fo
llow
s:
Leb
ano
nA
rab
coun
trie
sA
fric
anco
untr
ies
Eur
op
ean
coun
trie
sO
ther
coun
trie
sTo
tal
LL M
illion
LL M
illion
LL M
illion
LL M
illion
LL M
illion
LL M
illion
Lette
rs o
f gua
rant
ee to
clie
nts
and
bank
s21
,944
1,
947
31,4
99
31,
283
56,6
76
Doc
umen
tary
and
com
mer
cial
lette
rs o
f cr
edit
12,2
95
-10
,525
-
-22
,820
Und
raw
n cr
edit
faci
litie
s59
,344
3,
546
32,9
08
234
596
,037
At
31 D
ecem
ber
, 201
393
,583
5,
493
74,9
32
237
1,28
8 17
5,53
3
Lette
rs o
f gua
rant
ee to
clie
nts
and
bank
s22
,941
1,
344
28,1
39
31,
284
53,7
11
Doc
umen
tary
and
com
mer
cial
lette
rs o
f cr
edit
10,8
70
-28
,309
-
664
39,8
43
Und
raw
n cr
edit
faci
litie
s74
,312
3,
943
41,5
80
2,24
5 20
212
2,28
2
At
31 D
ecem
ber
, 201
210
8,12
3 5,
287
98,0
282,
248
2,15
0 21
5,83
6
NO
TE
S T
O T
HE
FIN
AN
CIA
L S
TAT
EM
EN
TS
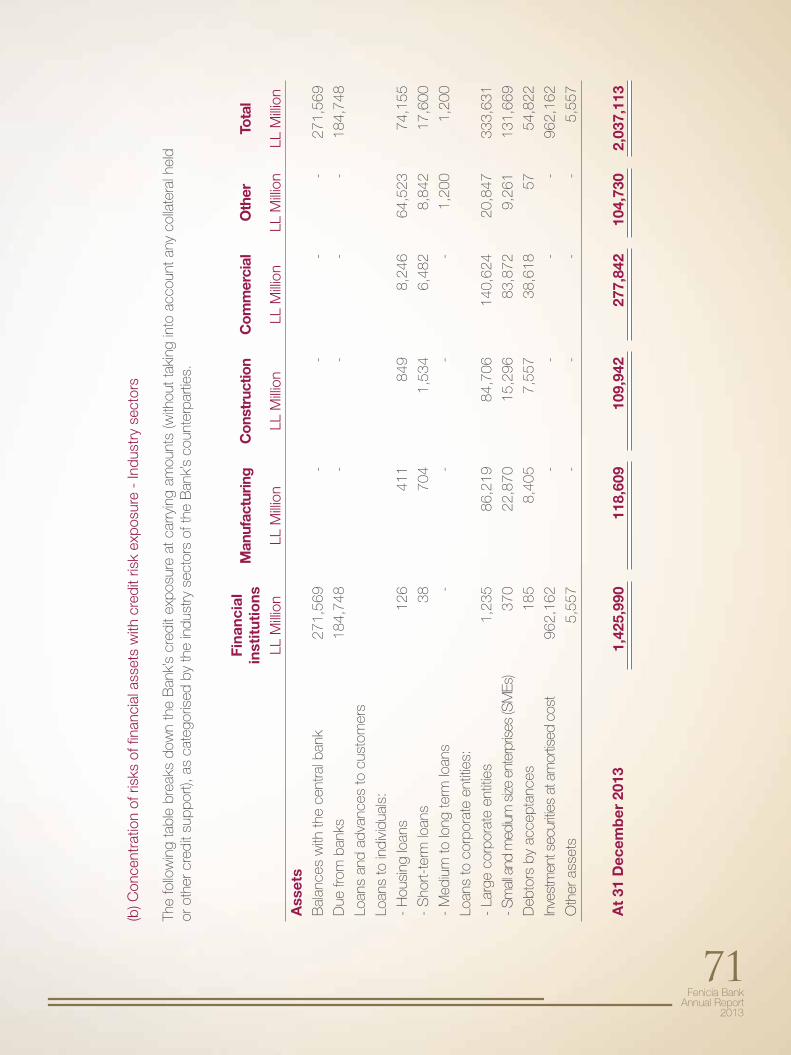
Fenicia Bank Annual Report
2013
71
(b) C
once
ntra
tion
of r
isks
of fi
nanc
ial a
sset
s w
ith c
redi
t ris
k ex
posu
re -
Indu
stry
sec
tors
The
follo
win
g ta
ble
brea
ks d
own
the
Ban
k’s
cred
it ex
posu
re a
t car
ryin
g am
ount
s (w
ithou
t tak
ing
into
acc
ount
any
col
late
ral h
eld
or o
ther
cre
dit s
uppo
rt), a
s ca
tego
rised
by
the
indu
stry
sec
tors
of t
he B
ank’
s co
unte
rpar
ties.
Fina
ncia
lin
stit
utio
nsM
anuf
actu
ring
Con
stru
ctio
nC
omm
erci
alO
ther
Tota
l
LL M
illion
LL M
illion
LL M
illion
LL M
illion
LL M
illion
LL M
illion
Ass
ets
Bal
ance
s w
ith th
e ce
ntra
l ban
k27
1,56
9 -
--
-27
1,56
9
Due
from
ban
ks
184,
748
--
--
184,
748
Loan
s an
d ad
vanc
es to
cus
tom
ers
Loan
s to
indi
vidu
als:
- H
ousi
ng lo
ans
126
411
849
8,24
6 64
,523
74
,155
- S
hort-
term
loan
s38
70
4 1,
534
6,48
2 8,
842
17,6
00
- M
ediu
m to
long
term
loan
s
--
--
1,20
0 1,
200
Loan
s to
cor
pora
te e
ntiti
es:
- La
rge
corp
orat
e en
titie
s1,
235
86,2
19
84,7
06
140,
624
20,8
47
333,
631
- Sm
all a
nd m
ediu
m s
ize e
nter
prise
s (S
MEs
) 37
0 22
,870
15
,296
83
,872
9,
261
131,
669
Deb
tors
by
acce
ptan
ces
185
8,40
5 7,
557
38,6
18
57
54,8
22
Inve
stm
ent s
ecur
ities
at a
mor
tised
cos
t96
2,16
2 -
--
-96
2,16
2
Oth
er a
sset
s5,
557
--
--
5,55
7
At
31 D
ecem
ber
201
3 1,
425,
990
118,
609
109,
942
277,
842
104,
730
2,03
7,11
3
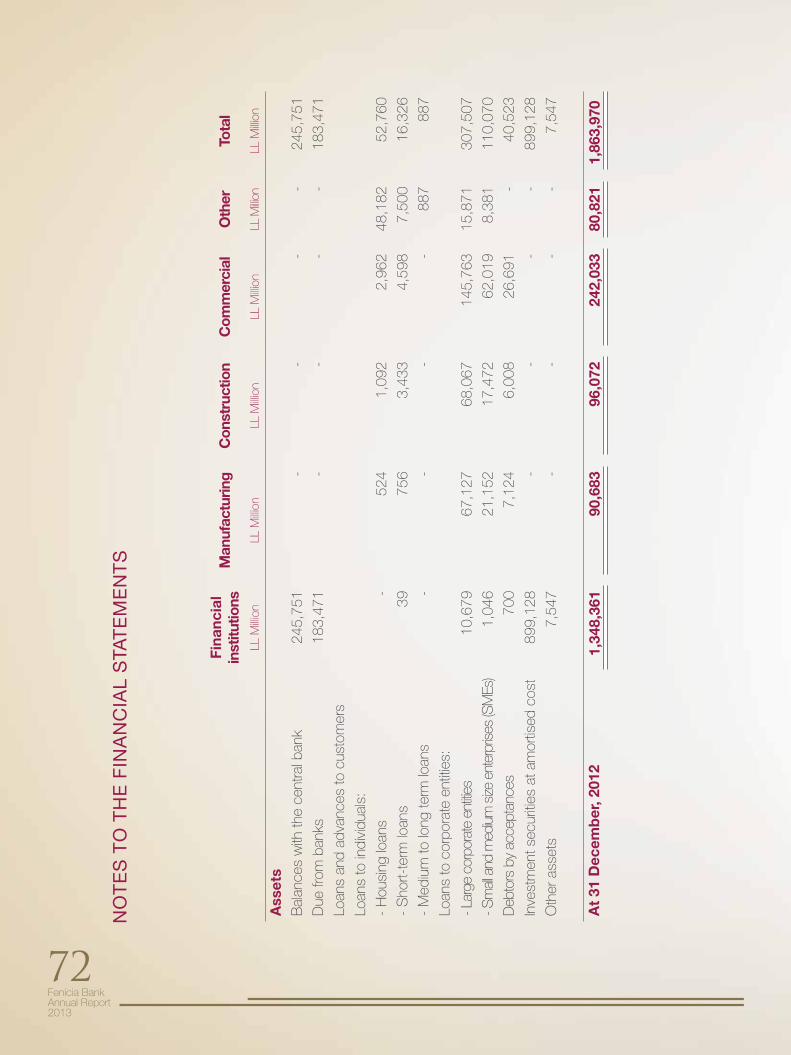
Fenicia Bank Annual Report2013
72
Fina
ncia
lin
stitu
tions
Man
ufac
turin
gC
onst
ruct
ion
Com
mer
cial
Oth
erTo
tal
LL M
illion
LL M
illion
LL M
illion
LL M
illion
LL M
illion
LL M
illion
Ass
ets
Bal
ance
s w
ith th
e ce
ntra
l ban
k24
5,75
1-
--
-24
5,75
1
Due
from
ban
ks18
3,47
1-
--
-18
3,47
1
Loan
s an
d ad
vanc
es to
cus
tom
ers
Loan
s to
indi
vidu
als:
- H
ousi
ng lo
ans
-52
41,
092
2,96
248
,182
52,7
60
- S
hort-
term
loan
s39
756
3,43
34,
598
7,50
016
,326
- M
ediu
m to
long
term
loan
s
--
--
887
887
Loan
s to
cor
pora
te e
ntiti
es:
- Lar
ge c
orpo
rate
ent
ities
10,6
7967
,127
68,0
6714
5,76
315
,871
307,
507
- Sm
all a
nd m
ediu
m s
ize e
nter
prise
s (S
MEs
)1,
046
21,1
5217
,472
62,0
198,
381
110,
070
Deb
tors
by
acce
ptan
ces
700
7,12
46,
008
26,6
91-
40,5
23
Inve
stm
ent s
ecur
ities
at a
mor
tised
cos
t89
9,12
8-
--
-89
9,12
8
Oth
er a
sset
s7,
547
--
--
7,54
7
At
31 D
ecem
ber
, 201
21,
348,
361
90,6
8396
,072
242,
033
80,8
211,
863,
970
NO
TE
S T
O T
HE
FIN
AN
CIA
L S
TAT
EM
EN
TS
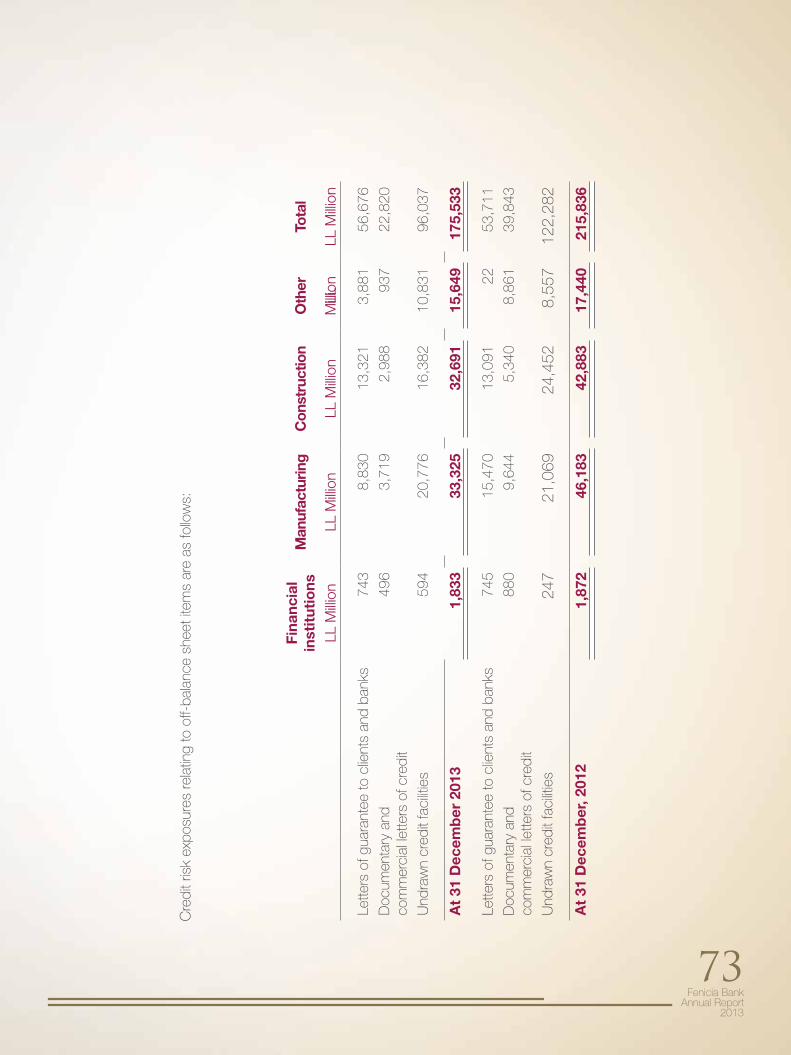
Fenicia Bank Annual Report
2013
73
Cre
dit r
isk
expo
sure
s re
latin
g to
off-
bala
nce
shee
t ite
ms
are
as fo
llow
s:
Fina
ncia
lin
stit
utio
nsM
anuf
actu
ring
Con
stru
ctio
nO
ther
Tota
l
LL M
illion
LL M
illion
LL M
illion
LL
Milli
onLL
Milli
on
Lette
rs o
f gua
rant
ee to
clie
nts
and
bank
s74
38,
830
13,3
213,
881
56,6
76
Doc
umen
tary
and
com
mer
cial
lette
rs o
f cre
dit
496
3,71
92,
988
937
22,8
20
Und
raw
n cr
edit
faci
litie
s59
420
,776
16,3
8210
,831
96,0
37
At
31 D
ecem
ber
201
31,
833
33,3
2532
,691
15,6
4917
5,53
3
Lette
rs o
f gua
rant
ee to
clie
nts
and
bank
s74
515
,470
13,0
9122
53,7
11
Doc
umen
tary
and
com
mer
cial
lette
rs o
f cre
dit
880
9,64
45,
340
8,86
139
,843
Und
raw
n cr
edit
faci
litie
s24
721
,069
24,4
528,
557
122,
282
At
31 D
ecem
ber
, 201
21,
872
46,1
8342
,883
17,4
4021
5,83
6
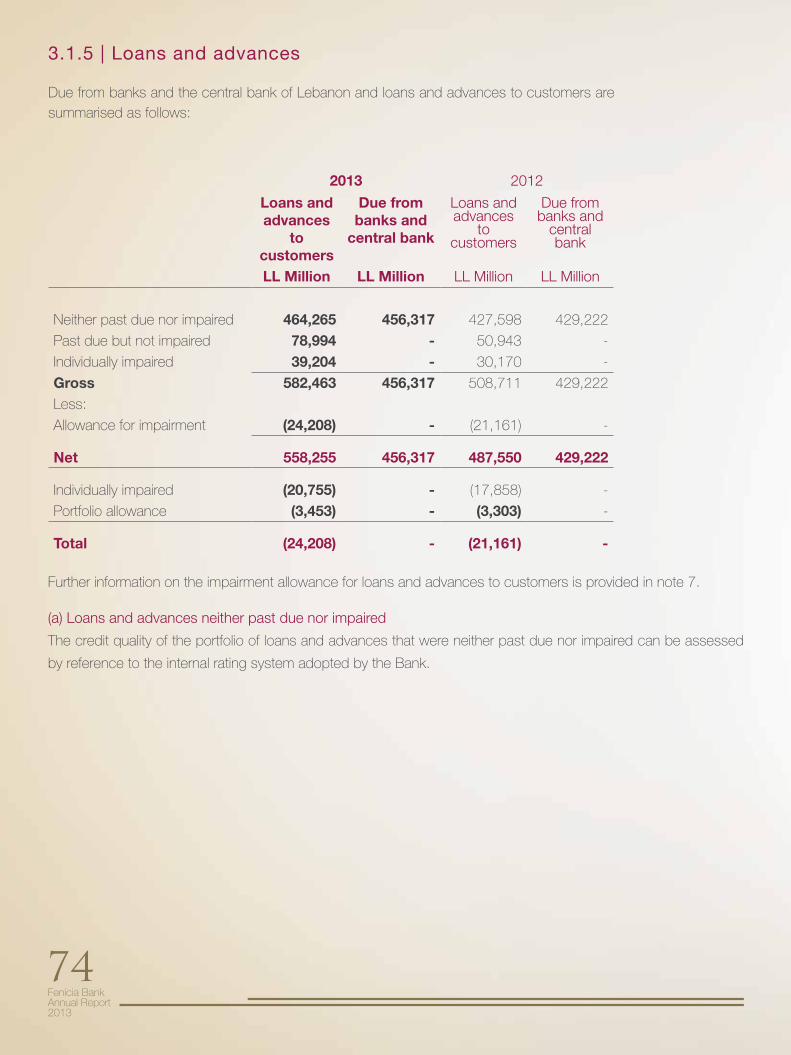
Fenicia Bank Annual Report2013
74
Further information on the impairment allowance for loans and advances to customers is provided in note 7.
(a) Loans and advances neither past due nor impaired
The credit quality of the portfolio of loans and advances that were neither past due nor impaired can be assessed
by reference to the internal rating system adopted by the Bank.
3.1.5 | Loans and advances
Due from banks and the central bank of Lebanon and loans and advances to customers are summarised as follows:
2013 2012
Loans and advances
to customers
Due from banks and
central bank
Loans and advances
to customers
Due from banks and
central bank
LL Million LL Million LL Million LL Million
Neither past due nor impaired 464,265 456,317 427,598 429,222
Past due but not impaired 78,994 - 50,943 -
Individually impaired 39,204 - 30,170 -
Gross 582,463 456,317 508,711 429,222
Less:
Allowance for impairment (24,208) - (21,161) -
Net 558,255 456,317 487,550 429,222
Individually impaired (20,755) - (17,858) -
Portfolio allowance (3,453) - (3,303) -
Total (24,208) - (21,161) -
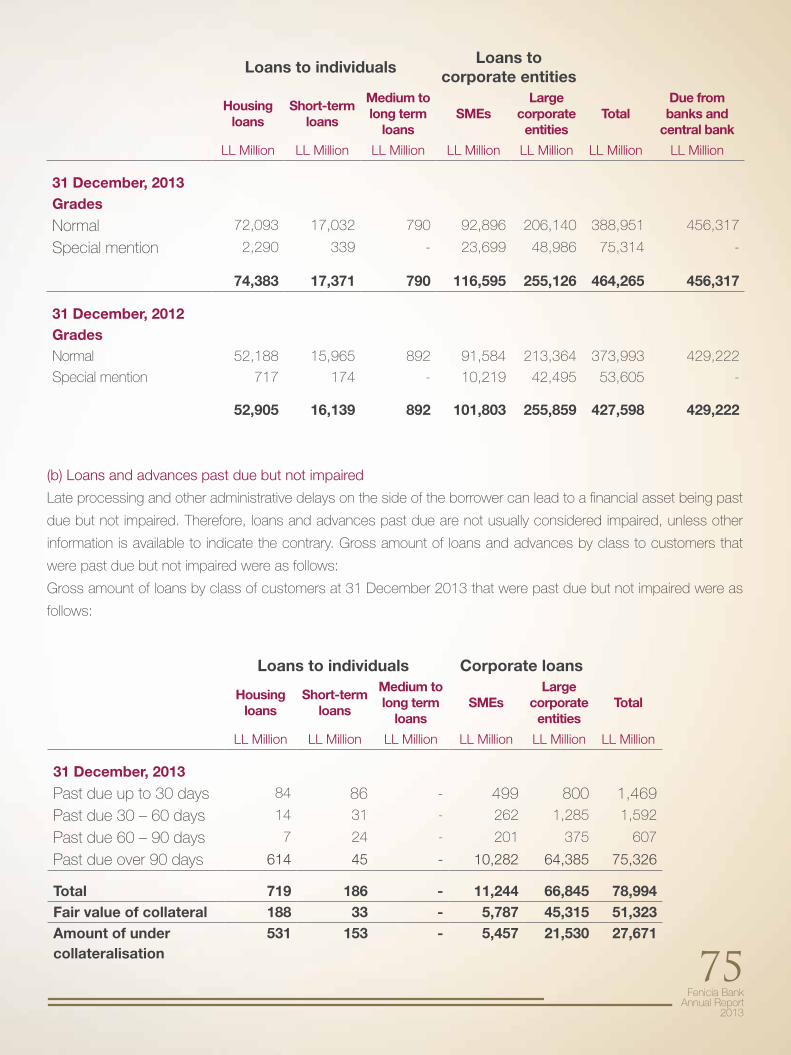
Fenicia Bank Annual Report
2013
75
(b) Loans and advances past due but not impaired
Late processing and other administrative delays on the side of the borrower can lead to a financial asset being past
due but not impaired. Therefore, loans and advances past due are not usually considered impaired, unless other
information is available to indicate the contrary. Gross amount of loans and advances by class to customers that
were past due but not impaired were as follows:
Gross amount of loans by class of customers at 31 December 2013 that were past due but not impaired were as
follows:
Loans to individualsLoans to
corporate entities
Housingloans
Short-termloans
Medium to long term
loansSMEs
Large corporate
entitiesTotal
Due from banks and
central bank
LL Million LL Million LL Million LL Million LL Million LL Million LL Million
31 December, 2013Grades
Normal 72,093 17,032 790 92,896 206,140 388,951 456,317
Special mention 2,290 339 - 23,699 48,986 75,314 -
74,383 17,371 790 116,595 255,126 464,265 456,317
31 December, 2012GradesNormal 52,188 15,965 892 91,584 213,364 373,993 429,222
Special mention 717 174 - 10,219 42,495 53,605 -
52,905 16,139 892 101,803 255,859 427,598 429,222
Loans to individuals Corporate loans
Housingloans
Short-termloans
Medium to long term
loansSMEs
Large corporate
entitiesTotal
LL Million LL Million LL Million LL Million LL Million LL Million
31 December, 2013
Past due up to 30 days 84 86 - 499 800 1,469 Past due 30 – 60 days 14 31 - 262 1,285 1,592
Past due 60 – 90 days 7 24 - 201 375 607
Past due over 90 days 614 45 - 10,282 64,385 75,326
Total 719 186 - 11,244 66,845 78,994 Fair value of collateral 188 33 - 5,787 45,315 51,323 Amount of under collateralisation
531 153 - 5,457 21,530 27,671
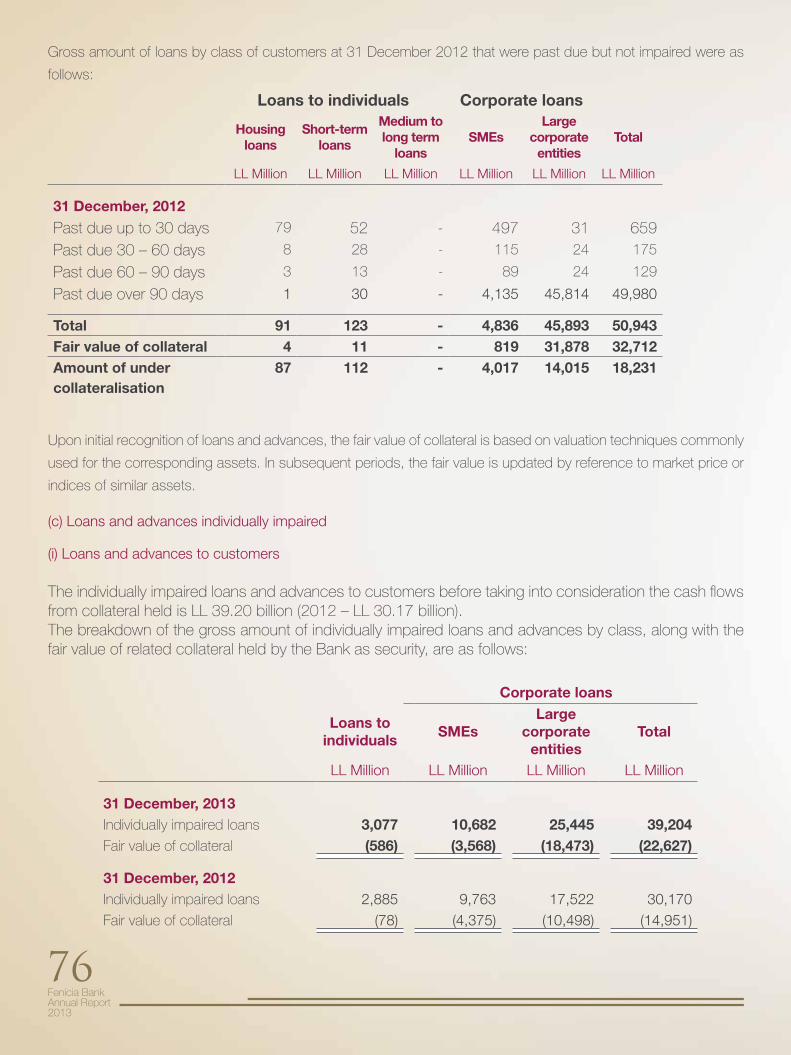
Fenicia Bank Annual Report2013
76
Gross amount of loans by class of customers at 31 December 2012 that were past due but not impaired were as
follows:
Upon initial recognition of loans and advances, the fair value of collateral is based on valuation techniques commonly
used for the corresponding assets. In subsequent periods, the fair value is updated by reference to market price or
indices of similar assets.
(c) Loans and advances individually impaired
(i) Loans and advances to customers
The individually impaired loans and advances to customers before taking into consideration the cash flows from collateral held is LL 39.20 billion (2012 – LL 30.17 billion). The breakdown of the gross amount of individually impaired loans and advances by class, along with the fair value of related collateral held by the Bank as security, are as follows:
Loans to individuals Corporate loans
Housingloans
Short-termloans
Medium to long term
loansSMEs
Large corporate
entitiesTotal
LL Million LL Million LL Million LL Million LL Million LL Million
31 December, 2012
Past due up to 30 days 79 52 - 497 31 659Past due 30 – 60 days 8 28 - 115 24 175
Past due 60 – 90 days 3 13 - 89 24 129
Past due over 90 days 1 30 - 4,135 45,814 49,980
Total 91 123 - 4,836 45,893 50,943Fair value of collateral 4 11 - 819 31,878 32,712Amount of under collateralisation
87 112 - 4,017 14,015 18,231
Corporate loans
Loans to individuals
SMEsLarge
corporate entities
Total
LL Million LL Million LL Million LL Million
31 December, 2013Individually impaired loans 3,077 10,682 25,445 39,204 Fair value of collateral (586) (3,568) (18,473) (22,627)
31 December, 2012Individually impaired loans 2,885 9,763 17,522 30,170Fair value of collateral (78) (4,375) (10,498) (14,951)
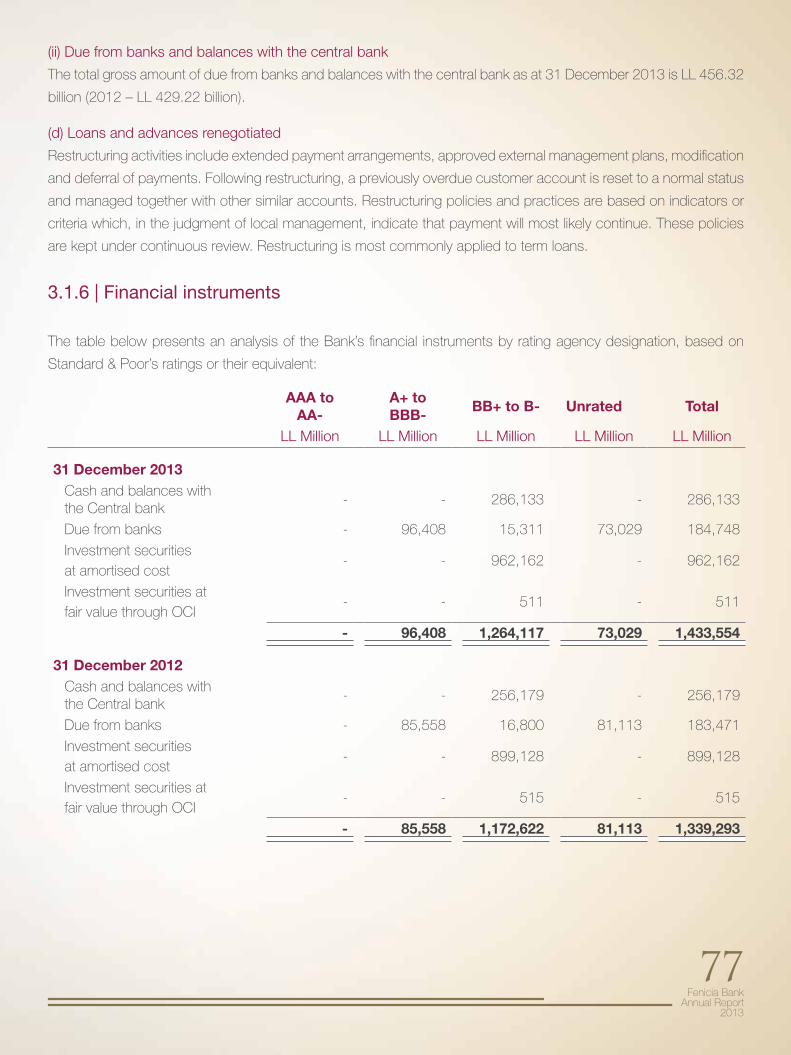
Fenicia Bank Annual Report
2013
77
(ii) Due from banks and balances with the central bank
The total gross amount of due from banks and balances with the central bank as at 31 December 2013 is LL 456.32
billion (2012 – LL 429.22 billion).
(d) Loans and advances renegotiated
Restructuring activities include extended payment arrangements, approved external management plans, modification
and deferral of payments. Following restructuring, a previously overdue customer account is reset to a normal status
and managed together with other similar accounts. Restructuring policies and practices are based on indicators or
criteria which, in the judgment of local management, indicate that payment will most likely continue. These policies
are kept under continuous review. Restructuring is most commonly applied to term loans.
3.1.6 | Financial instruments
The table below presents an analysis of the Bank’s financial instruments by rating agency designation, based on
Standard & Poor’s ratings or their equivalent:
AAA to AA-
A+ to BBB-
BB+ to B- Unrated Total
LL Million LL Million LL Million LL Million LL Million
31 December 2013Cash and balances withthe Central bank
- - 286,133 - 286,133
Due from banks - 96,408 15,311 73,029 184,748
Investment securitiesat amortised cost
- - 962,162 - 962,162
Investment securities atfair value through OCI
- - 511 - 511
- 96,408 1,264,117 73,029 1,433,554
31 December 2012Cash and balances withthe Central bank
- - 256,179 - 256,179
Due from banks - 85,558 16,800 81,113 183,471
Investment securitiesat amortised cost
- - 899,128 - 899,128
Investment securities atfair value through OCI
- - 515 - 515
- 85,558 1,172,622 81,113 1,339,293
Fenicia Bank Annual Report2013
78
3.2 | Market risk
The Bank takes on exposure to market risks, which is the risk that the fair value or futurecash flows of a financial instrument will fluctuate because of changes market prices.Market risks arise from open positions in interest rate, currency and equity products, all ofwhich are exposed to general and specific market movements and changes in the level of volatility of market rates or prices such as interest rates, foreign exchange rates and equity prices.Banking portfolios primarily arise from the interest rate management of the Bank›s retail and commercial banking assets and liabilities.
3.2.1 Market risk management techniques
Effective identification and monitoring of market risk is essential for maintaining stable profit. This is carried out by the Bank›s risk management department. The Bank›s treasury is responsible for managing the market exposure within the limits as approved by ALCO and as stipulated by the circulars of Central Bank of Lebanon no. 32 and 81. The major measurement technique used to measure and control market risk is outlined below.
Sensitivity analysis
A technique used to determine how different values of an independent variable will impact a particular dependent variable under a given set of assumptions. This technique is used within specific boundaries that will depend on one or more input variables, such as the effect that changes in interest rates will have on a bond›s price. Sensitivity analysis is a way to predict the outcome of a decision if a situation turns out to be different compared to the key pre-dictions. The Bank performs this analysis for each type of market risk to which the Bank is exposed at each reporting date, showing how profit or loss and equity would havebeen affected by changes in the relevant risk variable that were reasonably possible at that date.
The table below summarises the Bank›s exposure to foreign currency exchange rate risk at 31 December 2013 and 31 December 2012. The table includes the Bank›s financial instruments at carrying amounts, categorised by currency.
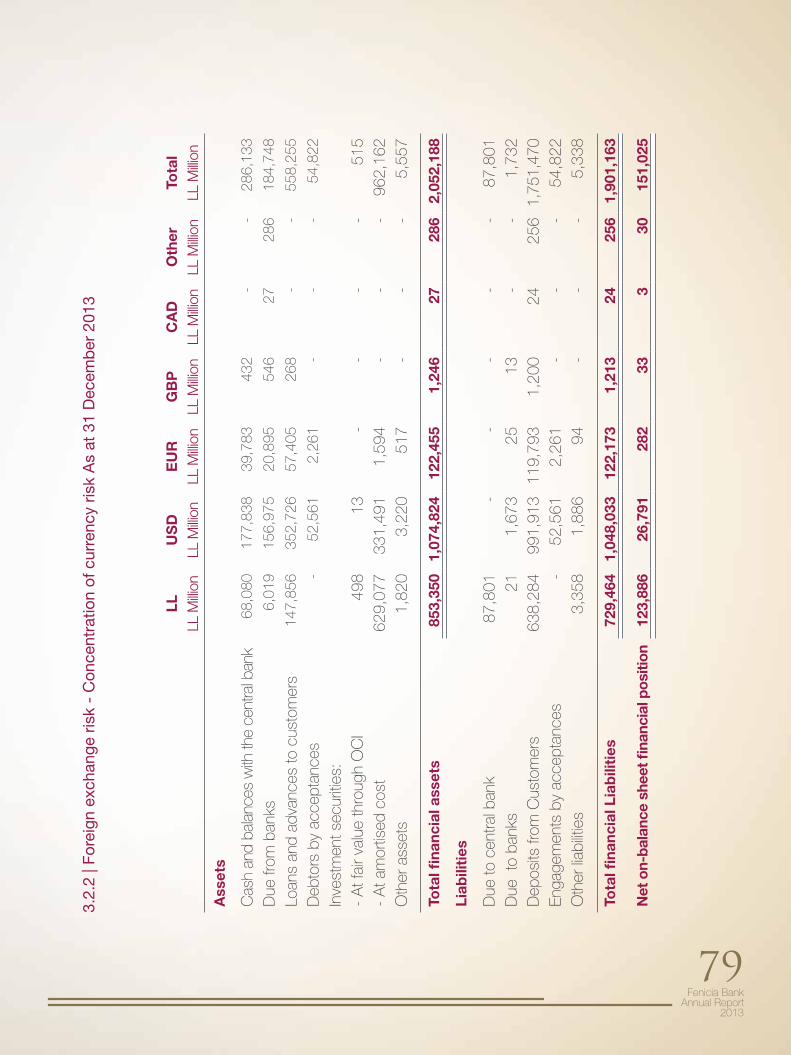
Fenicia Bank Annual Report
2013
79
3.2.
2 | F
orei
gn e
xcha
nge
risk
- C
once
ntra
tion
of c
urre
ncy
risk
As
at 3
1 D
ecem
ber
201
3
LLU
SD
EU
RG
BP
CA
DO
ther
Tota
lLL
Milli
onLL
Milli
onLL
Milli
onLL
Milli
onLL
Milli
onLL
Milli
onLL
Milli
on
Ass
ets
Cas
h an
d ba
lanc
es w
ith th
e ce
ntra
l ban
k68
,080
17
7,83
8 39
,783
432
--
286,
133
Due
from
ban
ks6,
019
156,
975
20,8
9554
627
286
184,
748
Loan
s an
d ad
vanc
es to
cus
tom
ers
147,
856
352,
726
57,4
0526
8-
-55
8,25
5
Deb
tors
by
acce
ptan
ces
-52
,561
2,
261
--
-54
,822
Inve
stm
ent s
ecur
ities
:-
At f
air v
alue
thro
ugh
OC
I49
8 13
-
--
-51
5-
At a
mor
tised
cos
t62
9,07
7 33
1,49
1 1,
594
--
-96
2,16
2O
ther
ass
ets
1,82
0 3,
220
517
--
-5,
557
Tota
l fina
ncia
l ass
ets
853,
350
1,07
4,82
4 12
2,45
51,
246
2728
62,
052,
188
Liab
iliti
es
Due
to c
entra
l ban
k87
,801
-
--
--
87,8
01D
ue t
o ba
nks
21
1,67
3 25
13-
-1,
732
Dep
osits
from
Cus
tom
ers
638,
284
991,
913
119,
793
1,20
024
256
1,75
1,47
0En
gage
men
ts b
y ac
cept
ance
s-
52,5
61
2,26
1-
--
54,8
22O
ther
liab
ilitie
s3,
358
1,88
6 94
--
-5,
338
Tota
l fina
ncia
l Lia
bili
ties
729,
464
1,04
8,03
3 12
2,17
31,
213
2425
61,
901,
163
Net
on-
bala
nce
shee
t fina
ncia
l pos
ition
123,
886
26,7
91
282
333
3015
1,02
5
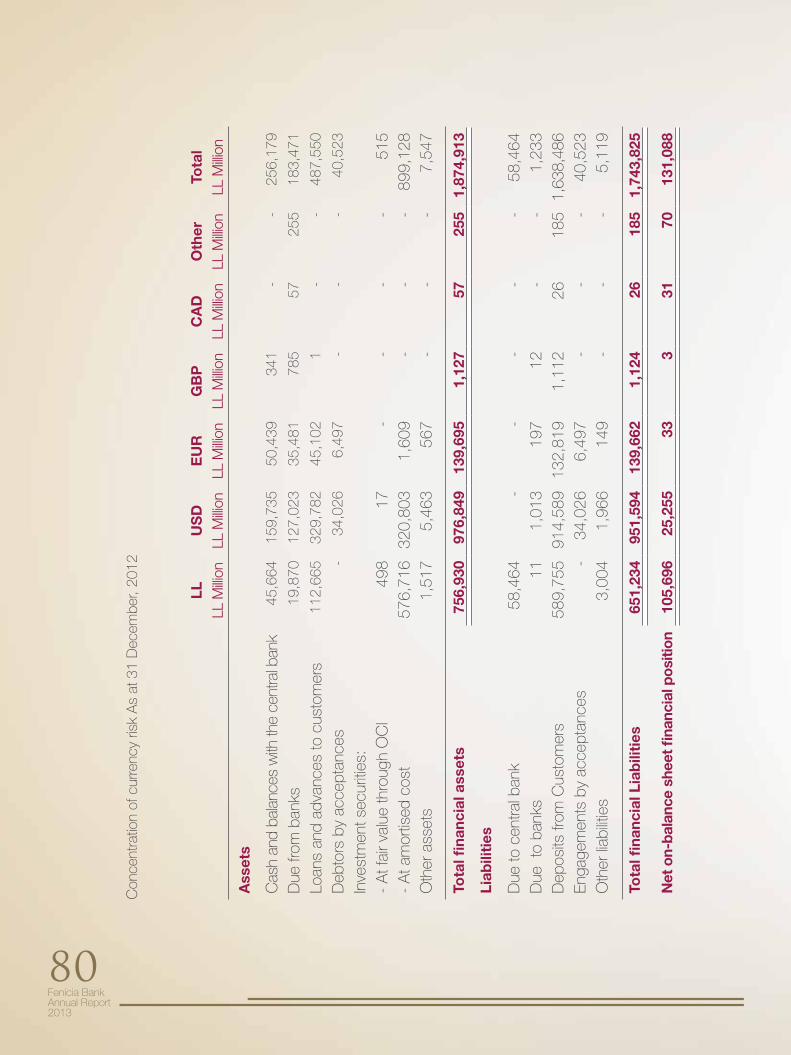
Fenicia Bank Annual Report2013
80
Con
cent
ratio
n of
cur
renc
y ris
k A
s at
31
Dec
embe
r, 20
12
LLU
SD
EU
RG
BP
CA
DO
ther
Tota
lLL
Milli
onLL
Milli
onLL
Milli
onLL
Milli
onLL
Milli
onLL
Milli
onLL
Milli
on
Ass
ets
Cas
h an
d ba
lanc
es w
ith th
e ce
ntra
l ban
k45
,664
159,
735
50,4
3934
1-
-25
6,17
9
Due
from
ban
ks19
,870
127,
023
35,4
8178
557
255
183,
471
Loan
s an
d ad
vanc
es to
cus
tom
ers
112,
665
329,
782
45,1
021
--
487,
550
Deb
tors
by
acce
ptan
ces
-34
,026
6,49
7-
--
40,5
23
Inve
stm
ent s
ecur
ities
:-
At f
air v
alue
thro
ugh
OC
I49
817
--
--
515
- A
t am
ortis
ed c
ost
576,
716
320,
803
1,60
9-
--
899,
128
Oth
er a
sset
s1,
517
5,46
356
7-
--
7,54
7
Tota
l fina
ncia
l ass
ets
756,
930
976,
849
139,
695
1,12
757
255
1,87
4,91
3
Liab
iliti
es
Due
to c
entra
l ban
k58
,464
--
--
-58
,464
Due
to
bank
s11
1,01
319
712
--
1,23
3D
epos
its fr
om C
usto
mer
s58
9,75
591
4,58
913
2,81
91,
112
2618
51,
638,
486
Enga
gem
ents
by
acce
ptan
ces
-34
,026
6,49
7-
--
40,5
23O
ther
liab
ilitie
s3,
004
1,96
614
9-
--
5,11
9
Tota
l fina
ncia
l Lia
bili
ties
651,
234
951,
594
139,
662
1,12
426
185
1,74
3,82
5
Net
on-
bala
nce
shee
t fina
ncia
l pos
ition
105,
696
25,2
5533
331
7013
1,08
8

Fenicia Bank Annual Report
2013
81
3.2.3 | Interest rate risk
Cash flow interest rate risk is the risk that the future cash flows of a financial instrument will fluctuate because of changes in market interest rates. Fair value interest rate risk is the risk that the value of a financial instrument will fluctuate because of changes in market interest rates. The Bank takes on exposure to the effects of fluctuations in the prevailing levels of market interest rates on both its fair value and cash flow risks. Interest margins may increase as a result of such changes but may reduce losses in the event that unexpected movements arise. Management sets limits on the level of mismatch of interest rate re-pricing that may be undertaken, which is monitored daily by the Treasury Department.
An increase / decrease of 2% in interest rates on the Bank’s portfolio of interest-earning assets would result in a net gain / (loss) for the year of LL 12 billion (2012 – LL 12 billion).
The table below summarises the Bank’s exposure to interest rate risks. It includes the Bank’s financial instruments at carrying amounts, categorised by the earlier of contractual re-pricing or maturity dates. Expected re-pricing and maturity dates do not differ significantly from the contract dates.
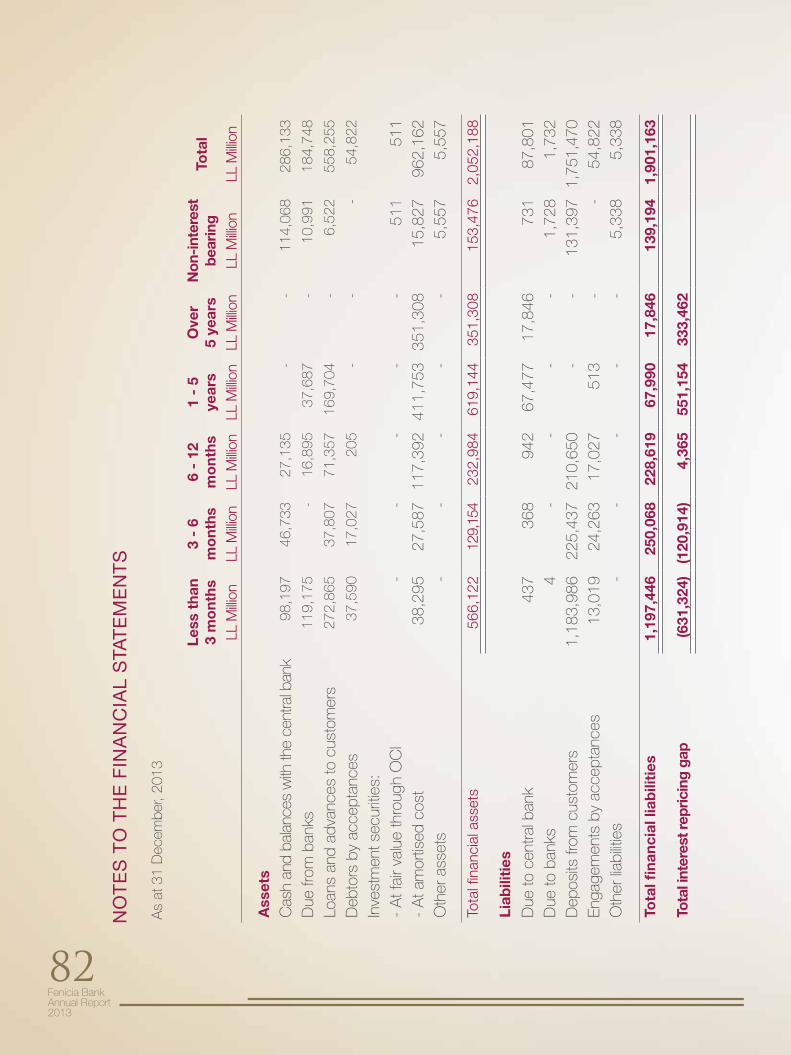
Fenicia Bank Annual Report2013
82
Less
tha
n3
mo
nths
3
- 6
mo
nths
6 -
12m
ont
hs1
- 5
year
sO
ver
5 ye
ars
Non
-int
eres
t be
arin
gTo
tal
LL M
illion
LL M
illion
LL M
illion
LL M
illion
LL M
illion
LL M
illion
LL M
illion
Ass
ets
Cas
h an
d ba
lanc
es w
ith th
e ce
ntra
l ban
k98
,197
46
,733
27
,135
-
-11
4,06
8 28
6,13
3
Due
from
ban
ks11
9,17
5 -
16,8
95
37,6
87
-10
,991
18
4,74
8
Loan
s an
d ad
vanc
es to
cus
tom
ers
272,
865
37,8
07
71,3
57
169,
704
-6,
522
558,
255
Deb
tors
by
acce
ptan
ces
37,5
90
17,0
27
205
--
-54
,822
Inve
stm
ent s
ecur
ities
:-
At f
air v
alue
thro
ugh
OC
I-
--
--
511
511
- A
t am
ortis
ed c
ost
38,2
95
27,5
87
117,
392
411,
753
351,
308
15,8
27
962,
162
Oth
er a
sset
s-
--
--
5,55
7 5,
557
Tota
l fina
ncia
l ass
ets
566,
122
129,
154
232,
984
619,
144
351,
308
153,
476
2,05
2,18
8
Liab
iliti
es
Due
to c
entra
l ban
k43
7 36
8 94
2 67
,477
17
,846
73
1 87
,801
D
ue to
ban
ks
4 -
--
-1,
728
1,73
2 D
epos
its fr
om c
usto
mer
s1,
183,
986
225,
437
210,
650
--
131,
397
1,75
1,47
0 En
gage
men
ts b
y ac
cept
ance
s13
,019
24
,263
17
,027
51
3 -
-54
,822
O
ther
liab
ilitie
s-
--
--
5,33
8 5,
338
Tota
l fina
ncia
l lia
bili
ties
1,19
7,44
6 25
0,06
8 22
8,61
9 67
,990
17
,846
13
9,19
4 1,
901,
163
Tota
l int
eres
t rep
ricin
g ga
p(6
31,3
24)
(120
,914
) 4,
365
551,
154
333,
462
As
at 3
1 D
ecem
ber,
2013
NO
TE
S T
O T
HE
FIN
AN
CIA
L S
TAT
EM
EN
TS
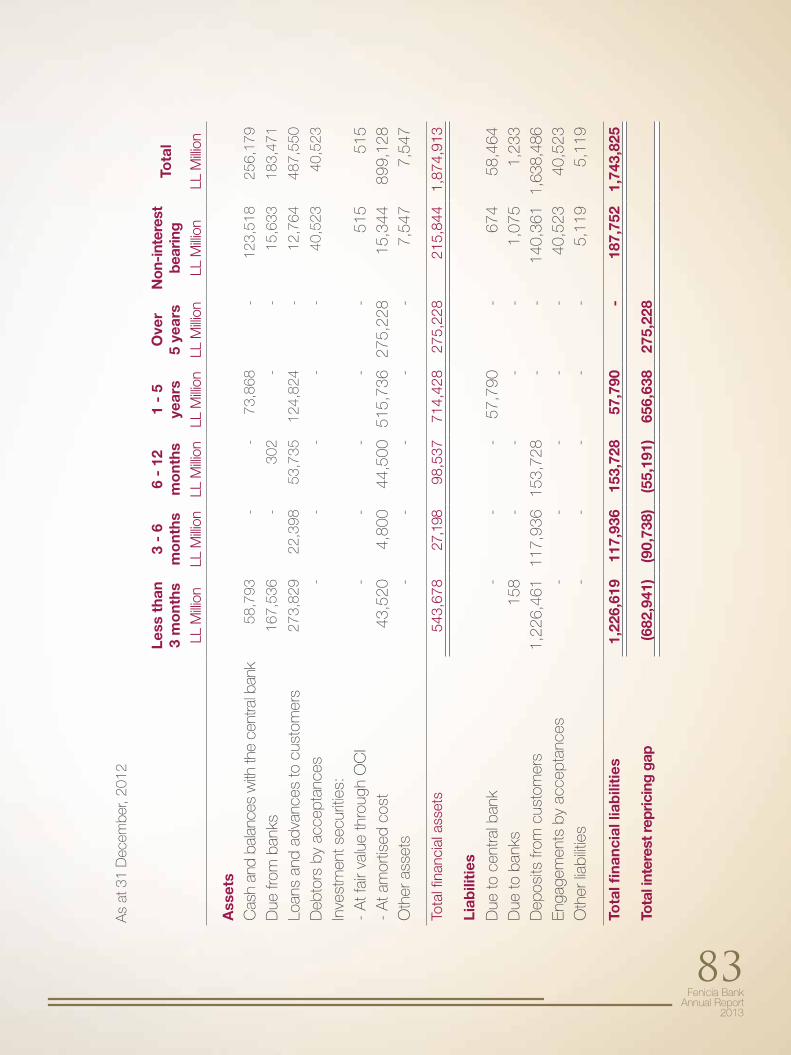
Fenicia Bank Annual Report
2013
83
Less
tha
n3
mo
nths
3
- 6
mo
nths
6 -
12m
ont
hs1
- 5
year
sO
ver
5 ye
ars
Non
-int
eres
t be
arin
gTo
tal
LL M
illion
LL M
illion
LL M
illion
LL M
illion
LL M
illion
LL M
illion
LL M
illion
Ass
ets
Cas
h an
d ba
lanc
es w
ith th
e ce
ntra
l ban
k58
,793
--
73,8
68-
123,
518
256,
179
Due
from
ban
ks16
7,53
6-
302
--
15,6
3318
3,47
1
Loan
s an
d ad
vanc
es to
cus
tom
ers
273,
829
22,3
9853
,735
124,
824
-12
,764
487,
550
Deb
tors
by
acce
ptan
ces
--
--
-40
,523
40,5
23
Inve
stm
ent s
ecur
ities
:-
At f
air v
alue
thro
ugh
OC
I-
--
--
515
515
- A
t am
ortis
ed c
ost
43,5
204,
800
44,5
0051
5,73
627
5,22
815
,344
899,
128
Oth
er a
sset
s-
--
--
7,54
77,
547
Tota
l fina
ncia
l ass
ets
543,
678
27,1
9898
,537
714,
428
275,
228
215,
844
1,87
4,91
3
Liab
iliti
es
Due
to c
entra
l ban
k-
--
57,7
90-
674
58,4
64D
ue to
ban
ks
158
--
--
1,07
51,
233
Dep
osits
from
cus
tom
ers
1,22
6,46
111
7,93
615
3,72
8-
-14
0,36
11,
638,
486
Enga
gem
ents
by
acce
ptan
ces
--
--
-40
,523
40,5
23O
ther
liab
ilitie
s-
--
--
5,11
95,
119
Tota
l fina
ncia
l lia
bili
ties
1,22
6,61
911
7,93
615
3,72
857
,790
-18
7,75
21,
743,
825
Tota
l int
eres
t rep
ricin
g ga
p(6
82,9
41)
(90,
738)
(55,
191)
656,
638
275,
228
As
at 3
1 D
ecem
ber,
2012
Fenicia Bank Annual Report2013
84
3.3 | Liquidity risk
Liquidity risk is the risk that the Bank is unable to meet its obligations associated with its financial liabilities when they fall due as a result of customer deposits being withdrawn, cash requirements from contractual commitments, or other cash outflows, such as debt maturities. Such outflows would deplete available cash resources for client lending, trading activities and investments. In extreme circumstances, lack of liquidity could result in reductions in balance sheet and sales of assets, or potentially an inability to fulfil lending commitments. The risk that the Bank will be unable to do so is inherent in all banking operations and can be affected by a range of institution-specific and market-wide events including, but not limited to merger and acquisition activity, systemic shocks and natural disasters.
3.3.1 | Liquidity risk management process
The Bank›s liquidity management process as carried out within the bank and monitored by a separate team in the Bank›s treasury includes: -Day-to-day funding, managed by monitoring future cash flows to ensure that requirements can be met. This includes replenishment of funds as they mature or are borrowed by customers; -Maintaining a portfolio of highly marketable assets that can easily be liquidated as protection against any unforeseen interruption to cash flow; -Monitoring balance sheet liquidity ratios against internal and regulatory requirements; and -Managing the concentration and profile of debt maturities.
Monitoring and reporting take the form of cash flow measurement and projections for the next day, week and month, respectively, as these are key periods for liquidity management. The starting point for those projections is an analysis of the contractual maturity of the financial liabilities and the expected collection date of the financial assets.
3.3.2 | Funding approach
Sources of liquidity are regularly set by the Treasury department, while the risk management department and the Assets and Liabilities Committee monitors those sources to maintain a wide diversification by currency, geography, provider, product and term.
3.3.3 | Maturity analysis of financial assets and liabilities
The table below summarizes the maturity profile of the Bank’s financial assets and liabilities. The contractual maturities of assets and liabilities have been determined on the basis of the remaining period at the statement of financial position date to the contractual maturity date and do not take account of the effective maturities as indicated by the Bank’s deposit retention history and the availability of liquid funds. The maturity profile is monitored by management to ensure adequate liquidity is maintained.
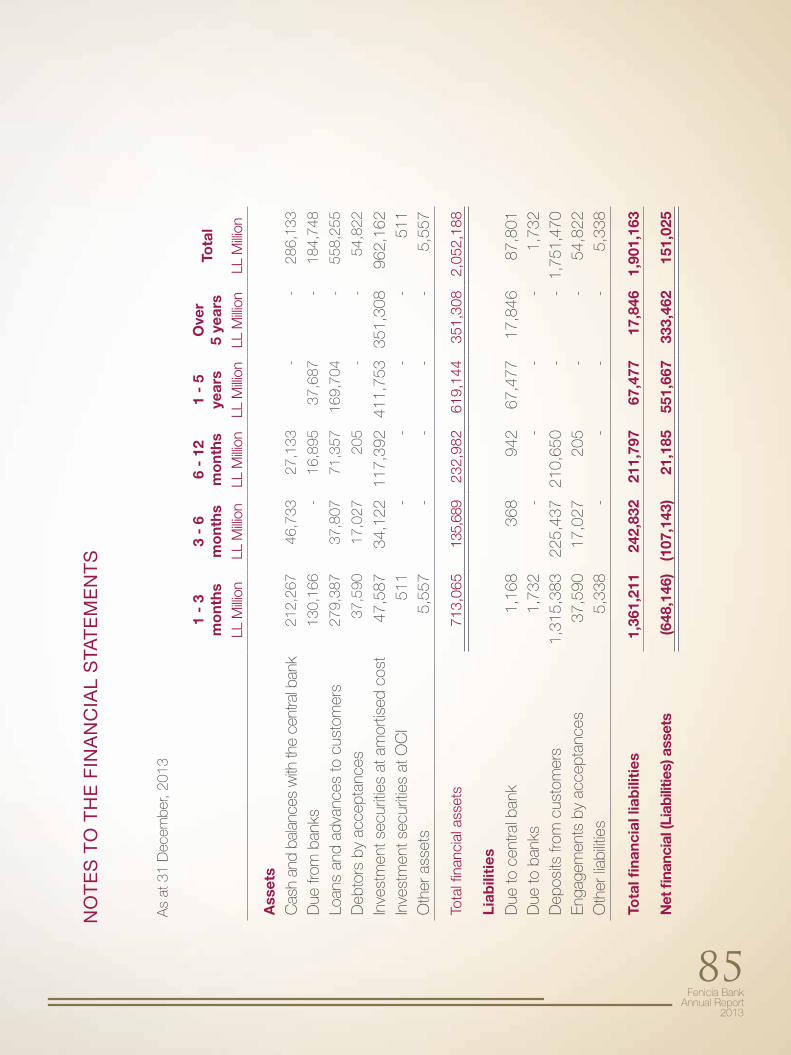
Fenicia Bank Annual Report
2013
85
NO
TE
S T
O T
HE
FIN
AN
CIA
L S
TAT
EM
EN
TS
1 -
3 m
ont
hs3
- 6
mo
nths
6 -
12m
ont
hs1
- 5
year
sO
ver
5 ye
ars
Tota
l
LL M
illion
LL M
illion
LL M
illion
LL M
illion
LL M
illion
LL M
illion
Ass
ets
Cas
h an
d ba
lanc
es w
ith th
e ce
ntra
l ban
k21
2,26
7 46
,733
27
,133
--
286,
133
Due
from
ban
ks13
0,16
6 -
16,8
95
37,6
87
-18
4,74
8
Loan
s an
d ad
vanc
es to
cus
tom
ers
279,
387
37,8
07
71,3
57
169,
704
-55
8,25
5
Deb
tors
by
acce
ptan
ces
37,5
90
17,0
27
205
--
54,8
22
Inve
stm
ent s
ecur
ities
at a
mor
tised
cos
t47
,587
34
,122
11
7,39
241
1,75
335
1,30
896
2,16
2In
vest
men
t sec
uriti
es a
t OC
I51
1 -
--
-51
1 O
ther
ass
ets
5,55
7 -
--
-5,
557
Tota
l fina
ncia
l ass
ets
713,
065
135,
689
232,
982
619,
144
351,
308
2,05
2,18
8
Liab
iliti
es
Due
to c
entra
l ban
k1,
168
368
942
67,4
77
17,8
46
87,8
01
Due
to b
anks
1,
732
--
--
1,73
2 D
epos
its fr
om c
usto
mer
s1,
315,
383
225,
437
210,
650
--
1,75
1,47
0 En
gage
men
ts b
y ac
cept
ance
s37
,590
17
,027
20
5-
-54
,822
O
ther
liab
ilitie
s5,
338
--
--
5,33
8
Tota
l fina
ncia
l lia
bili
ties
1,36
1,21
1 24
2,83
2 21
1,79
767
,477
17,8
46
1,90
1,16
3
Net
fina
ncia
l (Li
abili
ties)
ass
ets
(648
,146
) (1
07,1
43)
21,1
8555
1,66
733
3,46
2 15
1,02
5
As
at 3
1 D
ecem
ber,
2013
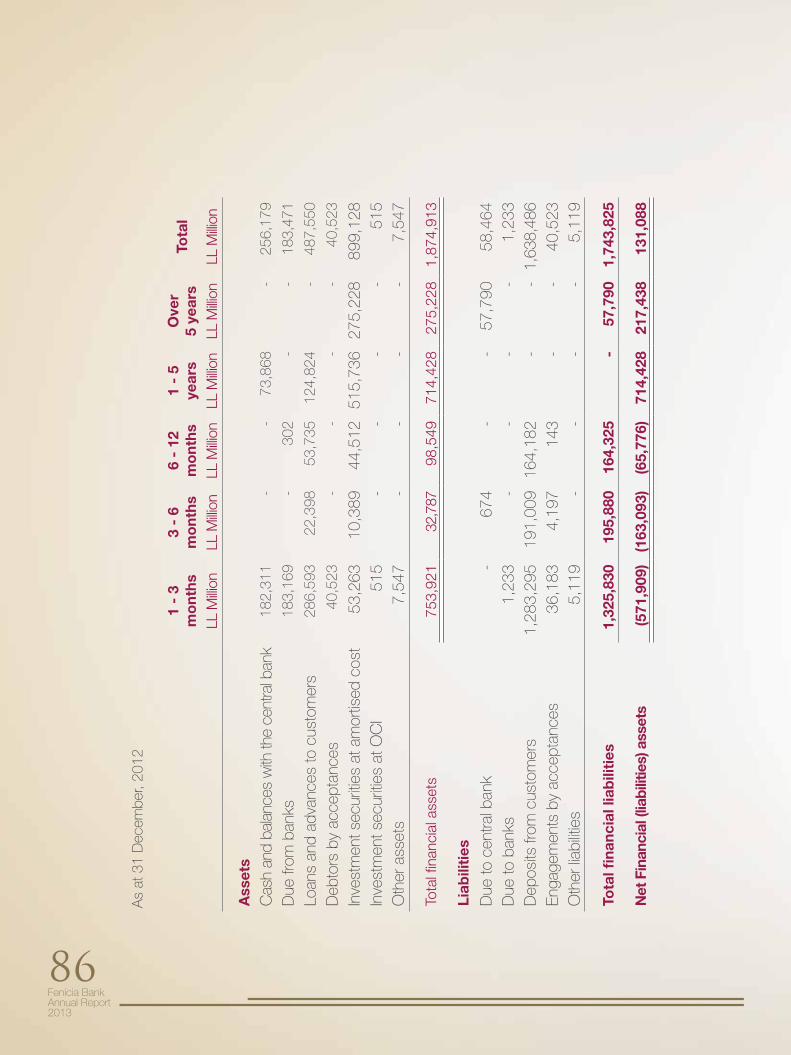
Fenicia Bank Annual Report2013
86
1 -
3 m
ont
hs3
- 6
mo
nths
6 -
12m
ont
hs1
- 5
year
sO
ver
5 ye
ars
Tota
l
LL M
illion
LL M
illion
LL M
illion
LL M
illion
LL M
illion
LL M
illion
Ass
ets
Cas
h an
d ba
lanc
es w
ith th
e ce
ntra
l ban
k18
2,31
1 -
-73
,868
-25
6,17
9
Due
from
ban
ks18
3,16
9 -
302
--
183,
471
Loan
s an
d ad
vanc
es to
cus
tom
ers
286,
593
22,3
98
53,7
3512
4,82
4-
487,
550
Deb
tors
by
acce
ptan
ces
40,5
23
--
--
40,5
23
Inve
stm
ent s
ecur
ities
at a
mor
tised
cos
t53
,263
10
,389
44
,512
515,
736
275,
228
899,
128
Inve
stm
ent s
ecur
ities
at O
CI
515
--
--
515
Oth
er a
sset
s7,
547
--
--
7,54
7
Tota
l fina
ncia
l ass
ets
753,
921
32,7
87
98,5
4971
4,42
827
5,22
81,
874,
913
Liab
iliti
es
Due
to c
entra
l ban
k-
674
- -
57,7
9058
,464
Due
to b
anks
1,
233
--
--
1,23
3D
epos
its fr
om c
usto
mer
s1,
283,
295
191,
009
164,
182
--
1,63
8,48
6En
gage
men
ts b
y ac
cept
ance
s36
,183
4,
197
143
- -
40,5
23O
ther
liab
ilitie
s5,
119
--
--
5,11
9
Tota
l fina
ncia
l lia
bili
ties
1,32
5,83
0 19
5,88
0 16
4,32
5-
57,7
901,
743,
825
Net
Fin
anci
al (l
iabi
litie
s) a
sset
s(5
71,9
09)
(163
,093
) (6
5,77
6)71
4,42
821
7,43
813
1,08
8
As
at 3
1 D
ecem
ber,
2012
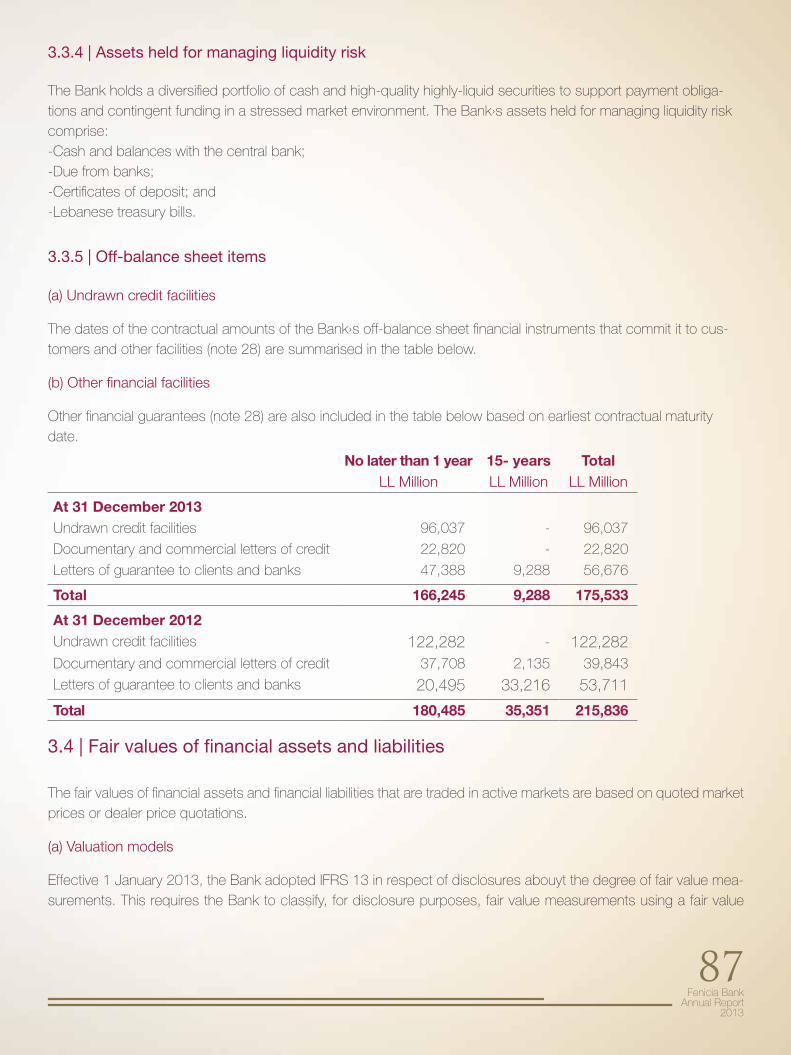
Fenicia Bank Annual Report
2013
87
3.3.4 | Assets held for managing liquidity risk
The Bank holds a diversified portfolio of cash and high-quality highly-liquid securities to support payment obliga-tions and contingent funding in a stressed market environment. The Bank›s assets held for managing liquidity risk comprise: -Cash and balances with the central bank;-Due from banks;-Certificates of deposit; and-Lebanese treasury bills.
3.3.5 | Off-balance sheet items
(a) Undrawn credit facilities
The dates of the contractual amounts of the Bank›s off-balance sheet financial instruments that commit it to cus-tomers and other facilities (note 28) are summarised in the table below.
(b) Other financial facilities
Other financial guarantees (note 28) are also included in the table below based on earliest contractual maturity date.
No later than 1 year 15- years TotalLL Million LL Million LL Million
At 31 December 2013Undrawn credit facilities 96,037 - 96,037
Documentary and commercial letters of credit 22,820 - 22,820
Letters of guarantee to clients and banks 47,388 9,288 56,676
Total 166,245 9,288 175,533
At 31 December 2012Undrawn credit facilities 122,282 - 122,282 Documentary and commercial letters of credit 37,708 2,135 39,843
Letters of guarantee to clients and banks 20,495 33,216 53,711
Total 180,485 35,351 215,836
3.4 | Fair values of financial assets and liabilities
The fair values of financial assets and financial liabilities that are traded in active markets are based on quoted market prices or dealer price quotations.
(a) Valuation models
Effective 1 January 2013, the Bank adopted IFRS 13 in respect of disclosures abouyt the degree of fair value mea-surements. This requires the Bank to classify, for disclosure purposes, fair value measurements using a fair value
Fenicia Bank Annual Report2013
88
hierarchy that reflects the significance of the inputs used in making the measurements. IFRS 7 specifies a hierarchy of valuation techniques based on whether the inputs to those valuation techniques are observable or unobservable. Observable inputs reflect market data obtained from independent sources; unobservable inputs reflect the Bank’s market assumptions. These two types of inputs have created the following fair value hierarchy.
Quoted market prices – Level 1
Financial instruments are classified as Level 1 if their value is observable in an active market. Such instruments are valued by reference to unadjusted quoted prices for identical assets or liabilities in active markets where the quoted price is readily available, and the price represents actual and regularly occurring market transactions on an arm’s length basis. An active market is one in which transactions occur with sufficient volume and frequency to provide pricing information on an ongoing basis.
This category includes liquid government and corporate bonds actively traded through an exchange or clearing house, and actively traded listed equities.
Valuation technique using observable inputs – Level 2
Financial instruments classified as Level 2 have been valued using models whose most significant inputs are observ-able in an active market. Such valuation techniques and models incorporate assumptions about factors observable in an active market, which other market participants would use in their valuations, including interest rate yield curve, exchange rates, volatilities, and prepayment and defaults rates.
This category includes liquid government and corporate bonds and certificates of deposit, less actively traded through an exchange or clearing house, non-listed equities and foreign exchange swaps and forwards.
Valuation technique using significant unobservable inputs – Level 3
Financial instruments are classified as Level 3 if their valuation incorporates significant inputs that are not based on observable market data (unobservable inputs). A valuation input is considered observable if it can be directly ob-served from transactions in an active market, or if there is compelling external evidence demonstrating an executable exit price. An input is deemed significant if it is shown to contribute more than 10% to the valuation of a financial instrument.
Unobservable input levels are generally determined based on observable inputs of a similar nature, historical obser-vations or other analytical techniques.
The following table provides the fair value measurement hierarchy of the Bank’s financial instruments.
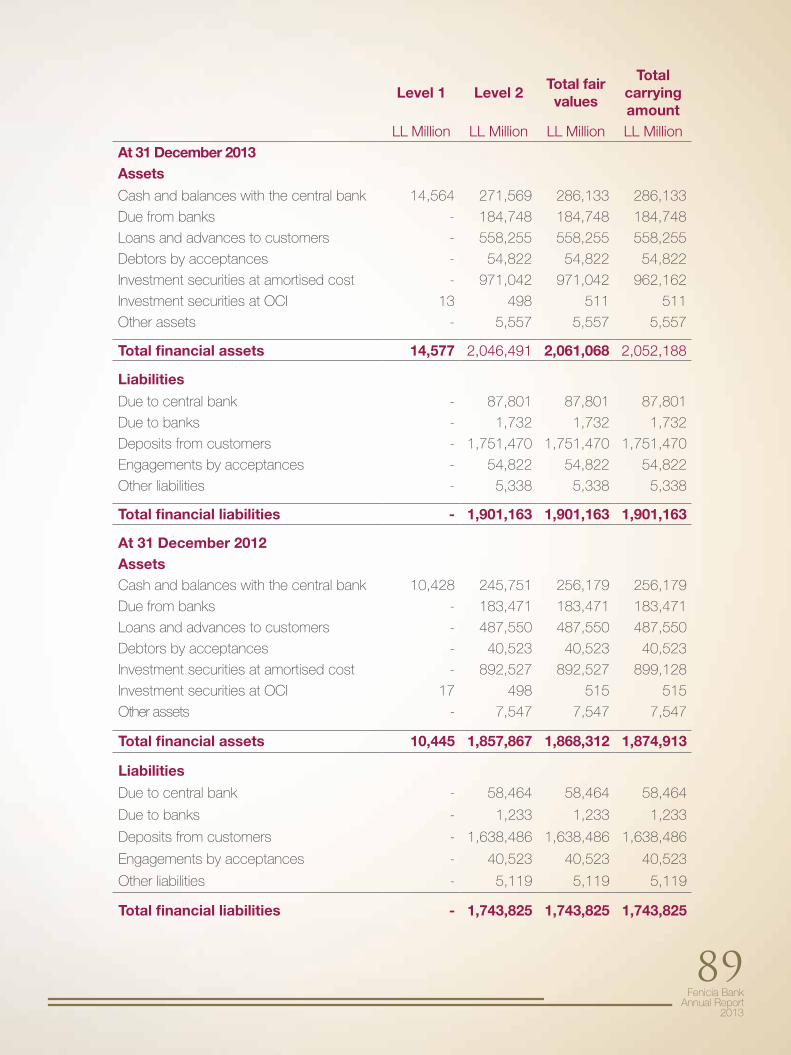
Fenicia Bank Annual Report
2013
89
Level 1 Level 2Total fair values
Total carrying amount
LL Million LL Million LL Million LL MillionAt 31 December 2013Assets
Cash and balances with the central bank 14,564 271,569 286,133 286,133
Due from banks - 184,748 184,748 184,748
Loans and advances to customers - 558,255 558,255 558,255
Debtors by acceptances - 54,822 54,822 54,822
Investment securities at amortised cost - 971,042 971,042 962,162
Investment securities at OCI 13 498 511 511
Other assets - 5,557 5,557 5,557
Total financial assets 14,577 2,046,491 2,061,068 2,052,188
Liabilities
Due to central bank - 87,801 87,801 87,801
Due to banks - 1,732 1,732 1,732
Deposits from customers - 1,751,470 1,751,470 1,751,470
Engagements by acceptances - 54,822 54,822 54,822
Other liabilities - 5,338 5,338 5,338
Total financial liabilities - 1,901,163 1,901,163 1,901,163
At 31 December 2012 AssetsCash and balances with the central bank 10,428 245,751 256,179 256,179
Due from banks - 183,471 183,471 183,471
Loans and advances to customers - 487,550 487,550 487,550
Debtors by acceptances - 40,523 40,523 40,523
Investment securities at amortised cost - 892,527 892,527 899,128
Investment securities at OCI 17 498 515 515
Other assets - 7,547 7,547 7,547
Total financial assets 10,445 1,857,867 1,868,312 1,874,913
Liabilities
Due to central bank - 58,464 58,464 58,464
Due to banks - 1,233 1,233 1,233
Deposits from customers - 1,638,486 1,638,486 1,638,486
Engagements by acceptances - 40,523 40,523 40,523
Other liabilities - 5,119 5,119 5,119
Total financial liabilities - 1,743,825 1,743,825 1,743,825
Fenicia Bank Annual Report2013
90
There were no transfers between levels during 2013 (2012 – no transfer). The fair value of financial assets and liabilities is included at the amount at which the instrument could be exchanged in a current transaction between willing parties, other than in a forced or liquidation sale. Financial assets and liabilities are classified according to a hierarchy that reflects the significance of observable market inputs. (i) Due from banks and balances with central bank
The estimated fair value of fixed interest-bearing deposits not quoted in an active market is based on discounted cash flows using interest rates for new loans with similar remaining maturity. The estimated fair value of the accounts that have a maturity of less than 1 year is their carrying amount.
(ii) Loans and advances to customers
Loans and advances are net of provisions for impairment. The estimated fair value of loans and advances represents the discounted amount of estimated future cash flows expected to be received. Expected cash flows are discounted at current market rates to determine fair value.
(iii) Investment securities
The fair value of investment securities at amortised cost is based on market prices or broker/dealer price quotations. Where quoted market prices are not available, a discounted cash flow model is used based on a current yield curve appropriate for the remaining term to maturity. Expected cash flows are discounted at current market rates issued by the Central Bank of Lebanon to determine the fair value.
(iv) Debtors by acceptances and other assets
The estimated fair value of the above accounts is their carrying amount given that their maturity is less than 1 year.
(v) Due to banks and due to central bank
The estimated fair value of deposits with no stated maturity, which includes non-interest bearing deposits, is the amount repayable on demand. The estimated fair value of fixed interest-bearing deposits not quoted in an active market is based on discounted cash flows using interest rates for new deposits with similar remaining maturity.
(vi) Deposits from customers
The estimated fair value of the deposits from customers is their carrying amount given that their maturity is less than 1 year.
(vii) Other liabilities
The estimated fair value of the above accounts is their carrying amount given that their maturity is within 12 months from balance sheet date.
3.5 | Operational risk
Operational risk is the risk of loss arising from inadequate or failed internal processes, systems failure, human error, or from external events. When controls fail to perform, it can lead to legal or regulatory implications, or financial / reputational loss. The Bank has established policies and procedures, which are applied to identify, assess, monitor, control and mitigate operational risk in addition to other types of risks relating to the banking and financial activities of the Bank as part of overall risk management activities.
3.6 | Capital management
The Bank’s objectives when managing capital, which is a broader concept than the ‘equity’ on the face of the Balance sheet, are:
-To comply with the capital requirements set by the regulators of the banking markets where the Bank operates; -To safeguard the Bank’s ability to continue as a going concern so that it can continue to provide returns for shareholders and benefits for other stakeholders; and
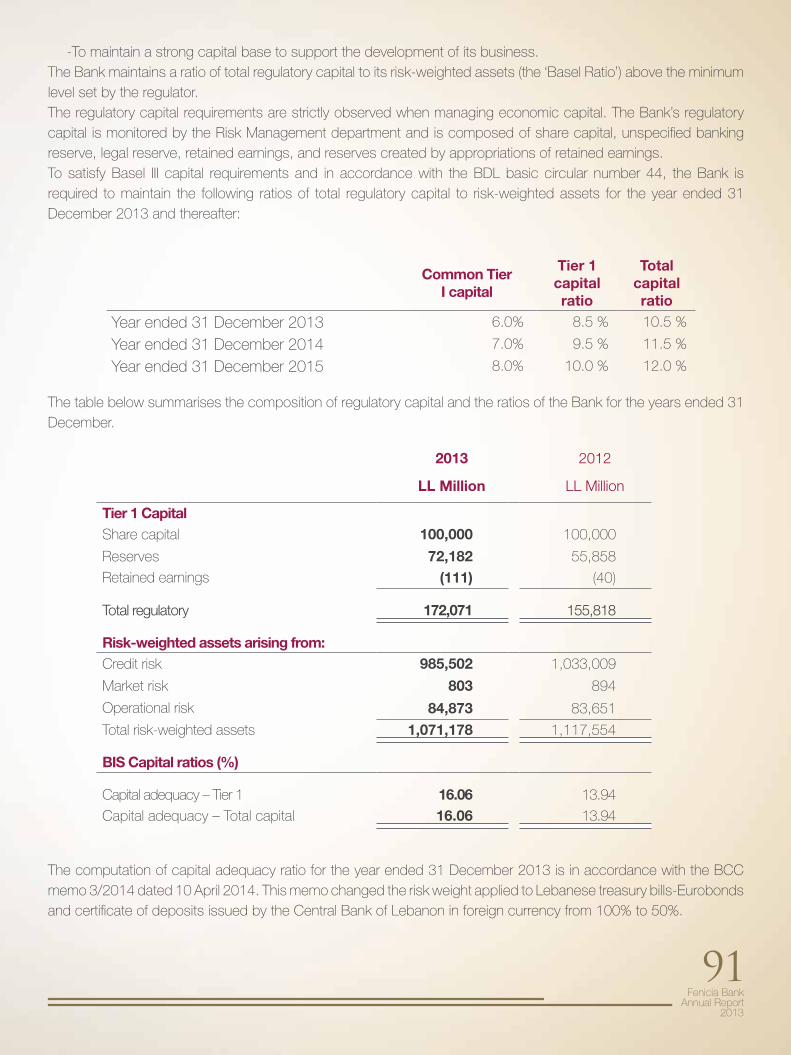
Fenicia Bank Annual Report
2013
91
-To maintain a strong capital base to support the development of its business. The Bank maintains a ratio of total regulatory capital to its risk-weighted assets (the ‘Basel Ratio’) above the minimum level set by the regulator. The regulatory capital requirements are strictly observed when managing economic capital. The Bank’s regulatory capital is monitored by the Risk Management department and is composed of share capital, unspecified banking reserve, legal reserve, retained earnings, and reserves created by appropriations of retained earnings. To satisfy Basel III capital requirements and in accordance with the BDL basic circular number 44, the Bank is required to maintain the following ratios of total regulatory capital to risk-weighted assets for the year ended 31 December 2013 and thereafter:
Common TierI capital
Tier 1 capital ratio
Total capital ratio
Year ended 31 December 2013 6.0% 8.5 % 10.5 %
Year ended 31 December 2014 7.0% 9.5 % 11.5 %
Year ended 31 December 2015 8.0% 10.0 % 12.0 %
The table below summarises the composition of regulatory capital and the ratios of the Bank for the years ended 31 December.
The computation of capital adequacy ratio for the year ended 31 December 2013 is in accordance with the BCC memo 3/2014 dated 10 April 2014. This memo changed the risk weight applied to Lebanese treasury bills-Eurobonds and certificate of deposits issued by the Central Bank of Lebanon in foreign currency from 100% to 50%.
2013 2012
LL Million LL Million
Tier 1 CapitalShare capital 100,000 100,000
Reserves 72,182 55,858
Retained earnings (111) (40)
Total regulatory 172,071 155,818
Risk-weighted assets arising from: Credit risk 985,502 1,033,009
Market risk 803 894
Operational risk 84,873 83,651
Total risk-weighted assets 1,071,178 1,117,554
BIS Capital ratios (%)
Capital adequacy – Tier 1 16.06 13.94
Capital adequacy – Total capital 16.06 13.94
Fenicia Bank Annual Report2013
92
4 Critical accounting estimates and judgements
The Bank’s financial statements and its financial result are influenced by accounting policies, assumptions, estimates and management judgement, which necessarily have to be made in the course of preparation of the financial statements.
The Bank makes estimates and judgments that affect the reported amounts of assets and liabilities within the next financial year. All estimates and assumptions required in conformity with IFRS are best estimates undertaken in accordance with the applicable standard. Estimates and judgments are evaluated on a continuous basis, and are based on past experience and other factors, including expectations with regard to future events.
Accounting policies and management’s judgements for certain items are especially critical for the Bank’s results and financial situation due to their materiality.
The key assumptions concerning the future and other key sources of estimation uncertainty at the reporting date, that have a significant risk of causing a material adjustment to the carrying amounts of assets and liabilities within the next financial year, are described below. The Bank based its assumptions and estimates on parameters available when the financial statements were prepared. Existing circumstances and assumptions about future developments; however, may change due to market changes or circumstances arising beyond the control of the Bank. Such changes are reflected in the assumptions when they occur.
Impairment losses on loans and advances
The Bank reviews its loan portfolios to assess impairment at least on an annual basis. In determining whether an impairment loss should be recorded in the statement of comprehensive income, the Bank makes judgments as to whether there is any observable data indicating an impairment trigger followed by measurable decrease
in the estimated future cash flows from a portfolio of loans before the decrease can be identified with an individual loan with that portfolio. This evidence may include observable data indicating that there has been an adverse change in the payment status of borrowers in a group, or national or local economic conditions that correlate with defaults on assets in the Bank upon future cash flows scheduling. Management uses estimates based on historical loss experience for assets with credit risk characteristics and objective evidence of impairment similar to those in the portfolio when scheduling its future cash flows. The methodology and assumptions used for estimating both the amount and timing of future cash flows are reviewed regularly to reduce any differences between loss estimates and actual loss experience.
In addition to the specific impairment provision on individually significant loans and advances, the Bank recognises collective impairment provision in respect of loans and advances which have not yet been provided for under specific impairment and for which credit risk progressed since the loans and advances were granted. The amount of provision is determined based on historical losses within each credit rating category. The amount of provision is adjusted regularly to reflect current economic changes.
A 5% increase or decrease in actual loss experience on a portfolio basis, compared to the loss estimates used, would result in an increase or decrease in loan impairment charges of LL 166 million (2012 – LL 165 million).
Impairment losses for individually significant loans have taken into account repayment and realisation of any assets held as collateral against the loans which typically cover a significant portion of the outstanding balance of each loan.
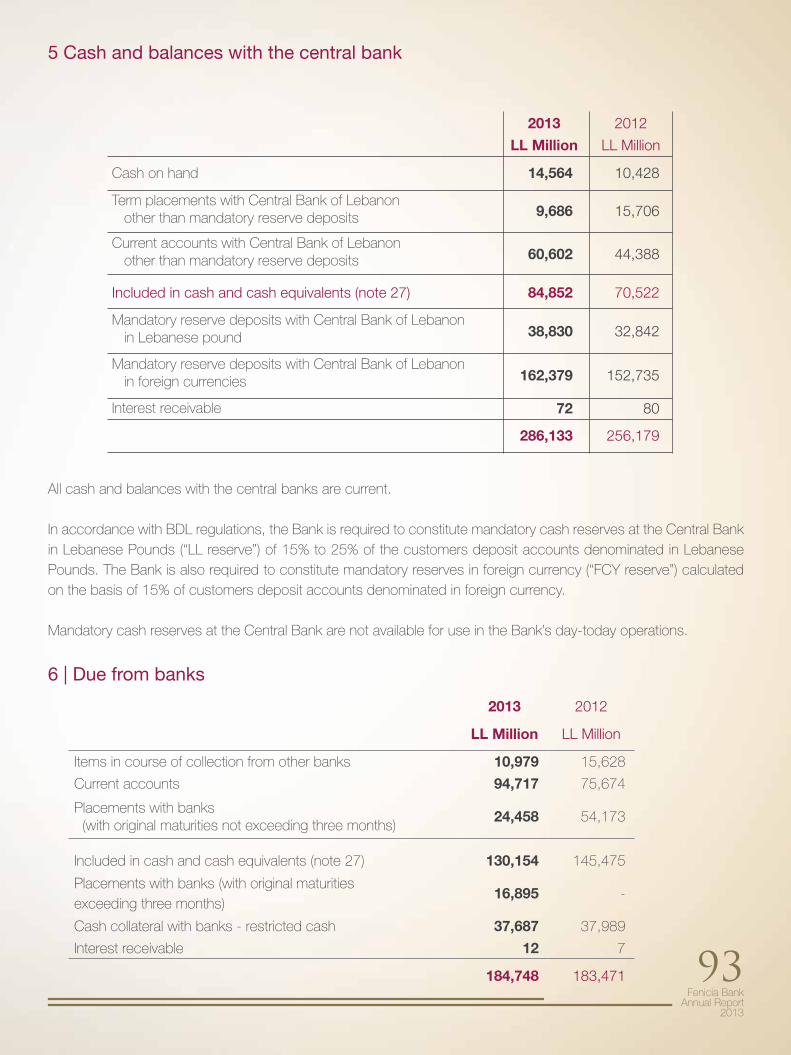
Fenicia Bank Annual Report
2013
93
All cash and balances with the central banks are current.
In accordance with BDL regulations, the Bank is required to constitute mandatory cash reserves at the Central Bank in Lebanese Pounds (“LL reserve”) of 15% to 25% of the customers deposit accounts denominated in Lebanese Pounds. The Bank is also required to constitute mandatory reserves in foreign currency (“FCY reserve”) calculated on the basis of 15% of customers deposit accounts denominated in foreign currency.
Mandatory cash reserves at the Central Bank are not available for use in the Bank’s day-today operations.
6 | Due from banks
5 Cash and balances with the central bank
2013 2012
LL Million LL Million
Cash on hand 14,564 10,428
Term placements with Central Bank of Lebanon other than mandatory reserve deposits 9,686 15,706
Current accounts with Central Bank of Lebanon other than mandatory reserve deposits 60,602 44,388
Included in cash and cash equivalents (note 27) 84,852 70,522
Mandatory reserve deposits with Central Bank of Lebanon in Lebanese pound 38,830 32,842
Mandatory reserve deposits with Central Bank of Lebanon in foreign currencies 162,379 152,735
Interest receivable 72 80
286,133 256,179
2013 2012
LL Million LL Million
Items in course of collection from other banks 10,979 15,628
Current accounts 94,717 75,674
Placements with banks (with original maturities not exceeding three months)
24,458 54,173
Included in cash and cash equivalents (note 27) 130,154 145,475
Placements with banks (with original maturitiesexceeding three months)
16,895 -
Cash collateral with banks - restricted cash 37,687 37,989
Interest receivable 12 7
184,748 183,471
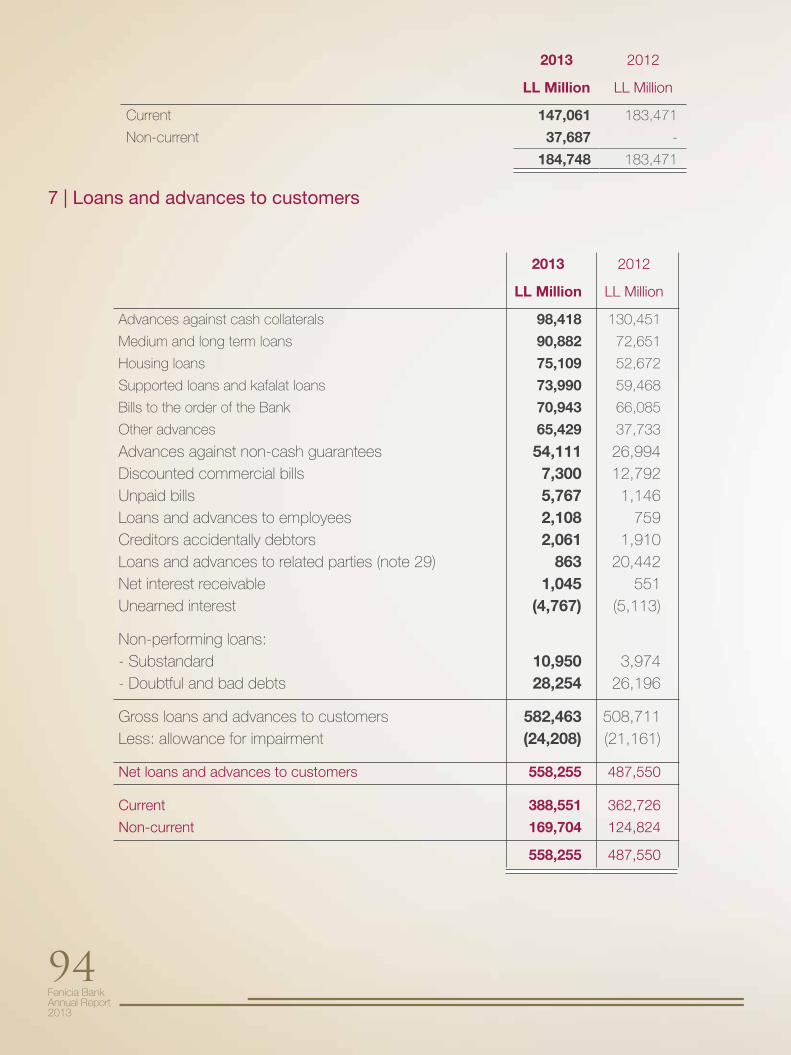
Fenicia Bank Annual Report2013
94
2013 2012
LL Million LL Million
Current 147,061 183,471
Non-current 37,687 -
184,748 183,471
7 | Loans and advances to customers
2013 2012
LL Million LL Million
Advances against cash collaterals 98,418 130,451
Medium and long term loans 90,882 72,651
Housing loans 75,109 52,672
Supported loans and kafalat loans 73,990 59,468
Bills to the order of the Bank 70,943 66,085
Other advances 65,429 37,733
Advances against non-cash guarantees 54,111 26,994Discounted commercial bills 7,300 12,792Unpaid bills 5,767 1,146Loans and advances to employees 2,108 759Creditors accidentally debtors 2,061 1,910Loans and advances to related parties (note 29) 863 20,442Net interest receivable 1,045 551Unearned interest (4,767) (5,113)
Non-performing loans:- Substandard 10,950 3,974- Doubtful and bad debts 28,254 26,196
Gross loans and advances to customers 582,463 508,711Less: allowance for impairment (24,208) (21,161)
Net loans and advances to customers 558,255 487,550
Current 388,551 362,726
Non-current 169,704 124,824
558,255 487,550
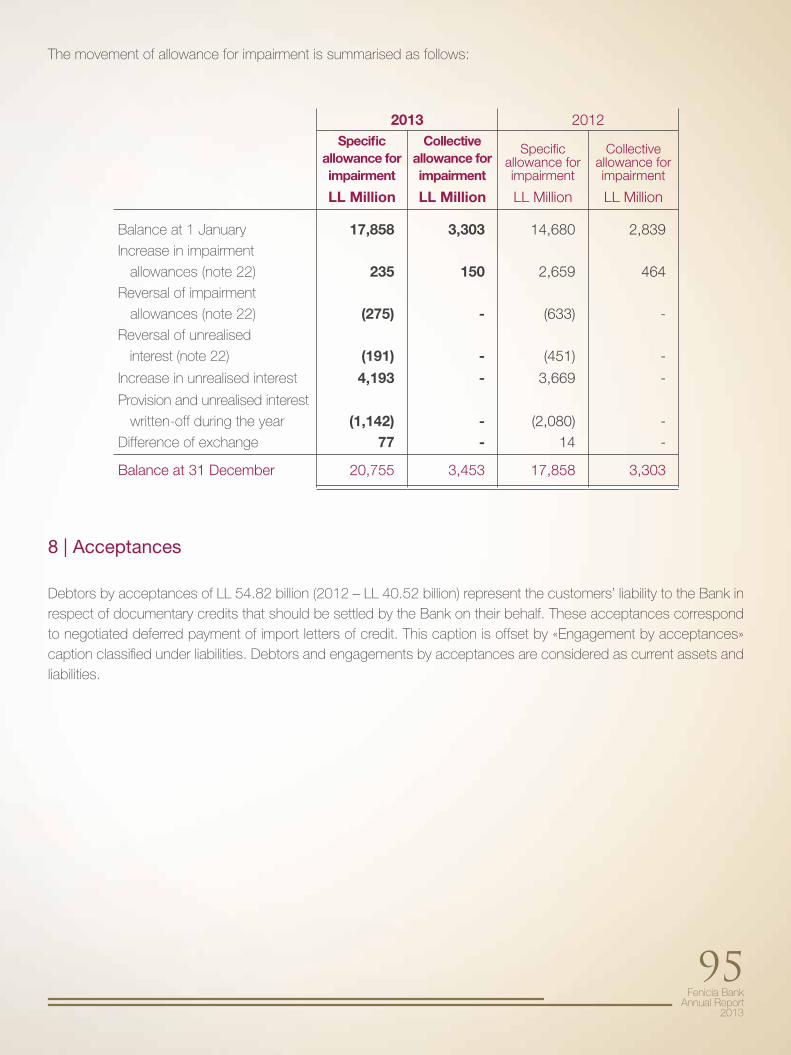
Fenicia Bank Annual Report
2013
95
The movement of allowance for impairment is summarised as follows:
2013 2012Specific
allowance for impairment
Collective allowance for impairment
Specific allowance for impairment
Collective allowance for impairment
LL Million LL Million LL Million LL Million
Balance at 1 January 17,858 3,303 14,680 2,839Increase in impairment
allowances (note 22) 235 150 2,659 464Reversal of impairment
allowances (note 22) (275) - (633) -Reversal of unrealised
interest (note 22) (191) - (451) -
Increase in unrealised interest 4,193 - 3,669 -
Provision and unrealised interest
written-off during the year (1,142) - (2,080) -Difference of exchange 77 - 14 -
Balance at 31 December 20,755 3,453 17,858 3,303
8 | Acceptances
Debtors by acceptances of LL 54.82 billion (2012 – LL 40.52 billion) represent the customers’ liability to the Bank in respect of documentary credits that should be settled by the Bank on their behalf. These acceptances correspond to negotiated deferred payment of import letters of credit. This caption is offset by «Engagement by acceptances» caption classified under liabilities. Debtors and engagements by acceptances are considered as current assets and liabilities.
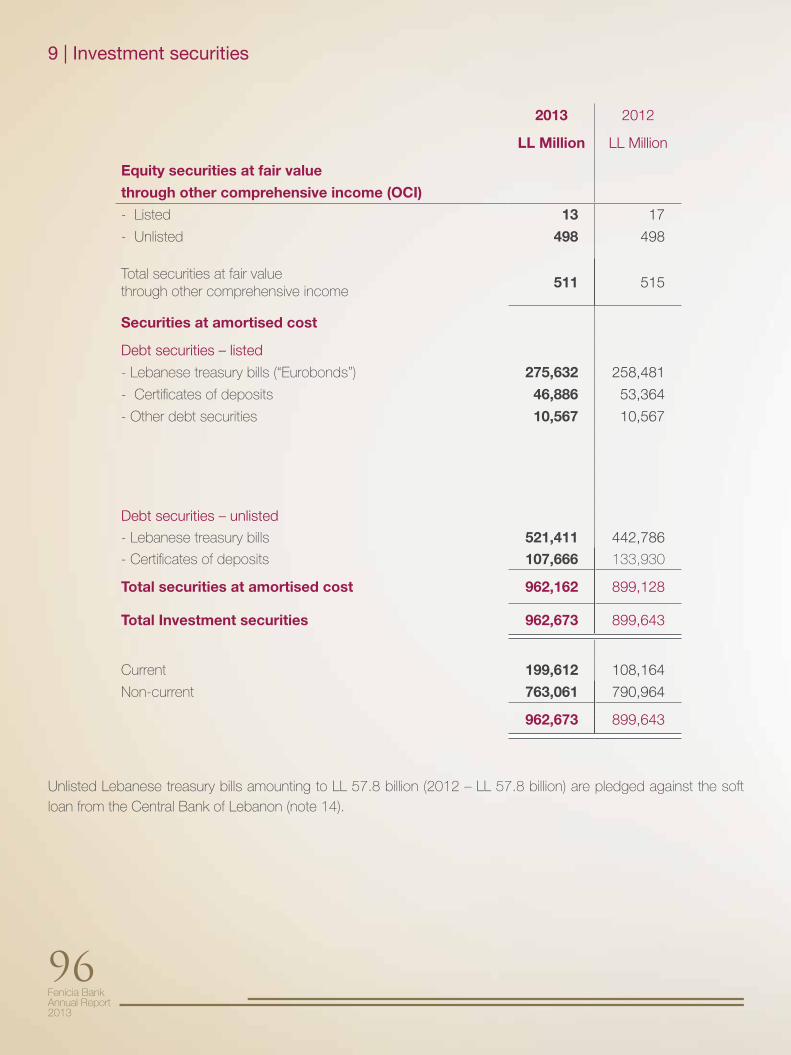
Fenicia Bank Annual Report2013
96
9 | Investment securities
Unlisted Lebanese treasury bills amounting to LL 57.8 billion (2012 – LL 57.8 billion) are pledged against the soft loan from the Central Bank of Lebanon (note 14).
2013 2012
LL Million LL Million
Equity securities at fair value
through other comprehensive income (OCI)
- Listed 13 17
- Unlisted 498 498
Total securities at fair valuethrough other comprehensive income
511 515
Securities at amortised cost
Debt securities – listed
- Lebanese treasury bills (“Eurobonds”) 275,632 258,481
- Certificates of deposits 46,886 53,364
- Other debt securities 10,567 10,567
Debt securities – unlisted
- Lebanese treasury bills 521,411 442,786
- Certificates of deposits 107,666 133,930
Total securities at amortised cost 962,162 899,128
Total Investment securities 962,673 899,643
Current 199,612 108,164
Non-current 763,061 790,964
962,673 899,643
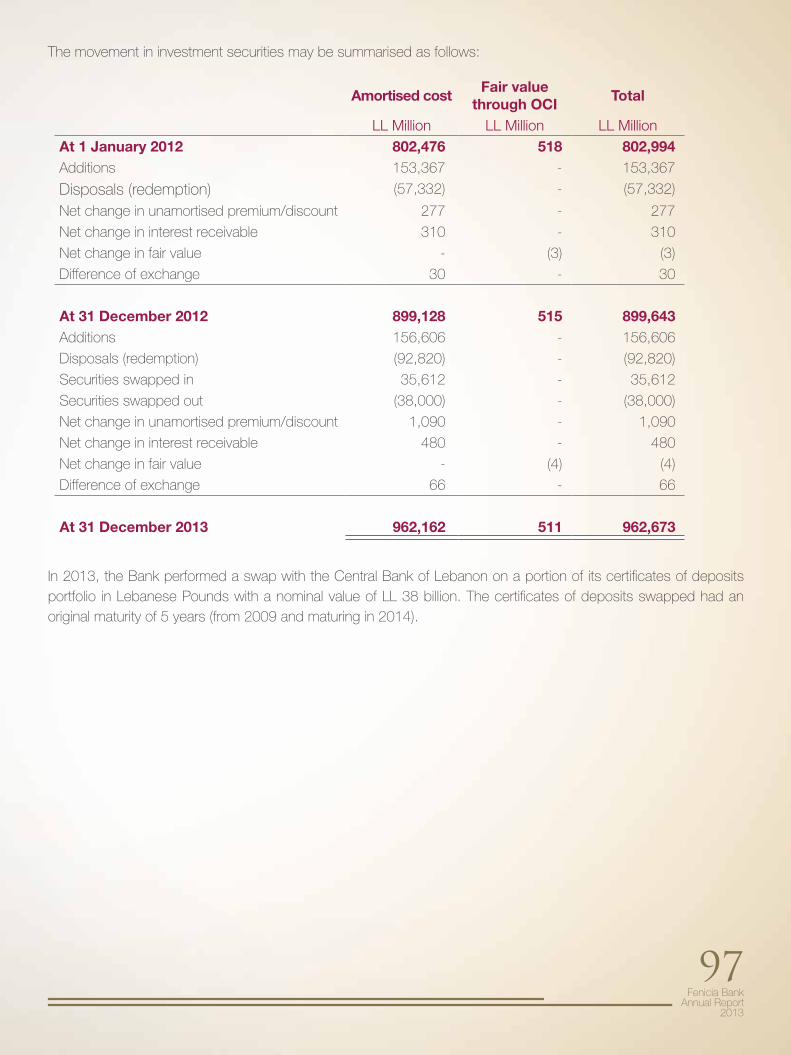
Fenicia Bank Annual Report
2013
97
The movement in investment securities may be summarised as follows:
In 2013, the Bank performed a swap with the Central Bank of Lebanon on a portion of its certificates of deposits portfolio in Lebanese Pounds with a nominal value of LL 38 billion. The certificates of deposits swapped had an original maturity of 5 years (from 2009 and maturing in 2014).
Amortised costFair value
through OCITotal
LL Million LL Million LL MillionAt 1 January 2012 802,476 518 802,994Additions 153,367 - 153,367
Disposals (redemption) (57,332) - (57,332)
Net change in unamortised premium/discount 277 - 277
Net change in interest receivable 310 - 310
Net change in fair value - (3) (3)
Difference of exchange 30 - 30
At 31 December 2012 899,128 515 899,643Additions 156,606 - 156,606
Disposals (redemption) (92,820) - (92,820)
Securities swapped in 35,612 - 35,612
Securities swapped out (38,000) - (38,000)
Net change in unamortised premium/discount 1,090 - 1,090
Net change in interest receivable 480 - 480
Net change in fair value - (4) (4)
Difference of exchange 66 - 66
At 31 December 2013 962,162 511 962,673
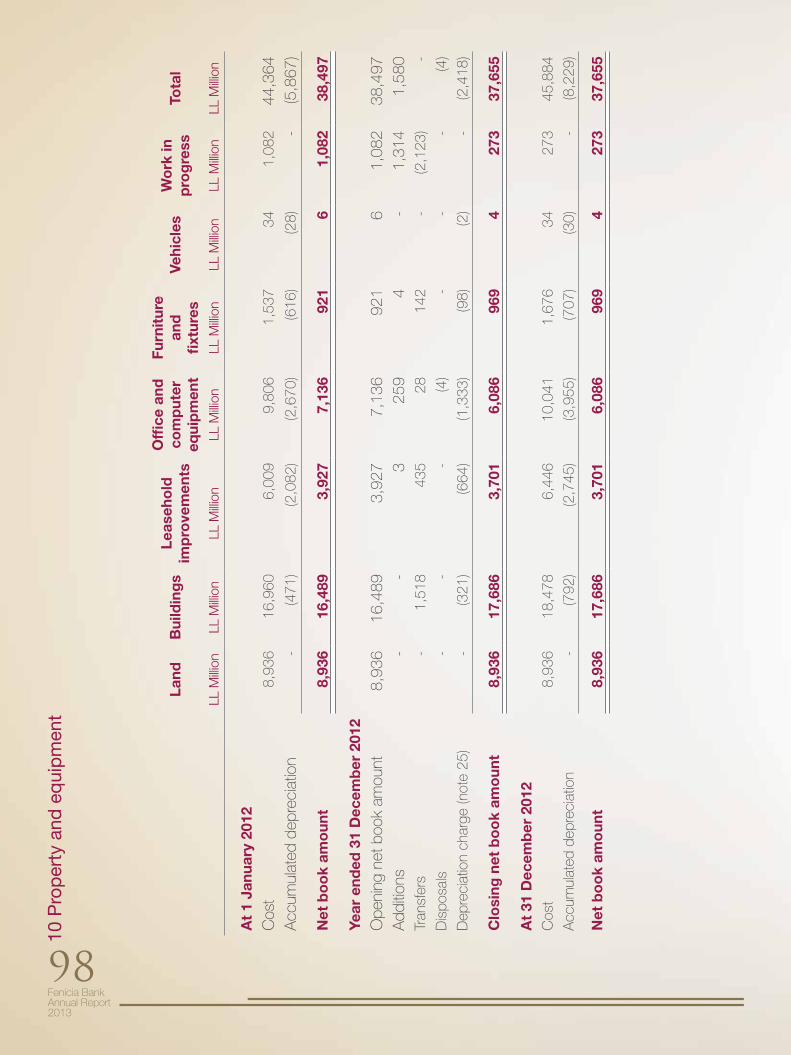
Fenicia Bank Annual Report2013
98
10 P
rop
erty
and
eq
uip
men
t
Land
Bui
ldin
gs
Leas
eho
ldim
pro
vem
ents
Offi
ce a
nd
com
put
er
equi
pm
ent
Furn
itur
e an
dfi
xtur
esVe
hicl
esW
ork
in
pro
gre
ssTo
tal
LL M
illion
LL M
illion
LL M
illion
LL M
illion
LL M
illion
LL M
illion
LL M
illion
LL M
illion
At
1 Ja
nuar
y 20
12
Cos
t8,
936
16,9
606,
009
9,80
61,
537
341,
082
44,3
64A
ccum
ulat
ed d
epre
ciat
ion
-(4
71)
(2,0
82)
(2,6
70)
(616
)(2
8)-
(5,8
67)
Net
bo
ok
amo
unt
8,93
6 16
,489
3,92
77,
136
921
61,
082
38,4
97
Year
end
ed 3
1 D
ecem
ber
201
2
Ope
ning
net
boo
k am
ount
8,93
616
,489
3,92
77,
136
921
61,
082
38,4
97A
dditi
ons
--
325
94
-1,
314
1,58
0Tr
ansf
ers
-1,
518
435
2814
2-
(2,1
23)
-
Dis
posa
ls-
--
(4)
--
-(4
)
Dep
reci
atio
n ch
arge
(not
e 25
)-
(321
)(6
64)
(1,3
33)
(98)
(2)
-(2
,418
)
Clo
sing
net
bo
ok
amo
unt
8,93
617
,686
3,70
16,
086
969
427
337
,655
At
31 D
ecem
ber
201
2C
ost
8,93
618
,478
6,44
610
,041
1,67
634
273
45,8
84
Acc
umul
ated
dep
reci
atio
n-
(792
)(2
,745
)(3
,955
)(7
07)
(30)
-(8
,229
)
Net
bo
ok
amo
unt
8,93
617
,686
3,70
16,
086
969
427
337
,655
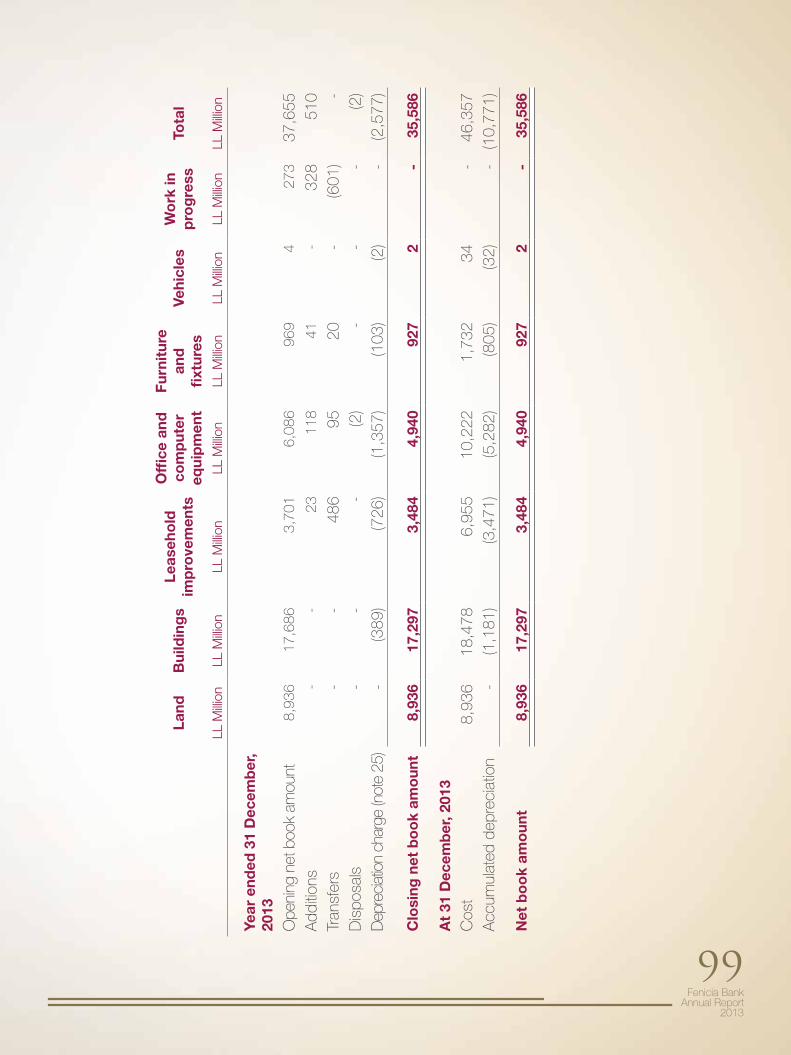
Fenicia Bank Annual Report
2013
99
Land
Bui
ldin
gs
Leas
eho
ldim
pro
vem
ents
Offi
ce a
nd
com
put
er
equi
pm
ent
Furn
itur
e an
dfi
xtur
esVe
hicl
esW
ork
in
pro
gre
ssTo
tal
LL M
illion
LL M
illion
LL M
illion
LL M
illion
LL M
illion
LL M
illion
LL M
illion
LL M
illion
Year
end
ed 3
1 D
ecem
ber
, 20
13
Ope
ning
net
boo
k am
ount
8,93
617
,686
3,70
16,
086
969
427
337
,655
Add
ition
s-
- 2
3 11
841
-32
851
0Tr
ansf
ers
--
486
9520
-(6
01)
-D
ispo
sals
- -
-
(2)
- -
-(2
)D
epre
ciat
ion
char
ge (n
ote
25)
-(3
89)
(726
)(1
,357
)(1
03)
(2)
-(2
,577
)
Clo
sing
net
bo
ok
amo
unt
8,93
617
,297
3,48
44,
940
927
2-
35,5
86
At
31 D
ecem
ber
, 201
3
Cos
t8,
936
18,4
786,
955
10,2
221,
732
34
-46
,357
Acc
umul
ated
dep
reci
atio
n-
(1,1
81)
(3,4
71)
(5,2
82)
(805
)(3
2) -
(1
0,77
1)
Net
bo
ok
amo
unt
8,93
617
,297
3,48
44,
940
927
2-
35,5
86
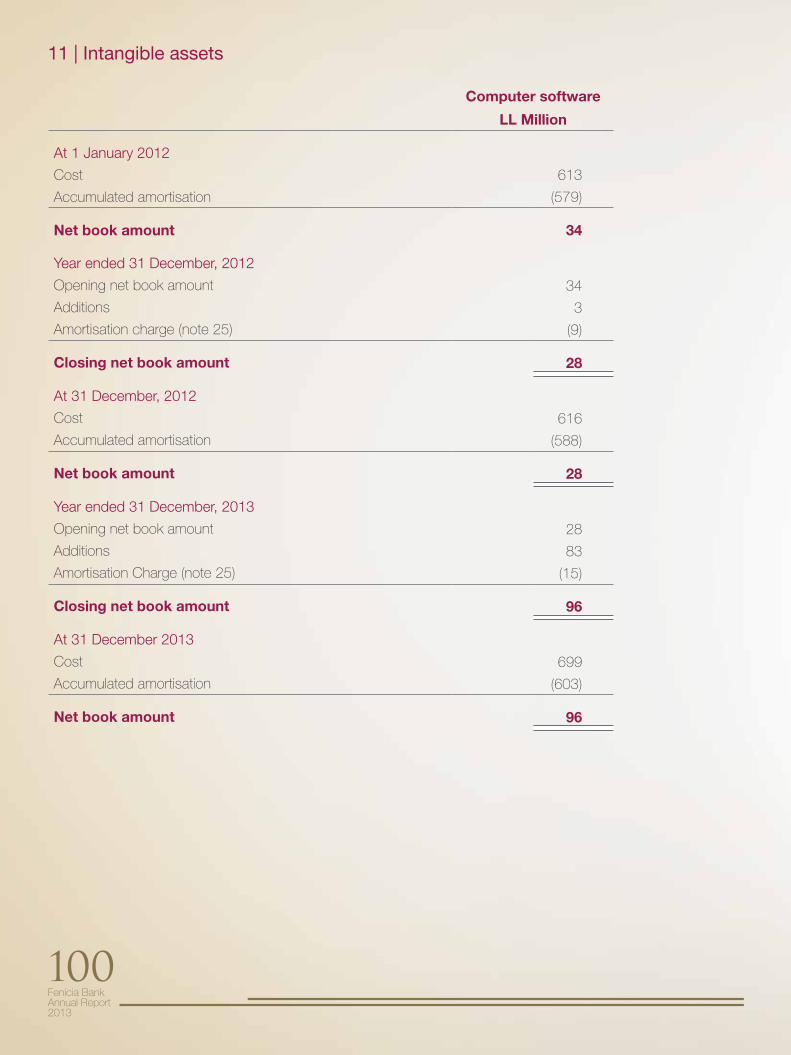
Fenicia Bank Annual Report2013
100
11 | Intangible assets
Computer software
LL Million
At 1 January 2012
Cost 613
Accumulated amortisation (579)
Net book amount 34
Year ended 31 December, 2012
Opening net book amount 34
Additions 3
Amortisation charge (note 25) (9)
Closing net book amount 28
At 31 December, 2012
Cost 616
Accumulated amortisation (588)
Net book amount 28
Year ended 31 December, 2013
Opening net book amount 28
Additions 83
Amortisation Charge (note 25) (15)
Closing net book amount 96
At 31 December 2013
Cost 699
Accumulated amortisation (603)
Net book amount 96
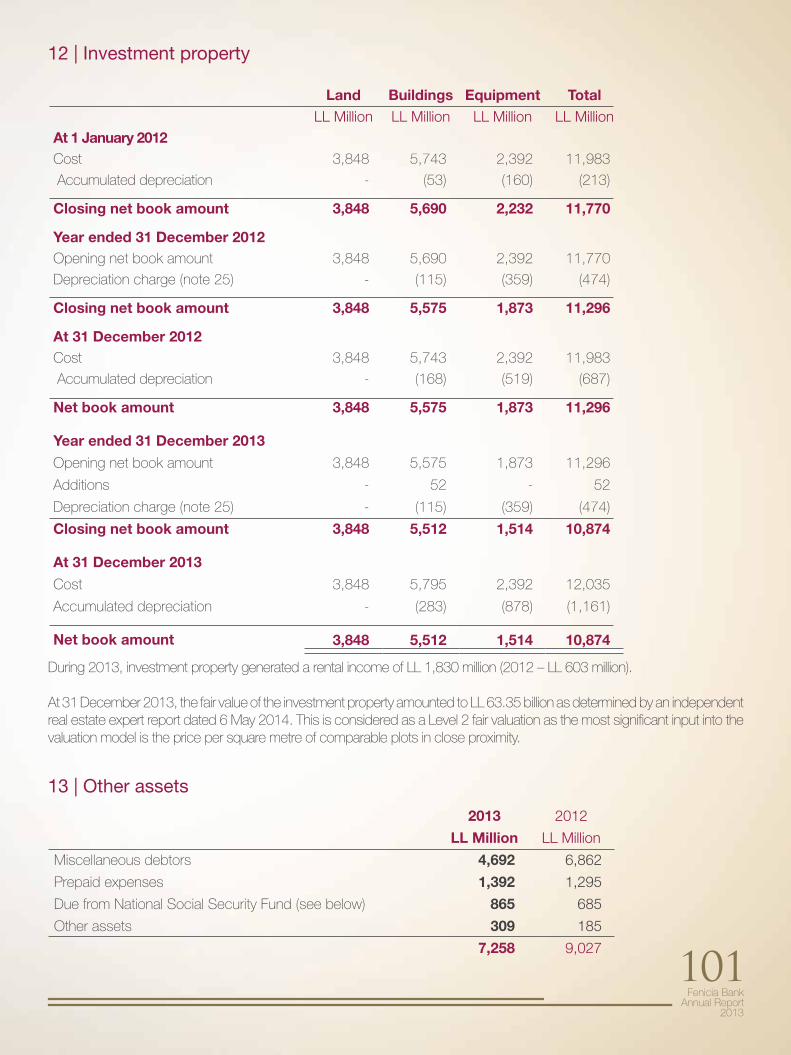
Fenicia Bank Annual Report
2013
101
12 | Investment property
Land Buildings Equipment TotalLL Million LL Million LL Million LL Million
At 1 January 2012 Cost 3,848 5,743 2,392 11,983
Accumulated depreciation - (53) (160) (213)
Closing net book amount 3,848 5,690 2,232 11,770
Year ended 31 December 2012Opening net book amount 3,848 5,690 2,392 11,770
Depreciation charge (note 25) - (115) (359) (474)
Closing net book amount 3,848 5,575 1,873 11,296
At 31 December 2012Cost 3,848 5,743 2,392 11,983
Accumulated depreciation - (168) (519) (687)
Net book amount 3,848 5,575 1,873 11,296
Year ended 31 December 2013
Opening net book amount 3,848 5,575 1,873 11,296
Additions - 52 - 52
Depreciation charge (note 25) - (115) (359) (474)
Closing net book amount 3,848 5,512 1,514 10,874
At 31 December 2013
Cost 3,848 5,795 2,392 12,035
Accumulated depreciation - (283) (878) (1,161)
Net book amount 3,848 5,512 1,514 10,874
During 2013, investment property generated a rental income of LL 1,830 million (2012 – LL 603 million).
At 31 December 2013, the fair value of the investment property amounted to LL 63.35 billion as determined by an independent real estate expert report dated 6 May 2014. This is considered as a Level 2 fair valuation as the most significant input into the valuation model is the price per square metre of comparable plots in close proximity.
13 | Other assets
2013 2012
LL Million LL Million
Miscellaneous debtors 4,692 6,862
Prepaid expenses 1,392 1,295
Due from National Social Security Fund (see below) 865 685
Other assets 309 185
7,258 9,027
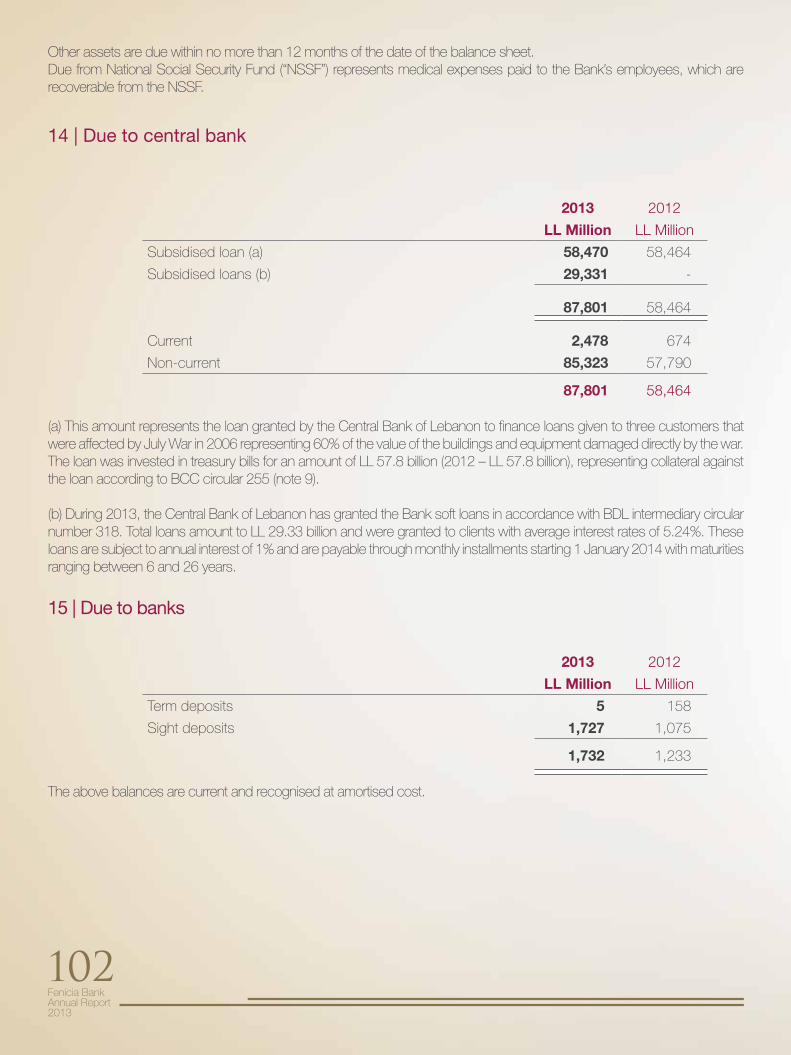
Fenicia Bank Annual Report2013
102
Other assets are due within no more than 12 months of the date of the balance sheet.Due from National Social Security Fund (“NSSF”) represents medical expenses paid to the Bank’s employees, which are recoverable from the NSSF.
14 | Due to central bank
(a) This amount represents the loan granted by the Central Bank of Lebanon to finance loans given to three customers that were affected by July War in 2006 representing 60% of the value of the buildings and equipment damaged directly by the war. The loan was invested in treasury bills for an amount of LL 57.8 billion (2012 – LL 57.8 billion), representing collateral against the loan according to BCC circular 255 (note 9).
(b) During 2013, the Central Bank of Lebanon has granted the Bank soft loans in accordance with BDL intermediary circular number 318. Total loans amount to LL 29.33 billion and were granted to clients with average interest rates of 5.24%. These loans are subject to annual interest of 1% and are payable through monthly installments starting 1 January 2014 with maturities ranging between 6 and 26 years.
15 | Due to banks
The above balances are current and recognised at amortised cost.
2013 2012
LL Million LL Million
Subsidised loan (a) 58,470 58,464
Subsidised loans (b) 29,331 -
87,801 58,464
Current 2,478 674
Non-current 85,323 57,790
87,801 58,464
2013 2012
LL Million LL Million
Term deposits 5 158
Sight deposits 1,727 1,075
1,732 1,233
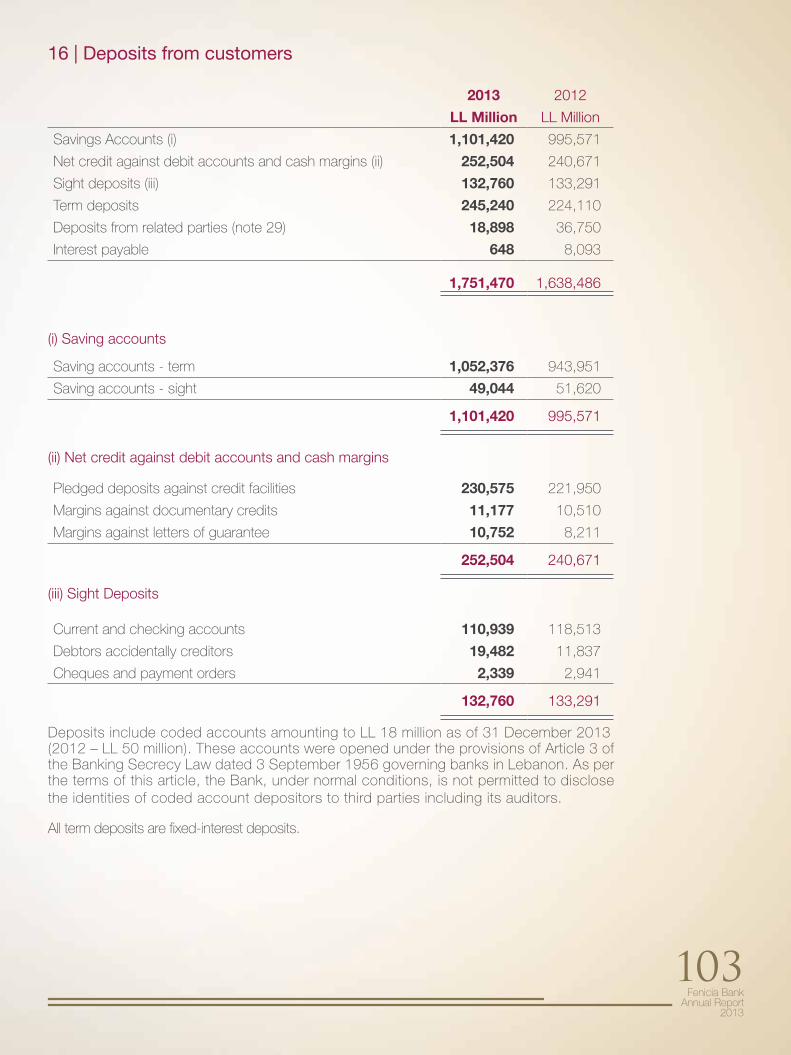
Fenicia Bank Annual Report
2013
103
16 | Deposits from customers
(i) Saving accounts
(ii) Net credit against debit accounts and cash margins
(iii) Sight Deposits
Deposits include coded accounts amounting to LL 18 million as of 31 December 2013(2012 – LL 50 million). These accounts were opened under the provisions of Article 3 ofthe Banking Secrecy Law dated 3 September 1956 governing banks in Lebanon. As per the terms of this article, the Bank, under normal conditions, is not permitted to disclose the identities of coded account depositors to third parties including its auditors.
All term deposits are fixed-interest deposits.
2013 2012
LL Million LL Million
Savings Accounts (i) 1,101,420 995,571
Net credit against debit accounts and cash margins (ii) 252,504 240,671
Sight deposits (iii) 132,760 133,291
Term deposits 245,240 224,110
Deposits from related parties (note 29) 18,898 36,750
Interest payable 648 8,093
1,751,470 1,638,486
Current and checking accounts 110,939 118,513
Debtors accidentally creditors 19,482 11,837
Cheques and payment orders 2,339 2,941
132,760 133,291
Pledged deposits against credit facilities 230,575 221,950
Margins against documentary credits 11,177 10,510
Margins against letters of guarantee 10,752 8,211
252,504 240,671
Saving accounts - term 1,052,376 943,951
Saving accounts - sight 49,044 51,620
1,101,420 995,571
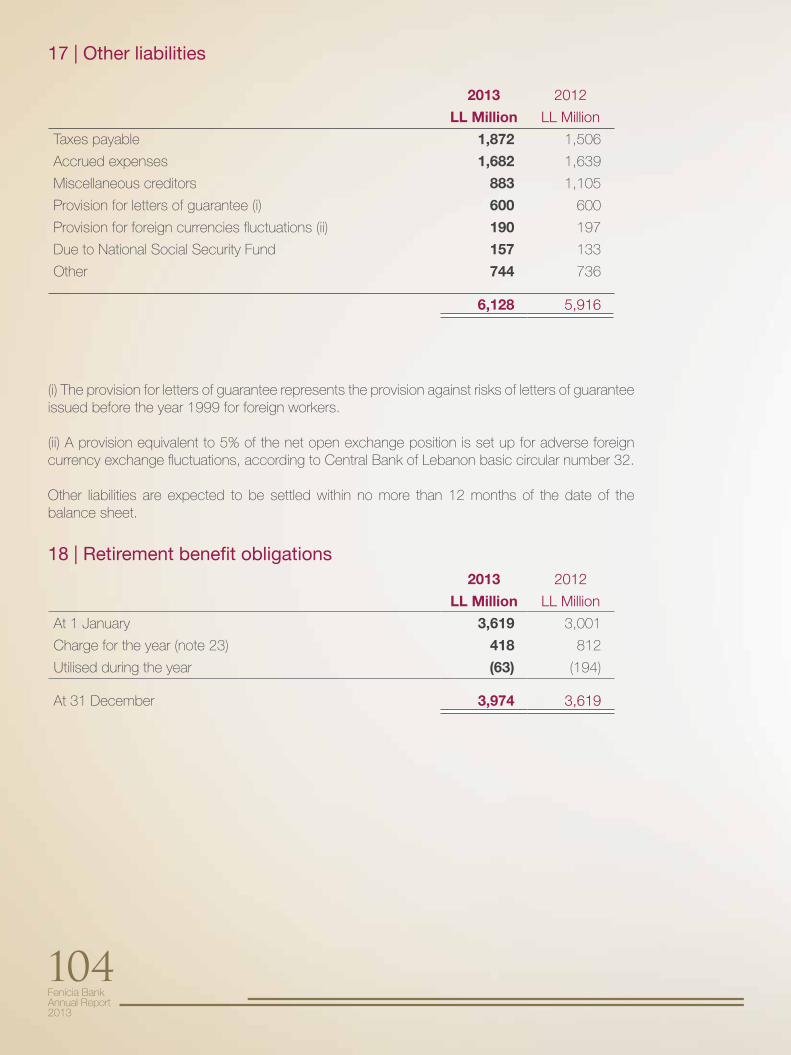
Fenicia Bank Annual Report2013
104
17 | Other liabilities
(i) The provision for letters of guarantee represents the provision against risks of letters of guarantee issued before the year 1999 for foreign workers.
(ii) A provision equivalent to 5% of the net open exchange position is set up for adverse foreign currency exchange fluctuations, according to Central Bank of Lebanon basic circular number 32.
Other liabilities are expected to be settled within no more than 12 months of the date of the balance sheet.
18 | Retirement benefit obligations
2013 2012
LL Million LL Million
Taxes payable 1,872 1,506
Accrued expenses 1,682 1,639
Miscellaneous creditors 883 1,105
Provision for letters of guarantee (i) 600 600
Provision for foreign currencies fluctuations (ii) 190 197
Due to National Social Security Fund 157 133
Other 744 736
6,128 5,916
2013 2012
LL Million LL Million
At 1 January 3,619 3,001
Charge for the year (note 23) 418 812
Utilised during the year (63) (194)
At 31 December 3,974 3,619
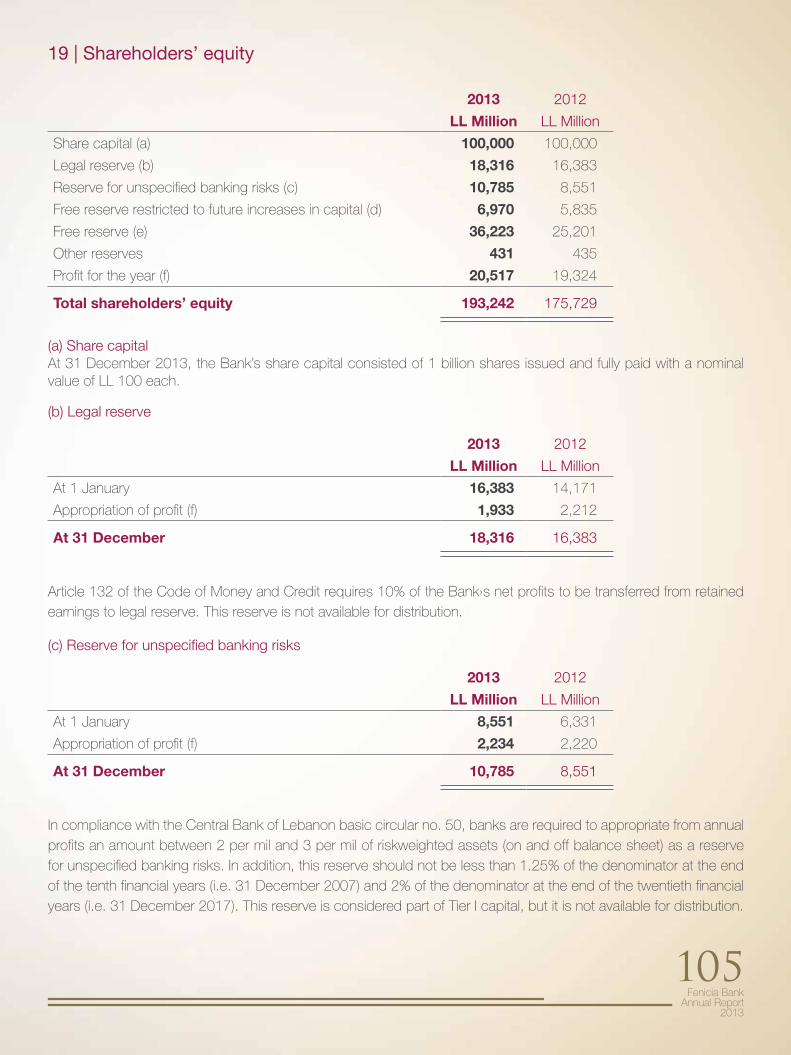
Fenicia Bank Annual Report
2013
105
19 | Shareholders’ equity
(a) Share capitalAt 31 December 2013, the Bank’s share capital consisted of 1 billion shares issued and fully paid with a nominal value of LL 100 each.
(b) Legal reserve
Article 132 of the Code of Money and Credit requires 10% of the Bank›s net profits to be transferred from retained earnings to legal reserve. This reserve is not available for distribution.
(c) Reserve for unspecified banking risks
In compliance with the Central Bank of Lebanon basic circular no. 50, banks are required to appropriate from annual profits an amount between 2 per mil and 3 per mil of riskweighted assets (on and off balance sheet) as a reserve for unspecified banking risks. In addition, this reserve should not be less than 1.25% of the denominator at the end of the tenth financial years (i.e. 31 December 2007) and 2% of the denominator at the end of the twentieth financial years (i.e. 31 December 2017). This reserve is considered part of Tier I capital, but it is not available for distribution.
2013 2012
LL Million LL Million
Share capital (a) 100,000 100,000
Legal reserve (b) 18,316 16,383
Reserve for unspecified banking risks (c) 10,785 8,551
Free reserve restricted to future increases in capital (d) 6,970 5,835
Free reserve (e) 36,223 25,201
Other reserves 431 435
Profit for the year (f) 20,517 19,324
Total shareholders’ equity 193,242 175,729
2013 2012
LL Million LL Million
At 1 January 16,383 14,171
Appropriation of profit (f) 1,933 2,212
At 31 December 18,316 16,383
2013 2012
LL Million LL Million
At 1 January 8,551 6,331
Appropriation of profit (f) 2,234 2,220
At 31 December 10,785 8,551
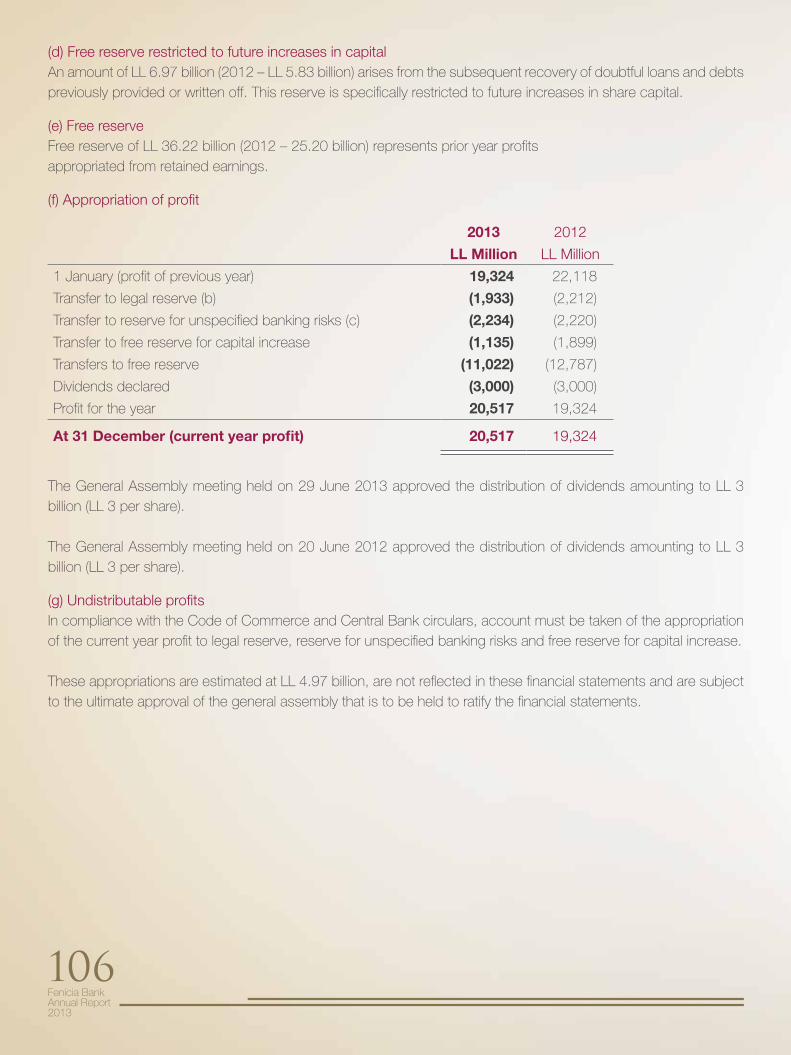
Fenicia Bank Annual Report2013
106
(d) Free reserve restricted to future increases in capitalAn amount of LL 6.97 billion (2012 – LL 5.83 billion) arises from the subsequent recovery of doubtful loans and debts previously provided or written off. This reserve is specifically restricted to future increases in share capital.
(e) Free reserveFree reserve of LL 36.22 billion (2012 – 25.20 billion) represents prior year profitsappropriated from retained earnings.
(f) Appropriation of profit
The General Assembly meeting held on 29 June 2013 approved the distribution of dividends amounting to LL 3 billion (LL 3 per share).
The General Assembly meeting held on 20 June 2012 approved the distribution of dividends amounting to LL 3 billion (LL 3 per share).
(g) Undistributable profitsIn compliance with the Code of Commerce and Central Bank circulars, account must be taken of the appropriation of the current year profit to legal reserve, reserve for unspecified banking risks and free reserve for capital increase.
These appropriations are estimated at LL 4.97 billion, are not reflected in these financial statements and are subject to the ultimate approval of the general assembly that is to be held to ratify the financial statements.
2013 2012
LL Million LL Million
1 January (profit of previous year) 19,324 22,118
Transfer to legal reserve (b) (1,933) (2,212)
Transfer to reserve for unspecified banking risks (c) (2,234) (2,220)
Transfer to free reserve for capital increase (1,135) (1,899)
Transfers to free reserve (11,022) (12,787)
Dividends declared (3,000) (3,000)
Profit for the year 20,517 19,324
At 31 December (current year profit) 20,517 19,324
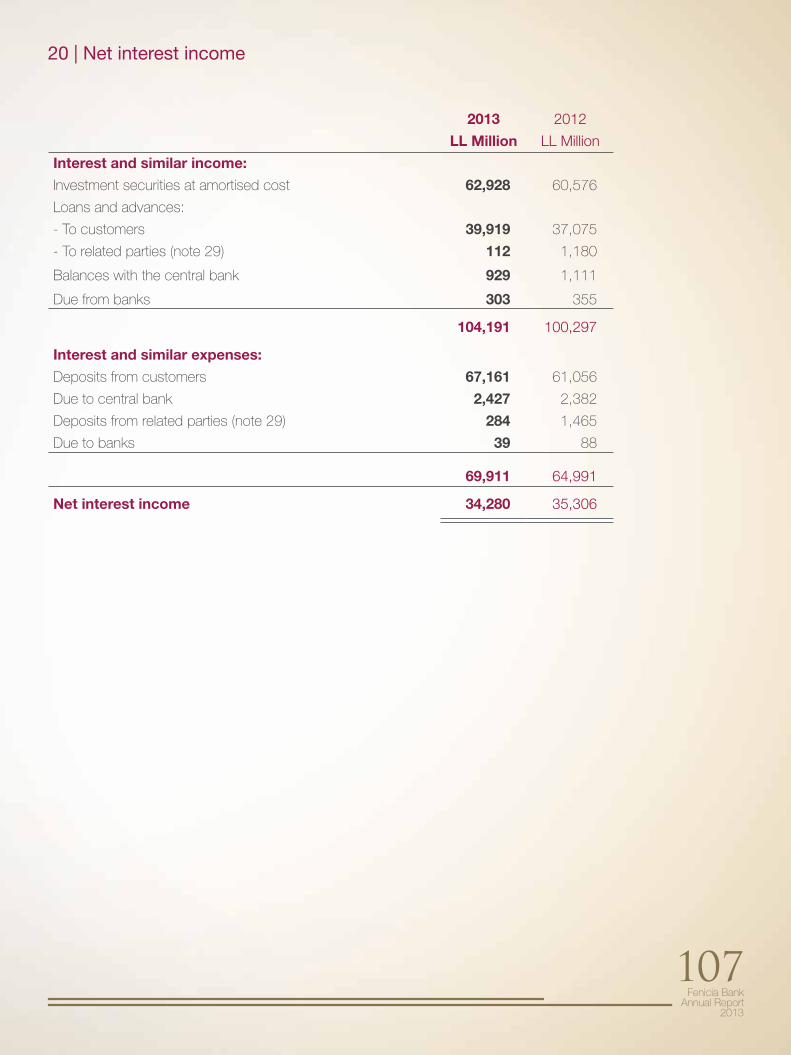
Fenicia Bank Annual Report
2013
107
2013 2012
LL Million LL Million
Interest and similar income:
Investment securities at amortised cost 62,928 60,576
Loans and advances:
- To customers 39,919 37,075
- To related parties (note 29) 112 1,180
Balances with the central bank 929 1,111
Due from banks 303 355
104,191 100,297
Interest and similar expenses:
Deposits from customers 67,161 61,056
Due to central bank 2,427 2,382
Deposits from related parties (note 29) 284 1,465
Due to banks 39 88
69,911 64,991
Net interest income 34,280 35,306
20 | Net interest income
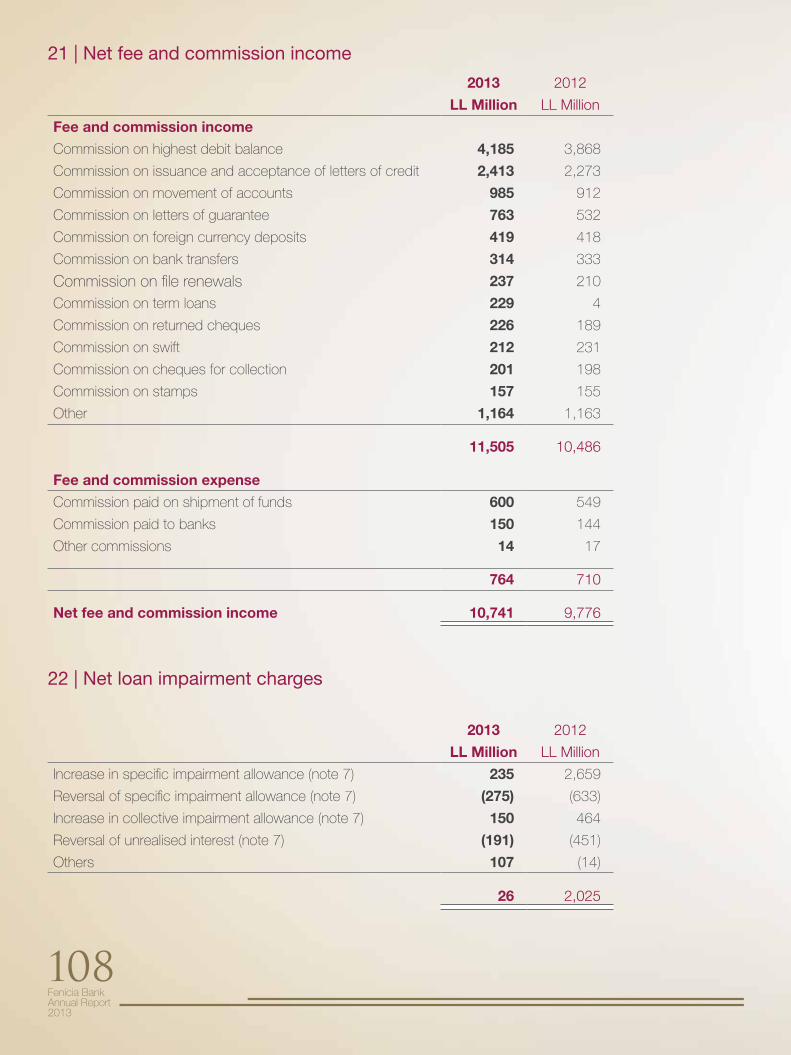
Fenicia Bank Annual Report2013
108
21 | Net fee and commission income
22 | Net loan impairment charges
2013 2012
LL Million LL Million
Fee and commission income
Commission on highest debit balance 4,185 3,868
Commission on issuance and acceptance of letters of credit 2,413 2,273
Commission on movement of accounts 985 912
Commission on letters of guarantee 763 532
Commission on foreign currency deposits 419 418
Commission on bank transfers 314 333
Commission on file renewals 237 210
Commission on term loans 229 4
Commission on returned cheques 226 189
Commission on swift 212 231
Commission on cheques for collection 201 198
Commission on stamps 157 155
Other 1,164 1,163
11,505 10,486
Fee and commission expense
Commission paid on shipment of funds 600 549
Commission paid to banks 150 144
Other commissions 14 17
764 710
Net fee and commission income 10,741 9,776
2013 2012
LL Million LL Million
Increase in specific impairment allowance (note 7) 235 2,659
Reversal of specific impairment allowance (note 7) (275) (633)
Increase in collective impairment allowance (note 7) 150 464
Reversal of unrealised interest (note 7) (191) (451)
Others 107 (14)
26 2,025
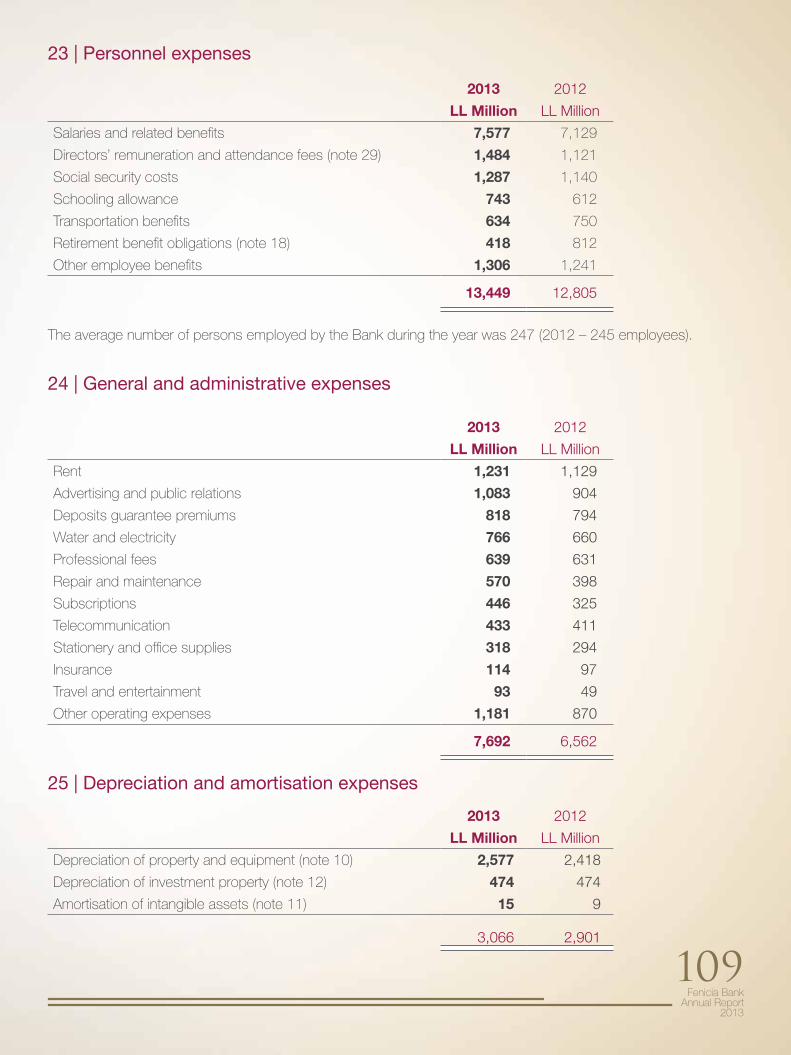
Fenicia Bank Annual Report
2013
109
23 | Personnel expenses
The average number of persons employed by the Bank during the year was 247 (2012 – 245 employees).
24 | General and administrative expenses
25 | Depreciation and amortisation expenses
2013 2012
LL Million LL Million
Salaries and related benefits 7,577 7,129
Directors’ remuneration and attendance fees (note 29) 1,484 1,121
Social security costs 1,287 1,140
Schooling allowance 743 612
Transportation benefits 634 750
Retirement benefit obligations (note 18) 418 812
Other employee benefits 1,306 1,241
13,449 12,805
2013 2012
LL Million LL Million
Rent 1,231 1,129
Advertising and public relations 1,083 904
Deposits guarantee premiums 818 794
Water and electricity 766 660
Professional fees 639 631
Repair and maintenance 570 398
Subscriptions 446 325
Telecommunication 433 411
Stationery and office supplies 318 294
Insurance 114 97
Travel and entertainment 93 49
Other operating expenses 1,181 870
7,692 6,562
2013 2012
LL Million LL Million
Depreciation of property and equipment (note 10) 2,577 2,418
Depreciation of investment property (note 12) 474 474
Amortisation of intangible assets (note 11) 15 9
3,066 2,901
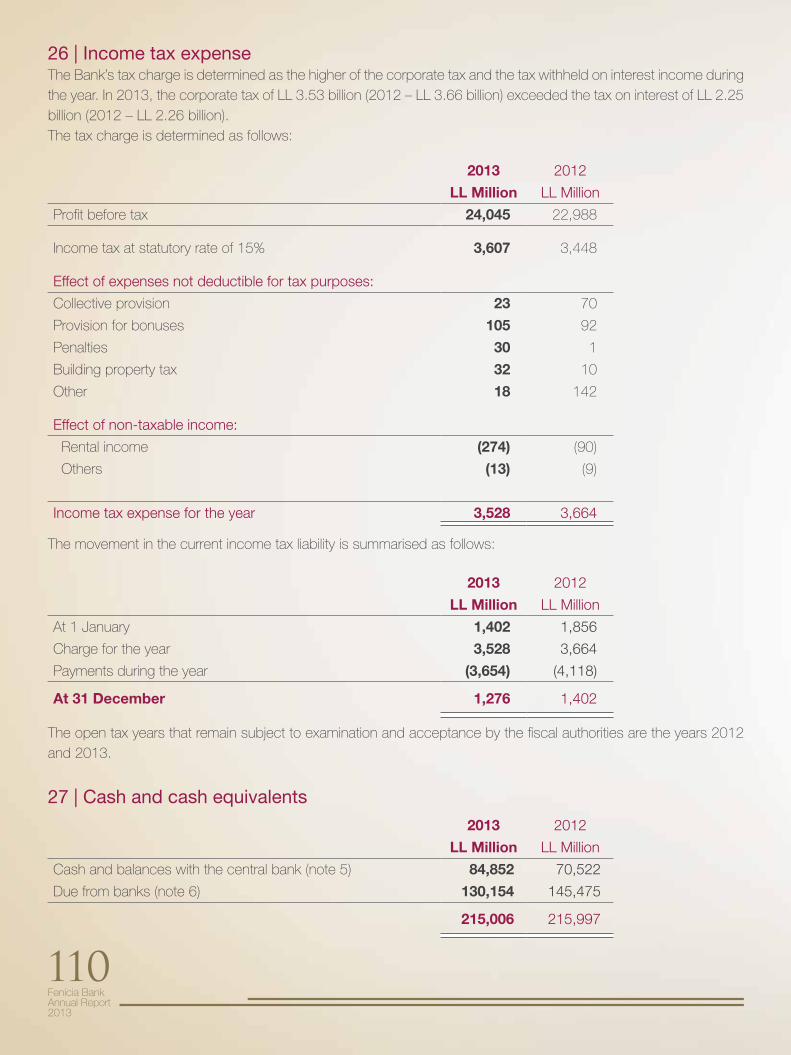
Fenicia Bank Annual Report2013
110
26 | Income tax expenseThe Bank’s tax charge is determined as the higher of the corporate tax and the tax withheld on interest income during the year. In 2013, the corporate tax of LL 3.53 billion (2012 – LL 3.66 billion) exceeded the tax on interest of LL 2.25 billion (2012 – LL 2.26 billion).The tax charge is determined as follows:
The movement in the current income tax liability is summarised as follows:
The open tax years that remain subject to examination and acceptance by the fiscal authorities are the years 2012 and 2013.
27 | Cash and cash equivalents
2013 2012
LL Million LL Million
Profit before tax 24,045 22,988
Income tax at statutory rate of 15% 3,607 3,448
Effect of expenses not deductible for tax purposes:
Collective provision 23 70
Provision for bonuses 105 92
Penalties 30 1
Building property tax 32 10
Other 18 142
Effect of non-taxable income:
Rental income (274) (90)
Others (13) (9)
Income tax expense for the year 3,528 3,664
2013 2012
LL Million LL Million
At 1 January 1,402 1,856
Charge for the year 3,528 3,664
Payments during the year (3,654) (4,118)
At 31 December 1,276 1,402
2013 2012
LL Million LL Million
Cash and balances with the central bank (note 5) 84,852 70,522
Due from banks (note 6) 130,154 145,475
215,006 215,997
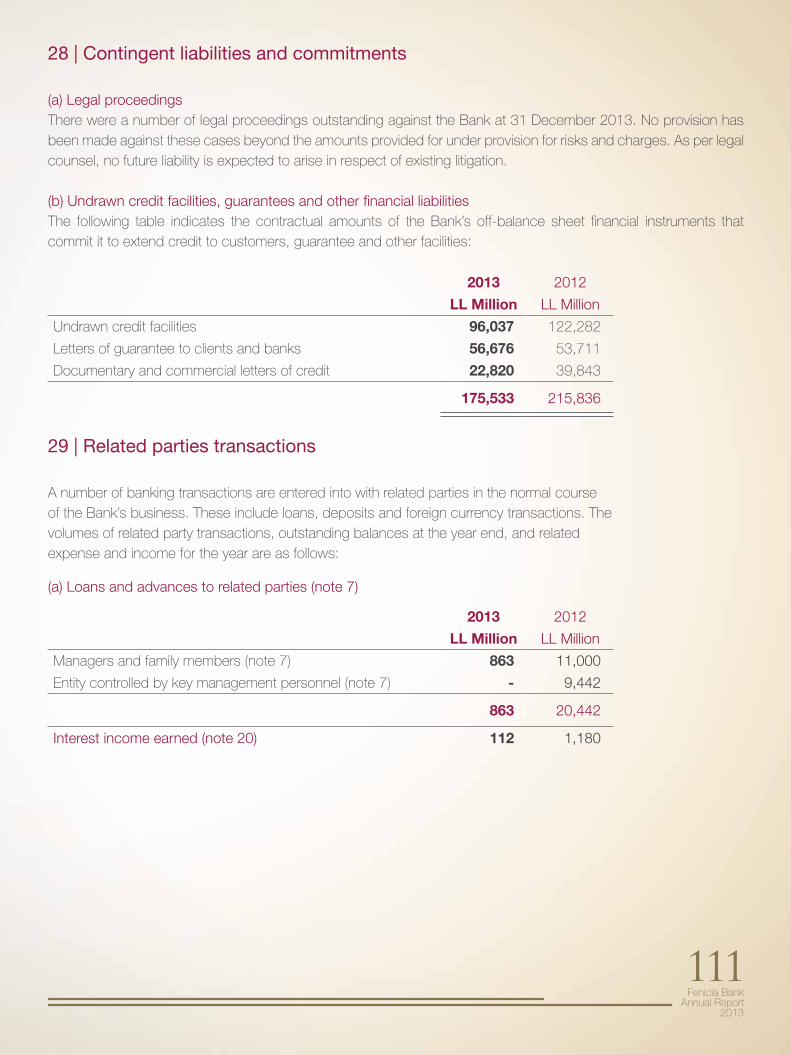
Fenicia Bank Annual Report
2013
111
28 | Contingent liabilities and commitments
(a) Legal proceedingsThere were a number of legal proceedings outstanding against the Bank at 31 December 2013. No provision has been made against these cases beyond the amounts provided for under provision for risks and charges. As per legal counsel, no future liability is expected to arise in respect of existing litigation.
(b) Undrawn credit facilities, guarantees and other financial liabilitiesThe following table indicates the contractual amounts of the Bank’s off-balance sheet financial instruments that commit it to extend credit to customers, guarantee and other facilities:
29 | Related parties transactions
A number of banking transactions are entered into with related parties in the normal courseof the Bank’s business. These include loans, deposits and foreign currency transactions. Thevolumes of related party transactions, outstanding balances at the year end, and relatedexpense and income for the year are as follows:
(a) Loans and advances to related parties (note 7)
2013 2012
LL Million LL Million
Undrawn credit facilities 96,037 122,282
Letters of guarantee to clients and banks 56,676 53,711
Documentary and commercial letters of credit 22,820 39,843
175,533 215,836
2013 2012
LL Million LL Million
Managers and family members (note 7) 863 11,000
Entity controlled by key management personnel (note 7) - 9,442
863 20,442
Interest income earned (note 20) 112 1,180
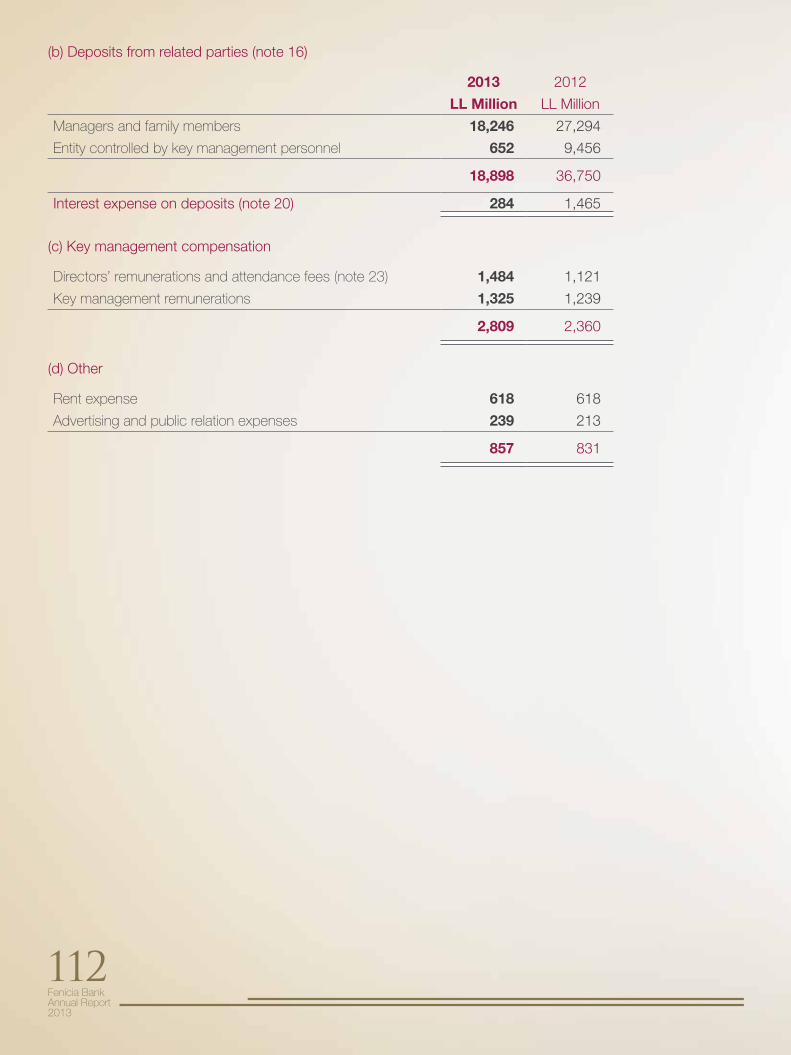
Fenicia Bank Annual Report2013
112
(b) Deposits from related parties (note 16)
(c) Key management compensation
(d) Other
2013 2012
LL Million LL Million
Managers and family members 18,246 27,294
Entity controlled by key management personnel 652 9,456
18,898 36,750
Interest expense on deposits (note 20) 284 1,465
Directors’ remunerations and attendance fees (note 23) 1,484 1,121
Key management remunerations 1,325 1,239
2,809 2,360
Rent expense 618 618
Advertising and public relation expenses 239 213
857 831

Fenicia Bank Annual Report
2013
113

Fenicia Bank Annual Report2013
114
CORRESPONDENT BANKS& ADDRESSES

Fenicia Bank Annual Report
2013
115
Supporting the real investmentsAt Fenicia Bank, we know that the real values lie in human relationships.
Fenicia Bank loans are tailor-made to help you realize every project you have planned.

Fenicia Bank Annual Report2013
116
Belgium Byblos Bank Europe S.A. Brussels
France BLOM France Bank Paris Al Khaliji France S.A. Paris
Germany The Bank of New York Mellon Frankfurt Commerz Bank Frankfurt ABC International Bank Frankfurt Bank of Beirut (UK) LTD Frankfurt
Italy Unicredit S.P.A Milan
Japan The Bank of New York Mellon Tokyo
Kuwait Ahli United Bank K.S.C
Turkey Asya Katilim Bankasi.As Istanbul
United Kingdom The British Arab Commercial Bank London Bank of Beirut (UK) LTD London
United States of America Standard Chartered Bank New York The Bank of New York Mellon New York
U.A.E. Mashreq Bank PSC Dubai
CORRESPONDENT BANKS

Fenicia Bank Annual Report
2013
117
BRANCHES
HEAD OFFICE
Beirut Central District, Foch Street, Fenicia Bank Bldg.P.O.Box: 113-6248Telefax: (00 961 1) 957857 Zip Code: 1103-2110 Beirut LebanonFax: (00 961 1)957858Swift: BKAWLBBEE-mail: [email protected]
ABBASSIEH BRANCH
Jal Albaher, Main Road, Belle Vue Bldg. P.O.Box: 113-6248Telefax: (00 961 7) 742710 - 742722 - 741722 Zip Code: 1103-2110 Beirut LebanonE-mail: [email protected] Outdoor
ACHRAFIEH BRANCH
Sassine Square, Dr. Maalouf Bldg. P.O.Box: 113-6248Telefax: (00 961 1) 338635 - 219030 Zip Code: 1103-2110 Beirut LebanonE-mail: [email protected] Outdoor
BIKFAYA BRANCH
Bikfaya Highway, Massoud Bldg. P.O.Box: 113-6248Telefax: (00 961 4) 983221 - 982320 982322 Zip Code: 1103-2110 Beirut LebanonE-mail: [email protected] Outdoor
BIR HASSAN BRANCH
Way Down Sultan Ibrahim, Rafic Hariri University Hospital district, Al-Mays(1) Bldg. P.O.Box: 113-6248Telefax: (00 961 1) 843611 - 843612 Zip Code: 1103-2110 Beirut LebanonSwift: BKAWLBBEE-mail: [email protected] Outdoor
BINT JBEIL BRANCH
Main Road, Al Shamy Bldg. P.O.Box: 113-6248Telefax: (00 961 7) 450051 - 452454Zip Code: 1103-2110 Beirut LebanonE-mail: [email protected] Outdoor
CHTOURA BRANCH
Jdeita Main road, P.O.Box: 113-6248Telefax: (00 961 8) 546630 - 546631 Zip Code: 1103-2110 Beirut LebanonE-mail: [email protected] Outdoor
FOCH BRANCH
Beirut Central District, Foch Street,Fenicia Bank Bldg. P.O.Box: 113-6248Telefax: (00 961 1) 957800 Zip Code: 1103-2110 Beirut LebanonFax: (00 961 1)957801E-mail: [email protected] Outdoor
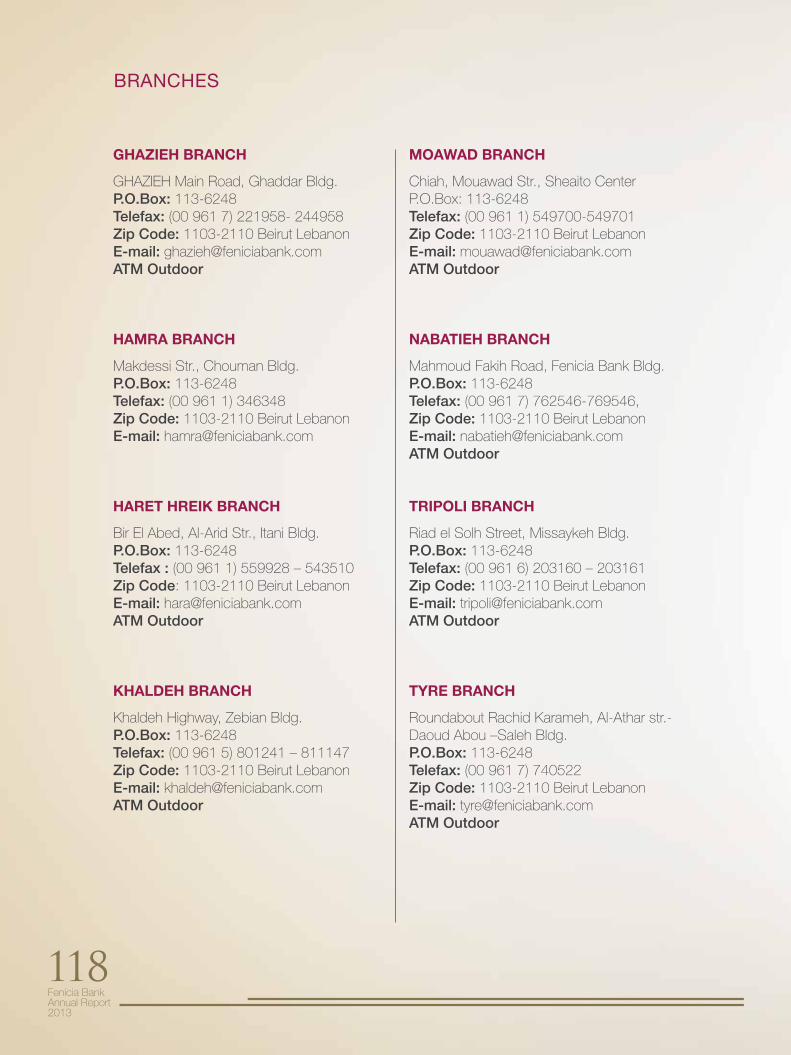
Fenicia Bank Annual Report2013
118
BRANCHES
GHAZIEH BRANCH
GHAZIEH Main Road, Ghaddar Bldg. P.O.Box: 113-6248Telefax: (00 961 7) 221958- 244958 Zip Code: 1103-2110 Beirut LebanonE-mail: [email protected] Outdoor
HAMRA BRANCH
Makdessi Str., Chouman Bldg. P.O.Box: 113-6248Telefax: (00 961 1) 346348 Zip Code: 1103-2110 Beirut LebanonE-mail: [email protected]
HARET HREIK BRANCH
Bir El Abed, Al-Arid Str., Itani Bldg. P.O.Box: 113-6248Telefax : (00 961 1) 559928 – 543510 Zip Code: 1103-2110 Beirut LebanonE-mail: [email protected] Outdoor
KHALDEH BRANCH
Khaldeh Highway, Zebian Bldg. P.O.Box: 113-6248Telefax: (00 961 5) 801241 – 811147 Zip Code: 1103-2110 Beirut LebanonE-mail: [email protected] ATM Outdoor
MOAWAD BRANCH
Chiah, Mouawad Str., Sheaito Center P.O.Box: 113-6248Telefax: (00 961 1) 549700-549701 Zip Code: 1103-2110 Beirut LebanonE-mail: [email protected] Outdoor
NABATIEH BRANCH
Mahmoud Fakih Road, Fenicia Bank Bldg. P.O.Box: 113-6248Telefax: (00 961 7) 762546-769546, Zip Code: 1103-2110 Beirut LebanonE-mail: [email protected] Outdoor
TRIPOLI BRANCH
Riad el Solh Street, Missaykeh Bldg. P.O.Box: 113-6248Telefax: (00 961 6) 203160 – 203161 Zip Code: 1103-2110 Beirut LebanonE-mail: [email protected] Outdoor
TYRE BRANCH
Roundabout Rachid Karameh, Al-Athar str.-Daoud Abou –Saleh Bldg. P.O.Box: 113-6248Telefax: (00 961 7) 740522 Zip Code: 1103-2110 Beirut LebanonE-mail: [email protected] Outdoor
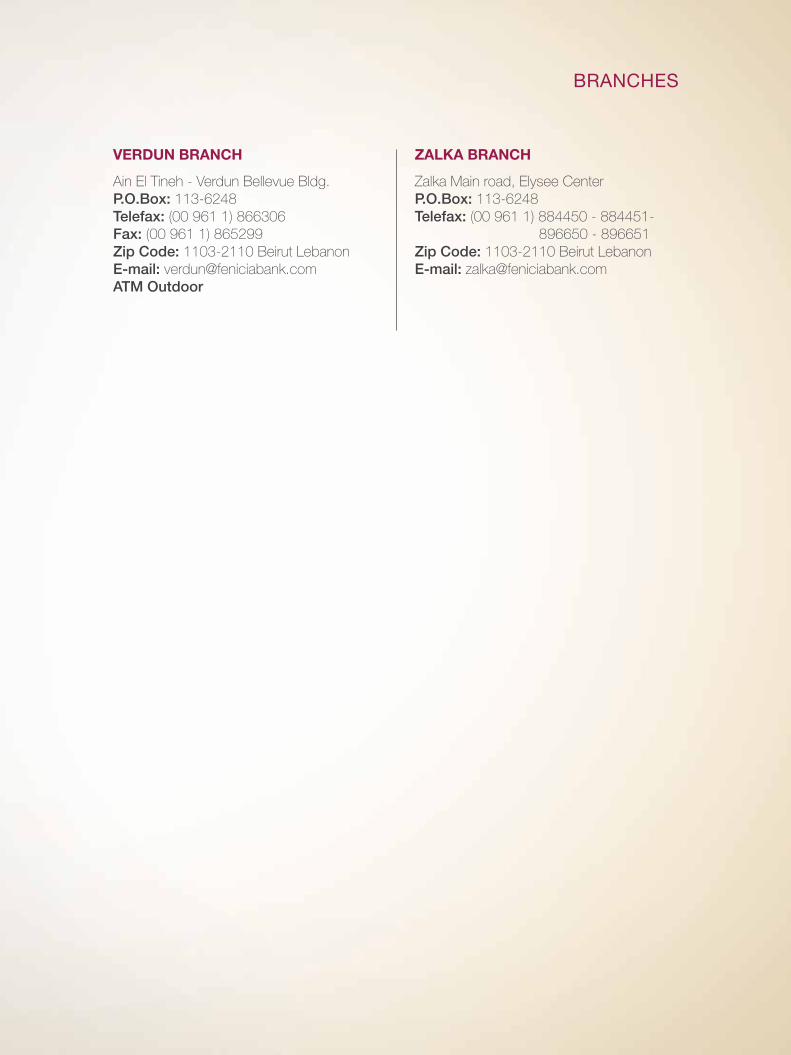
BRANCHES
VERDUN BRANCH
Ain El Tineh - Verdun Bellevue Bldg.P.O.Box: 113-6248Telefax: (00 961 1) 866306 Fax: (00 961 1) 865299Zip Code: 1103-2110 Beirut LebanonE-mail: [email protected] Outdoor
ZALKA BRANCH
Zalka Main road, Elysee Center P.O.Box: 113-6248Telefax: (00 961 1) 884450 - 884451- 896650 - 896651 Zip Code: 1103-2110 Beirut LebanonE-mail: [email protected]