Embed Size (px)
Citation preview
208 B. FELDMAN-MUHSAM
Life Tables for Mwsca vicina and Calliphora erythrocephalu. By B. FELDMAN-MUHSAM, Ph.D., and H. V. MUHSAM, Dr.-Qs-sc. (Dept. of Parasitology, Hebrew University, Jerusalem).
[Communicated by THE SCIENTIFIC DIREcToRcReceived May 28th. 1945.1
(With 3 figures in the text.)
I. INTRODUCTION.
The construction of life tables for animals has attracted the attention of very few investigators. -4uthors usually content themselves by stating the mean length of life or the life span, i. e . , the longest length of life observed by them. But the life span is a very unreliable measure of the length of life, as it is subject to great errors of sampling, and the statement of a mere mean does not provide any possibility to estimate which higher ages may be reached by 9ome individuals. The life table, on the contrary, furnishes detailed infor- mation as to the mean expectation of life and permits also to estimate reliably the actually possible life span. The life table therefore forms one of the very fundaments of the biology of every animal species.
Furthermore, certain characteristic features of the shape of the survivorship curve have been observed in man and in different animal species, but no con- clusion could yet be drawn, whether they constitute a universal phenomenon of life, or if they appear only in certain animal species or under specific conditions.
We therefore thought it worth while to compute graduated life tables for two species of flies belonging to the superfamily Calypterae, Musca vicina Macq. and C'nlliphorn erythrocephalu Mg., on which one of us had collected, in connec- tion with other res-arch, hhe data required for this purpose. Crude data on the life tables for imagines of M.zrsca, together with some of the figures on the biology of pre-imaginal stages, reproduced here, have already been published Feldman-Muhsam (1944).
11. EXPERIMENTAL METHODS. a The plan of experiments on imagines.
The data on longevity of imagines were recorded from flies, which were kept under conditions approaching natural surroundings as far as possible. They were fed daily on fresh food, according to their feeding habits. Special care had to be taken to feed flitbs neither too much nor too little, as they are liable to drink to excess, which may cause their death, or they may suffer from starvation. Flies were kept in cages of tulle cloth stretched over a framework of iron wire, large enough to ensure fair flying space, males and females in about equal numbers. Nornial oviposition was observed for both species and eggs were eventually removed from the cages.
Flies constituting an experimental unit were introduced simultaneou~ly into a cage, none of then] being more than 24 hours old. Each cage was examined daily, deaths having occurred since the previous examination recorded and dead flies removed. It should be emphasized that flies which died during emergence, or immediately after i t , were not recorded, and only living and normally developed flies were used in all experiments. b. Rearing methods for Musoa.
Musca used in the experiments were obtained from laboratory rearings on cow dung, carried out at a constant temperature of 30" C. The duration of pre-imaginal stages varies with temperature, as shown in Table 1.
Mortality of pre-imaginal stages depends largely on rearing conditions ; but under optimal conditions, 85% of t h e eggs reach the stage of imago. The

LtFE TABLES FOR MLJJCA VICINA 4 N D CALLIPRORA ERYTHROUEPRALA 297
- -
Egg . . . . . . .
l,aIT.rt . . . . .
Pupa. . . . . . .
17.5' C. 2 9 O c. 3 4 O c. - -
31.8 hourx 10.7S hcium 8.25 hours
14.25 dn.ys 6.24 d a y s .i.1 days
13.25 ,. .X) ). 9.8 ,.
Duration.
Egg . . . . . . . . . 12 hours
Larva . . . . . . . I days
Pupa. . . . . . . . 5.0 days
The longevity of imagines varies considerably with conditions of temperature and humidity. But for temperatures approaching local summer conditions (25"-30" C.) the influence of humidity is relatively small, and for all degrees of humidity between 40% and 80% R.H.. longevity varies only within very restricted limits. The r~xperiments which furnished the data for the compilatiori of life tables for imagines of Mzrsca were carried out a t a constant temperature of 27" C., humidity varying for the six experimental units between 40% and SOYo R.H. Flies were fed on diluted milk, given to them in a Petri dish, the bottom of which was padded with cotton wool, in order to prevent flies from drowning. Females deposited their eggs in the milk. Flies were kept in cylindrical cages, measuring 12 cm in diameter and 14 cm in height.
Between 60 and 90 flies were introduced in every cage, 50% to 67% of their number being males. This proportion of sexes is also encountered out of doors during summer months. I n toto, 253 males and 288 females served for the computation of the life tables.
c. Rearing methods for Calliphora.
20" C. from flies caught out of doors. conditions approximately as follows :-
Calliphora were reared on chicken heart or liver a t a temperature of about The pre-imaginal stages last under t,hese
Egg . . . . . . . .one day. Larva . . . . . .seven to eight days. Pupa . . . . . . .nine days.
Flies were fed on chicken liver and 10% sugar solution, given to them in a Petri dish padded with cotton wool like those used in feeding Musca. Eggs were deposited on the liver. The life tables are based on data from three experi- mental units, coniprising a total of 152 males and 196 females. Flies consti- tuting an experimental unit were kept in a cubic cage, measuring 30 cm. each way, and experirnent,s carried out at a mean temperature of 18" C. and 60% R.H.
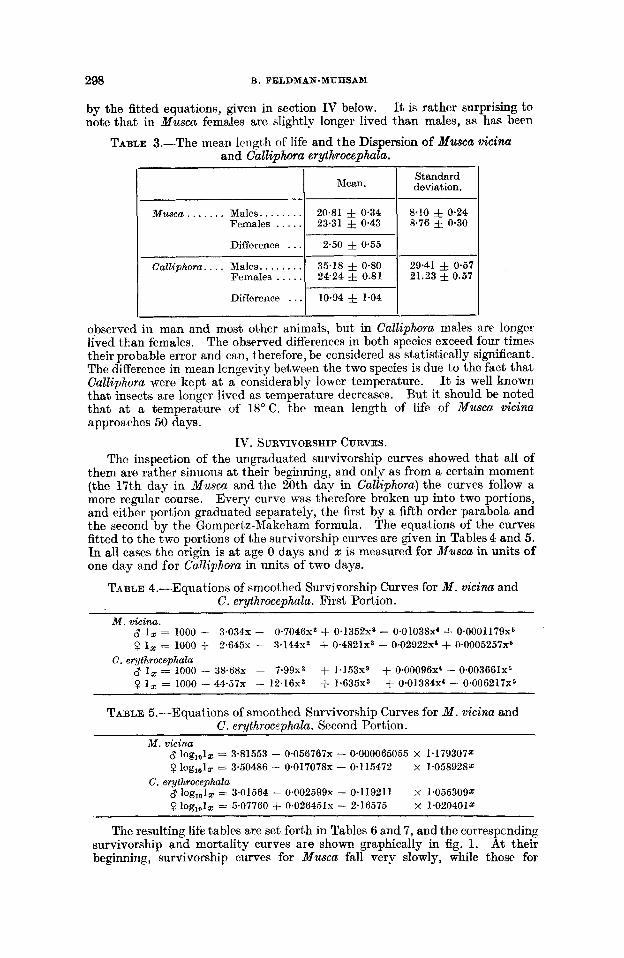
111. THE MEAN LENGTH OF LIFE. The niean duration of life and the dispersion for both sexes of the two
species of flies are summed up in Table 3, based on the crude data, ungraduated Paoa. ZOOL. SOC. LOND.-VOL. 115. 20
Death from 300 eggs.
19
d l r
298 B. FELDMAN-MURSAM
Mean.
M u s c a . . . . . . . Males.. . . . . . . 20.81 & 0.34 Females . . . . . 23.31 & 0.43
Difference . . . 2.50 f 0.55
Standard deviation.
8.10 & 0.24 8.76 j, 0.30
Ca.ZZiphom.. . . Males.. . . . . . . 35-18 f 0.80 29.41 f 0.57
M . vicina 8 lOg,,lz = 3.81553 - 0.056767~ - 0000065055 X 1.1793072
Difference . . .
9 10gl,lr = 3.50486 - 0.017078~ - 0.1 15472 X 1.058928, C. erythrocephata
8 10glol~ = 3'01564 - 0.002599~ - 0~119211 9 l ~ g ~ , l ~ = 5'07760 + 0.026451~ - 2.16575
x 1.055309s x 1.0204012
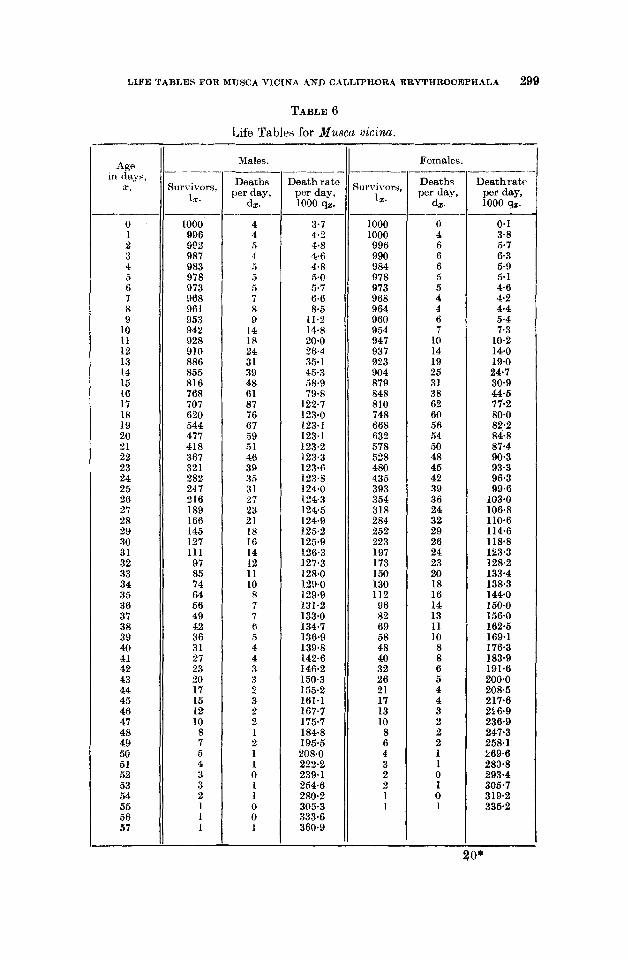
The resulting life tables are set forth in Tables 6 and 7, and the correspcnding survivorship and mortality curves are shown graphically in fig. 1. At their beginning, survivorship curves for Musca fall very slowly, while those for
10.94 & 1.04
LIFE TABLES FOR MUYCA VICINA AND CALLIPHQRA ERYTHROCEPHALA 299
B g e in days,
2’.
0 1 2 3 4 5 6 7 8 9
10 11 12 13 14 16 16 17 18 19 20 21 22 23 24 25 26 27 28 29 3 0 31 32 33 34 3 5 36 37 38 39 40 41 42 43 44 45 46 47 48 49 50 51 52 53 54 55 56 57
TABLE 6
Life Tables for Muscn uicina.
Survivors. 13.
1000 996 992 987 983 978 973 968 961 953 942 928 910 886 855 816 768 707 620 544 477 418 367 321 282 247 216 189 166 145 127 111 97 85 74 64 56 49 42 36 31 27 23 20 17 15 12 10 8 7 5 4 3 3 2 1 I 1
Males.
Deaths
dz. per day,
4 4 5 I 5
5 7 8 9
14 18 24 31 39 48 61 87 76 67 5 9 51 46 39 36 31 27 23 21 18 16 14 12 11 10 8 7 7 6 5 4 4 3 3
3 2 2 1 2 1 1 0 1 1 0 0 1
1
Death rate per day,
3-7 4.2 4.8 4.6 4.8 5.0 5.7 6.6 8.5
11.2 14.8 20.0 56.4 35.1 45.3 58.9 79.8
122.7 123.0 123- 1 123.1 123.2 123.3 123.6 123.8 124.0 124.3 124.5 124.9 125.2 125.9 126.3 127.3 128.0 129.0 129.9 131.2 133.0 134.7 136.9 139.8 142-6 146.2 150.3 155.2 161.1 167.7 175.7 184.8 195.5 208.0 222.2 239.1 254.6 280.2 306.3 333.6 360.9
1000 qz. ___-
-___ Survivors,
12.
1000 1000 996 990 984 978 973 968 964 960 954 947 93 7 923 904 879 848 810 748 668 632 578 528 480 435 393 354 318 284 252 223 197 173 150 130 112 96 82 69 58 48 40 32 26 21 17 13 10 8 6 4 3 2 2 1 1
Females.
Deaths
dz.
0 4 6 6 6 5 5 4 4 6
10 14 19 25 31 38 62 60 56 54 50 48 45 42 39 36 24 32 29 26 24 23 20 18 16 14 13 11 10 8 8 6 5 4 4 3 2 2 2 1 1 0 1 0 1
per day,
_-
-
Deathratc per day, 1000 92.
0.1 3.8 5.7 6.3 5.9 5.1 4.6 4.2 4.4 5.4 7.3
10.2 14.0 19.0 24.7 30.9 44.5 77.2 80.0
84.8 87.4 90.3 93.3 96.3 99.6
103-0 106.8 110.6 114.6 118.8 123.3 128.2 133.4 138.3 144.0 1500 156.0 162.5 169.1 176.3 183.9 191.6 200.0 208.5 217.6 2: 6.9 236.9 247-3 258.1 269.6 283.8 293-4 305.7 319.2 335.2
82.2
300 B. FELDMAN-MUHSAM
Age in days, 2.
0-2 2-4 4-6 6-8
10-12 12-14 14-16 16-18 18-20 20-22 22-24 24-26 26-28 28-30 30-32 32-34 34-36 36-38 38-40 4 0 4 2 42-44 44-46 46-48
8-10
48-50 50-52 52-54
56-58 58-60 60-62
5 6 5 6
62-64 64-66
68-70 70-72 72-74 74-76
78-80
8%84 84-86
66-68
76-78
80-82
86-88
90-92 92-94 94-96 96-98 98-100
100-102 102-1 04 104-106 106-108
110-1 12 112-114 114-1 16 116-118
120-122
88-90
108-110
118-120
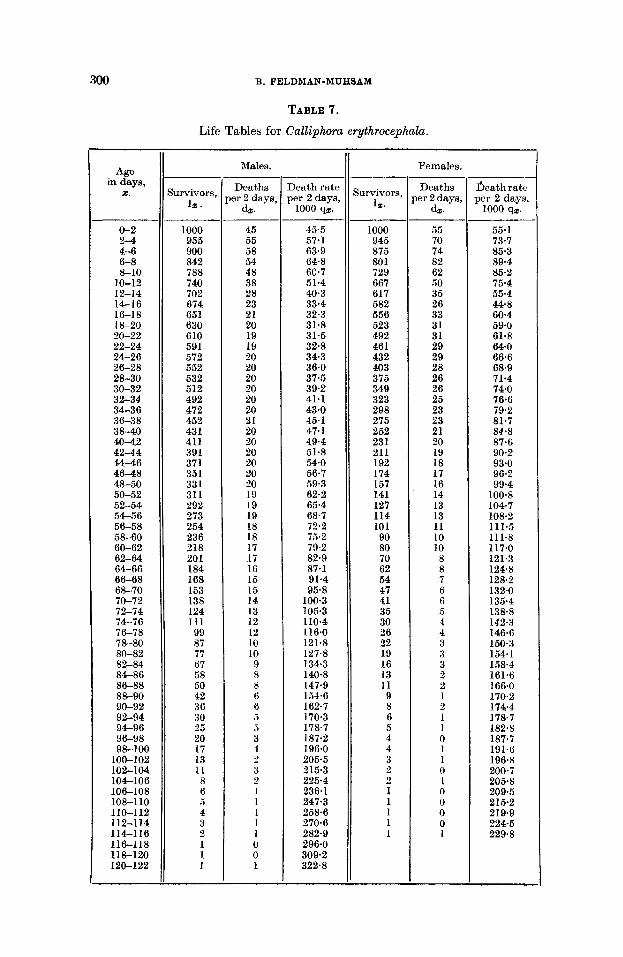
TABLE 7.
Life Tables for Calliphora erythrocephak.
Survivors, 12.
1000 955 900 842 788 740 702 674 65 1 630 610 591 572 552 532 512 492 472 452 43 1 411 391 37 1 351 33 1 311 292 273 254 236 318 20 1 184 168 153 138 124 111 99 87 77 67 58 50 42 36 30 25 20 17 13 11 8 6 .i 4 3 2 1 1 1
Nales.
Deaths ler 2 duys,
dx.
45 55 58 54 48 38 28 23 21 20 19 19 20 20 20 20 20 20 21 20 20 20 20 20 20 19 19 19 18 18 17 17 16 15 15 14 13 12 12 10 10 I) 8 8 6 6
5 3 1
3 2 1 1 1 1 1 0 0 1
?
? -
45.5 57.1 63.9 64-8 6C.7 51.4 40.3 33.4 32.3 31-8 31-5 32.8 34.3 36.0 37.5 39.2 41.1 43.0 45.1 47.1 49.4 51.8 54.0 56.7 59.3 62.2 65.4 68.7 72.2 75.2 79.2 82.9 87.1 91.4 95.8
100.3 105.3 110.4 116.0 121.8 127.8 134.3 140.8 147.9 154.6 162.7 170.3 178.7 187.2 196.0 205-5 215.3 2254 236.1 247-3 258.6 270.6 282.9 296.0 309.2 322.8
1000 945 875 80 1 729 667 617 582 556 523 492 461 432 403 375 349 323 298 275 2 52 231 21 1 192 174 157 141 127 114 101 90 80 70 62 54 47 41 35 30 36 22 19 16 13 11 9 8 6 5 4 4 3 2
1 1 1 1 1
9 1
Females.
Deaths ler 2 days,
dX.
55 70 74 82 62 50 35 26 33 31 31 29 29 28 26 26 25 23 23 21 20 19 18 17 16 14 13 13 11 10 10 8 8 7 6 6 5 4 4 3 3 3 2 2 1 2 1 1 0 1 1 0 1 0 0 0 0 1
- Oeathrattl per 2 days,
1000 9%.
55.1 73.7 85.3 89.4 85.2 75.4 55.4 44.8 60.4 59.0 61.8 64-0 66.6 68.9 71.4 74.0 76.6 79.2 81.7 84.8 87.6 90.2 93.0 96.2 99.4
100.8 104.7 108.2 11 1.5 11 1.8 117.0 121.3 128.8 128-2 132.0 135.4 138.8 142.3 146.6 150.3 154.1 1584 161.6 1664 170.2 1744 178.7 182.8 187-7 191.6 196.8 200.7 205.8 209.5 2 15.2 219.9 224.5 229.8
LIFE TABLES FOR MUSCA VICINA AND CALLIPHORA ERYTHROCEPHALA 301
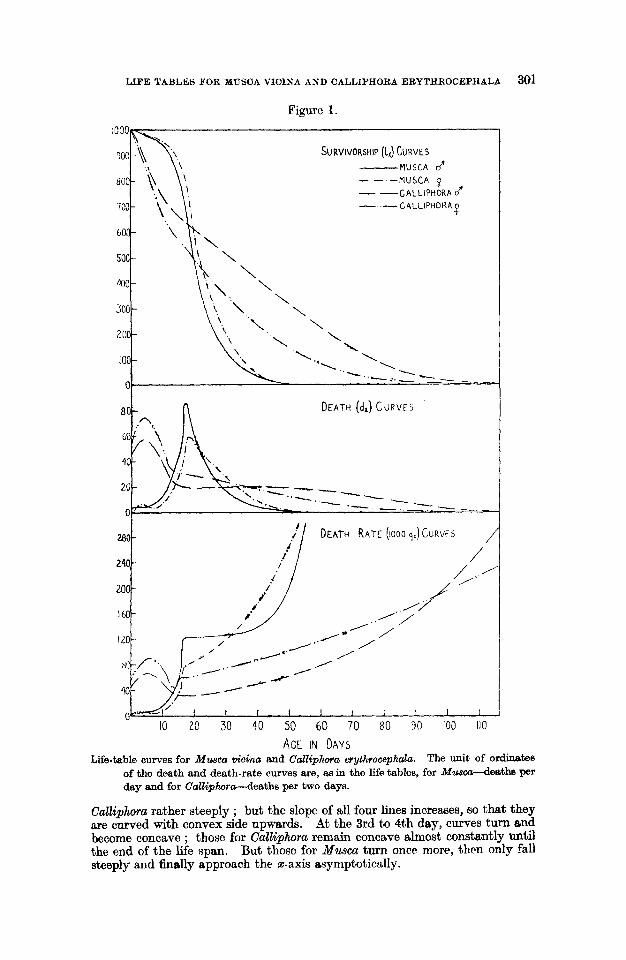
Figure 1. IOOOa;, -
'300 -1 SURVIVORSHIP (1') CURVES -MUSCA d"
- -CALLIPHORA 6 aoo- - - --MUSCA 9
700- -. -CALCIPHORA$!
60' -
500 -
400 -
300,-
\ \
\
- _ - , 0
80- n DEATH (dJ C U R V E S
AGE IN DAYS Life-table curves for Mwca vicina and Calliphora erythrocephala. The unit of ordinetas
of the death and death-rate curves are, as in the life tables, for Mwcu-deathe per day and for Callipiwra-deaths per two days.
Calliphora rather steeply ; but the slope of all four lines increases, so that they are curved with convex side upwards. At the 3rd to 4th day, curves turn and become concave ; those for Calliphora remain concave almost constantly until the end of the life span. But those for Musm turn once more, then only fall steeply and finally approach the z-axis asymptotically.

302 B. FELDMAN-MUHSAM
In both species of flies mortality is relatively high during a few- days at the beginning of imaginal life. This is very striking for Culliphoru and appearb clearly from the death and death-rate curves of fig. 1, the death rate reaching a maximum for both males and females on the 4-5th day. This phenomenon is not so marked in Musca, but it can well be discerned in the death curves of fig. 2.
A similar phenomenon has been observed by Pearl and collaborators (1941) in Tribolium conficsum Duval and has been compared by thein to hcman infant mortality. For reasons which will be evident from considerations of section V below, we do not think it appropriate to parallel a high mortality occurring during the first days of imaginal life of an insect to human infant mortality and therefore propose to call such an occurence premature imaginal mortality. As a matter of fact, our life tables for flies differ in this respect’ slightly from Pearl’s for Triboliurn : whereas in Tribolium premature imaginal mortality is highest just after emergence, in flies it reaches its maximum only
w I t < w 5
Figure 2.
9
a 7
6
5
4
3
2
I
0 0 2 4 6 8
AGE IN DAYS Enlargement (from f ig . 1) of the death curves for M . wicim for the first 10 days of
imaginal life, showing premature imaginal mortality.
on the 3rd to 5th day of iniaginal life. This diflerence is probably due in a high degree to our experimental conditions. As already mentioned, flies which died during and just after emergence, and those apparently ill-formed, were eliminated from the experiments, and it is evident that under such circumstances mortality should be small on the very first days. It must, moreover, be empha- sized in this connection, that, for Micsca, rearing conditions were very nearly optimal and, owing to experimental circumstances, feebler fies were more efficiently eliminated ; it is therefore not surprising that premature mortality is much less striking in Musca than in Calliphora.
According to their general shape, survivorship curves for Musca and Calliphora belong to two different types of Pearl’s classification (1935). Whereas the survivorship curves for Musca should be included in the B1-type, although they approach the rectangular shape of the A-type, t\liose for Calliphora belong to Pearl’s C-type.
LIFE TABLES FOR MUSCA VICINA AND CALLIPHORA ERYTHROCEPHALA 303
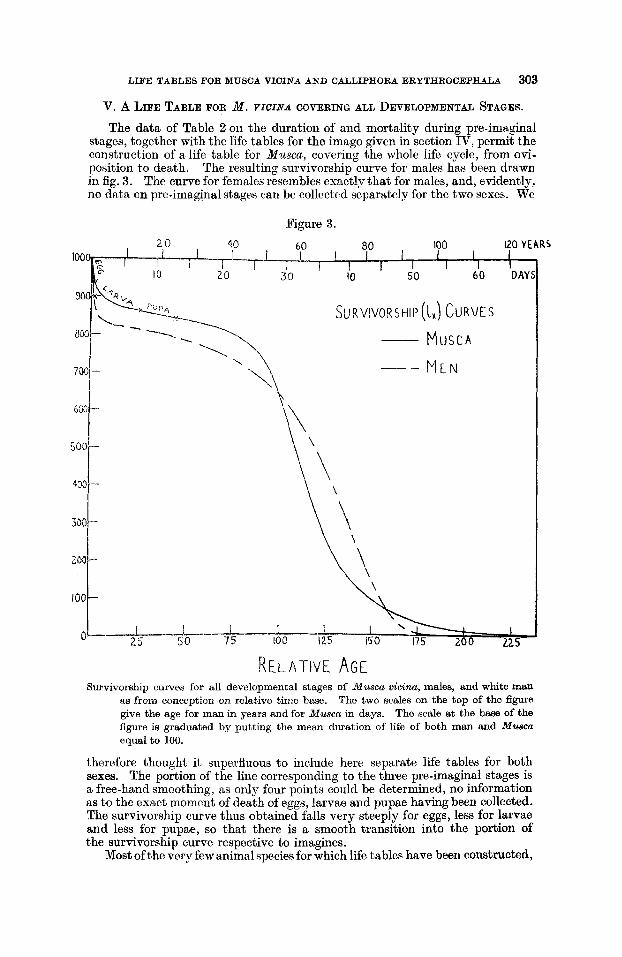
V. A LIFE TABLE FOR M . VICINA COVERING ALL DEVELOPMENTAL STAGES.
The data of Table 2 on the duration of and mortality during pre-imaginal stages, together with the life tables for the imago given in section IV, permit the construction of a life table for Musca, covering the whole life cycle, from ovi- position to death. The resulting survivorship curve for males has been drawn in fig. 3. The curve €or females resembles exactly that for males, and, evidently, no dat,a on pre-imaginal stages can be collected separately for the two sexes. We
Figure 3 . 60 80 100 120 YEARS I I I I
I I I 30 40 50 60 DAY
+l'- -
300 -
200,-
- -- -. -'\
SU R VIVOR s HIP SU R VIVOR s HIP
-. --.. -c.
669
I00
(1J CURVES MUSCA M E N
. I \ p.-,
150 175 200 1-L-L.- I
0 25 50 75 100 125
RELATIVE AGE Survivorship curves for all developmental stages of Musca uicina, males, itnd white man
as from conception on relative time base. The two scales on the top of the figure give the age for man in years and for Musca in days. The scale at the base of the figure is graduated by putting the mean duration of life of both man and M w c a equal to 100.
therefore thought it superfluous to include here separate life tables for both sexes. The portion of the line corresponding to the three pre-imaginal stages is a free-hand smoothing, as only four points could be determined, no information as to the exact moment of death of eggs, larvae and pupae having been collected. The survivorship curve thus obtained falls very steeply for eggs, less for larvae and less for pupae, so that there is a smooth transition into the portion of the survivorship curve respective to imagines.
Most of the very few animal species for which life tables have been constructed,

304 B. FELDMAN-MUHSAM
up to the present time, belong to the class of lnseota ; but these life tables are confined to imaginal life and do not include pre-imaginal stages, Bodenheimer's: (1938) life table for S'chistocerca gregaria being perhnps the only exception. We therefore thought it worth while to oonipare our life table for Muscu, covering all stages from egg to imago, with a human life table by means of the relative time base, a method proposed by Yearl arid Miner (1935) for this purpose and used by Pearl (1928) in a slightly different form, for the comparison of a life table for Drosophila imagines with the portion o f the human life table starting at the age of 12 years. The period of life in man, corresponding to the life of an insect through all stages of development, extends from conception to death, as in insects, fertilization occurs generally just before oviposition. The life table for Musea-from egg to imago-should therefore be compared with a life table for man including prenatal deaths, i. e . , miscarriages. The number of miscarriages is very variously estimated by different authors and, although most recent estimates scatter around 20% (Pearl, 1934, we chose the value of 10% given by Prinzing (1930), since this figure seems not to be biased by the inclusion of artificial abortions. A straight line, representing a mortality of 10% during 9 months of gestation, has, therefore, been added to the survivorship curve arising from the U.S.A. life tables for white men for the years 1929-31 (Dublin and Lotka, 1936), and the resulting line has been drawn on the relative time scale of fig. 3. Table 8 sets forth the life tables for Musca and man on the relative time base.
TABLE 8.
Life Tables for M. vicina and Man on relative Time Base.
Age on relative time base
(mean duration of life = 100),
2.
0 1.4 1.7
25.9 44.8 50 75
100 125 150 175 200 225
M . vicina.
Age (days from
oviposition).
0 (Oviposition)
0.5 (Eclosion) 7.5 (Pupation)
13.0 (Emergence) 14.5 21.8 29.1 36.3 43.6 50.9 58.1 66-4
Sul.vivors, 12.
1000
937 867 844 839 806 647 261 99 36 13 2
White men (U.S.A. 1929-31).
Age (years from conception).
0 (Conception) 0.75 (Birth) 0.92
14.0 24.2 27.0 40.6 54.0 67.5 81.0 94.5
108.0 121.6
Survivors, lZ .
1000 900 891 815 793 786 736 631 445 151
6 0 0
The resemblance in the general shape of the two curves of fig. 3 and the parallelism of their different portions is very striking. Both start with very heavy mortality, corresponding respectively to the egg and foetus and lasting for about 1-5 hundredth of the mean duration of life. This is followed by a period of rapidly diminishing slope of the survivorship curve : the infancy of man and the larval stage of flies. The third period is characterized by a very low mortality and lasts a little longer for Musca than for man ; in flies it covers the stage of pupa and the pre-oviposition period of imago, whereas in man it lasts up to the age of 18-20 years. Then both lines begin to fall more and more steeply, that for man less than that for Musea, and, finally, both turn once more and approach the x-axis asymptotically. About 10% of both, man and Musca, reach an age exceeding the mean by more than 50% ; but a not negligible

LIFB-TABLES FOR MUSCA VICINA ANL) OALLIPHORA ERYTHROCEPHALA 305
number of flies may reach a considerably higher ape, which would correspond to 110-120 years for man.
Thus, by this comparison of life tables, a well-marked parallelism is exhibited between the mortality at and the relative duration of biologically corresponding periods of the life of two extremely different animal species. No general vonclusion should be drawn from this resemblance, but we do not assume that, in t,he present case, it is due to mere chance.
VI. SUMMARY. Life tables for the imago of Musca vicina and Callzphora erythrocephah were
(*ompiled from flies kept under controlled conditions. Musca were fed on diluted milk and Calliphora on 10% sugar solution and chicken liver.
In 3Iusca females are slightly longer lived than males and the contraryis true for Calliphora.
The survivorship curves, and more strikingly the death curves., exhibit a relatively high mortality during the early days of imaginal life. For the purpose of graduation, the life tables were broken up into two portions and the first one, containing the period of “ premature inisginal mortality,” fitted by R fifth order parabola, and the second one by the Gompertz-Makeham formula.
For Musca, a complete life table, covering all stages of development, hah been compiled and compared to the human life table including miscarriages. This comparison reveals a parallelism between portions of the survivorship curves representing respectively the periods of foetus-egg, infancy-larva , youth and puberty-pupa and young imago, adult man-fertile imago.
BKBLIOQWHY BODENEEIMER, P. S. (1938). DUBLIN, L. I.-. & LOTKA, A. J. (1936). FELDMAN-MUHSAM, B. (1944).
Bulb. Ent. Res. 35, 53-67. PEARL, R. (1928). The Rate of Living. New York. PEARL, R. (1939). The Natural History of Population. London. PEARL, R.. & MINER, J. R. (1935).
Problems of Animal Ecology. Oxford University Press. Length of Life. New York.
Studies on the Ecology of the Levant House Fly ( M . doniestka vicina. Macq.).
Experimental Studies on the Duration of Life.-XIV. The Comparative Mortality of rertain lower Organisms. Quart. Rev. B id .
PEARL, R.. P m , TH., & MINER, J. R. (1941). Experimental Studies on the Duration of Life.-XVI. Life Tables for the Flow Beetle Triboliwn conftbsum Duval. Amer. Nut. 75, 5-19.
10, 60-79.
PRINZIN, F. (1930). Handbuch der meokinischen Statietik. Jena.