Embed Size (px)
Citation preview
Running head: GERMICIDAL AGENT 1
Germicidal Agent on Personal Protective Equipment Group Project
Randy Brienza, Linda Bueno, Cynthia Gensamer,
David Liebermann, Rachel Karash, and Donald Tatum
Malone University
Marketing Management
Dr. Marjorie Carlson Hurst
November 30, 2014
GERMICIDAL AGENT ON PERSONAL PROTECTIVE EQUIPMENT
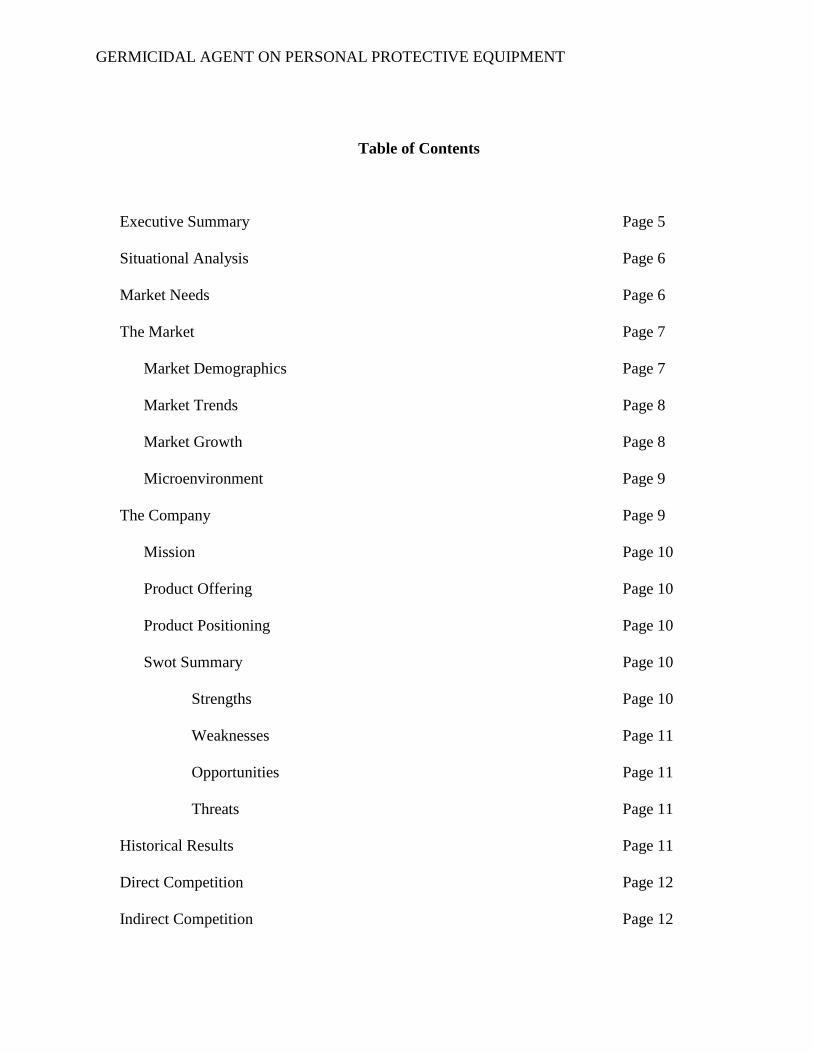
Table of Contents
Executive Summary Page 5
Situational Analysis Page 6
Market Needs Page 6
The Market Page 7
Market Demographics Page 7
Market Trends Page 8
Market Growth Page 8
Microenvironment Page 9
The Company Page 9
Mission Page 10
Product Offering Page 10
Product Positioning Page 10
Swot Summary Page 10
Strengths Page 10
Weaknesses Page 11
Opportunities Page 11
Threats Page 11
Historical Results Page 11
Direct Competition Page 12
Indirect Competition Page 12
GERMICIDAL AGENT ON PERSONAL PROTECTIVE EQUIPMENT
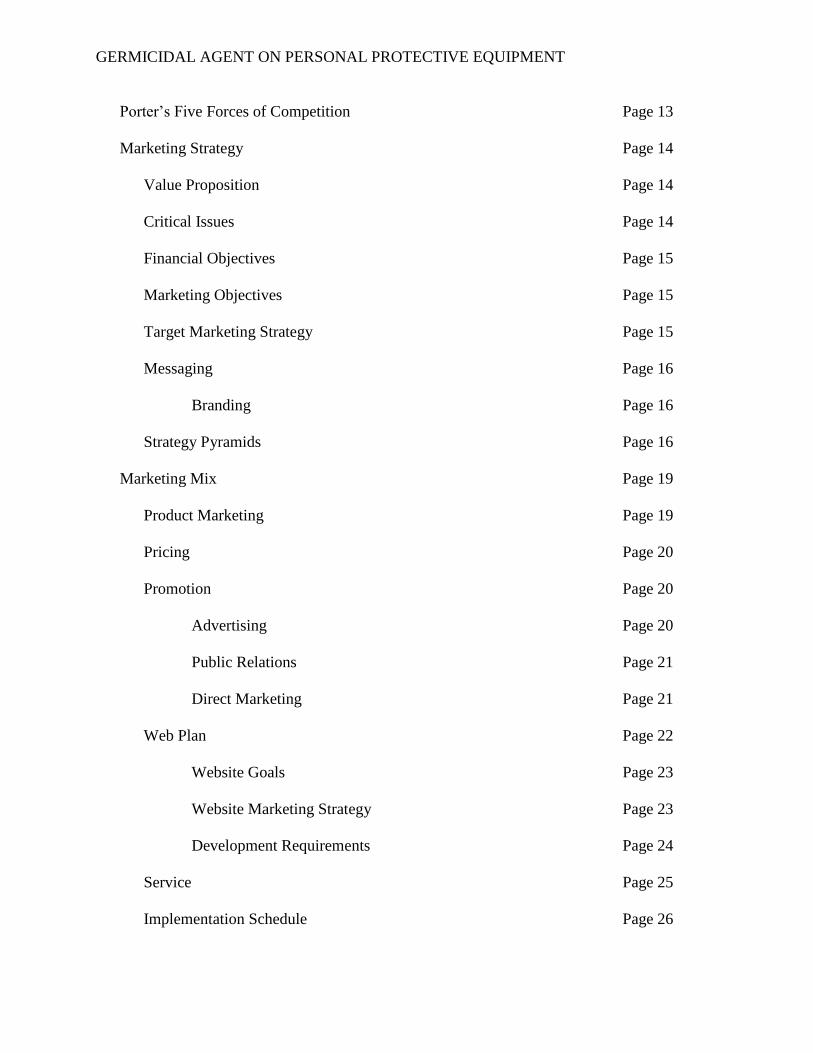
Porter’s Five Forces of Competition Page 13
Marketing Strategy Page 14
Value Proposition Page 14
Critical Issues Page 14
Financial Objectives Page 15
Marketing Objectives Page 15
Target Marketing Strategy Page 15
Messaging Page 16
Branding Page 16
Strategy Pyramids Page 16
Marketing Mix Page 19
Product Marketing Page 19
Pricing Page 20
Promotion Page 20
Advertising Page 20
Public Relations Page 21
Direct Marketing Page 21
Web Plan Page 22
Website Goals Page 23
Website Marketing Strategy Page 23
Development Requirements Page 24
Service Page 25
Implementation Schedule Page 26
GERMICIDAL AGENT ON PERSONAL PROTECTIVE EQUIPMENT
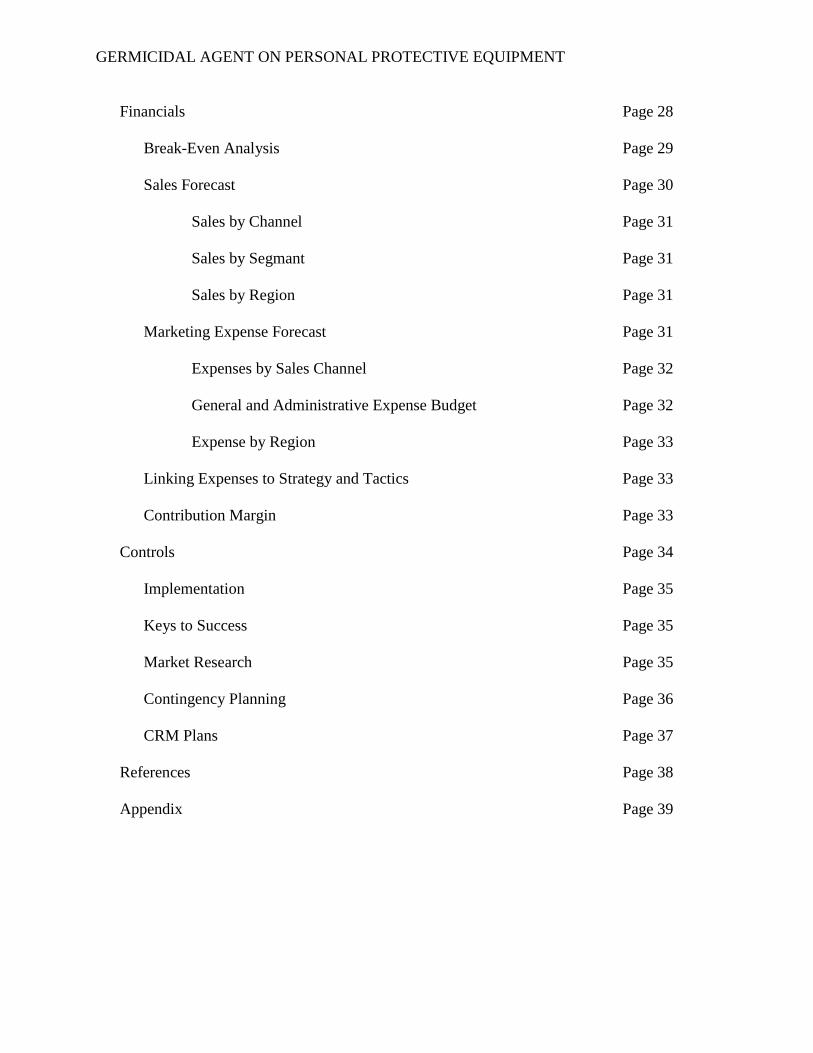
Financials Page 28
Break-Even Analysis Page 29
Sales Forecast Page 30
Sales by Channel Page 31
Sales by Segmant Page 31
Sales by Region Page 31
Marketing Expense Forecast Page 31
Expenses by Sales Channel Page 32
General and Administrative Expense Budget Page 32
Expense by Region Page 33
Linking Expenses to Strategy and Tactics Page 33
Contribution Margin Page 33
Controls Page 34
Implementation Page 35
Keys to Success Page 35
Market Research Page 35
Contingency Planning Page 36
CRM Plans Page 37
References Page 38
Appendix Page 39
GERMICIDAL AGENT ON PERSONAL PROTECTIVE EQUIPMENT
1.0 Executive Summary
LifeProtect is a new biomedical company that has introduced and launched advanced
personal protective equipment in Q4 of 2014. Through its own research and development,
LifeProtect introduced a dry germicidal agent that will be placed on the outside layering of the
Personal Protective Equipment (PPE). This proprietary agent has proven to kill germs and
bacteria on contact, and will assist in reducing the transmission and growth rate of infectious
diseases.
With a mission to serve and provide the highest degree of care to our healthcare industry,
as well as our military, LifeProtect offers varying bundles of masks, gowns, gloves, and shoe
coverings. Focused on highly concentrated geographic locations within the United States that
experience high rates of infection, this product will initially be offered through its new online
retail store. LifeProtect’s online retail store offers a simplified shopping-cart experience that will
allow consumers to take advantage of volume discounts at quantities at or above 250 units.
LifeProtect also understands the importance of exceptional customer service and the products
offered are 100% guaranteed, backed by a product liability insurance policy.
Targeting a total of 2,600 hospitals and military bases in 17 states, multiple channels will
be utilized to reach the target market. These channels include occupational health trade shows,
online advertisements, direct mail, medical publications, and public relations. Each form of
advertisement will provide rich information regarding the product, with trade shows and expos
allowing consumers to see, touch and try on the PPE offered.
GERMICIDAL AGENT ON PERSONAL PROTECTIVE EQUIPMENT
Market research has indicated the growing rates of infections within hospitals and society
is subject to uncontrollable epidemics and pandemics. LifeProtect’s objectives are to curb
infections, protect the lives of caregivers and patients, as well as to reduce fear and instill peace.
LifeProtect has conducted a thorough financial analysis and has established metrics in
place to monitor its performance. A sound marketing and advertising strategy is in place and
financial goals have been established for the next three years. With a dedicated team of
professionals and desire to improve the lives of others, LifeProtect is 100% invested in the
product and service offered.
2.0 Situational Analysis
The medical industry, morticians, and the military experience high rates of infection every
day; therefore the market need is Personal Protective Equipment (PPE) with a chemical covering
that will kill infection on contact. This will further reduce the transfer rate of bacteria and
airborne particles. The Occupational Safety and Health Association (2003) defined PPE as
equipment worn to minimize exposure to a variety of hazards. Examples of PPE include such
items as gloves, foot and eye protection, protective hearing devices, hard hats, respirators, and
full body suits (“Personal Protective Equipment,” n.d.).
Understanding the market need, LifeProtect, a new company has emerged. LifeProtect
has developed and will launch a full-body protective suit with proprietary chemical. These
chemicals will fight and kill infection on contact. LifeProtect will offer their product directly to
those industries that battle with high infection rates on a daily basis.
GERMICIDAL AGENT ON PERSONAL PROTECTIVE EQUIPMENT
5.0 Financials
LifeProtect, LLC commenced business operations during Q4 2014 on receipt of $575,000
unsecured loan, repayable over 7 years at 16% interest. LifeProtect leases 8,000 sq ft of
warehouse and office space in Hilliard, Ohio. LifeProtect has acquired inventory, fixtures,
communications technologies and materials management equipment to fulfil 2015 marketing,
sales and operational goals and has developed a 5 year infrastructure expansion plan to
accommodate forecasted growth.
During Q4 2014, LifeProtect’s six owners temporarily performed various business
activities including:
Recruiting and hiring of marketing, sales and operational leadership,
Website launch,
Supplier relationship development,
Oversight of facility enhancements, and
Brand development and targeted marketing refinements.
Owners also coordinated 2015 marketing campaigns as identified in Section 4.
The 2015 goal of LifeProtect’s marketing strategy is to become the supplier of choice to
hospitals and military bases that desire proven and reliable destruction of infectious bacteria that
comes into contact with personal protective equipment. Marketing and operations strategies are
grounded on superior performance in the following areas:
100% product satisfaction guarantee,
Creating and sustaining long-term, value-added relationships with all business partners,
In-stock availability of advertised products ready for same day shipping, and
Exceptional, customer engagement and service.
GERMICIDAL AGENT ON PERSONAL PROTECTIVE EQUIPMENT
This section provides summarized financial details including break-even analyses, sales
and expense forecasts, and how these metrics link to marketing and operations strategies. Please
refer to appendix A, B and C to review Projected Income Statement, Balance Sheet and Cash
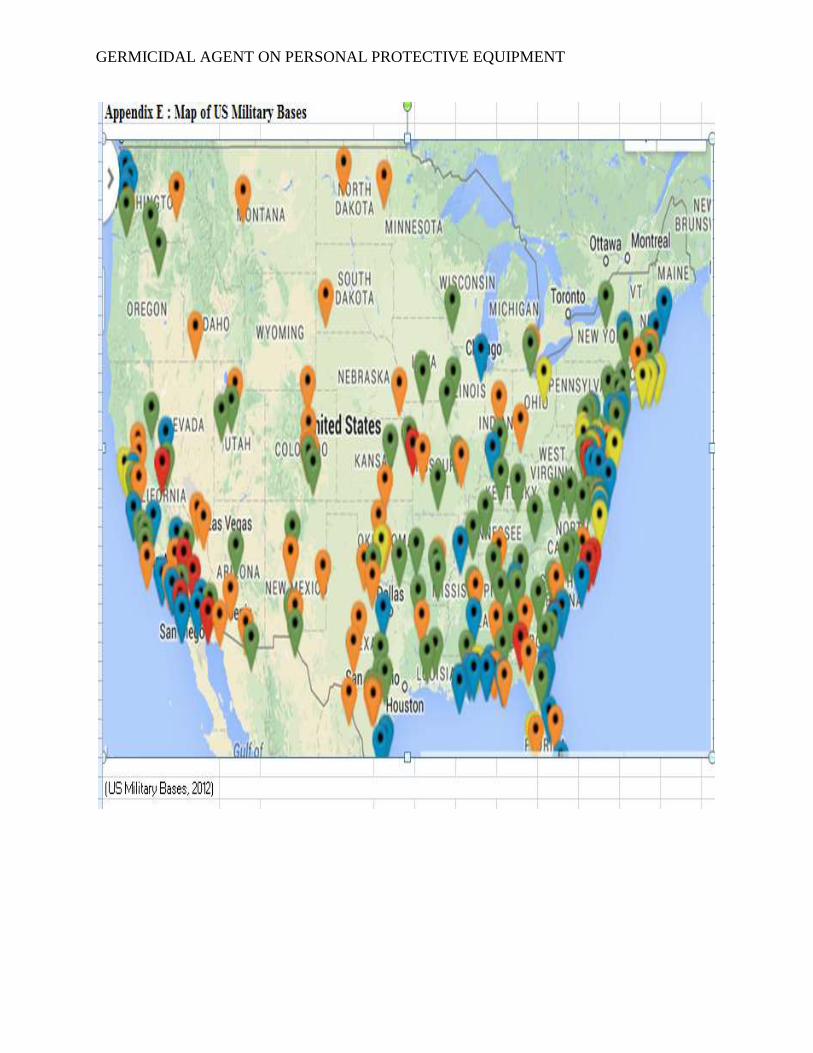
Flow Statements. Please refer to appendix D and E to review targeted customer channels by
region.
5.1 Break-Even Analyses
During 2015, hospital and military customers will purchase at least four PPE items per
sales transaction (such as: mask, gown, gloves and shoe covering) equaling an average sale of
$1600. During the 2015 start-up year, contracted bulk sourcing cost are calculated at $900 with
additional processing cost of $100 per sale (application of germicide) creating an average gross
sales margin of 37.50% and yielding a net profit margin of 16.73%. (Appendix A: Projected
Income Statement)
The break-even analysis below illustrates the sales volume and number of average sales
transactions LifeProtect must realize in 2015 to break even:
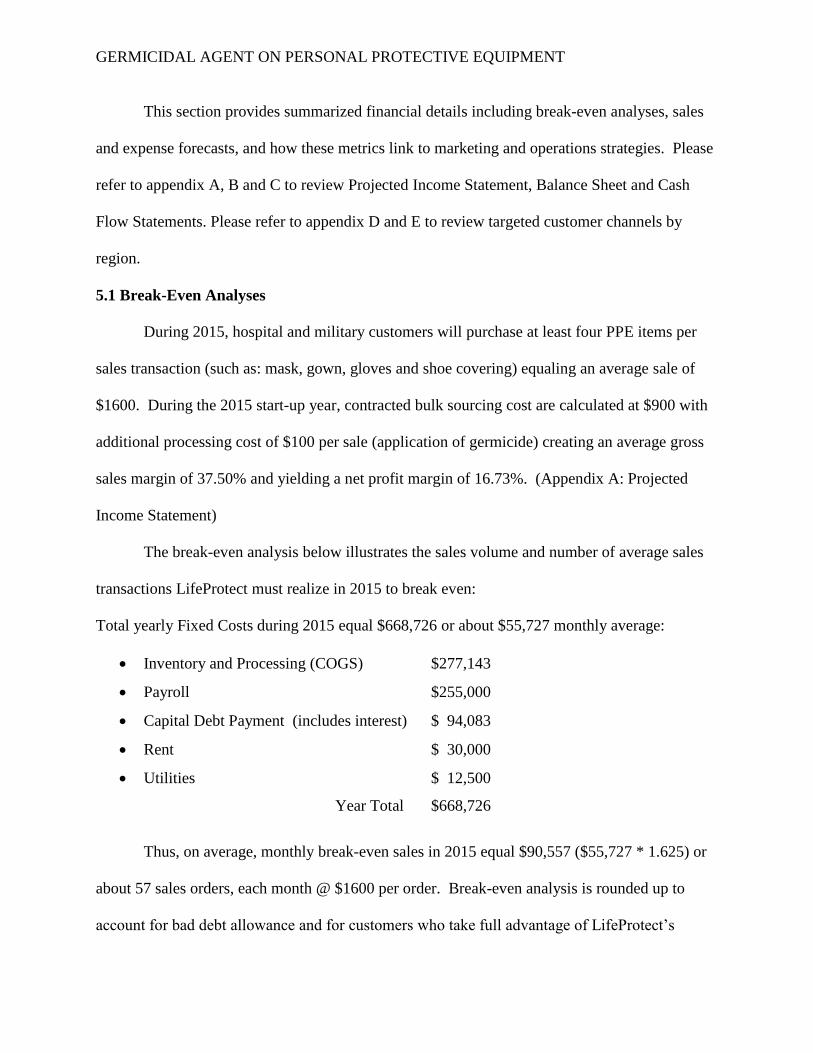
Total yearly Fixed Costs during 2015 equal $668,726 or about $55,727 monthly average:
Inventory and Processing (COGS) $277,143
Payroll $255,000
Capital Debt Payment (includes interest) $ 94,083
Rent $ 30,000
Utilities $ 12,500
Year Total $668,726
Thus, on average, monthly break-even sales in 2015 equal $90,557 ($55,727 * 1.625) or
about 57 sales orders, each month @ $1600 per order. Break-even analysis is rounded up to
account for bad debt allowance and for customers who take full advantage of LifeProtect’s
GERMICIDAL AGENT ON PERSONAL PROTECTIVE EQUIPMENT
market penetrating financing terms of 2% net 15 days as well as 5% discounts for orders in
excess of $5,000.
LifeProtect has targeted 2600 hospitals in 17 states (Appendix D: Targeted Hospitals by
State) to meet sales goals. Totalize forecasted sales to military bases located within the 17
targeted states and surpassing the break-even goal is highly achievable.
5.2 Sales Forecast
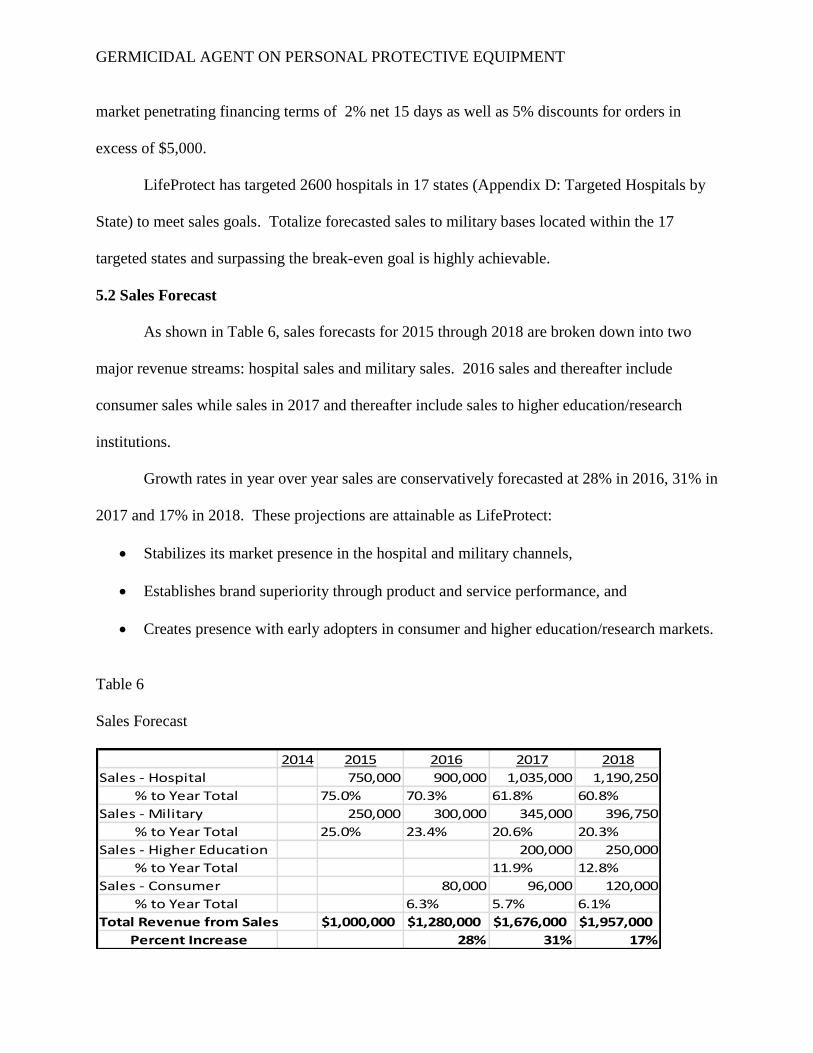
As shown in Table 6, sales forecasts for 2015 through 2018 are broken down into two
major revenue streams: hospital sales and military sales. 2016 sales and thereafter include
consumer sales while sales in 2017 and thereafter include sales to higher education/research
institutions.
Growth rates in year over year sales are conservatively forecasted at 28% in 2016, 31% in
2017 and 17% in 2018. These projections are attainable as LifeProtect:
Stabilizes its market presence in the hospital and military channels,
Establishes brand superiority through product and service performance, and
Creates presence with early adopters in consumer and higher education/research markets.
Table 6
Sales Forecast
2014 2015 2016 2017 2018
Sales - Hospital 750,000 900,000 1,035,000 1,190,250
% to Year Total 75.0% 70.3% 61.8% 60.8%
Sales - Military 250,000 300,000 345,000 396,750
% to Year Total 25.0% 23.4% 20.6% 20.3%
Sales - Higher Education 200,000 250,000
% to Year Total 11.9% 12.8%
Sales - Consumer 80,000 96,000 120,000
% to Year Total 6.3% 5.7% 6.1%
Total Revenue from Sales $1,000,000 $1,280,000 $1,676,000 $1,957,000
Percent Increase 28% 31% 17%
GERMICIDAL AGENT ON PERSONAL PROTECTIVE EQUIPMENT
5.2.1 Sales by Channel.
As shown in Table 6, during 2015, hospital sales account for 75% with military sales
accounting for the remainder. Starting in 2016, consumer sales will account for 6.3% of total
sales and in 2017, higher education/research sales will account for 11.9% of total sales.
5.2.2 Sales by Segment.
All sales in 2015 will transact through LifeProtect’s customer friendly website.
5.2.3 Sales by Region.
2015 marketing is targeted into sales regions apportioned geographically and only
include states with at least100 hospitals and/or states with aggregate hospital revenue in excess
of $50 Billion. (Appendix D: Targeted Hospitals by State) Strategies to geographically target
military bases through appropriated fiscal support will be of similar accord.
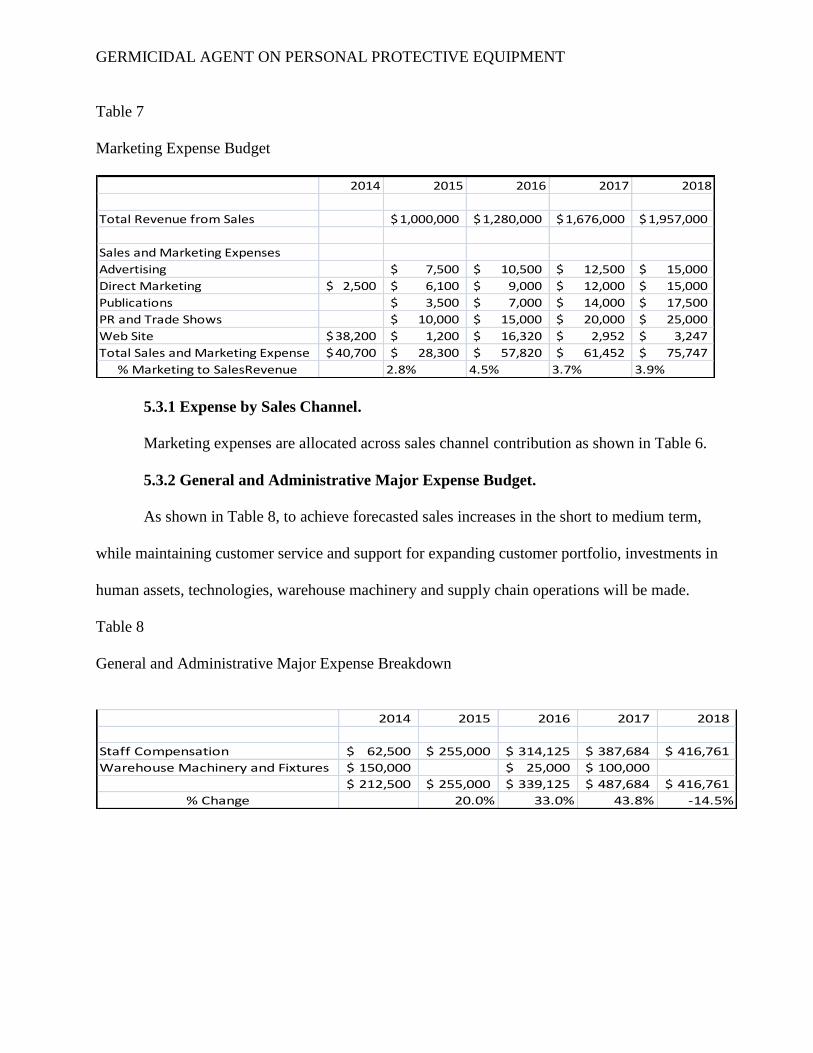
5.3 Marketing Expense Forecast
As shown in Table 7, 2015 marketing expenses are budgeted at 2.8% of total sales due to
initial web site development costs appropriated in 2014. 2016 website enhancements to support
growth and expansion strategies increase the marketing budget to 4.5% of total sales and once
enhancement costs are unencumbered, marketing expenses regress to near 4% of total sales in
2018. Expenses are tracked in the major marketing categories of general advertising, direct
marketing, publications, public relations, trade shows and web marketing/site management.
GERMICIDAL AGENT ON PERSONAL PROTECTIVE EQUIPMENT
Table 7
Marketing Expense Budget
2014 2015 2016 2017 2018
Total Revenue from Sales 1,000,000$ 1,280,000$ 1,676,000$ 1,957,000$
Sales and Marketing Expenses
Advertising 7,500$ 10,500$ 12,500$ 15,000$
Direct Marketing 2,500$ 6,100$ 9,000$ 12,000$ 15,000$
Publications 3,500$ 7,000$ 14,000$ 17,500$
PR and Trade Shows 10,000$ 15,000$ 20,000$ 25,000$
Web Site 38,200$ 1,200$ 16,320$ 2,952$ 3,247$
Total Sales and Marketing Expense 40,700$ 28,300$ 57,820$ 61,452$ 75,747$
% Marketing to SalesRevenue 2.8% 4.5% 3.7% 3.9%
5.3.1 Expense by Sales Channel.
Marketing expenses are allocated across sales channel contribution as shown in Table 6.
5.3.2 General and Administrative Major Expense Budget.
As shown in Table 8, to achieve forecasted sales increases in the short to medium term,
while maintaining customer service and support for expanding customer portfolio, investments in
human assets, technologies, warehouse machinery and supply chain operations will be made.
Table 8
General and Administrative Major Expense Breakdown
2014 2015 2016 2017 2018
Staff Compensation 62,500$ 255,000$ 314,125$ 387,684$ 416,761$
Warehouse Machinery and Fixtures 150,000$ 25,000$ 100,000$
212,500$ 255,000$ 339,125$ 487,684$ 416,761$
% Change 20.0% 33.0% 43.8% -14.5%
GERMICIDAL AGENT ON PERSONAL PROTECTIVE EQUIPMENT
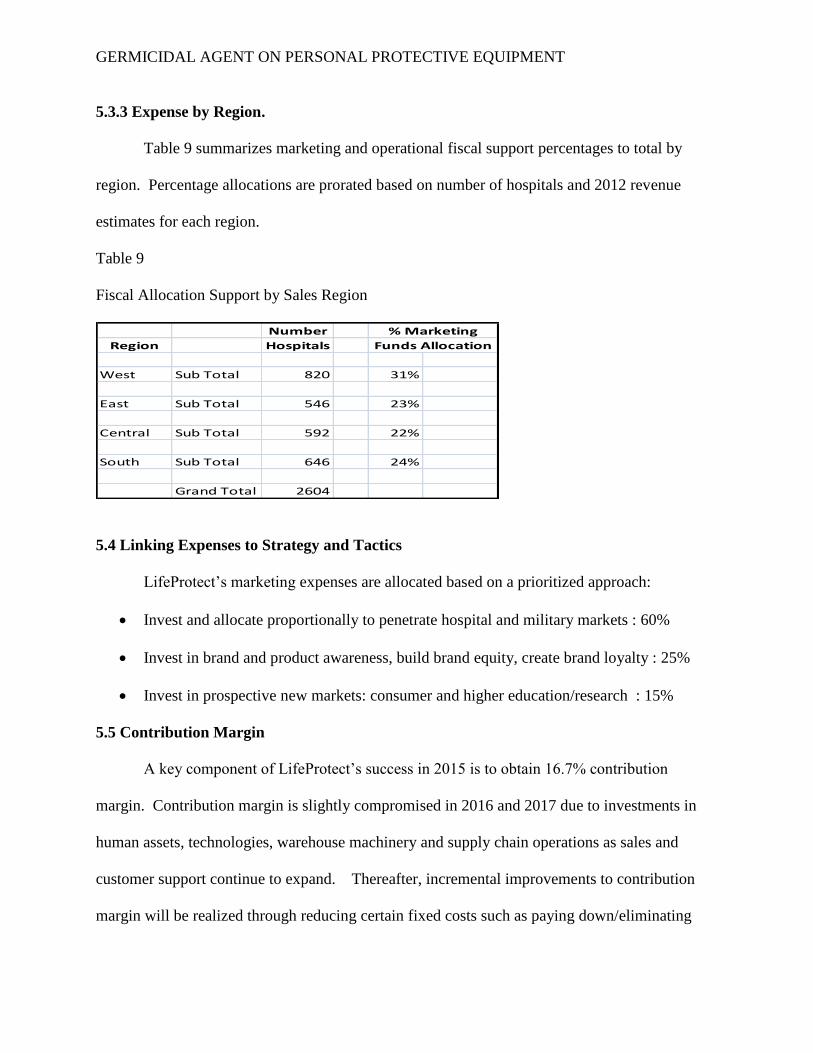
5.3.3 Expense by Region.
Table 9 summarizes marketing and operational fiscal support percentages to total by
region. Percentage allocations are prorated based on number of hospitals and 2012 revenue
estimates for each region.
Table 9
Fiscal Allocation Support by Sales Region
Number
Region Hospitals
West Sub Total 820 31%
East Sub Total 546 23%
Central Sub Total 592 22%
South Sub Total 646 24%
Grand Total 2604
% Marketing
Funds Allocation
5.4 Linking Expenses to Strategy and Tactics
LifeProtect’s marketing expenses are allocated based on a prioritized approach:
Invest and allocate proportionally to penetrate hospital and military markets : 60%
Invest in brand and product awareness, build brand equity, create brand loyalty : 25%
Invest in prospective new markets: consumer and higher education/research : 15%
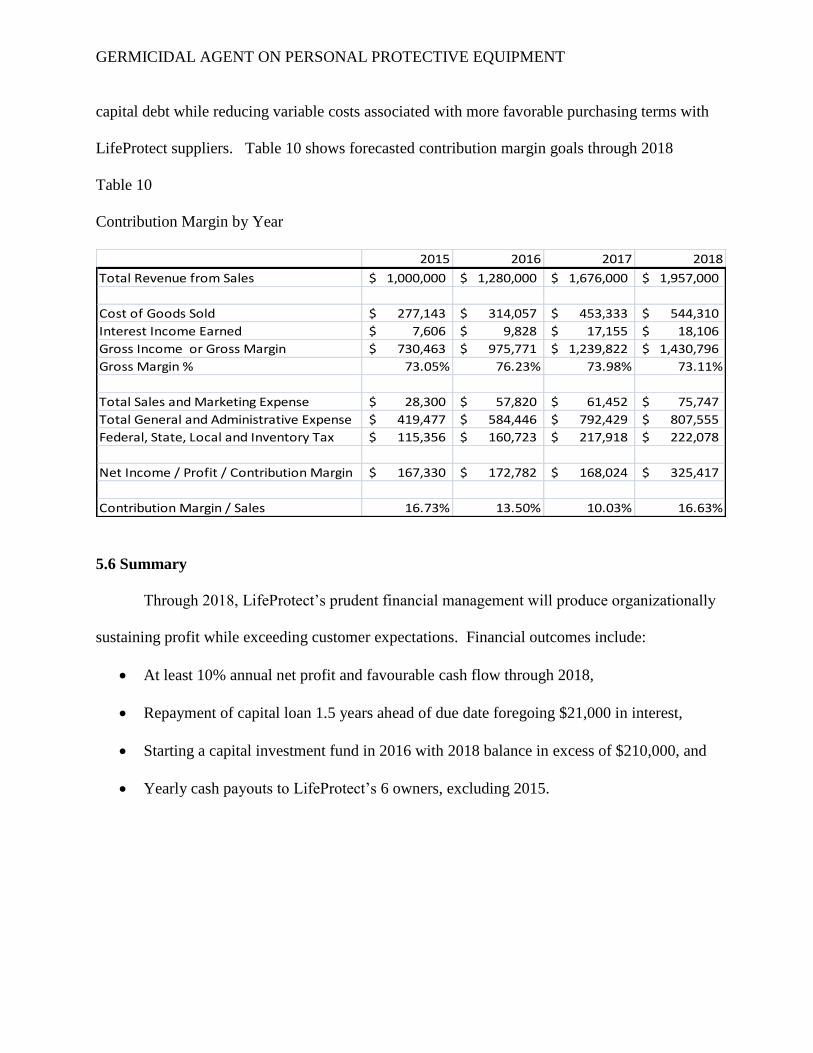
5.5 Contribution Margin
A key component of LifeProtect’s success in 2015 is to obtain 16.7% contribution
margin. Contribution margin is slightly compromised in 2016 and 2017 due to investments in
human assets, technologies, warehouse machinery and supply chain operations as sales and
customer support continue to expand. Thereafter, incremental improvements to contribution
margin will be realized through reducing certain fixed costs such as paying down/eliminating
GERMICIDAL AGENT ON PERSONAL PROTECTIVE EQUIPMENT
capital debt while reducing variable costs associated with more favorable purchasing terms with
LifeProtect suppliers. Table 10 shows forecasted contribution margin goals through 2018
Table 10
Contribution Margin by Year
2015 2016 2017 2018
Total Revenue from Sales 1,000,000$ 1,280,000$ 1,676,000$ 1,957,000$
Cost of Goods Sold 277,143$ 314,057$ 453,333$ 544,310$
Interest Income Earned 7,606$ 9,828$ 17,155$ 18,106$
Gross Income or Gross Margin 730,463$ 975,771$ 1,239,822$ 1,430,796$
Gross Margin % 73.05% 76.23% 73.98% 73.11%
Total Sales and Marketing Expense 28,300$ 57,820$ 61,452$ 75,747$
Total General and Administrative Expense 419,477$ 584,446$ 792,429$ 807,555$
Federal, State, Local and Inventory Tax 115,356$ 160,723$ 217,918$ 222,078$
Net Income / Profit / Contribution Margin 167,330$ 172,782$ 168,024$ 325,417$
Contribution Margin / Sales 16.73% 13.50% 10.03% 16.63%
5.6 Summary
Through 2018, LifeProtect’s prudent financial management will produce organizationally
sustaining profit while exceeding customer expectations. Financial outcomes include:
At least 10% annual net profit and favourable cash flow through 2018,
Repayment of capital loan 1.5 years ahead of due date foregoing $21,000 in interest,
Starting a capital investment fund in 2016 with 2018 balance in excess of $210,000, and
Yearly cash payouts to LifeProtect’s 6 owners, excluding 2015.
GERMICIDAL AGENT ON PERSONAL PROTECTIVE EQUIPMENT
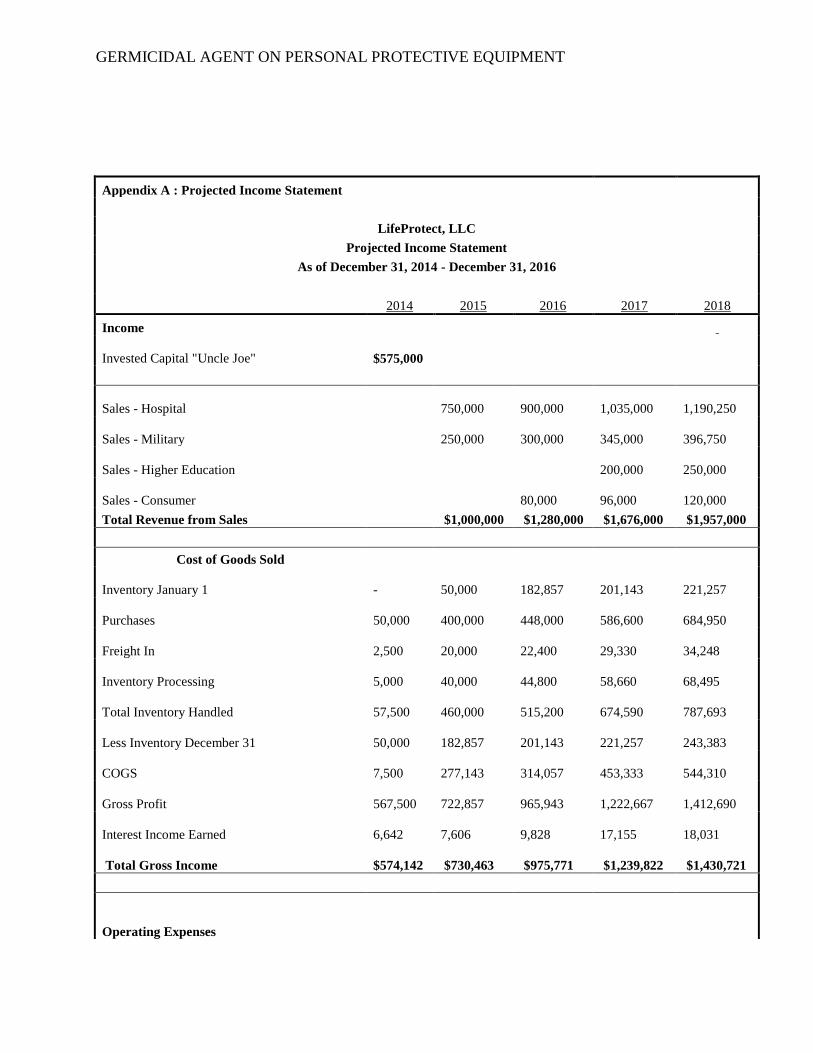
Appendix A : Projected Income Statement
LifeProtect, LLC
Projected Income Statement
As of December 31, 2014 - December 31, 2016
2014 2015 2016 2017 2018
Income
Invested Capital "Uncle Joe"
$575,000
Sales - Hospital
750,000
900,000
1,035,000
1,190,250
Sales - Military
250,000
300,000
345,000
396,750
Sales - Higher Education
200,000
250,000
Sales - Consumer
80,000
96,000
120,000
Total Revenue from Sales $1,000,000 $1,280,000 $1,676,000 $1,957,000
Cost of Goods Sold
Inventory January 1
-
50,000
182,857
201,143
221,257
Purchases
50,000
400,000
448,000
586,600
684,950
Freight In
2,500
20,000
22,400
29,330
34,248
Inventory Processing
5,000
40,000
44,800
58,660
68,495
Total Inventory Handled
57,500
460,000
515,200
674,590
787,693
Less Inventory December 31
50,000
182,857
201,143
221,257
243,383
COGS
7,500
277,143
314,057
453,333
544,310
Gross Profit
567,500
722,857
965,943
1,222,667
1,412,690
Interest Income Earned
6,642
7,606
9,828
17,155
18,031
Total Gross Income
$574,142 $730,463 $975,771 $1,239,822 $1,430,721
Operating Expenses
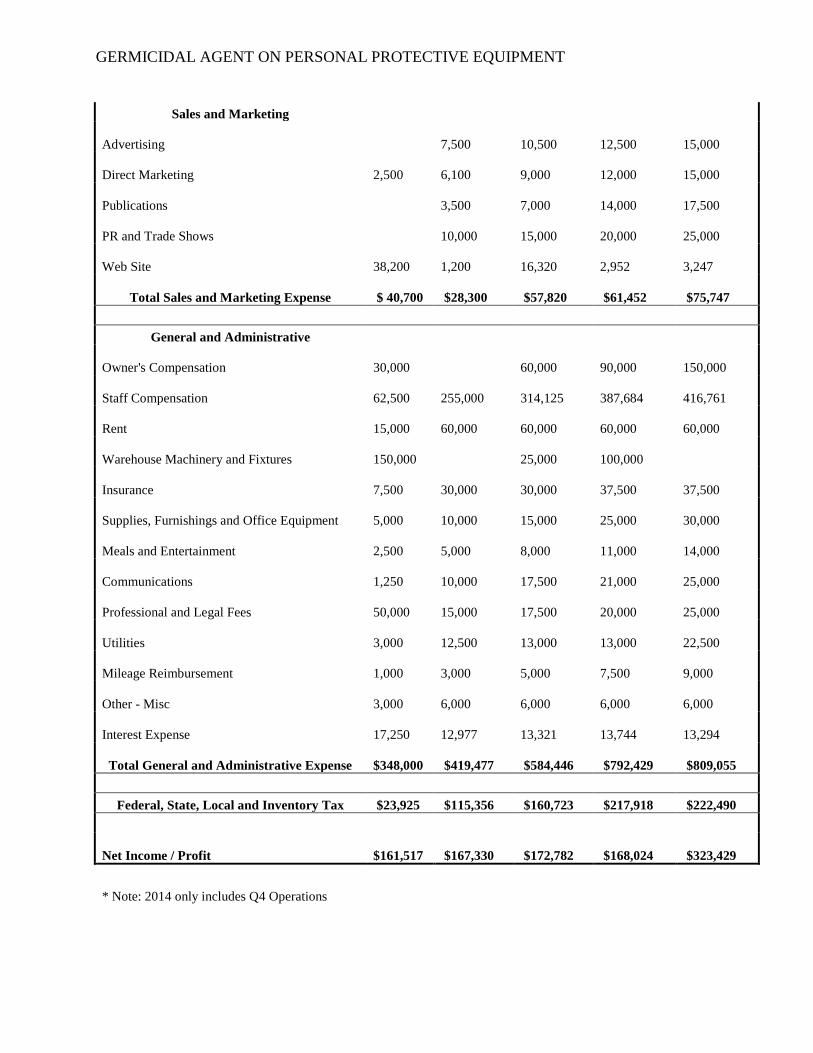
GERMICIDAL AGENT ON PERSONAL PROTECTIVE EQUIPMENT
Sales and Marketing
Advertising
7,500
10,500
12,500
15,000
Direct Marketing
2,500
6,100
9,000
12,000
15,000
Publications
3,500
7,000
14,000
17,500
PR and Trade Shows
10,000
15,000
20,000
25,000
Web Site
38,200
1,200
16,320
2,952
3,247
Total Sales and Marketing Expense $ 40,700 $28,300 $57,820 $61,452 $75,747
General and Administrative
Owner's Compensation
30,000
60,000
90,000
150,000
Staff Compensation
62,500
255,000
314,125
387,684
416,761
Rent
15,000
60,000
60,000
60,000
60,000
Warehouse Machinery and Fixtures
150,000
25,000
100,000
Insurance
7,500
30,000
30,000
37,500
37,500
Supplies, Furnishings and Office Equipment
5,000
10,000
15,000
25,000
30,000
Meals and Entertainment
2,500
5,000
8,000
11,000
14,000
Communications
1,250
10,000
17,500
21,000
25,000
Professional and Legal Fees
50,000
15,000
17,500
20,000
25,000
Utilities
3,000
12,500
13,000
13,000
22,500
Mileage Reimbursement
1,000
3,000
5,000
7,500
9,000
Other - Misc
3,000
6,000
6,000
6,000
6,000
Interest Expense
17,250
12,977
13,321
13,744
13,294
Total General and Administrative Expense
$348,000 $419,477 $584,446 $792,429 $809,055
Federal, State, Local and Inventory Tax $23,925 $115,356 $160,723 $217,918 $222,490
Net Income / Profit
$161,517 $167,330 $172,782 $168,024 $323,429
* Note: 2014 only includes Q4 Operations
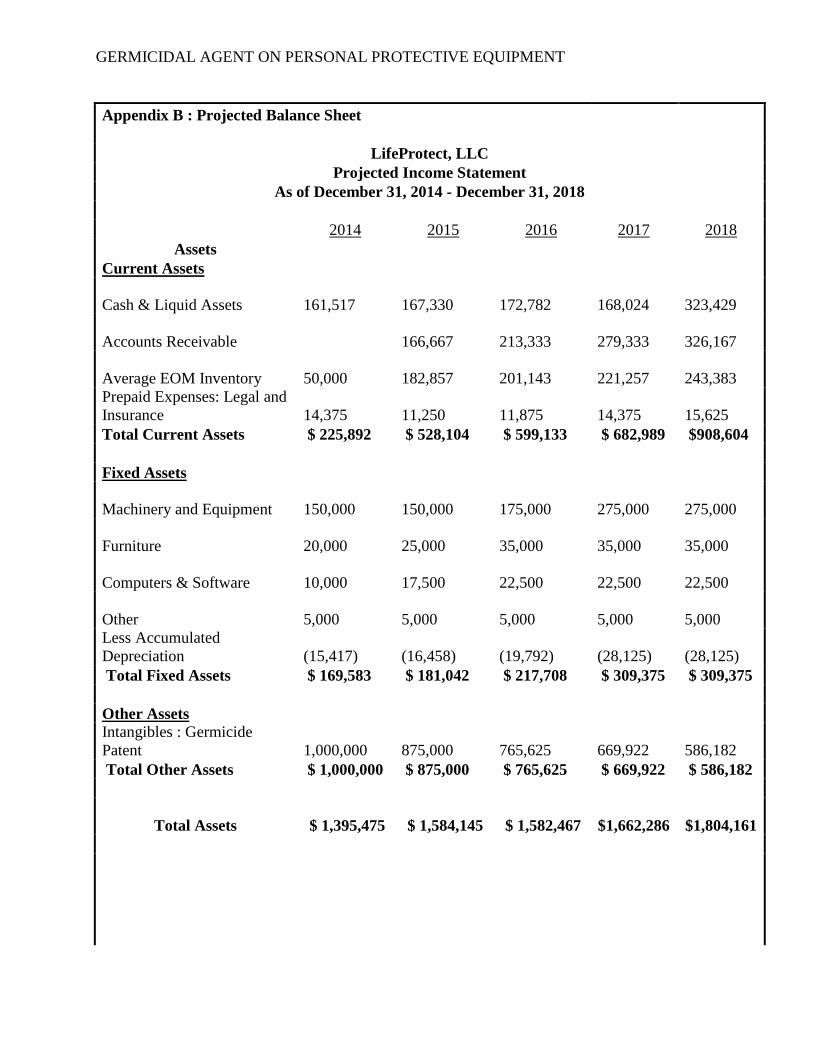
GERMICIDAL AGENT ON PERSONAL PROTECTIVE EQUIPMENT
Appendix B : Projected Balance Sheet
LifeProtect, LLC
Projected Income Statement
As of December 31, 2014 - December 31, 2018
2014 2015 2016 2017 2018
Assets
Current Assets
Cash & Liquid Assets
161,517
167,330
172,782
168,024
323,429
Accounts Receivable
166,667
213,333
279,333
326,167
Average EOM Inventory
50,000
182,857
201,143
221,257
243,383
Prepaid Expenses: Legal and
Insurance
14,375
11,250
11,875
14,375
15,625
Total Current Assets $ 225,892 $ 528,104 $ 599,133 $ 682,989 $908,604
Fixed Assets
Machinery and Equipment
150,000
150,000
175,000
275,000
275,000
Furniture
20,000
25,000
35,000
35,000
35,000
Computers & Software
10,000
17,500
22,500
22,500
22,500
Other
5,000
5,000
5,000
5,000
5,000
Less Accumulated
Depreciation
(15,417)
(16,458)
(19,792)
(28,125)
(28,125)
Total Fixed Assets $ 169,583 $ 181,042 $ 217,708 $ 309,375 $ 309,375
Other Assets
Intangibles : Germicide
Patent
1,000,000
875,000
765,625
669,922
586,182
Total Other Assets $ 1,000,000 $ 875,000 $ 765,625 $ 669,922 $ 586,182
Total Assets $ 1,395,475 $ 1,584,145 $ 1,582,467
$1,662,286
$1,804,161
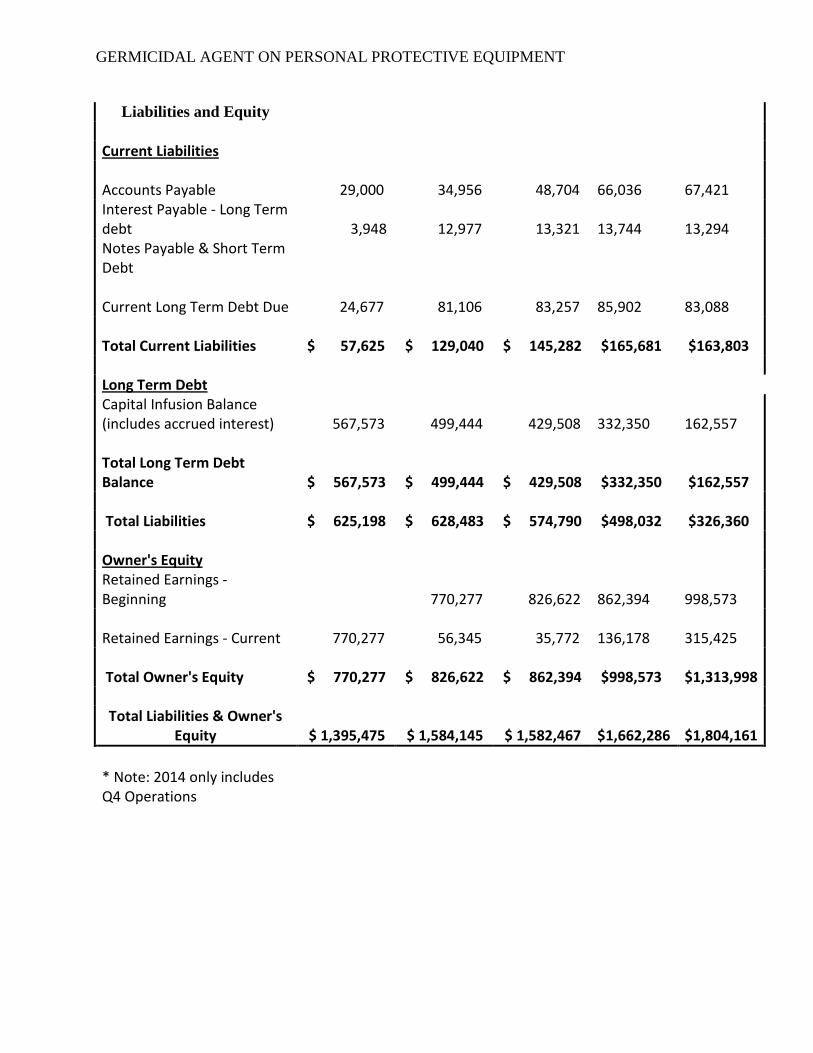
GERMICIDAL AGENT ON PERSONAL PROTECTIVE EQUIPMENT
Liabilities and Equity
Current Liabilities
Accounts Payable 29,000 34,956 48,704 66,036
67,421
Interest Payable - Long Term debt 3,948 12,977 13,321
13,744
13,294
Notes Payable & Short Term Debt
Current Long Term Debt Due 24,677 81,106 83,257 85,902
83,088
Total Current Liabilities $ 57,625 $ 129,040 $ 145,282 $165,681 $163,803
Long Term Debt Capital Infusion Balance
(includes accrued interest) 567,573 499,444 429,508 332,350
162,557
Total Long Term Debt Balance $ 567,573 $ 499,444 $ 429,508 $332,350 $162,557
Total Liabilities $ 625,198 $ 628,483 $ 574,790 $498,032 $326,360
Owner's Equity
Retained Earnings - Beginning
770,277 826,622
862,394
998,573
Retained Earnings - Current 770,277 56,345 35,772 136,178
315,425
Total Owner's Equity $ 770,277 $ 826,622 $ 862,394 $998,573 $1,313,998
Total Liabilities & Owner's
Equity $ 1,395,475 $ 1,584,145 $ 1,582,467
$1,662,286
$1,804,161
* Note: 2014 only includes Q4 Operations
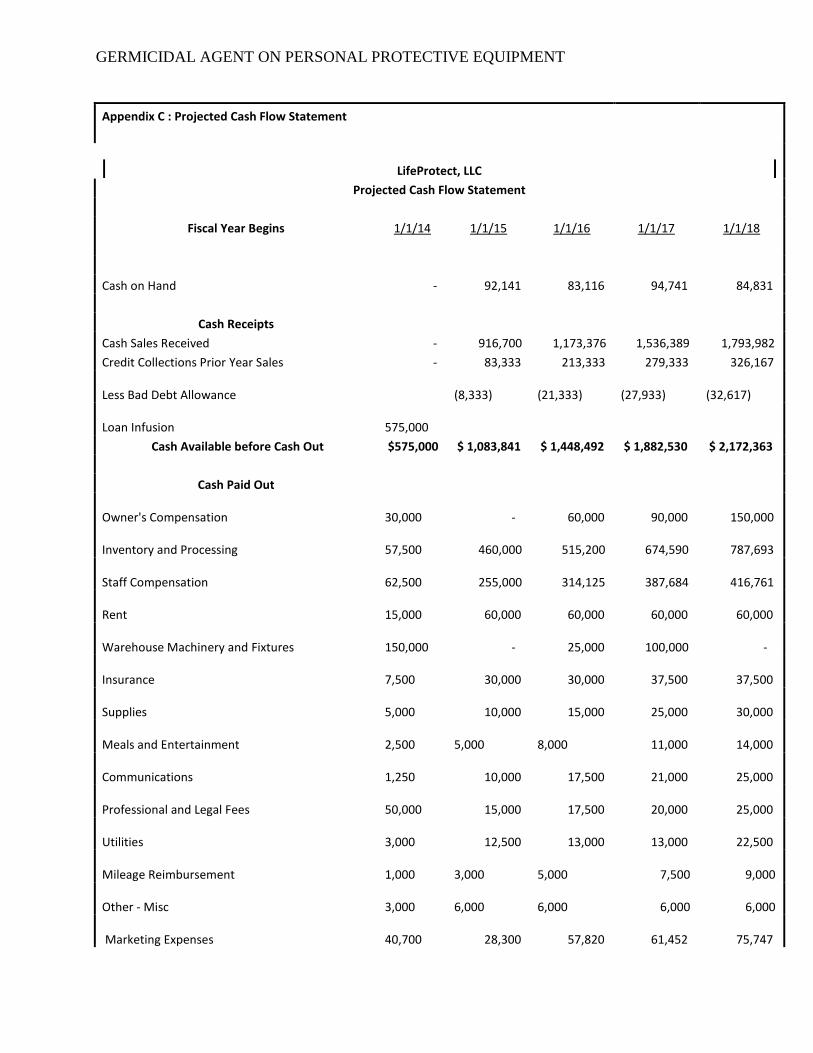
GERMICIDAL AGENT ON PERSONAL PROTECTIVE EQUIPMENT
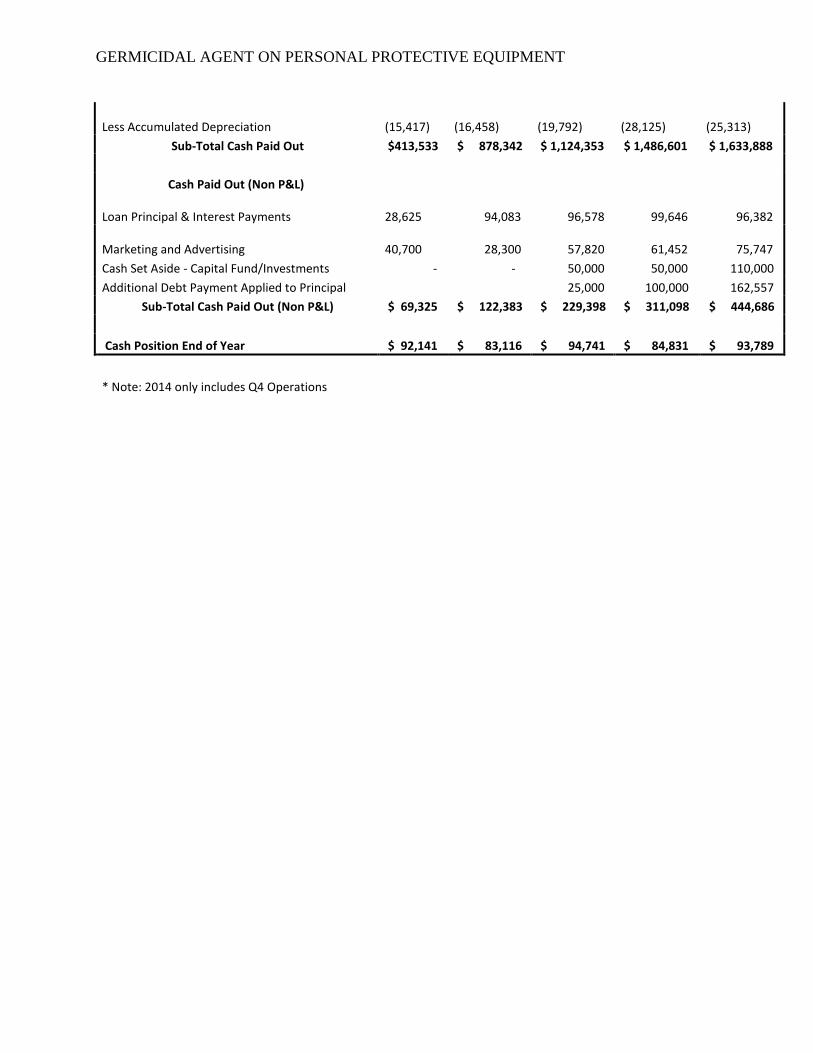
Appendix C : Projected Cash Flow Statement
LifeProtect, LLC
Projected Cash Flow Statement
Fiscal Year Begins 1/1/14 1/1/15 1/1/16 1/1/17 1/1/18
Cash on Hand - 92,141 83,116 94,741 84,831
Cash Receipts
Cash Sales Received - 916,700 1,173,376 1,536,389 1,793,982
Credit Collections Prior Year Sales - 83,333 213,333 279,333 326,167
Less Bad Debt Allowance
(8,333)
(21,333)
(27,933)
(32,617)
Loan Infusion 575,000
Cash Available before Cash Out $575,000 $ 1,083,841 $ 1,448,492 $ 1,882,530 $ 2,172,363
Cash Paid Out
Owner's Compensation 30,000 - 60,000 90,000 150,000
Inventory and Processing 57,500 460,000 515,200 674,590 787,693
Staff Compensation 62,500 255,000 314,125 387,684 416,761
Rent 15,000 60,000 60,000 60,000 60,000
Warehouse Machinery and Fixtures 150,000 - 25,000 100,000 -
Insurance 7,500 30,000 30,000 37,500 37,500
Supplies 5,000 10,000 15,000 25,000 30,000
Meals and Entertainment 2,500
5,000
8,000 11,000 14,000
Communications 1,250 10,000 17,500 21,000 25,000
Professional and Legal Fees 50,000 15,000 17,500 20,000 25,000
Utilities 3,000 12,500 13,000 13,000 22,500
Mileage Reimbursement 1,000
3,000
5,000 7,500 9,000
Other - Misc 3,000
6,000
6,000 6,000 6,000
Marketing Expenses 40,700 28,300 57,820 61,452 75,747
GERMICIDAL AGENT ON PERSONAL PROTECTIVE EQUIPMENT
Less Accumulated Depreciation (15,417)
(16,458)
(19,792)
(28,125)
(25,313)
Sub-Total Cash Paid Out $413,533 $ 878,342 $ 1,124,353 $ 1,486,601 $ 1,633,888
Cash Paid Out (Non P&L)
Loan Principal & Interest Payments 28,625 94,083 96,578 99,646 96,382
Marketing and Advertising 40,700 28,300 57,820 61,452 75,747
Cash Set Aside - Capital Fund/Investments - - 50,000 50,000 110,000
Additional Debt Payment Applied to Principal
25,000 100,000 162,557
Sub-Total Cash Paid Out (Non P&L) $ 69,325 $ 122,383 $ 229,398 $ 311,098 $ 444,686
Cash Position End of Year $ 92,141 $ 83,116 $ 94,741 $ 84,831 $ 93,789
* Note: 2014 only includes Q4 Operations
GERMICIDAL AGENT ON PERSONAL PROTECTIVE EQUIPMENT
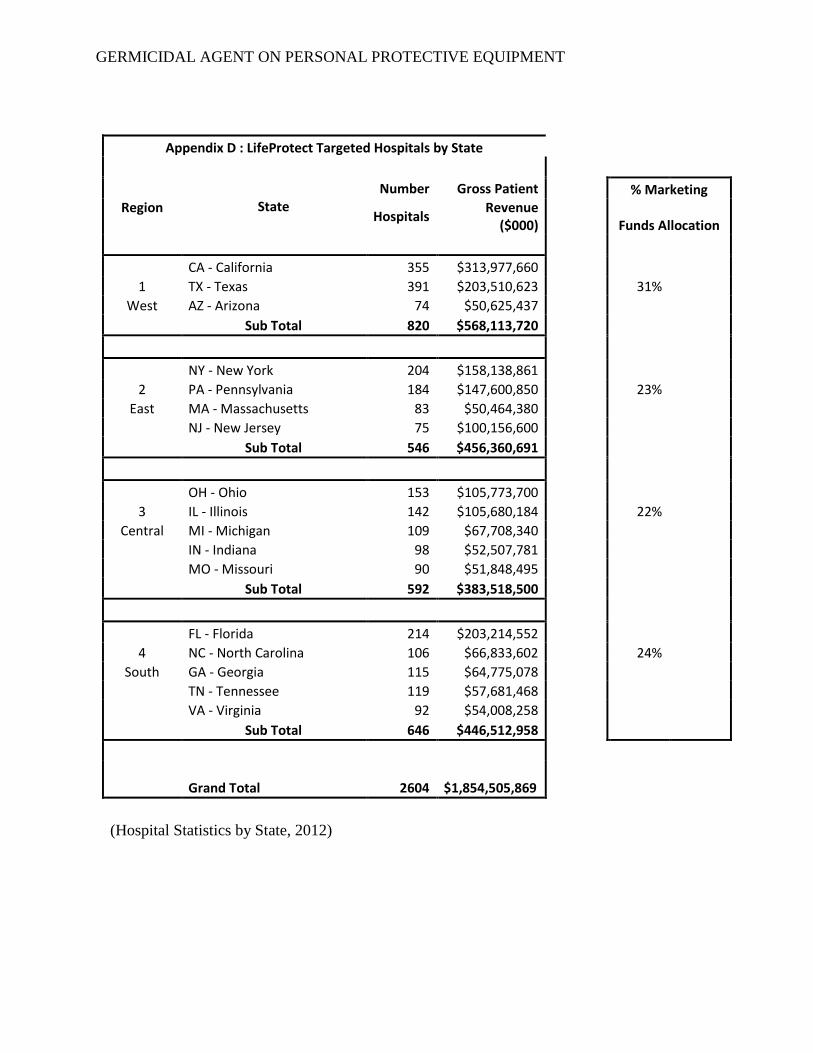
Appendix D : LifeProtect Targeted Hospitals by State
State
Number Gross Patient
% Marketing
Region Hospitals
Revenue ($000)
Funds Allocation
CA - California 355 $313,977,660
1 TX - Texas 391 $203,510,623
31%
West AZ - Arizona 74 $50,625,437
Sub Total 820 $568,113,720
NY - New York 204 $158,138,861
2 PA - Pennsylvania 184 $147,600,850
23%
East MA - Massachusetts 83 $50,464,380
NJ - New Jersey 75 $100,156,600
Sub Total 546 $456,360,691
OH - Ohio 153 $105,773,700
3 IL - Illinois 142 $105,680,184
22%
Central MI - Michigan 109 $67,708,340
IN - Indiana 98 $52,507,781
MO - Missouri 90 $51,848,495
Sub Total 592 $383,518,500
FL - Florida 214 $203,214,552
4 NC - North Carolina 106 $66,833,602
24%
South GA - Georgia 115 $64,775,078
TN - Tennessee 119 $57,681,468
VA - Virginia 92 $54,008,258
Sub Total 646 $446,512,958
Grand Total 2604 $1,854,505,869
(Hospital Statistics by State, 2012)
GERMICIDAL AGENT ON PERSONAL PROTECTIVE EQUIPMENT