Embed Size (px)
Citation preview


Life Insurance Reporting For Dummies

Agenda
Policy Liabilities – Tyson Johnston
Capital – Quanyie Tan
Value – Kirsten Flynn
Concluding Remarks – Niall Fallon
Q & A - All

Policy liabilities
Tyson Johnston

What are policy liabilities?
• Life companies have an obligation to pay claims covered under the relevant terms and conditions of the product
• Policy liabilities sit on the balance sheet so that company accounts represent the fair value of future obligations to policyholders
• Policy liabilities and profit reporting must adhere to the relevant regulatory and accounting standards
• APRA Prudential Standard LPS 340 and Australian Accounting Standards Board 1038 outline the key principles

Calculation of policy liabilities
Policy Liability • Present value of projected cash flows on
best estimate assumptions • No explicit allowance for risk margins • Can be negative
Present value of future profit margins
(PVPM)
Best estimate liabilities (BEL)
• Present value of profit margins that will be
released over the life of the policy
• A projection method is the most common method • Alternative methods can be used so long it can be demonstrated that the
principles have been met • Policy liabilities are comprised of the following components:

Profit recognition - Margin on Services (MoS) • Profit is only “known” after each policy has run-off • MoS is a financial reporting methodology used for life insurance contracts in
Australia • The objective of MoS is to recognise (planned) profits in line with the service
provided to policyholders • Zero profit at inception (provided not loss making), followed by smooth emergence
of profit
(120) (100)
(80) (60) (40) (20)
- 20 40
1 2 3 4 5 6 7 8 9 10Nominal cashflow
Planned profit

Cashflow Year 1 Year 2 Year 3 Year 4 Year 5 ... Present Value @ 4%
Premium -100 -91 -82 -74 -67 ... -812
Acquisition Expense 140 0 0 0 0 ... 140
Maintenance Expense 7 6 6 5 5 ... 57
Claims 62 56 51 46 42 ... 500
BEL -115
PVPM 115
Profit Margin 23%
Planned Profit 14 13 12 11 10 ...
• At inception, BEL is calculated to give the expected value of future profits, by setting the policy liability to equal zero
• Profits are expressed as a % of the profit carrier (claims in this example) • Planned profit in each future year is equal to profit carrier times profit margin
Example – policy liabilities at inception

Assumptions cycle
Analysis of product experience vs old assumptions
Update policy liability based on new assumptions
Analysis of profit Set new
assumptions
Non economic assumptions will be updated only if there is sufficient evidence of a longer term trend in experience that invalidates the previous assumption
Non economic assumptions are usually analysed over a period of five years or so

Assumption changes
• Changes to the economic assumptions directly impact the value of Policy Liabilities • For some products (e.g. annuities) this movement may be offset by movements
in asset values. • For life risk products, this movement goes directly to P&L.
• Changes to other assumptions do not impact the value of Policy Liabilities, unless products are loss making • Impacts are absorbed by changing the PVPM, in turn affecting future planned
profits. • If PVPM is reduced to zero, the product enters Loss Recognition, and further
impacts of assumption changes directly impact the P&L.

Policy Liability
Total Policy Liability not impacted by change in non economic assumption
PVPM reduced to reflect increase in BEL
BEL (new assumptions)
PVPM (old assumptions)
BEL (old assumptions)
Assumption changes – non-economic • In this example assumptions are strengthened:
• BEL increases • PVPM reduces such that total policy liability is unchanged

Loss recognition = BEL (new) – Policy liability (old)
BEL (new assumptions)
Assumption changes – loss recognition • In this example assumptions are strengthened:
• BEL increases by more than the value of old PVPM • PVPM is reduced to 0 and loss must be capitalised immediately • Policy liability (new) = BEL (new)
PVPM (old assumptions)
BEL (old assumptions)
Policy Liability
Loss recognition

Other complications
• This presentation focuses on policy liabilities for individual risk business only. Other products have a different treatment, for example: • Investment products, such as unit linked or term certain annuities • Traditional business, including participating and non-participating • Group risk business
• The calculation is easy compared to checking the results! • A new international accounting standard is expected to be
issued during 2016 and this will change how policy liabilities are required to be calculated

Capital Reporting
Quanyie Tan

What is Capital (under LAGIC)?
Excerpt from Prudential Standards LPS 110
“The prescribed capital amount of a fund determined under the Standard Method is intended to be sufficient, such that if a fund was to start the year with a capital base equal to the prescribed capital amount, and losses occurred at the 99.5 per cent confidence level then the assets remaining would be at least sufficient to provide for the adjusted policy liabilities and ‘other liabilities’ of the fund at the end of the year. “ Prescribed Capital Amount (PCA) = Insurance Risk Charge (IRC)
+ Asset Risk Charge (ARC) + Asset Concentration Risk Charge (ACRC) + Operational Risk Charge (ORC) – Aggregation Benefit (AB) + Combined Stress Scenario Adjustment (CSSA)
APRA sets Asset Risk margins and Operational Risk margins
Appointed Actuaries set most of the margins for Insurance Risk

Why do we report Capital?
Managing capital
= Managing household budget
Principles of good household budget: Spending less than we earn Meet saving targets Anticipating for things we want in the future
Principles of capital management: Meet regulatory requirements Strategic KPI: E.g. Return on Capital (RoC) Ability to fund planned business growth
How much can we spend & are we going to run out of money?

PCA
How is Capital calculated? (1)
Assets Liabilities Net assets Net assets Capital base
Cash, 650
Equities, 150
Bonds, 1000
Receivables, 200
Policy liabilities,
700
Other liabilities,
300
1,000
Capital base, 500
Regulatory adjustments,
500
PCA*, 400
Target capital, 60 Available assets, 40
IRC, 200 ARC, 100 ORC, 60
ACRC, 50
*: This assumes 0 supervisory adjustment. Supervisory adjustment is as determined by APRA under LPS 110 paragraph 44.
Regulatory adjustments include: • Liability adjustment = Adjusted policy
liabilities minus net policy liabilities • Deferred tax assets minus deferred tax
liabilities • Goodwill and other intangibles • Unsigned reinsurance treaties > 6
months • Other (refer to LPS 112 Attachment B)
Regulatory capital = Regulatory adjustments + PCA*
AB, (60) CSSA, 50

How is Capital calculated? (2)
Insurance Risk Charge
Stresses are applied on adjusted policy liabilities Adjusted policy liabilities = Maximum of:
Termination value including claims reserves already incurred, or Present value of future (claims + expenses – premiums) + claims reserves already incurred
Various stresses: Mortality/morbidity random stress – fluctuation around mean Mortality/morbidity future stress – change of mean Event stress – e.g. pandemic Longevity stress Lapse stress – need to stress in both upwards and downwards direction Expense stress
Diversification between mortality/morbidity random/future stress, event stress and longevity stress Management actions can be allowed for, but cannot occur within 12 months of reporting date, and
cannot be used as a response to mortality/morbidity random stress and event stress

How is Capital calculated? (3)
Asset Risk Charge Allows for asset-liability mismatch Prescribed stresses - interest rates, inflation, currency, equity, property, credit spreads, default Aggregation Benefit Allows for diversification between IRC and ARC Prescribed formula Asset Concentration Risk Charge Amounts by which individual assets exceed certain limits Prescribed limits (vary by type of assets) Operational Risk Grows in line with premiums/adjusted policy liabilities. Additional charge applies if business
grows/shrinks > 20% Prescribed formula Combined Stress Scenario Adjustment Apply both insurance and asset stresses PCA is increased by the amount of tax benefits from IRC and ARC which cannot be recovered

Find out more about Capital
LPS 110 Capital Adequacy LPS 112 Capital Adequacy: Measurement of Capital LPS 114 Capital Adequacy: Asset Risk Charge
LPS 115 Capital Adequacy: Insurance Risk Charge
LPS 117 Capital Adequacy: Asset Concentration Risk Charge
LPS 118: Capital Adequacy: Operational Risk Charge
Actuaries Institute Information Note: Discount Rates for APRA Capital Standards

Value Reporting
Kirsten Flynn

What is Value? Value = how much something is worth
When I bought it? Today? To me? To someone else?
There are many related definitions of “value”, including:
Historical Value Replacement Value Market Value Net Assets Embedded Value Appraisal Value
The definition used depends on the purpose!

Who cares about Value (and why)?
Current owners of the business
What is the business currently worth? How has the value of the business changed?
Future owners of the business
How much to pay for the business?
Management How is the business doing? What has management contributed to value? Will a management action increase value? What’s the longer term impact of current experience?
Any others?

How do we calculate Value? No prudential (APRA) or accounting standards governing the calculation and
disclosure of value
BUT some common practices and sources of guidance have emerged
Embedded Value = Net Worth + Value of Inforce Business (VIF)
Net Worth Assets in excess of capital requirements
OR Assets in excess of policy liabilities
Value of Inforce Business
Present value of future profits PLUS releases of capital OR Present value of future profits LESS cost of capital

How do we calculate Value? (cont.)

How do we calculate Value? No prudential (APRA) or accounting standards governing the calculation and
disclosure of value
BUT some common practices and sources of guidance have emerged
Embedded Value = Net Worth + Value of Inforce Business (VIF)
Net Worth Assets in excess of capital requirements
OR Assets in excess of policy liabilities
Value of Inforce Business
Present value of future profits PLUS releases of capital OR Present value of future profits LESS cost of capital

How do we calculate Value? (cont.) Calculation of Value of Inforce business similar to valuation of policy liabilities BUT
Can have different valuation methods Might use different assumptions May need a projection of capital
Complications?
Tax Participating Business Non-owner assets Target capital

Find out more about Value
Financial Statements
Actuaries Institute PG 199.03 Economic Valuations
http://www.actuaries.asn.au/Library/Standards/PG%20199.03%20-%20final%20-%20March%202011.pdf
European Insurance CFO Forum - Market Consistent
Embedded Value Principles (MCEV) http://www.cfoforum.nl/embedded_value.html

Concluding Remarks
Niall Fallon
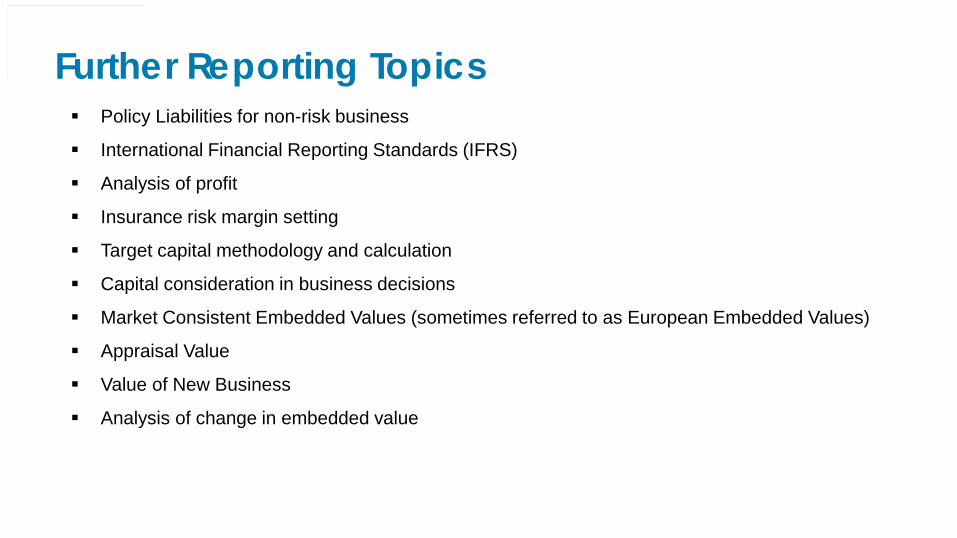
Further Reporting Topics
Policy Liabilities for non-risk business
International Financial Reporting Standards (IFRS)
Analysis of profit
Insurance risk margin setting
Target capital methodology and calculation
Capital consideration in business decisions
Market Consistent Embedded Values (sometimes referred to as European Embedded Values)
Appraisal Value
Value of New Business
Analysis of change in embedded value
Q & A
All (that includes you!)