Embed Size (px)
Citation preview

This statistical report details life expectancy
and healthy life expectancy estimates for
areas within Scotland including council
areas and NHS health boards. It also
includes break-downs of life expectancy
and healthy life expectancy by deprivation
and rurality
Life expectancy in
Scottish areas
2016-2018
Published on 11 December 2019

Since the early 1980s life expectancy has grown and the gap between females and males has narrowed. But since 2012-14* that growth has stalled.
Life expectancy and healthy life expectancy
A low life expectancy predicts an even lower healthy life expectancy
People in areas with low life expectancy will likely spend fewer years of their life in good health. They are also likely to live a smaller percent of that shorter life in good health.
Across the health boards there is more variation in healthy life expectancy than life expectancy.
Females can expect to live longer than males. But the number of years they are expected to live in good health doesn't grow proportionately.
Females in Orkney can expect the most years in good health. But the small sample size means this could change quite a lot next year.
Healthy life expectancy and life expectancy
This data uses results from the Annual Population survey. The sample sizes for Island boards are relatively small which means those estimates are more changeable from year to year.
What is the sample size?
Healthy LifeExpectancy
Life Expectancy
Baby boys born between 2016 and 2018
Baby girls born between 2016 and 2018
Lifeexpectancy
Healthy lifeexpectancy
Life expectancy has grown since the 1980s but stalled recently
69.1
77.0
61.061.9
75.3
81.1
63.062.2
Males Females
1980-82 2016-18 1980-82 2016-18
GreaterGlasgow
and Clyde
Orkney
Shetland
GreaterGlasgow
and Clyde
Orkney
Shetland
60 years
62
64
66
68
70
72
74 years
76 years 78 80 82 84 86 years
* We use a rolling 3 year average to smooth out unusual years.
www.nrscotland.gov.ukSource: Life Expectancy for Areas in Scotland, 2016-2018
SummaryLife Expectancy for Areas in Scotland, 2016-2018
11 year periodbefore 2012-14
4 year periodafter 2012-14
11 year periodbefore 2012-14
4 year periodafter 2012-14
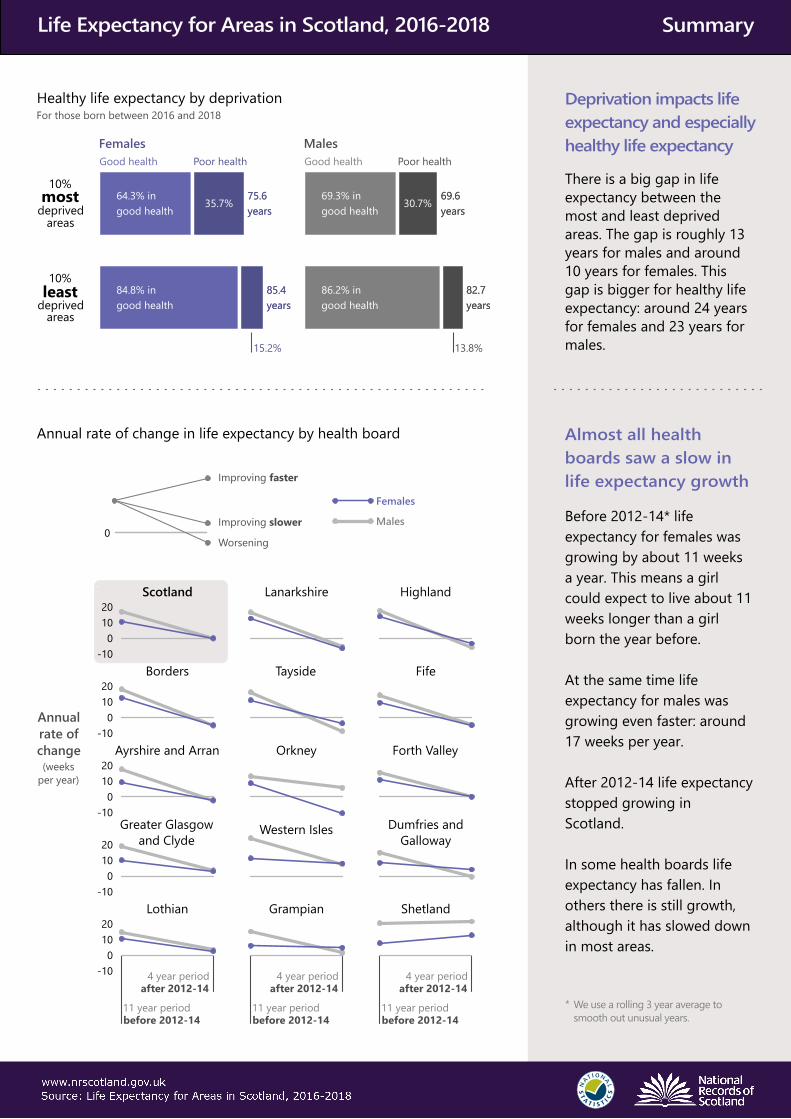
There is a big gap in life expectancy between the most and least deprived areas. The gap is roughly 13 years for males and around 10 years for females. This gap is bigger for healthy life expectancy: around 24 years for females and 23 years for males.
Before 2012-14* life expectancy for females was growing by about 11 weeks a year. This means a girl could expect to live about 11 weeks longer than a girl born the year before.
At the same time life expectancy for males was growing even faster: around 17 weeks per year.
After 2012-14 life expectancy stopped growing in Scotland.
In some health boards life expectancy has fallen. In others there is still growth, although it has slowed down in most areas.
* We use a rolling 3 year average to smooth out unusual years.
Annual rate of change in life expectancy by health board
11 year periodbefore 2012-14
4 year periodafter 2012-14
(weeksper year)
Healthy life expectancy by deprivation
10%least
deprivedareas
10%most
deprivedareas
Females
Males
Worsening
Improving faster
Improving slower0
Deprivation impacts life expectancy and especially healthy life expectancy
Almost all health boards saw a slow in life expectancy growth
Males
86.2% ingood health
13.8%
69.3% ingood health
30.7%69.6years
82.7years
69.6years
82.7years
Good health Poor health
For those born between 2016 and 2018
Annualrate ofchange
Females
84.8% ingood health
15.2%
64.3% ingood health
35.7%75.6years
85.4years
75.6years
85.4years
Good health Poor health
Lothian Grampian Shetland
Greater Glasgowand Clyde
Western Isles Dumfries andGalloway
Ayrshire and Arran Orkney Forth Valley
Borders Tayside Fife
Scotland Lanarkshire Highland
-100
1020
-100
1020
-100
1020
-100
1020
-100
1020
www.nrscotland.gov.ukSource: Life Expectancy for Areas in Scotland, 2016-2018
SummaryLife Expectancy for Areas in Scotland, 2016-2018
3
Table of Contents
1. Main Points..................................................................................................................................................... 3
2. Introduction ................................................................................................................................................... 4
3. Life expectancy in Scotland ................................................................................................................... 4
4. Life expectancy in Council areas ......................................................................................................... 7
5. The stall in life expectancy growth across Scotland’s council areas ............................... 8
6. Life expectancy in NHS health boards............................................................................................. 9
7. The relationship between life expectancy and healthy life expectancy ..................... 10
8. Life expectancy by deprivation......................................................................................................... 12
9. Life expectancy by deprivation within council areas ............................................................ 13
10. Life expectancy in urban and rural areas................................................................................. 14
11. Scottish Parliamentary constituencies ...................................................................................... 15
12. Related statistics ................................................................................................................................... 16
13. Notes on statistical publications .................................................................................................. 16
1. Main Points
Life expectancy in Scotland for people born between 2016 and 2018 was 77.0
years for males and 81.1 years for females.
A boy born between 2016 and 2018 could expect to spend 61.9 years of his
life in good health while a girl born at the same time could expect to spend
62.2 years of her life in good health.
For both males and females born in 2016-2018, life expectancy was highest in
East Renfrewshire and lowest in Glasgow City.
The majority of Scotland’s council areas have experienced a slow-down or a
stall in life expectancy growth since 2012-2014 and many areas now have
decreasing life expectancy.
Areas of Scotland with higher life expectancy also had higher healthy life
expectancy and people in those areas could expect to spend a greater
proportion of their lives in good health.
The gap in life expectancy between the most and least deprived areas was
13.1 years for males and 9.8 years for females. In recent years, the life
expectancy gap between most and least deprived has widened.
The gap in healthy life expectancy between the most and least deprived areas
of Scotland was 23.0 years for males and 23.9 years for females.
4
2. Introduction
This report gives estimates of life expectancy and healthy life expectancy based on
the years 2016, 2017 and 2018 for areas within Scotland. The detailed estimates for
all areas and age groups can be found in the accompanying tables.
Definitions
Life expectancy: The number of years a person could expect to live from the
age they are now. This is calculated using the number of people and the
number of deaths in each area.
Period life expectancy: A measure of life expectancy that is calculated
assuming that mortality rates for each age group in the time period (here
2016-2018) are constant throughout a person’s life. This means that future
changes in things such as medicine and legislation are not taken into
consideration. While this means that period life expectancy is not an accurate
prediction of how long a person will actually live, it is a useful measure of
population health. All life expectancy estimates in this publication are period
life expectancy.
Healthy life expectancy (HLE): The number of years a person could expect to
spend in good health from the age they are now. This is calculated using life
expectancy estimates and self-reported health from the annual population
survey (APS).
Self-reported health: The APS asks people to rate their own health as ‘very
good’, ‘good’, ‘fair’, ‘bad’ or ‘very bad’. To work out the proportion of the
population in good health, we group the ‘very good’ and ‘good’ answers
together in ‘good health’ and the ‘fair’, ‘bad’ and ‘very bad’ into ‘not good
health’. We then feed this into the HLE calculations.
95% confidence intervals: This is a measure of the uncertainty around the
life expectancy and HLE estimates. In this report, confidence intervals are
quoted in brackets, for example: 81 (± 0.7) years. These represent the range of
values that the actual value is likely to lie within. The wider the confidence
intervals, the less accurate the estimate is. Estimates from larger populations
(such as health boards) will have smaller confidence intervals and therefore be
more accurate than estimates from smaller populations (such as parliamentary
constituencies) which have large confidence intervals.
3. Life expectancy in Scotland
Life expectancy for males born in Scotland between 2016 and 2018 was 77.0 years
while life expectancy for females born at the same time was 81.1 years. Figure 1
shows that life expectancy in Scotland is the lowest of all UK countries for both males
5
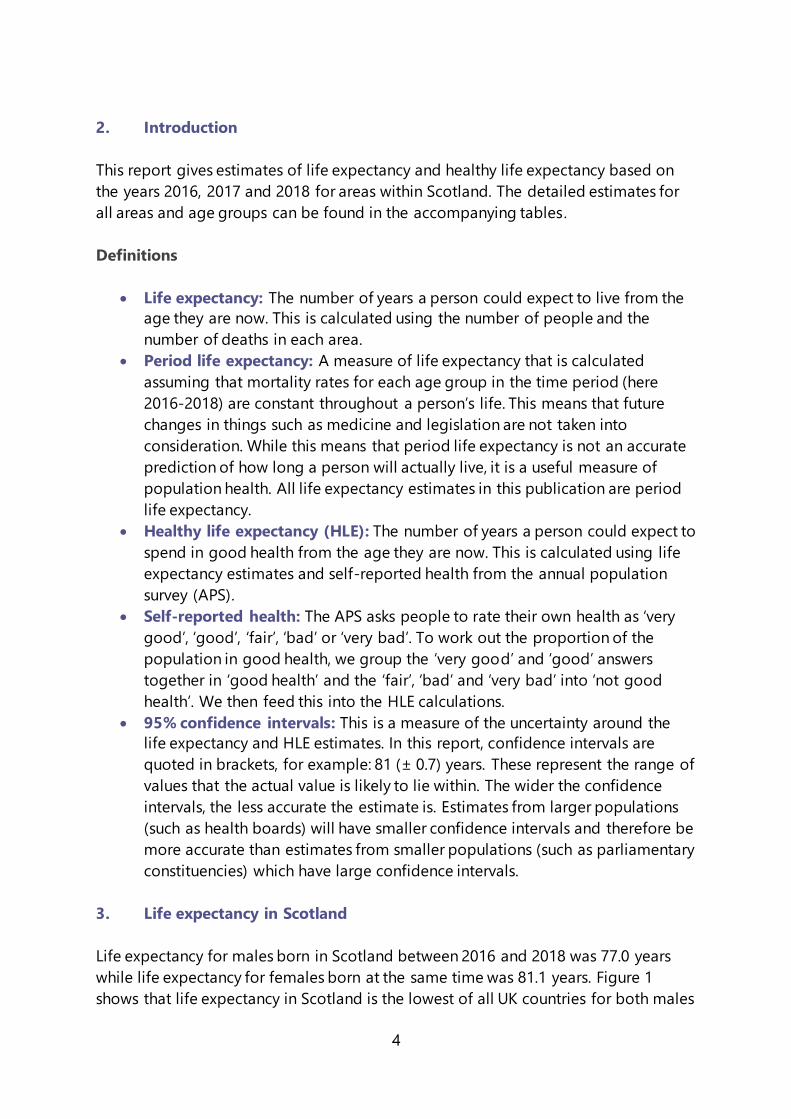
and females and has been the lowest since the early 1980s. Life expectancy in all UK
countries increased at a steady rate from 1980-1982, however, in recent years, the
rate of increase has stalled. Since 2012-2014, life expectancy in Scotland has
remained virtually unchanged for both males and females.
Figure 1. Life expectancy at birth in the UK and constituent countries, 1980-
1982 to 2016-2018.
Source: Office for National Statistics (National Life Tables for UK and constituent countries)
Healthy life expectancy (HLE) in Scotland for 2016-2018 was 61.9 years for male and
62.2 years for females. This means that a boy born between 2016-2018 could expect
to live for 61.9 years in good health followed by 15.2 years in ‘not good health’ until
he was 77.1 years old. Similarly a girl born at the same time would live 62.2 years in
Why are there two male life expectancy estimates for Scotland?
The headline life expectancy figure comes from the published national life tables
for Scotland, where estimates are calculated using single year of age data.
However, life expectancy for subnational areas and HLE are both calculated using
5 year age groups (‘abridged life tables’). We also produce a Scotland level
estimate using abridged life tables so that it can be properly compared with HLE
and subnational life expectancy.
So, if we want talk just about Scottish life expectancy (as in figure 1), we use the
figure from the national life tables. If we are comparing with subnational life
expectancy or HLE (as in figure 2), we use the abridged life tables. The figures are
always very similar, but this year male life expectancy at birth rounds to 77.0 in
the national life tables and 77.1 in the abridged life tables.
6
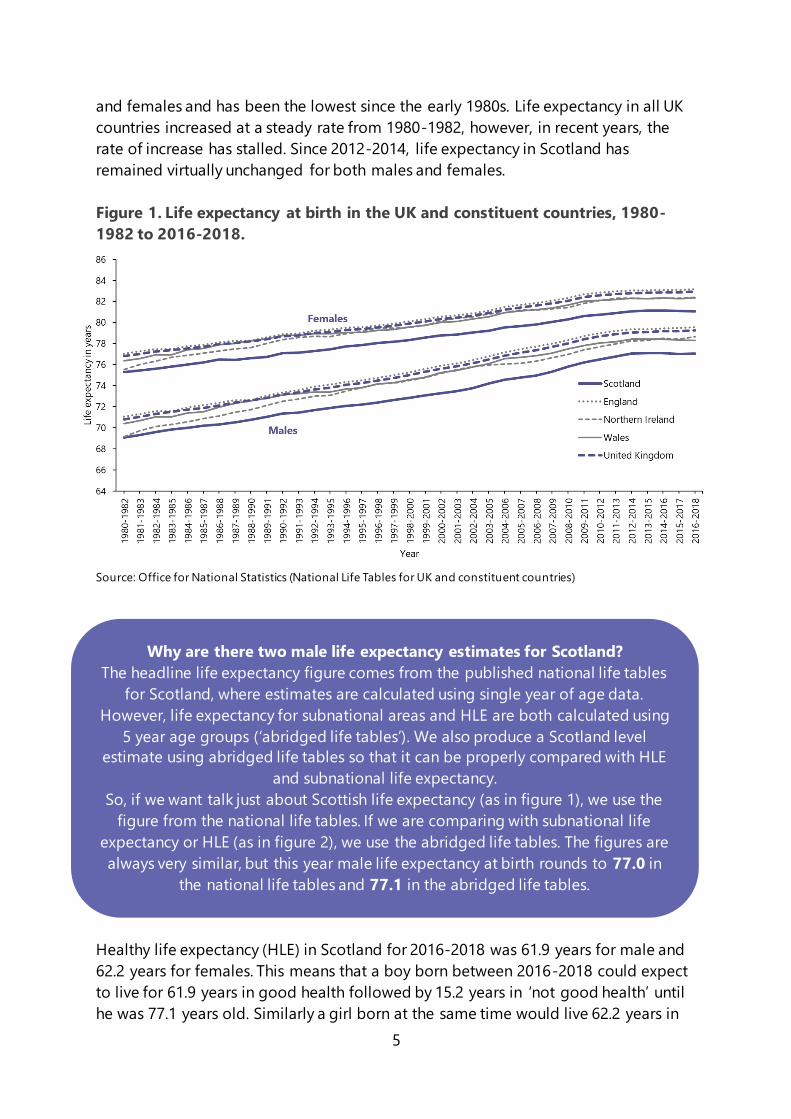
good health and then 18.9 years in ‘not good health’ until she was 81.1. This means
males spend on average 80.3% of their life in good health and females spend 76.7%
of their lives in good health. Figure 2a and Figure 2b show life expectancy and
healthy life expectancy for males and females in Scotland at 5 year age intervals.
Figure 2a. Life expectancy and healthy life expectancy by age group. 2016-
2018, Males
Upper numbers represent total life expectancy in years, lower numbers represent HLE in years.
Source: Life expectancy in Scottish areas 2016-2018 (NRS)
Figure 2b. Life expectancy and healthy life expectancy by age group. 2016-
2018, Females
Upper numbers represent total life expectancy in years, lower numbers represent HLE in years.
Source: Life expectancy in Scottish areas 2016-2018 (NRS)
Why do we report life expectancy for three year periods?
Official life expectancy statistics for Scotland are calculated by aggregating the
latest three years of deaths and population estimates. This is to increase the sample
size and improve the reliability of the results. It also reduces the effect of more
‘extreme’ years on the data.
7
Females Males
4. Life expectancy in Council areas
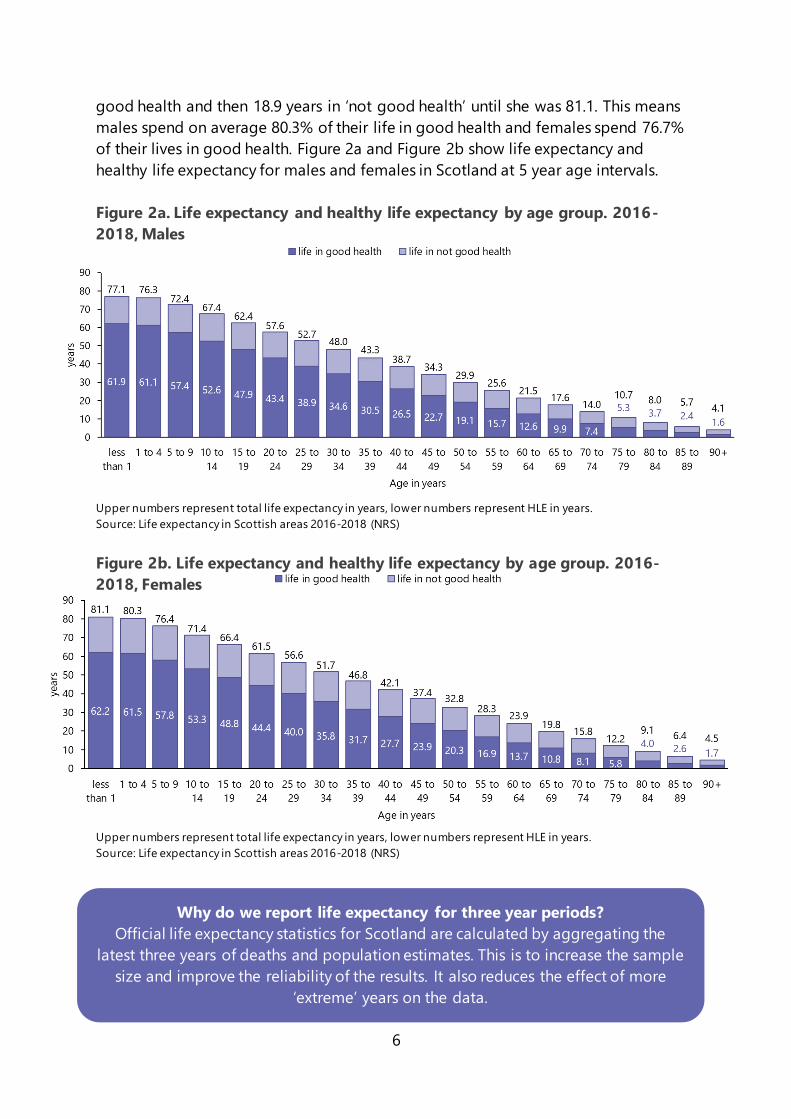
The council area where life expectancy at birth was highest for both males and
females was East Renfrewshire. Here, a boy born in 2016-2018 could expect to live
for 80.7 (±0.7) years while a girl could expect to live for 83.6 (±0.6) years. In contrast,
life expectancy was lowest in Glasgow City, where males could expect to live for 73.4
(±0.3) years and females for 78.7 (±0.3) years. This represents 7.3 fewer years of life
for males and 4.9 fewer years of life for females compared with East Renfrewshire.
Figure 3. Life expectancy and healthy life expectancy at birth in Scotland's
Council areas. 2016-2018
Numbers in the bar represent HLE in years, numbers outside the bar represent total life expectancy in years. Black
error bars represent confidence intervals around HLE estimates
Source: Life expectancy in Scottish areas 2016-2018 (NRS)
8
HLE was highest for males in East Dunbartonshire at 69.7 (±1.6) years and highest for
females in Orkney Islands at 73.3 (±4.2) years. It should be noted that the confidence
intervals around the Orkney HLE estimate are very large. This is due to the small
population and also the small sample size of the APS in Orkney. If Orkney Islands was
excluded, then East Dunbartonshire would also have the highest HLE for females at
68.4 (±1.8) years. Figure 3 shows life expectancy and healthy life expectancy in all of
Scotland’s council areas.
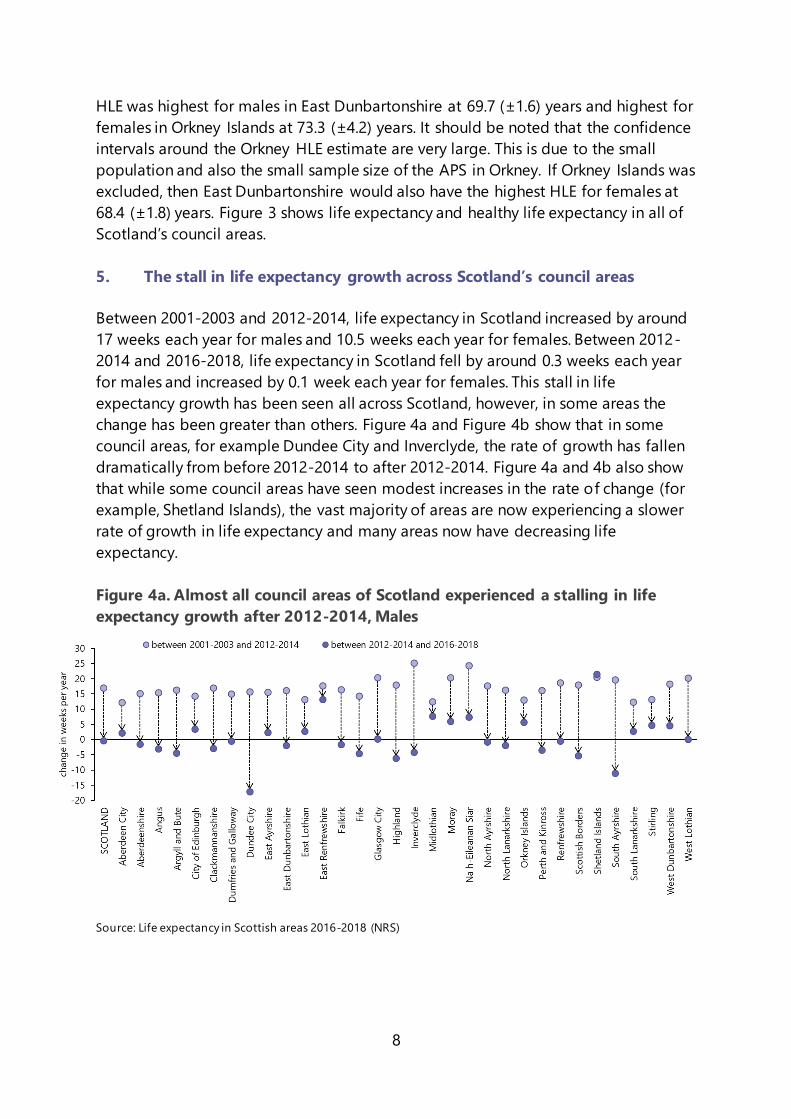
5. The stall in life expectancy growth across Scotland’s council areas
Between 2001-2003 and 2012-2014, life expectancy in Scotland increased by around
17 weeks each year for males and 10.5 weeks each year for females. Between 2012-
2014 and 2016-2018, life expectancy in Scotland fell by around 0.3 weeks each year
for males and increased by 0.1 week each year for females. This stall in life
expectancy growth has been seen all across Scotland, however, in some areas the
change has been greater than others. Figure 4a and Figure 4b show that in some
council areas, for example Dundee City and Inverclyde, the rate of growth has fallen
dramatically from before 2012-2014 to after 2012-2014. Figure 4a and 4b also show
that while some council areas have seen modest increases in the rate of change (for
example, Shetland Islands), the vast majority of areas are now experiencing a slower
rate of growth in life expectancy and many areas now have decreasing life
expectancy.
Figure 4a. Almost all council areas of Scotland experienced a stalling in life
expectancy growth after 2012-2014, Males
Source: Life expectancy in Scottish areas 2016-2018 (NRS)
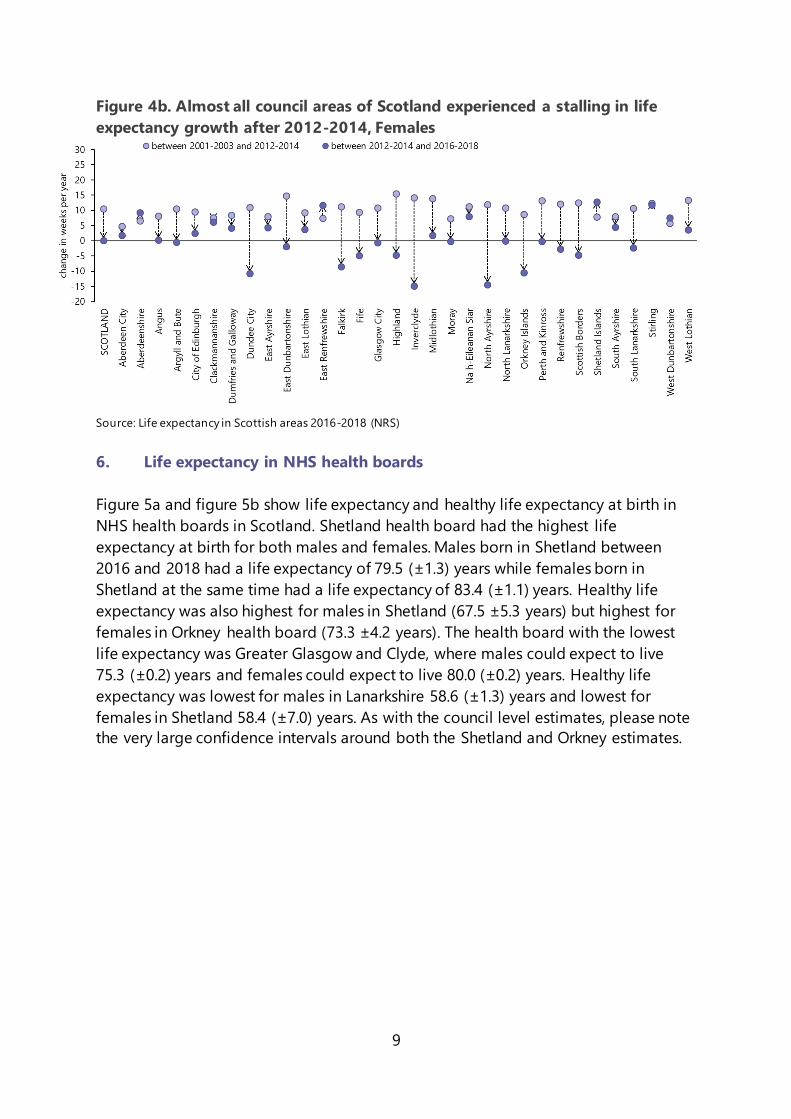
9
Figure 4b. Almost all council areas of Scotland experienced a stalling in life
expectancy growth after 2012-2014, Females
Source: Life expectancy in Scottish areas 2016-2018 (NRS)
6. Life expectancy in NHS health boards
Figure 5a and figure 5b show life expectancy and healthy life expectancy at birth in
NHS health boards in Scotland. Shetland health board had the highest life
expectancy at birth for both males and females. Males born in Shetland between
2016 and 2018 had a life expectancy of 79.5 (±1.3) years while females born in
Shetland at the same time had a life expectancy of 83.4 (±1.1) years. Healthy life
expectancy was also highest for males in Shetland (67.5 ±5.3 years) but highest for
females in Orkney health board (73.3 ±4.2 years). The health board with the lowest
life expectancy was Greater Glasgow and Clyde, where males could expect to live
75.3 (±0.2) years and females could expect to live 80.0 (±0.2) years. Healthy life
expectancy was lowest for males in Lanarkshire 58.6 (±1.3) years and lowest for
females in Shetland 58.4 (±7.0) years. As with the council level estimates, please note
the very large confidence intervals around both the Shetland and Orkney estimates.

10
Figure 5. Life expectancy and healthy life expectancy at birth in NHS health
boards. 2016-2018
Numbers in the bar represent HLE in years, numbers outside the bar represent total life expectancy in years. Black
error bars represent confidence intervals around HLE estimates
Source: Life expectancy in Scottish areas 2016-2018 (NRS)
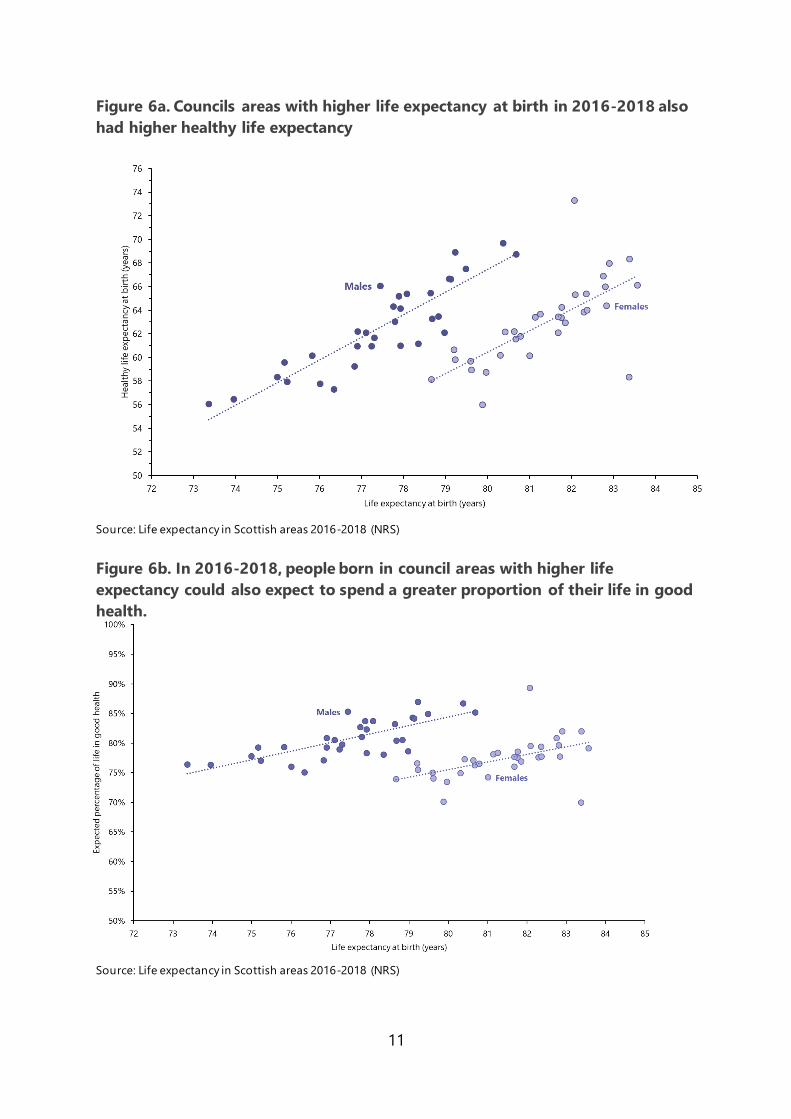
7. The relationship between life expectancy and healthy life expectancy
People who live in Scottish areas that have higher life expectancy are also likely to
have higher healthy life expectancy. Figure 6a shows the positive relationship
between life expectancy and HLE in Scotland’s council areas. It also illustrates that
females tend to have higher life expectancy than males, but males and females have
similar HLE. Figure 6b shows that people in areas with higher life expectancy are also
likely to spend a greater proportion of their lives in good health. This means that
someone born in an area with low life expectancy could expect to have lower HLE
both in years and as a percentage of their total life.
Females Males
11
Figure 6a. Councils areas with higher life expectancy at birth in 2016-2018 also
had higher healthy life expectancy
Source: Life expectancy in Scottish areas 2016-2018 (NRS)
Figure 6b. In 2016-2018, people born in council areas with higher life
expectancy could also expect to spend a greater proportion of their life in good
health.
Source: Life expectancy in Scottish areas 2016-2018 (NRS)
12
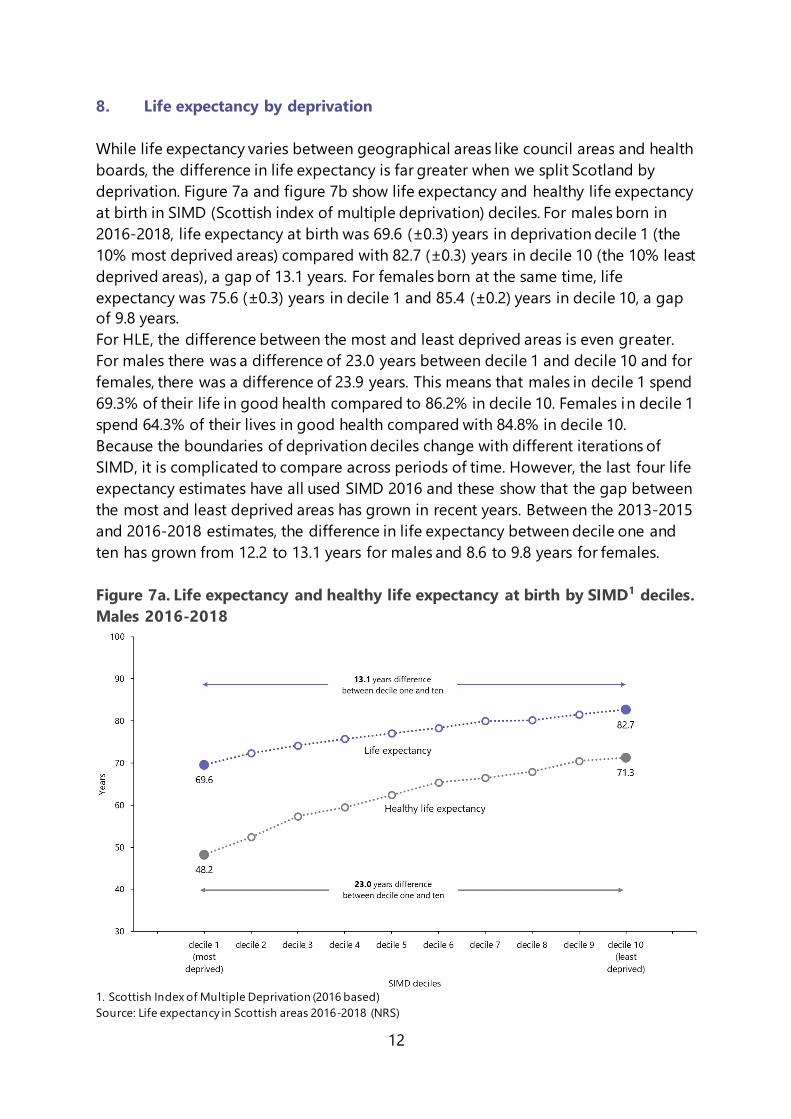
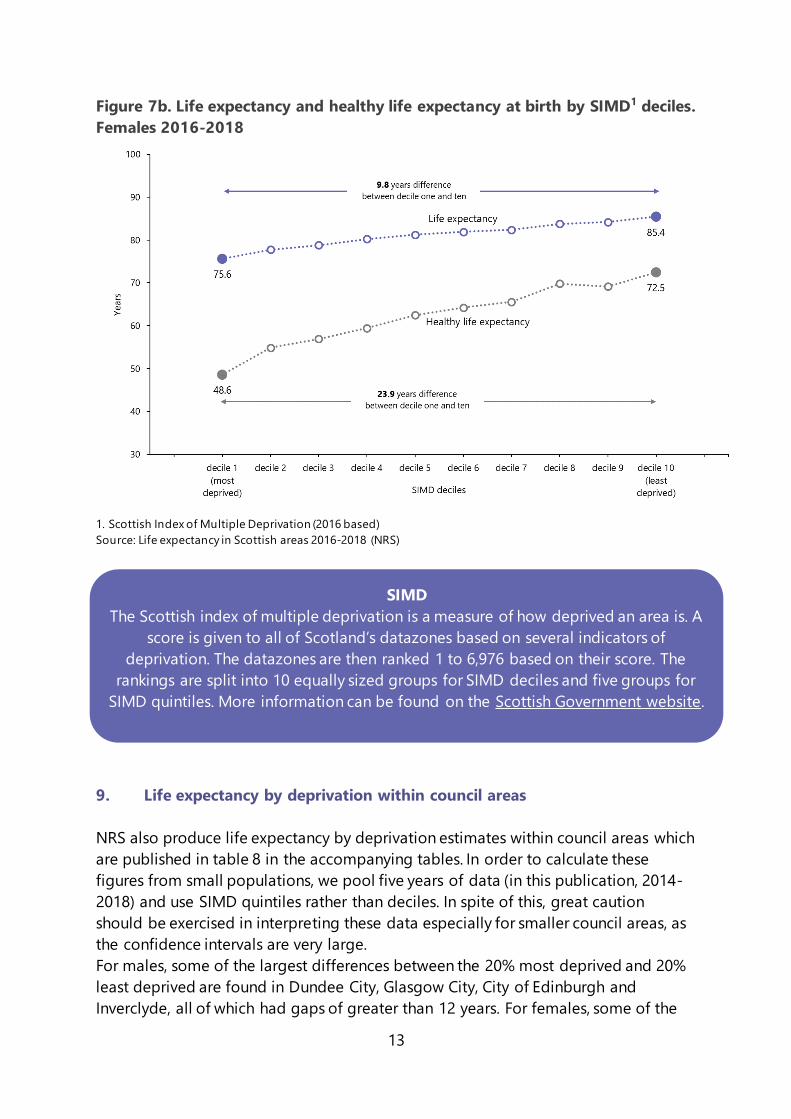
8. Life expectancy by deprivation
While life expectancy varies between geographical areas like council areas and health
boards, the difference in life expectancy is far greater when we split Scotland by
deprivation. Figure 7a and figure 7b show life expectancy and healthy life expectancy
at birth in SIMD (Scottish index of multiple deprivation) deciles. For males born in
2016-2018, life expectancy at birth was 69.6 (±0.3) years in deprivation decile 1 (the
10% most deprived areas) compared with 82.7 (±0.3) years in decile 10 (the 10% least
deprived areas), a gap of 13.1 years. For females born at the same time, life
expectancy was 75.6 (±0.3) years in decile 1 and 85.4 (±0.2) years in decile 10, a gap
of 9.8 years.
For HLE, the difference between the most and least deprived areas is even greater.
For males there was a difference of 23.0 years between decile 1 and decile 10 and for
females, there was a difference of 23.9 years. This means that males in decile 1 spend
69.3% of their life in good health compared to 86.2% in decile 10. Females in decile 1
spend 64.3% of their lives in good health compared with 84.8% in decile 10.
Because the boundaries of deprivation deciles change with different iterations of
SIMD, it is complicated to compare across periods of time. However, the last four life
expectancy estimates have all used SIMD 2016 and these show that the gap between
the most and least deprived areas has grown in recent years. Between the 2013-2015
and 2016-2018 estimates, the difference in life expectancy between decile one and
ten has grown from 12.2 to 13.1 years for males and 8.6 to 9.8 years for females.
Figure 7a. Life expectancy and healthy life expectancy at birth by SIMD1 deciles.
Males 2016-2018
1. Scottish Index of Multiple Deprivation (2016 based)
Source: Life expectancy in Scottish areas 2016-2018 (NRS)
13
Figure 7b. Life expectancy and healthy life expectancy at birth by SIMD1 deciles.
Females 2016-2018
1. Scottish Index of Multiple Deprivation (2016 based)
Source: Life expectancy in Scottish areas 2016-2018 (NRS)
9. Life expectancy by deprivation within council areas
NRS also produce life expectancy by deprivation estimates within council areas which
are published in table 8 in the accompanying tables. In order to calculate these
figures from small populations, we pool five years of data (in this publication, 2014-
2018) and use SIMD quintiles rather than deciles. In spite of this, great caution
should be exercised in interpreting these data especially for smaller council areas, as
the confidence intervals are very large.
For males, some of the largest differences between the 20% most deprived and 20%
least deprived are found in Dundee City, Glasgow City, City of Edinburgh and
Inverclyde, all of which had gaps of greater than 12 years. For females, some of the
SIMD
The Scottish index of multiple deprivation is a measure of how deprived an area is. A
score is given to all of Scotland’s datazones based on several indicators of
deprivation. The datazones are then ranked 1 to 6,976 based on their score. The
rankings are split into 10 equally sized groups for SIMD deciles and five groups for
SIMD quintiles. More information can be found on the Scottish Government website.
14
largest differences were found in Renfrewshire, Inverclyde, North Ayrshire, Glasgow
City and City of Edinburgh which all had deprivation gaps greater than eight years.
The equivalent differences for all of Scotland for 2014-2018 are 9.6 years for males
and 7.0 years for females.
In some rural or sparsely populated areas there may be relatively little variation in
deprivation so the difference between the most and least deprived areas are much
smaller than they would be in a large city. For example, in the Shetland Islands and
Na h-Eileanan Siar council areas, the confidence intervals overlap between the 20%
most and least deprived areas. This indicates that it is not possible to compare life
expectancies by deprivation in these more sparsely populated areas. We also do not
produce HLE for council areas split by deprivation due to the small sample sizes.
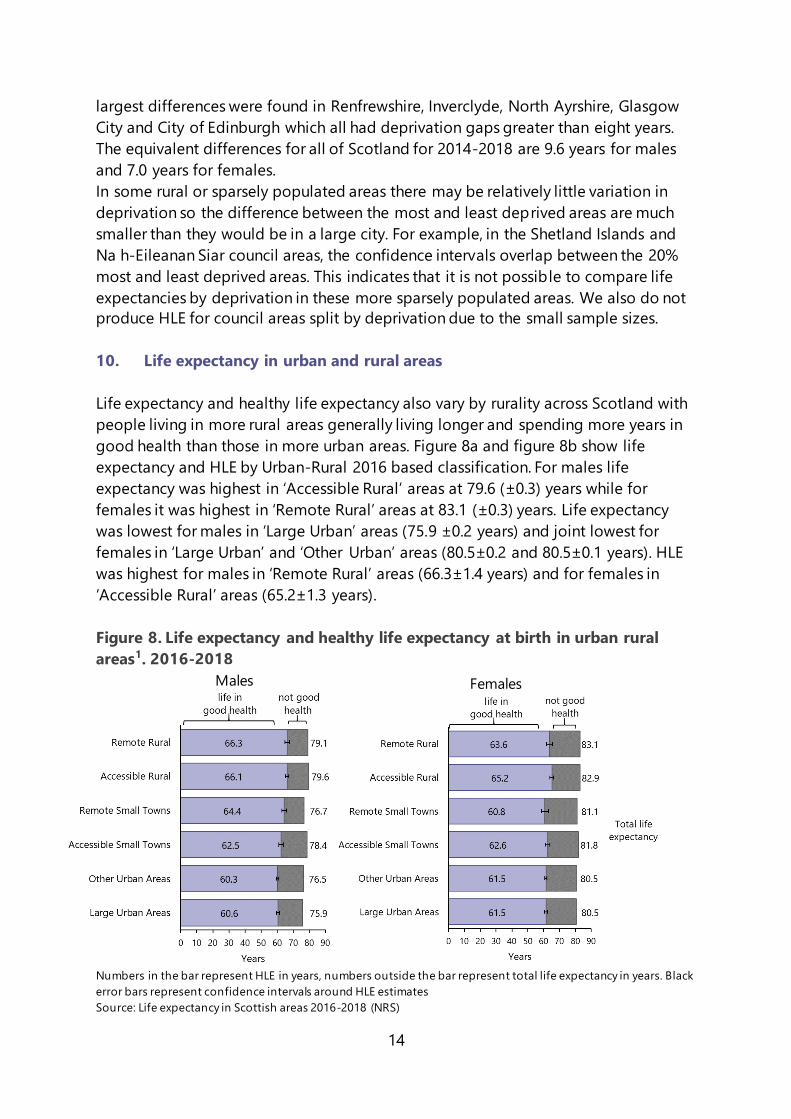
10. Life expectancy in urban and rural areas
Life expectancy and healthy life expectancy also vary by rurality across Scotland with
people living in more rural areas generally living longer and spending more years in
good health than those in more urban areas. Figure 8a and figure 8b show life
expectancy and HLE by Urban-Rural 2016 based classification. For males life
expectancy was highest in ‘Accessible Rural’ areas at 79.6 (±0.3) years while for
females it was highest in ‘Remote Rural’ areas at 83.1 (±0.3) years. Life expectancy
was lowest for males in ‘Large Urban’ areas (75.9 ±0.2 years) and joint lowest for
females in ‘Large Urban’ and ‘Other Urban’ areas (80.5±0.2 and 80.5±0.1 years). HLE
was highest for males in ‘Remote Rural’ areas (66.3±1.4 years) and for females in
‘Accessible Rural’ areas (65.2±1.3 years).
Figure 8. Life expectancy and healthy life expectancy at birth in urban rural
areas1. 2016-2018
Numbers in the bar represent HLE in years, numbers outside the bar represent total life expectancy in years. Black
error bars represent confidence intervals around HLE estimates
Source: Life expectancy in Scottish areas 2016-2018 (NRS)
Females Males
15
11. Scottish Parliamentary constituencies
NRS have also published life expectancy estimates for Scottish Parliamentary
constituencies which can be found in table 7 in the accompanying tables. Please be
aware that these are small areas and therefore the confidence intervals around the
estimates are large.
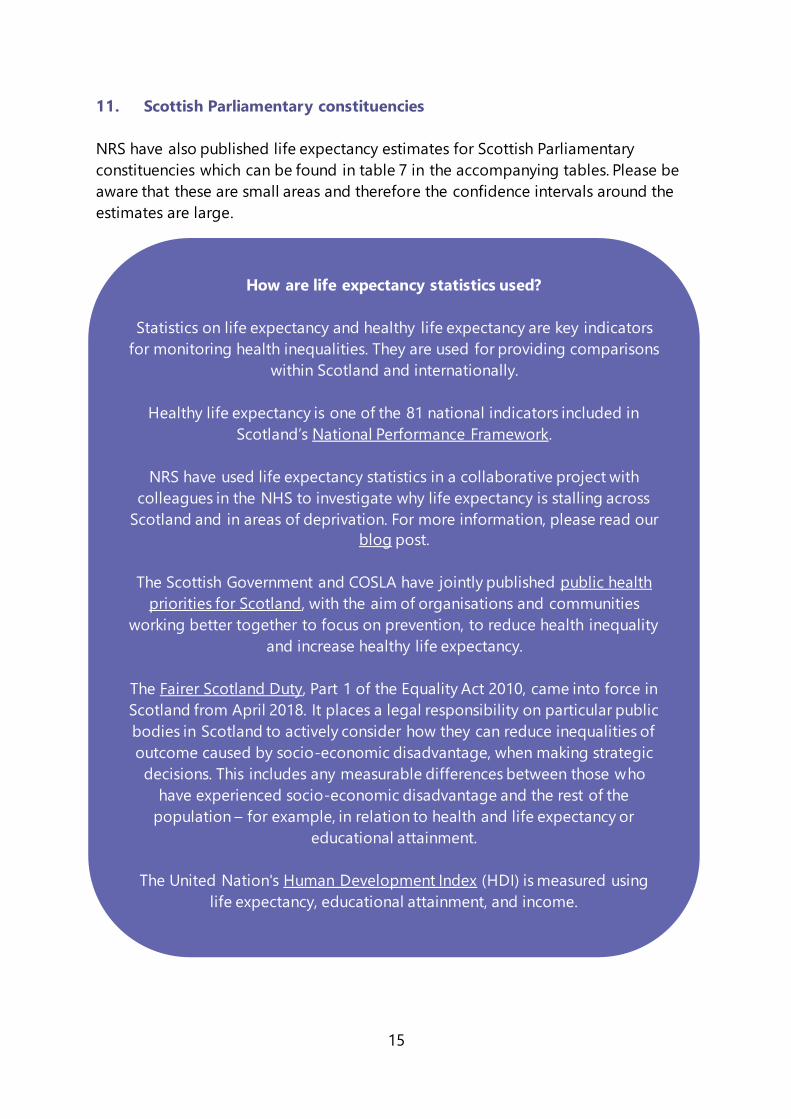
How are life expectancy statistics used?
Statistics on life expectancy and healthy life expectancy are key indicators
for monitoring health inequalities. They are used for providing comparisons
within Scotland and internationally.
Healthy life expectancy is one of the 81 national indicators included in
Scotland’s National Performance Framework.
NRS have used life expectancy statistics in a collaborative project with
colleagues in the NHS to investigate why life expectancy is stalling across
Scotland and in areas of deprivation. For more information, please read our
blog post.
The Scottish Government and COSLA have jointly published public health
priorities for Scotland, with the aim of organisations and communities
working better together to focus on prevention, to reduce health inequality
and increase healthy life expectancy.
The Fairer Scotland Duty, Part 1 of the Equality Act 2010, came into force in
Scotland from April 2018. It places a legal responsibility on particular public
bodies in Scotland to actively consider how they can reduce inequalities of
outcome caused by socio-economic disadvantage, when making strategic
decisions. This includes any measurable differences between those who
have experienced socio-economic disadvantage and the rest of the
population – for example, in relation to health and life expectancy or
educational attainment.
The United Nation's Human Development Index (HDI) is measured using
life expectancy, educational attainment, and income.
“This is one of the few indicators that allows us to give international
context to the health challenges we face in Scotland.”

16
12. Related statistics
The National Life Tables for Scotland are published by NRS and contain
estimates of life expectancy at Scotland level for three years of data based on
populations and deaths at single year of age.
The National Life tables for the UK are published by the ONS and contain
estimates of life expectancy for the UK and constituent countries. These are
also based on three years of data by single year of age.
The ONS also produce Health State Life expectancies which contain life
expectancy, healthy life expectancy and disability free life expectancy
estimates for areas within the UK
Prior to 2019, healthy life expectancy at birth was published by the NHS
information services division. More information and analysis can be found on
their website.
13. Notes on statistical publications
National Statistics
The United Kingdom Statistics Authority (UKSA) has designated these statistics as
National Statistics, in line with the Statistics and Registration Service Act 2007 and
signifying compliance with the Code of Practice for Official Statistics (available on the
UKSA website).
National Statistics status means that official statistics meet the highest standards of
trustworthiness, quality and public value.
All official statistics should comply with all aspects of the Code of Practice for Official
Statistics. They are awarded National Statistics status fol lowing an assessment by the
Authority’s regulatory arm. The Authority considers whether the statistics meet the
highest standards of Code compliance, including the value they add to public
decisions and debate.
It is National Records of Scotland’s responsibility to maintain compliance with the
standards expected of National Statistics. If we become concerned about whether
these statistics are still meeting the appropriate standards, we will discuss any
concerns with the Authority promptly. National Statistics status can be removed at
any point when the highest standards are not maintained, and reinstated when
standards are restored.

17
Information on background and source data
Further details on data source(s), timeframe of data and timeliness, continui ty of
data, accuracy, etc can be found in the About this Publication document that is
published alongside this publication on the NRS website.
National Records of Scotland
We, the National Records of Scotland, are a non-ministerial department of the
devolved Scottish Administration. Our aim is to provide relevant and reliable
information, analysis and advice that meets the needs of government, business and
the people of Scotland. We do this as follows:
Preserving the past – We look after Scotland’s national archives so that they are
available for current and future generations, and we make available important
information for family history.
Recording the present – At our network of local offices, we register births, marriages,
civil partnerships, deaths, divorces and adoptions in Scotland.
Informing the future – We are responsible for the Census of Population in Scotland
which we use, with other sources of information, to produce statistics on the
population and households.
You can get other detailed statistics that we have produced from the Statistics
section of our website. Scottish Census statistics are available on the Scotland’s
Census website.
We also provide information about future publications on our website. If you would
like us to tell you about future statistical publications, you can register your interest
on the Scottish Government ScotStat website.
You can also follow us on twitter @NatRecordsScot
Enquiries and suggestions
Please contact our Statistics Customer Services if you need any further information.
Email: [email protected]
If you have comments or suggestions that would help us improve our standards of
service, please contact:
Alan Ferrier
Senior Statistician
National Records of Scotland
Room 1/2/12
Ladywell House


![Proposals to Extend Healthy Life Expectancy in Shizuoka ...€¦ · [Gap between life expectancy and healthy life expectancy in Shizuoka Prefecture] Healthy life expectancy *Source:](https://img.pdfslide.us/doc/110x75/5f427921a09c2479a15262fb/proposals-to-extend-healthy-life-expectancy-in-shizuoka-gap-between-life-expectancy.jpg)