Embed Size (px)
Citation preview
DPRIETI Discussion Paper Series 12-E-059
Life-cycle Productivity of Industrial Inventors:Education and other determinants
ONISHI KoichiroOsaka Institute of Technology
NAGAOKA SadaoRIETI
The Research Institute of Economy, Trade and Industryhttp://www.rieti.go.jp/en/
RIETI Discussion Paper Series 12-E-059
September 2012
Life-cycle Productivity of Industrial Inventors: Education and other determinants♦
ONISHI Koichiro Osaka Institute of Technology
NAGAOKA Sadao RIETI/Hitotsubashi University
Abstract
This paper analyzes the life-cycle inventive productivity of Japanese industrial inventors, based
on panel data of 1,731 inventors matched with firm data. We focus on two issues: whether
inventors with PhD degrees perform better, even taking into account the late start in their
business careers, and if those with PhD degrees based only on dissertation (PhDs (DO)), for
which a university performs only a certification function, are similarly as productive as the
regular PhD holders. Our main findings are the following. Inventors with regular PhD degrees
have significantly higher annual productivity than those with other education levels in terms of
both patent and forward citation counts, and they can easily compensate for the late start in their
business careers. This is the case even after controlling for workplace, research stage, and
inventor ability. PhDs (DO) also have high patent productivity (rising more rapidly with
experience), although their level is lower than that of regular PhD holders. They work in
independent laboratories and in projects involving basic research as frequently as do the regular
PhD holders. Furthermore, the exits of PhDs (DO) from inventions are significantly late even
when controlling for project type and inventor ability, so that they work longer as inventors.
Keywords: Inventor, Life-cycle inventive productivity, Productivity profile, Education, Patent
JEL Classifications: O31, O34, I21
♦ The authors are grateful for helpful comments and suggestions by Masahisa Fujita, Masayuki Morikawa, Yoichiro Nisimura, Yosuke Okada, Hideo Owan, Jun Suzuki, Naotoshi Tsukada, Tetsuo Wada and the other participants in research seminar in RIETI. All remaining errors are our own.
RIETI Discussion Papers Series aims at widely disseminating research results in the form of professional papers,
thereby stimulating lively discussion. The views expressed in the papers are solely those of the author(s), and do not
represent those of the Research Institute of Economy, Trade and Industry.
1
1. Introduction It is widely recognized that higher education is essential for strengthening the
innovative capacity of domestic industry, especially for those countries at the technology
frontier1. PhD trained scientists and engineers would help a firm to enhance absorptive
power of industry for exploiting recent scientific advances (see Cohen and Levinthal
1989 for the importance of absorptive power). In addition, hiring a PhD may serve as a
direct path of technology transfer from universities to industries (Stephan 2011)2.
Recognizing these, many countries have expanded higher education systems and have
increased the supply of highly skilled scientists and engineers. The enrollment of
doctoral programs have been rapidly increasing among OECD countries (OECD 2010),
including Japan, by 40 per cent from 1998 to 2008.
In Japan, PhD inventors are still a small minority (only a little more than 10% of the
inventors), compared to the US where almost half of the inventor are PhDs, according to
the RIETI Inventor Survey implemented in 2007 focusing on triadic patents. Moreover,
as explained later in more detail, only half of the PhD inventors in Japan have obtained
their degrees through attending the formal doctoral course work. To put it in another
way, half of them have obtained their PhDs only by submitting their dissertations,
based on their research within their firms (“PhD (dissertation only)” or merely "PhD
(DO)" hereafter). At the same time, there are many regular PhD holders who cannot be
employed after attaining a PhD degree3. Many Japanese firms seem to be reluctant to
hire PhDs. They often point out that they are narrow-focused and not flexible, while
recognizing the importance of building the technological basis of their firms. In addition,
since it takes at least additional three years for completing PhDs from the time of the
award of a master degree (or at least five years from the award of the bachelor degree),
PhD inventors are late in starting business careers. In Japan, inventors start invention
careers early4 and also exit early into managerial jobs, so that the average inventor age
is significantly lower than that of the US. This career pattern as well as the availability
1 Agihon et al. (2009) emphasizes that highly skilled workers who acquired higher level education are the engine of economic growth for the countries which have already reached technological frontier, and empirically validated this view, exploiting US state level data on economic growth and patenting. Some studies, however, find that only basic education has a positive effect on the economic growth from a global perspective (Kruger and Lindahl 2001). 2 Chapter 4 of Stephan (2011) discusses comprehensively how PhDs working in industry contribute economic growth. It quotes the statement of former President of the National Academy of Sciences that “the real agents of technology transfer from university laboratory were the students who took jobs in the local biotech industry.” 3 See Cyranoski et al. (2011). 4 Almost 80% of the Japanese inventors have first patent application years below 30, but only lees than 30% of the US inventors (see Walsh and Nagaoka 2009).

2
of PhD (DO) may make attending a formal PhD program more costly in Japan.
These observations suggest the following questions. Do corporate inventors with
PhDs perform better in life-cycle framework, that is, even taking into account their late
start in business careers? That is, can their presumably higher annual productivity
compensate the loss of starting early in a firm? Secondly, are the inventors with PhDs
(DO) similarly productive as regular PhD inventors? If they are, the system of awarding
PhDs (DO) may be evaluated as an efficient complement to a formal education program.
In such system a university essentially specializes in the certification function for
scientific contribution of an industrial engineer. Since these PhDs write their
dissertations based on their industrial research, their unemployment cannot be an issue.
PhDs (DO) is quite unique in Japan and its assessment may have important
implications for the other countries.
In order to inquire these issues, we will assess how the invention productivity varies
by educations of the inventors from a life-cycle perspective. In particular, we will assess
whether a regular PhD inventor can compensate his late start by generating more
number of inventions or higher quality inventions and/or by jumpstarting their
invention activities and maintaining invention activities late in their work careers. We
also compare how PhD (DO) inventors compare with regular PhD inventors in order to
understand how a PhD grant system focusing on certification works. In such
assessments we control for the type of workplace where the inventor works as well as
the type of the R&D project where he pursues. Furthermore, we control for inventor
ability by using an indicator variable (T-score) of the quality of the university from
which he/she graduated, which is a standardized score of the difficulty of university
entrant examination. Furthermore, we employ Hausman-Taylor estimation in panel
data analysis, to control for unobserved inventor ability or the other characteristics. To
the best of our knowledge, there are no much studies which investigate life-cycle
inventive productivity for industrial workers (see section 2 for literature review) and,
moreover, they do not control for the ability of inventors.
Our main findings are the following. Regular PhDs have significantly higher annual
productivity than inventors with other education level in terms of both patent and
forward citation counts, and they can easily compensate for their late start of business
activity. This is the case even after controlling for workplace, research stage and
inventor ability. One source of higher annual productivity of regular PhDs is short
intervals between the first job year and the first invention year. PhDs (DO) have also
high patent productivity (more rapidly rising with experience), the overall level of which
are not significantly lower than those of regular PhDs. They work in an independent
3
laboratory and in the project involving basic research as frequently as regular PhDs. In
addition, PhD (DO) holders exit from inventive activity significantly late even if we
control for project type and inventor ability.
The rest of the paper is organized as follows. Section 2 reviews relevant literature.
Section 3 explains the data construction and patent application activities of Japanese
industrial inventors. Section 4 explains the estimation models and methodology. Section
5 presents the estimation results and section 6 concludes.
2. Literature review Empirical studies on corporate inventors are limited. One of the pioneering works is
Narin, and Breitzman (1995), which confirmed the finding by Lotka (1926) that
scientist’s productivity is highly skewed. The four recent studies based on a large scale
data which are also most relevant prior works for our research are listed in the
following Table 1. All these studies use individual patent application or grant data,
matched with firms. Only one study (Kim, Lee and Marschke 2004) uses panel data
(inventors by application/grant years), as ours. All of these studies estimate the
coefficients of PhDs or those of higher leanings. Mariani and Romanelli (2007) find a
fairly significant coefficient of a PhD inventor. Such inventor generates on average 21%
more patents than an inventor with a high school degree, while there is no significant
difference in the level of citations per patent. Kim, Lee and Marschke (2004) also find
that a PhD inventor has significantly more number of patent applications. Furthermore,
Hoisl (2007) find that a PhD inventor has no more number of patent applications over
its life-cycle, when the productivity measure takes into account the loss of invention
period above age 25. Schettino, Sterlacchini and Venturini (2008) find that patent
quality increase by 17% with higher level of education (university of PhD relative to
non-university degree). Note that these studies differ in choosing the base for a
comparison (high school vs. on-PhD), which prevents direct comparison.
(Table 1)
One substantive reason of the variations of the effect between these findings is
whether a study takes into account the delay in starting inventions caused by an
inventor attending higher educational institutions. Taking into account such delay
requires us to measure life-cycle patent applications and to assess how cumulative
applications by inventors differ by educational levels, controlling for cohorts or age.
4
Only Hoisl (2007) does that among the studies in Table 1. Thus, the other studies may
overestimate the effect of higher education on life-cycle productivity. The problem of the
delay in starting inventions may have become more serious with the increase of “the
burden of knowledge” (Jones 2008). Due to the increasing burden of knowledge,
increasingly longer period might have been required for a new PhD to absorb past
accumulated knowledge, but at the same time, the negative effect of late entry into
inventive work may be compensated by late exit. Thus, adopting a life-cycle perspective
is very important and we will explicitly analyze the delay of starting invention works by
an inventor attending a PhD program, as well as how the exit decision from inventive
work is influenced by educational levels.
The second substantive reason is different level of controls over omitted variables
which have correlations with education or ability. No studies in Table 1 controls for the
inventor ability. Hoisl (2007) controls for inventor knowledge sources, which is likely to
be correlated with level of education and ability (an inventor with PhD has better access
to external knowledge disclosed in literature). In fact, according to her study, this is one
of the few sources of the advantage of a PhD inventor. In addition, she also controls for
mobility which has a significantly positive coefficient for inventive productivity and a
PhD inventor is more likely to move.
The existing studies do not control for the type of the workplace: an independent
laboratory, laboratory attached to a manufacturing division, manufacturing division,
and software development division. The existing studies do not control for the stage of
the research: basic research, applied research, development, technical service and the
other. However, the workplace and the project type are likely to affect significantly the
productivity. The laboratory dedicated to research is more likely to provide assets
conducive to inventions and patenting. In additions, basic research is likely to generate
more patents than development, while a PhD inventor is more likely to be employed in
such stage of research. We take into account the characteristic of workplace and the
research stage.
There are many empirical literatures on research productivity of scientists. Although
some of the basic findings from these literatures would be relevant to corporate
inventors, it is important to note that they work in the environment quite different from
that for university scientists. One of the basic findings from the research on scientists’
productivity is that the research productivity is highly skewed, with a relatively small
number of scientists accounting for a significant share of the publications. One
important source for such skewedness is cumulative advantage due to “Matthew effect”
or preferential attachments (see Merton 1968, Allison and Stewart 1974).

5
Second, as human capital theory predicts, the scientist’s productivity initially rises
but then declines with age/experience. Diamond (1984) investigates relationship
between age and the number of research publication among mathematician, and find
inverted U-shape relation over the life-cycle. Levin and Stephan (1991) also find that
inverted U-shape over the life-cycle are observed among Physics and Earth Science
except particle physics. Oster and Hamermesh (1998) and Baser and Pema (2004) find
that publications increase with age or experience at the early stage but sharply decline
with them among economists. Recently, Turner and Mairesse (2005) investigate the
relationship age and publications in French physician and find inverted U-shape is
observed in their academic life-cycle5. We employ a similar econometric model which
accommodates inverted U-shape relation over the life-cycle. However, in the context of
corporate inventors, the decline of productivity with age may be caused by the changes
of the main tasks of an inventor within a firm from invention to management, so that
we cannot adopt the human capital theory for interpreting the results.
An alternative to estimating patent production function is to use wage as
performance measures, following the tradition of Becker (1965) and Mincer (1974)
traditions. Some recent surveys on the relationship between education and wage
suggest that MA degree and PhD degrees holders earn more 10% to 30% higher wage
than undergraduate (Card 1999, and Deere and Vesovic 2006). In Japanese case,
Morikawa (2012) find the workers who have MA holders or more get approximately 20%
higher wage premium than the worker who have BA or less. However, corporate
inventors are not directly rewarded through wages for their inventive outputs.
Employee inventors receive more or less fixed salaries while transferring the ownership
to the companies. In addition, there are significant intrinsic benefits to the inventive
work, which makes wage undervalue the inventive performance. Thus, wage may not be
very informative on invention performance.
3. Data description 3.1 Data
We focus the industrial inventors who responded to the RIETI Inventor Survey in
2007, which surveyed the Japanese patent inventors selected by quasi-random
sampling6. The questionnaire of this survey covered not only inventive process and the
5 It is important to note, however, that identifying the age effect requires strong prior assumptions on cohort and year effects, as clarified by Hall, Mairesse and Turner (2007). 6 A large part of the focal patents are selected in triadic patents, which somewhat skewed for high quality patents, and this indicate that respondent inventors also are skewed for potentially high ability. For sampling method in more detail, please see Nagaoka and Tsukada (2007).

6
use of the patents but also the inventor profiles: year of birth, gender, the first employed
year, highest education and the graduate year. The number of inventors who effectively
responded this survey is 5,278. We gathered all patents which include respondent
inventor names in the inventors name list, in order to obtain the life-cycle inventive
profile of these inventors. We use IIP patent database, for Japanese patent bibliographic
data, as offered by Institute of Intellectual Property, which cover patent applications
from 1964 to 2009.
We have then identified which patents are truly invented by the respondents. Our
name matching method is basically manual inspect, as follow7. First, we collected the
patents whose inventors’ name appears in our inventors’ data and we collected 386,828
patents with matched names by this procedure. In order to avoid treating the different
inventor as the same person, we use only the patent applications whose inventor
belongs only to one particular company (His name appears only under one particular
company name and under no others over his life time). This is a very exact name
matching strategy because the probability which the different persons who have the
same name appears only in the same particular company (and nowhere else) is quite
low8. While this procedure makes us to lose all inventors who moved from one company
to another, this introduces no serious bias for us to evaluate the effects of educations on
life cycle invention performance. Rather it is suitable to our analysis because we focus
on the inventors which stayed in the same company until his retirement, which has
been also quite typical in Japan9. This has additional advantage for defining the
experience of an inventor clearly and to treat the impact of firm characteristics largely
by fixed effects.
We have 1,978 inventors and their corresponding patents after this screening. We
further screened by the condition (the sample size was reduced to 96.3 % of the above
sample) the first invention age is no younger than the age when the inventor was
employed first time. We can offer some evidence that our matching worked reasonably
7 Generally, name matching of inventors is a serious obstacle for undertaking a research based on life cycle invention performance. Fortunately, Japanese names have a lot of variety both in family name and in the first name, compared to the other Asian countries. For example, the most frequently used name is Minoru Tanaka in the overall Japanese telephone directory database in 2001 (This directory covers 40 million names which amounts to about 1/3 of overall Japanese population. In addition, the telephone directory covers a worker and a man more intensively.), and his frequency is only 2,620 in 30,552,849 people. Even though, the distribution of the frequency of name is highly skewed, almost all names have low probability for covering different persons under the same name. This is an advantage for Japanese researchers to do name-matching. 8 To identify whether an inventor belong to one company or not, we use patent applicant database provided by Onishi et al. (2012). 9 Since inventor mobility is larger in smaller firms, our sample is somewhat biased to large companies. Our sample of inventors is skewed to the inventors belonging to a large company (91% of our inventors have more than 500 employees).
7
well. We collected the first application years by the additional survey and 480 inventors
responded in our selected samples. 86% of them are roughly consistent with the
patenting record (3 years before or after the stated application year). Some gap is not
surprising because patent application procedure is not inventors’ task but that of an IP
office or a patent attorney, and this survey is a retrospective survey which may pick up
some errors.
3.2 Explanations of output indicators
We use the number of application as an indicator of each person’s innovative output.
However, almost all patent applications involve multiple inventors, and a whole patent
count which attributes each patent to each inventor regardless of the number of
inventors inflates a team oriented output. In order to cope with this problem, we use
fractional counts as one patent divided by the number of inventors as our main
indicator10.
In addition, we construct the number of forward citations which each patent received
from the other patents, so as to build the data on quality-adjusted outputs. The number
of forward citations is correlated with patent quality (For example Haroff, Scherer and
Vopel 2003, Hall, Jaffe and Trajtenberg. 2005). In Japan, there was no need for an
applicant to report the prior art only until 2000, so that we use only the citation count
by examiner, so as to ensure consistency of our indicator over time. Lastly, to cope with
the truncations of forward citations, we count the number of forward citations which the
patent received within five years after the applications.
As shown in Figure 1, the life-cycle number of patents per an inventor (fractional
counts) follows almost a log-normal distribution. That is, it has a highly skewed
distribution where most inventors have a relatively small number of patent applications,
as pointed out by Narin and Breitzman (1995) for industrial inventors in a few firms.
The average is 9.1 patents. Similarly, the number of citations received from the date of
applications also follows an almost a log-normal distribution (in Figure 2). The average
for an inventor is 16.8 times in total for all his patent applications.
(Figure 1 and 2)
4. Estimation models and methodology 4.1 Cross section estimation based on cumulative outputs
10 We show the results based on whole counts in appendix tables.
8
We first use cross sectional data, with the cumulative counts of the patents and their
forward citations (within the first 5 years) for each inventor as dependent variables. The
estimation equation is as follow:
ln ∑ (1)
Here the dependent variables are the natural logarithm of the number of patent
applications or the number of forward citations received by inventor i, and these two
variables are constructed by whole or fractural counts. The dependent variables are
transformed into natural logarithmic forms because the distributions of these variables
follow approximately log-normal distributions. Education dummies indicate each
inventor’s level of education. X is a vector of control variables (see the following
explanations). To control for inventor ability, we introduce a T-score of a university from
which the inventor graduated. It is a normalized score measuring the difficulty of
university entrance examination. Equation (1) does not introduce the length of an
inventor’s active span, so that the coefficient of an explanatory variable (such as an
education dummy) reflects both its effect on annual productivity as well as that on the
length of inventive time span. We control for cohort years (our sample’s main cohorts
cover from 1946 to 1975 birth years), technology areas and firms (see the following
explanations in more detail).
In order to measure annual productivity, we utilize the following equation:
∑ 2
We use the following two measures of the denominator (inventive span); the first one is
from the year in which the inventor got employed to the last year when he invented in
our dataset11, the other is from eighteen years old to the last year when he invented.
The former measures inventors’ productivity in terms of their actual employment spans.
The latter is a life-cycle productivity, taking into account the opportunity cost of
attending to the schools for BA degrees or more.
Educational level: This is our key variables which are composed of the BA degree
dummy, the MA degree dummy, regular PhD degree dummy and PhD degree with
dissertation only dummy, which is assigned according to the questionnaire which asked
11 Last year of inventive span is truncated by the patent data limitation. In order to control for this, we use cohort dummy as independent variables as explained bellow.
9
the highest degree at the time of the invention12. The reference group is high school
diploma or two year college degree. We will investigate how different levels of
educations as measured by these variables contribute to inventive productivity after
controlling for the characteristics of workplace, inventor motivations, technological
areas and inventor ability. One of our main focuses is the comparison between regular
PhD and PhD (DO) degree. If two types of PhDs perform similarly as corporate
inventors, it would suggest that university education does not significantly matter,
except for its screening role. If PhD (DO) performs significantly worse than regular PhD,
it would imply that additional graduate education effectively compensate for late of
beginning of invention by an inventor with a regular PhD13.
Next, we explain control variables, and these variables consist of the characteristics
of workplace, firm characteristics, personal motivations and profiles, and technology.
Workplace: We use workplace variables to indicate which type of a unit in the firm the
inventor belonged to when they invented the focal patent, which are categorized as
follow; independent laboratory, laboratory attached to manufacturing division, software
development division, manufacturing division, and other division. We use
manufacturing unit as the reference group. These variables give us important
information on how much an inventor can devote his time on invention and how much
complementary assets he has for his inventive work. We assume (somewhat boldly) that
an inventor does not significantly change the type of workplace over his career.
Research stage: The research stage of the project subject to our survey are also
employed as control variables. The questionnaire asked the inventor to identify the
research stages, which are categorized as basic research, applied research, development,
technical service and others (multiple choices are allowed). We assume (somewhat
boldly) that an inventor does not significantly change the stage of his research project
over his career.
Firm fixed effects and firm patent applications: We control for the firm characteristics
extensively by firm dummies or firm fixed effects, which cover the complementary
12 To identify these two types of PhDs, we used Doctoral Dissertation Bibliographic Database which is provided by National Diet Library and National Institute of Informatics. 13 Another potential interpretation is low standard for PhD (DO). However, there seems to exist no unanimous view on the level of standard for PhD (DO) vs. that for regular PhD.

10
assets, the internal knowledge stock etc. In addition, we introduce the natural
logarithm of the number of patent applications by the firm each year. This variable
controls for firm size change as well as the changes of patent application propensity
over time.
Motivation: The questionnaire asked the inventors about the importance of their
motivations for invention; taste of scientific contributions, challenges, contribution to
firm performance, career step, better working conditions, and pecuniary motivation.
This was assessed by five points Likert scale (very important, important, indifferent,
not important, absolutely not important). If their answer is very important or important,
this variable is one, and otherwise zero.
Gender: We use gender of inventor as independent variables, and if the inventor is
male, it is given one and otherwise zero.
Technological dummies and cohort dummies: to control for time-invariant
characteristic of technological areas, we include technological area dummies, which is
determined by the most frequent IPC class of the patent applications by each inventor14.
Lastly, to control for cohort effect on patent productivity, including truncation effects of
our data set, we include cohort dummies in our estimation equation.
T-score: We use T-score of a university as an indicator variable of inventor ability15.
Unfortunately, our sample is reduced when we use this variable because T-score is
available only for the inventors with higher than university degree. We obtained this
data offered by Kawai-jyuku which is one of the largest preparatory school in Japan16.
Table 2 provides the descriptive statistics of these variables. The length of average
inventive span based on the first employed year as the initial year is 20 years, and this
is quite long period, compared to the data used in previous similar analysis. 98 per cent
of our sample is male, and 70 per cent of inventors belonged to independent research
laboratory and worked for development. 14 We construct dummy variables in accordance with IPC sub-class. As the results, the number of technological dummies is 258. 15 This variable may be partly education quality indicator for university education because high T-score university is also high research university. Therefore, the effect of level of education on patent outputs may be underestimated with T-score variable. 16 We deduct 5 points from T-scores with private universities because T-scores with private university which imposes fewer exam subjects on examinees tend to higher than their originals compared to national university
11
(Table 2)
Table 3 shows the means of major variables by educational level. There are significant
mean differences between levels of educations with regard to all of four patent outputs.
Both types of PhD holding inventors largely belong to independent laboratory (84% for
inventors with regular PhDs and 95% for inventors with PhD (OD)). Their projects often
cover basic research (46% for inventors with regular PhDs and 48% for inventors with
PhD(OD)), compared to other education level. In these two respects two PhDs are very
similar. On the other hand, the average length of the inventive span is around 7 years
longer for inventors with PhD(OD)) than for those with regular PhDs (25 years vs. 18
year). Since the difference of birth years is only 2 years, longer inventive span of the
inventors with PhD (DO) is due to later exits of the inventors with PhD (DO) from
inventions. While cumulative patent outputs are similar between the two types of PhD
holding inventors, the annual productivity of the inventors with regular PhDs is
significantly higher than those with PhD(OD)17 . Furthermore, PhD (DO) holders
graduated from the universities with the highest T-score, indicating that that these
inventors have high potential ability.
(Table3)
4.2 Panel estimation
Next, to investigate the determinants of life-cycle inventive profile within a firm, we
estimate a panel estimation model. This also has a merit of allowing us to control for
unobserved heterogeneity (such as ability) among inventors. Even though fixed effect
model is suited for this, this model does not allow us to estimate the effect of
time-invariant education level. In order to cope with this problem, we employ
Hausman-Tayler random effect model (Hausman and Talyer 1981). We can identify the
effect of the variables which are potentially correlated with unobserved individual effect
by using exogenous variable as instruments after fixed effect estimation. That is,
instrumental variables are composed of the exogenous time-variant and time-invariant
variables in the equation, but which are not correlated with unobserved individual
17 While means of the annual productivity of PhD(DO) holders are same as those of BA holders, differentiation of both inventors are much larger after controlling technological dummies in the estimation results as bellow mentioned. This reason is that PhD(DO) holders in the sample often belong to chemical or medical science area which are fewer patent applications compared to IT or electronics area.
12
effect. We estimate inventor’s life-cycle productivity profile as follows:
ln ∑
(3)
Here the dependent variables are the natural logarithm of fractional patent and
forward citation counts for inventor i in year t where t represent year dummies18. In
this equation, we assume that level of education and experience are independent.
However, it may be unlikely that an inventor with only high school diploma has the
same experience curve as the workers with PhD degrees. Thus, our second specification
is as follow:
ln ∑ ∑ ∗
∑ ∗
(4)
In this equation, we can differentiate inventive productivity profiles between each
educational level by experiences. We treat level of education, experience and its square
as endogenous variables in Equation (3) and (4). While our control variables are
basically the same as Equation (2), the number of patent applications by each firm in
year t becomes time variant variable in Equation (3) and (4).
4.3 Estimation of exit of inventive activity
Finally, we will analyze how the personal and workplace characteristic as well as
levels of education are associates with an exit of an inventor from inventive activity. We
employ Cox Proportional Hazard model to estimate the hazard of exit from inventive
activity, to take into account the truncations. We prepare the duration data starting
with the year which the focal patent was applied for, since there can be no observations
of exit before that year. We need to distinguish the exit and right side truncation of
patent data. Figure 3 gives the distribution of the last year when an inventor applied for
the patent. This indicates that the peaks of the distribution occur after 2005, and a lot of
inventors are truncated simply because their inventive activities have not yet been
reflected into the patent data (publication of patent applications and incorporation into
database). We decide to use the last year before 2004 as the actual exit year. In our view
this criteria is a conservative one.
18 In order to cope with zero count of patents, we add one in all dependent variables.
13
(Figure 3)
We specify the hazard function h(t) as follow:
∑ (5)
Here, isthe exit rate at time t when the inventors stopped their inventive activity,
and is the baseline hazard. All of covariates in exponential parts are shift
parameters of the hazard rate. We include education level, workplace, research stage,
motivation, gender, technological dummies and cohort dummies as time invariant
covariates. Furthermore, we also treat inventor's age and the age square as time
variant covariates. Since Japanese companies traditionally have implemented seniority
system, age might be important factor of exit. The other time variant covariates are the
average number of co-inventors with whom the inventor invented in his inventive span,
the number of patent applications by each firm in year t and year dummies.
5. Estimation results 5.1 Estimation results of cross sectional analysis
First we explain the major estimation results based on cross section cumulative
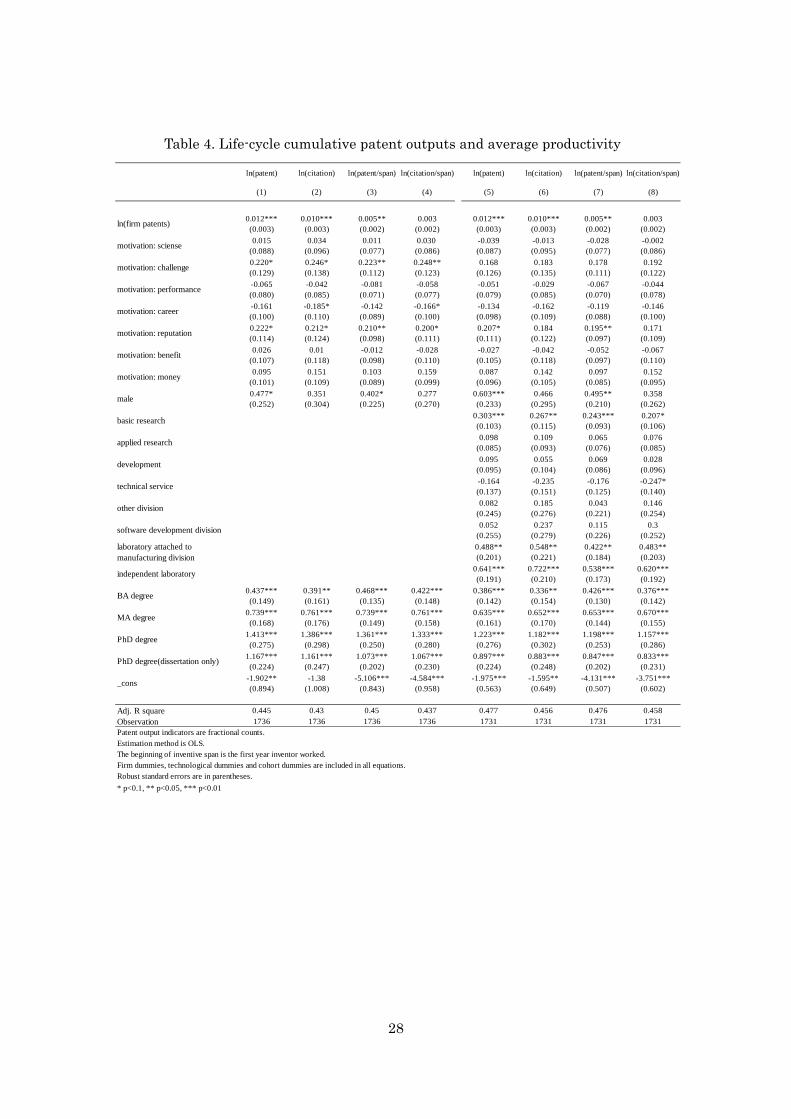
life-cycle outputs. Here the observations are individuals. Table 4 reports the regression
results from Equation (1) and (2), based on fractional counts19. The first year of
inventive activity is defined as the first employment year in these estimations. Columns
1 to 4 of Table 4 are the results without including the variables for workplaces and
research stages, and columns 5 to 8 are the results with all these variables.
(Table 4)
All coefficients of the levels of educations are significantly positive for the number of
patent applications and the forward citations, and the coefficients increases with the
level of education in all estimations. These results indicate that higher level of
education is indeed significantly associated with more patent and forward citation
counts. In particular, cumulative life-cycle patent applications and forward citations
19 The results of these estimations bases on whole counts of patent outputs are quite similar, as reported in Appendix Table 1.

14
productivity of inventors with regular PhD is 80% and 70% higher than those inventors
with master degrees, according to columns 5 and 620. The annual productivity of
inventors with regular PhD is also higher by 72% and 63 % respectively. In addition,
these differences are statistically significant in all equation21.
If we compare the inventors with regular PhDs and those with PhDs (DO), the
cumulative life-cycle productivity of the former group is 39% and 35% higher than those
of the latter in terms of patent applications and forward citations respectively (column 5
and 6) though these differences are statistically insignificant22. The annual productivity
of the former group are also higher than PhD (DO) inventors by around 42% for patent
applications and 38% for forward citations, according to column 7 and 8 though these
differences are not significant again23. The fact that the difference in cumulative
outputs in favor of inventors with PhDs is smaller than that in annual outputs indicates
that the active inventive span is longer for inventors with PhD (DO).
As for research stage, the coefficients of basic research are significantly positive for
patent outputs. Inventors who engage in basic research have 35% more patents and
28% more citations in terms of cumulative output and 31% more patents and 23% more
forward citations in terms of annual productivity. The difference between cumulative
output and annual productivity in favor of basic research suggests that an inventor
working in basic research tends to have a longer active life as an inventor (we will
confirm this more directly in the following estimation focusing on exit). Conversely,
technical service dummy is significantly negative for forward citations (a reduction by
25% for annual productivity).
The independent laboratory variable is also significantly positive for all output
variables. Similarly to basic research, inventors who work in independent research
laboratory have higher patent productivity in terms of both patent counts and citation
counts (90% and 71% respectively for life-cycle productivity and 100% and 66%
respectively for annual productivity). Thus, working in an independent research
laboratory significantly enhances research productivity.
As shown in Table 3, both types of PhDs significantly more work on the research
20 These results on education dummies are affected by the composition of cohorts in the sample since the effects of the delay of inventive activity due to attending additional school years are stronger for young inventors. To check this possibility, we estimated the interaction terms between cohort and education level. As a result, we obtained that the coefficient of regular PhD is still larger than the inventors with lower education levels even among younger inventors. The reason seems to be that inventive span is around ten years even for the youngest inventors who were born in 1971-1975. 21 F test for differences in coefficients between regular PhD and MA are 7.4 and 4.7 in columns 5 and 6, and 7.2 and 4.2 in columns 7 and 8. 22 F test for differences in coefficients between two PhDs are 0.9 and 0.6, respectively. 23 F test for differences in coefficients between two PhDs are 1.3 and 0.8, respectively.
15
project involving basic research and in an independent laboratory. Thus, as shown in
the comparison between columns 1 to 4 and columns 5 to 8, the coefficients of level of
educations in column 1 to 4 are larger than that of them in column 5 to 8 of Table 4
(around 20% higher in the case of a regular PhD). This suggests that we will
significantly overestimate the effect of education on patent outputs, without controlling
for the characteristics of research stages and workplaces, since a PhD (or PhD (DO))
inventor works more in the place favorable for doing research and in the type of project
generating more inventions.
Concerning individual characteristics, the male variable is significantly positive for
patent quantity in term of fractional counts (but not in whole counts). This gender
variable reflects unobservable effects such as childcare, maternity leaves, which are
associated with overestimate of male variable. Taste for challenging is significantly
positive for patent outputs in column 1 to 4. This may indicate that an inventor with
such taste is more likely to engage in a project at research frontier. A reputation
variable also is significantly positive for patent outputs. This may indicate that
inventors who want to get a positive reputation prefer explicit outputs such as patent
application.
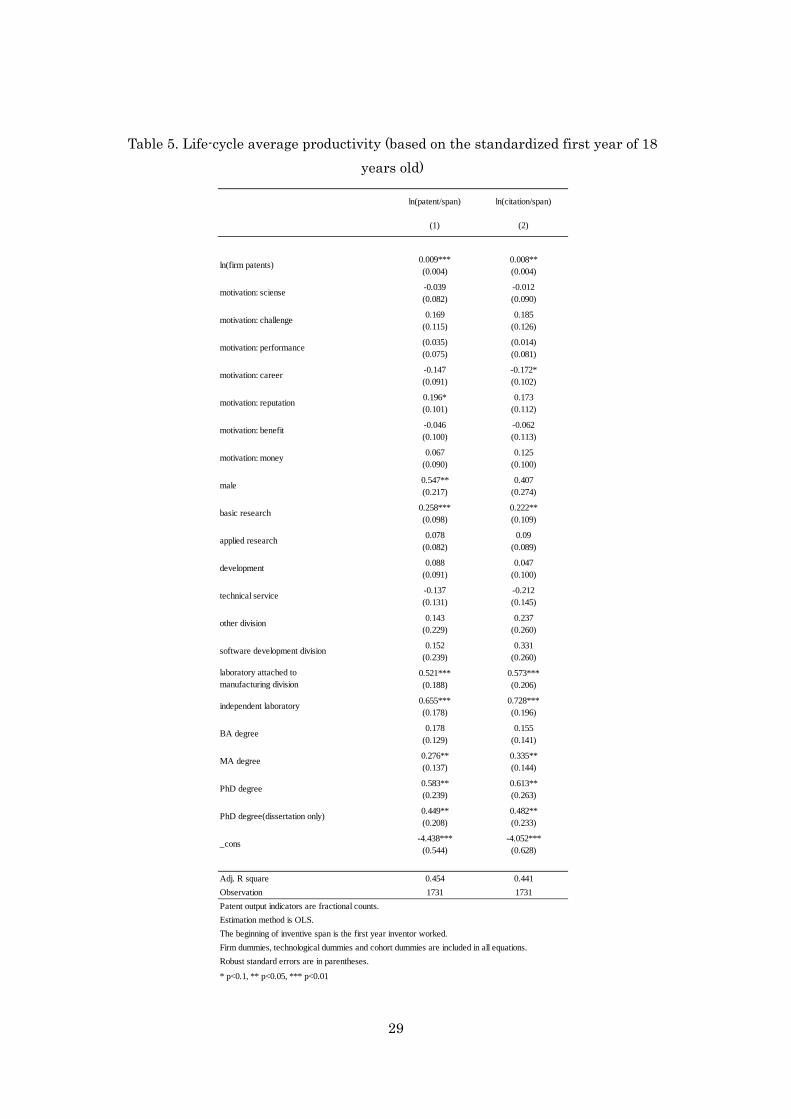
Table 5 presents the result of estimating Equation (2) with the beginning year of
inventive activity set at eighteen years old in order to count the delay due to higher
level of educations as opportunity costs in years. The coefficient of regular PhD
decreased most, so that they are much close to the level as that of PhD (DO). This
indicates that the delay of starting inventive work due to attending higher education is
significant but also shows a relatively high productivity of an inventor with a PhD (DO).
This result is consistent with Jones (1998).
(Table 5)
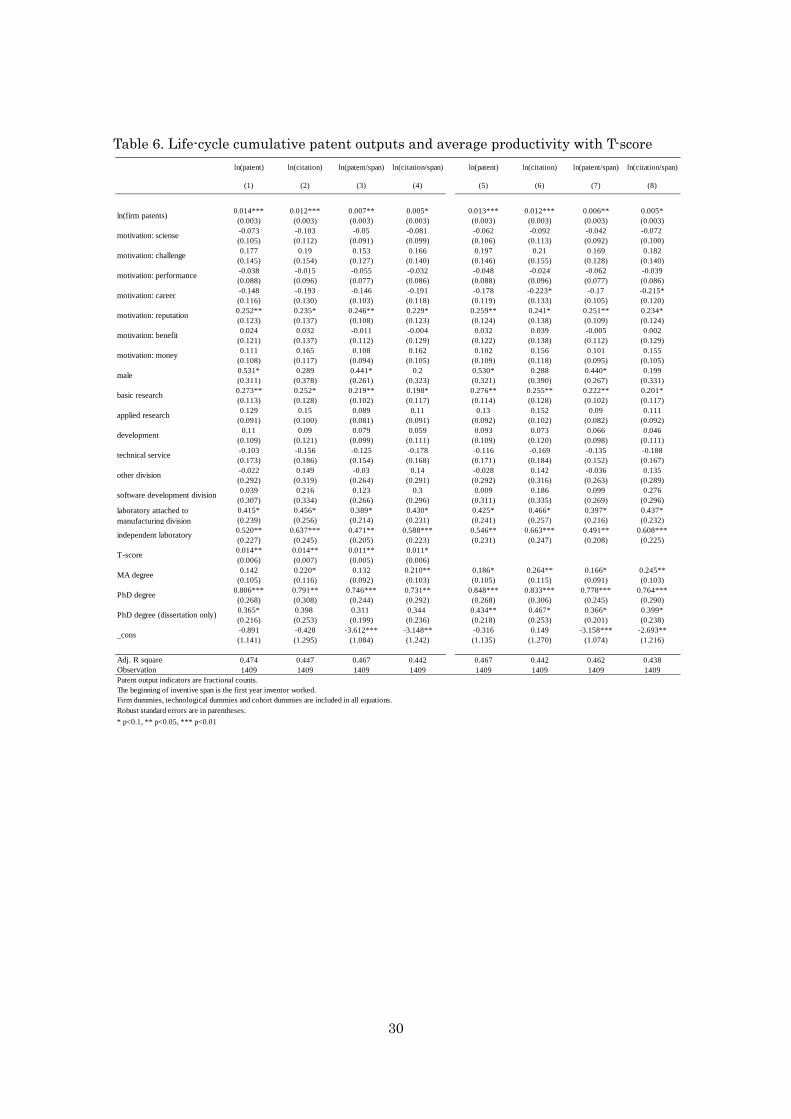
The effect of education level may be also overestimated in the above estimations since
they do not control for inventor's ability. An inventor with higher ability is more likely to
choose higher education. In order to address this possibility, we estimate Equation (1)
and (2) with adding a T-score variable as a control variable of inventor ability. In this
estimation we lose inventors with less than two year college from our sample. Columns
1 to 4 in Table 6 are the results with a T-score variable and columns 5 to 8 are those
without T-score variable. The coefficients of T-score are significant and positive for
patent outputs. This confirms the importance of inventor ability on patent productivity.
The comparison between two groups of the estimates suggests that the difference of
16
the coefficients of PhD and MA do not significantly change after including a T-score
variable, even though the size of the coefficients (with BA as the base) declines. These
results indicate that there is no significant inventor ability difference between MA and
PhD, while there are such difference between BA and MA. While the coefficients of
regular PhD remain significant and positive in all columns, the coefficients of PhD (DO)
are no longer significant except in column 5. However, the difference of the coefficients
between the two types of PhDs does not significantly change (slightly larger, with
T-score variable). These results indicate that controlling for the ability of inventors does
not significantly affect the difference between graduate degrees, while it reduces the
difference between the BA degree and graduate degrees.
(Table 6)
5.2 Estimation results based on panel data
Before estimating Hausman-Taylor random effect model, we regressed Equation (3)
and (4) with using Fixed effect model, and the results are shown in column 1 to 4 of
Table 7. The coefficients of experience are significantly positive while the coefficients of
square terms are significantly negative for both outputs in column 1 and 2.
Furthermore, these results have remained, after allowing for interactions between the
level of education and experience in column 3 and 4 while the interaction terms with the
square of experience are not significant at highest education levels. This result presents
that a simple inverted U-shape relationship between experience and patent
productivity is observed in each education level, especially in lower education level.
Using the estimation results, the experience yearly profile of patent and citation
counts by level of educations are shown in Figure 4 and 5. The slope of the PhD (DO) is
steeper than the other education levels24. This indicates a strong within-firm learning
curve for those who seek for a PhD while working and/or their increasing deployment to
the jobs dedicated to inventions.
(Table 7)
(Figure 4 and 5)
Table 8 shows that the results of Equation (4) with using Hausman-Taylor random
24 While we estimate Equation (4) with additional time variant dummy variable which is one if inventor obtains PhD (DO) degree and otherwise zero, this variable is not significant in any specifications.
17
effect model. As mentioned above, this method can estimate the time-invariant
variables after controlling for unobserved heterogeneity among inventors. Column 1 for
patent outputs and column 2 for citation output of Table 8 are estimated, with allowing
for the interaction effects between the level of educations and experience, using
Equation (4). As for the level of educations, both types of PhDs are significantly positive
for forward citations in column 2 while only regular PhD is significantly positive for
patent application in column 1. The fixed effect coefficient of regular PhD remains
higher than that of PhD (DO). Using the estimation results, the experience yearly
profile of patent and citation counts by level of educations are shown in Figure 6 and 7.
The outputs in terms of both patents and forward citations are higher for a regular PhD
compared to a PhD (DO). This indicates that while a PhD (DO) increases its
productivity rapidly with its experience, the productivity of a regular PhD remains
higher than the PhD (DO) during its inventive span.
(Table 8)
(Figure 6 and 7)
In order to investigate the impact of receiving PhD (DO) in their inventive career
within a company, we estimate Equation (4) with separating PhD (DO) dummy at the
time of before and after receiving year of PhD (DO) degree. Column 3 and 4 in Table 8
show the results. While both PhD (DO) dummies are positively significant for both
patent outputs, there are no significant differences between two. This indicates that the
award of a PhD (DO) degree itself does not significantly affect the resources available
for the inventor or its position. It is already anticipated by the firm.
The above results indicate that regular PhD holders have significantly higher
research productivity than the other education levels. However, they also have the
potential loss of inventions in their younger period because of longer education terms.
How quickly can their high productivity compensate their potential loss in younger
period? To answer this question, we calculate when regular PhD inventors can recover
their potential inventive loss due to late startup, exploiting the learning time according
to the estimation results. We assume all inventors start their inventive activity
immediately after graduating in standard education time. That is, BA inventors begin
their inventive activity in age 23, MA inventors begin it in age 25 and regular PhD
inventors begin it in age 28. We additionally assume PhD (DO) inventors have MA
degree and beginning of their inventive activity is in age 25. This assumption

18
overestimates potential inventive loss of regular PhD inventors because the difference
between first job year and first invention year declines with education level (Table 9)25.
(Table 9)
Table 10 shows the average time to surpass total inventions of each education level
using the results in column 1 and 2 of Table 8. Cumulative invention of PhD inventors
surpass that of PhD (DO) inventors in approximately 4.6 and 5.3 years respectively, and
this time is somewhat shorter among BA and MA inventors. These results indicate that
PhD inventors recover their potential invention loss by at least 5.3 years on average.
(Table 10)
5.3 Estimation results of exit analysis
Table 11 shows the results of estimating the hazard model on exit from inventive
activity. Column 1 in Table 11 is estimated without research stages and workplaces
variables, and column (2) is estimated with full sample. Hazard rate of exit decreases
with higher level of education. The coefficients of both types of PhDs are negative and
significant for exit in column 2, and PhD (DO) has a lower hazard rate than regular
PhD. This indicates that the hazard rate of exit is 62% and 69% lower for regular PhD
and PhD (DO), compared to baseline, respectively. Moreover, hazard rate for PhD (DO)
is significantly negative even after controlling inventor ability in column 3 of Table 11.
This shows that if an inventor gets a PhD (DO) degree, he/she tends to stay longer as an
inventor. An award of PhD (DO) may help as a signaling/screening device, although it
may also capture residual inventor ability.
(Table 11)
The age coefficients of Table 11 show that the hazard rate (exit rate) is low in younger
stage, as expected. Moreover, the hazard rate increases drastically with age. This
indicates that while young inventors remain in research workplaces, they exit from
inventive works as they become more senior. Concerning the research stage, the hazard
of basic research is significantly low. Conversely, hazard of technical service for exiting
is significantly high. The coefficient of number of inventors is strongly significant and
25 We don't calculate "less than two year college" because it is composed of two groups which standard graduate years are difference.
19
positive for exiting. This result is somewhat interesting because an inventor in a big
team is more likely to exit from their inventive activities.
6. Conclusion This paper has analyzed life-cycle inventive productivity of Japanese industrial inventors, based
on the panel data of 1,731 inventors matched with firm data. We focused on two issues: whether
PhDs contribute to inventive performance, even taking into account their late start in
business careers, and whether the inventors with PhDs based only on dissertation
(PhDs (DO), for which a university performs only a certification function) similarly
productive as regular PhD inventors. We control for the types of work places, the types
of project (research stage), inventor motivations, firm fixed effects, cohort effects,
technology fields and inventor ability. We use the number of patent applications and the
total forward citations received within 5 years from the applied by these patents as
performance measures. Major findings are the following
1. The life-cycle productivity of PhD inventors in terms of both patent and citation
counts is significantly higher than those with less education even if they are late in
joining the firm, reflecting their high annual productivity. One source of high annual
productivity of PhD inventors is a short interval between the first job year and the first
invention year. The panel data estimates suggest that they also stay longer as
inventors.
2. The life-cycle productivity of a PhD (DO) inventor is lower than that of a regular
PhD inventor although the difference is not statistically significant. Our survey data
suggests that a PhD (DO) inventor works in an independent laboratory and in the
project involving basic research as frequently as a regular PhD does. The panel data
estimates suggest that PhD (DO) have a steeper “learning” curve and stay longer as
inventors, although there is no clear award effect. These results suggest that a system
of providing a PhD (DO) might have served as a kind of screening and signaling device
for encouraging high ability inventors to develop their careers as inventors. .
3. The Hausman-Taylor estimations suggest that higher productivity of regular PhD
inventors are robust to the possible correlation between unobserved heterogeneity of
inventor ability and the educational choice.
4. Inventor productivity is significantly higher when the inventors belong to the units
dedicated to research, the project involves a basic research and they inventors belong to
a large firm with large patent applications. Thus, productivity estimates without
20
considering these factors tend to significantly overestimate the productivity effect of
higher education.
Let us turn to the implications and remaining research agenda. Our research shows
that a regular PhD inventor is productive so that his late start in a business firm can be
easily compensated, even if we control for the fact that such inventor is more likely to be
assigned to a workplace, a project which generates patents more and their potential
abilities. This suggests that it would be worthwhile for a firm to recognize PhDs as
important human capital for the firm. We can also note that such inventors are more
likely to generate internal knowledge spillover within a company through absorbing the
external scientific knowledge.
However, this causes a new question why many PhDs are not able to find research
jobs in private sector despite of their high inventive productivity. There are various
candidate reasons for this. One possible reason is a selection bias of our study, that is,
PhDs have already got employed by companies in our sample, therefore our PhD sample
are the inventors who are matched to demand of company or are suitable to inventive
activity in private sector. This indicates that life-cycle productivity in our sample is
higher than average among PhDs. However, since this bias also lends itself well to other
education levels, there needs to be additional explanation to why only PhD holders are
highly selected.
A second potential reason is that there is an asymmetric information between PhDs
and companies in first job market. In Japan, the number of PhDs employed by
companies is quite low above mentioned. Therefore, since many companies have never
hired them, they not only don't know their productivity but also don't have system to
deal with them. This problem is maybe serious in Japan.
A third one is that inventive activity is not a unique task for corporate researchers.
Since they have various objectives, invention is only one task for them to do. For
example, they may accomplish their high productivity at the cost of linkage to
manufacturing section or leadership of research management. In this case, companies
are reluctant to hire PhD holders even if they have high inventive productivity.
Furthermore, many Japanese companies expected not only research ability but also
management skill for researchers and didn't prepare multiple career steps such as
continuing to inventive activity. This is consistent our results, that even regular PhD
holders cannot explicitly continue to their inventive activity. In this case, companies
don't employ research intensive people such as regular PhD holders.

21
Unfortunately, we do not have sufficient data to test these points is persuasive, and
this is one of our future tasks.
Our evidence also shows that a system of a PhD (DO) might have been a successful
system. Such PhD inventor is productive and stays longer as an inventor. Our evidence
suggests that a PhD (DO) inventor reveals his capability over time and will be able to
take more important inventive jobs over time. A PhD (DO) may play an important role
for such internal screening such transition (although we cannot detect a strong break at
the time of the grant of a PhD). A system of a PhD (DO) seems to provide an incentive
for an inventor to deepen his scientific understanding of the invention process under the
support of the firm. While the system of granting PhD (DO) is in the direction of being
phased out (especially due to the consideration of international recognition of a
Japanese degree), it would be important to absorb the positive aspects of such system in
the new graduate education system, especially a strong complementarily between the
industrial research and academic research for PhD (DO).
There are a number of research agenda. First, it would important to look into the
reasons why a PhD enhances research productivity. One potential source is effective
utilization of external scientific knowledge. Another could be a large team which such
inventor tends to participate, which works as a channel of internal knowledge flow. Our
measure may be partly biased due to the positive correlation between an omitted
individual fixed effect (ability) and educational choice, although our T-Score variable
and H-T estimation tried to control for. Second it would be important to further unpack
why the PhD (DO) inventor has high productivity, including the endogeneity of such
choice.

22
References
Agihon, P., L. Boustan, C. Hoxby and J. Vandenbussche, 2009. “The Causal Impact of
Education on Economic Growth: Evidence from U.S.,” Working Paper.
Allison, P.D. and J.A. Stewart, 1974. “Productivity differences among scientists:
evidence for accumulative advantage,” American Sociological Review 39(4),
pp.596–606.
Baser, O. and E. Pema, 2004. “Publications over the Academic Life-cycle: Evidence for
Academic Economists," Economics Bulletin 1(1), pp.1-8.
Becker, G.S. 1964. Human Capital, New York: Columbia University Press.
Card, D., 1999. “The Causal Effect of Education on Earnings,” in O. Ashenfelter and
D.Card eds. Handbook of Labor Economics 3, Elsevier, pp.1801-1863.
Cohen W.M. and D. A. Levinthal, 1989. “Innovation and learning: the two faces of R&D,”
The Economic Journal 99, pp.569-596.
Cyranoski D, N. Gilbert, H. Ledford, A. Nayar and M. Yahia, 2011. “The PhD factory,”
Nature 472(7343), pp.276-279.
Diamond, A.M., 1986. “The Life-Cycle Research Productivity of Mathematicians and
Scientists,” Journal of Gerontology 41, pp.520-25.
Donald, D.R. and J. Vesovic, 2006. “Educational Wage Premiums and the U.S. Income
Distribution: A Survey,” in Eric A. Hanushek and Finis Welch eds. Handbook of the
Economics of Education 1, Elsevier, pp.255-306.
Fox, J.T. and V. Smeets, 2010. “Does Input Quality Drive Measured Differences in Firm
Productivity?,” forthcoming International Economic Review.
Hausman, J.A., and W.E. Taylor, 1981. “Panel Data and Unobservable Individual
Effects,” Econometrica 49, pp.1377-1398.
23
Hall, B.H., A.B. Jaffe and M. Tratjenberg, 2005. “Market Value and Patent Citations.”
RAND Journal of Economics 36, pp.16-38.
Hall, B.H., J. Mairesse and L. Turner, 2007. “Identifying Age, Cohort, And Period
Effects In Scientific Research Productivity: Discussion And Illustration Using
Simulated And Actual Data On French Physicists,” Economics of Innovation and
New Technology 16(2), pp.159-177.
Harhoff, D., F.M. Scherer and K. Vopel, 2003. “Citations, Family size, Opposition and
the Value of Patent Rights.” Research Policy 32, pp.1343-1363.
Hoisl, K., 2007. “Tracing Mobile Inventors - The Causality between Inventor Mobility
and Inventor Productivity,” Research Policy 36(5), pp.619-636.
Hoisl, K., 2007. “A Closer Look at Inventive Output - The Role of Age and Career Paths,”
Munich School of Management Discussion Paper No. 2007-12.
Jones, B.F., 2009. “The Burden of Knowledge and the 'Death of the Renaissance Man': Is
Innovation Getting Harder?,” Review of Economic Studies 76(1), pp.283-317.
Kim, J., S.J. Lee and G. Marschke, 2004. “Research Scientist Productivity and Firm
Size: Evidence from Panel Data on Inventors,” Working Paper.
Krueger, A.B. and M. Lindahl, 2001. “Education for Growth: Why and for Whom?,”
Journal of Economic Literature 39(4), pp.1101-1136.
Levin S. and P. Stephan, 1991. “Research Productivity over the Life Cycle: Evidence for
Academic Scientists,” American Economic Review 81(1), pp.114-32.
Lotka, A.J., 1926. “The frequency distribution of scientific productivity, ” Journal of the
Washington Academy of Science 16 (2), 317–323.
Merton, R.K., 1968. “The Matthew effect in science,” Science 159, 56–63.
Morikawa, M. 2012. “Postgraduate Education and Human Capital Productivity in
Japan,” RIETI Discussion Paper 12-E-009.
24
Mincer, J, 1974. Schooling, Experience, and Earnings, New York, Colombia University
Press.
Mariani, M. and M. Romanelli, 2007. “'Stacking' and 'Picking' Inventions: The
Patenting Behavior of European Inventors,” Research Policy 36, pp.1128-1142.
Nagaoka, S. and N. Tsukada, “Innovation Process in Japan: Findings from the RIETI
Inventors Survey (in Japanese),” RIETI Discussion Paper 07-J-046.
Narin, F., Breitzman, A., 1995. “Inventive Productivity,” Research Policy 24 (4),
507–519.
OECD., 2010. Science, Technology and Industry Outlook 2010, Paris.
Onishi, K., Y. Nishimura, N. Tsukada, I. Yamauchi, T. Shinbo, M. Kani and K.
Nakamura, 2012. “Standardization and Accuracy of the Japanese Patent Applicant
Names, ” IIPR Discussion Paper No.2012-001.
Oster, S. M., D. S. Hamermesh, 1998. “Aging and Productivity among Economists,”
Review of Economics and Statistics 80(1), pp.154-56.
Schettino, F., A. Sterlacchini and F. Venturini, 2008. “Inventive Productivity and Patent
Quality: Evidence from Italian Inventors,” MPRA Paper 7765.
Serneels, P., 2008. “Human Capital Revisited: the Role of Experience and Education
When Controlling for Performance and Cognitive Skills,” Labour Economics 15(6),
pp.1143-1161.
Stephan P., 2011. How Economics Shapes Science, Harvard University Press.
Turner, L. and J. Mairesse, 2005. “Individual Productivity Differences in Public
Research: How important are non-individual determinants? An Econometric Study of
French Physicists' publications and citations. (1986-1997),” Working Paper.
Walsh P. J. and S. Nagaoka, 2009. “Who Invents?: Evidence from the Japan-US
Inventor Survey,” RIETI Discussion Paper 09-E -034.

25
Table 1 Existing studies
Quantity Citation Inventor Firm The others
Hoisl (2007)1)(Cumulative number of patent applications)/(age-25) ,PhD vs. high school or vocational training
insignificant NAAge, mobility, knowledge
sourcesFirm size
2409 German inventors, EPO patents (1977-2002)
Mariani andRomanelli (2007)
EPO patent application or grants in 1988-1998,PhD vs. high school
0.27 insignificant AgeFirm size and
number of patentsCo-inventors
793 inventors from Germany, Italy, TheNetherlands and the UK, EPO patents
(1988-1998)
(1)Firm size,capital intensity,
etc. (2)Fixed effects
Schettino, Sterlacchiniand Venturini (2008)
EPO patent applications (1991-2005),University or PhD relative to non-universitydegree
-0.13 0.17 Age, knowledgesourceFirm size and
number of patentsCo-inventors
743 Italian inventors,EPO partents(1991-2005)
Assuming an average level of the importance of literature as information source for the invention.Since their specification has the cumulative number of patents as an explanatory variable, the long-run effect of a PhD is larger than this coefficient.
AuthorsEffects of PhD in terms of elasticity Major Controls
Sample
Kim, Lee and
Marschke (2004)2) 0.07** NA Age, patent stocks Co-inventors US inventors, US patents (?)
Grants per year, PhD vs. nonPhD degree
Output measures, and comparison base

26
Table 2. Descriptive statistics
Variable name Obs. Mean Std. Dev. Min Max
ln(patent) 1731 2.17 1.31 -2.48 5.96
ln(citation) 1731 2.80 1.40 -2.48 6.49
ln(patent/span) 1731 -0.74 1.18 -5.41 2.53
ln(citation/span) 1731 -0.11 1.29 -5.41 3.39
inventive span 1731 20.05 7.85 2.00 54.00
birth year 1731 1961.37 7.01 1946 1975
ln(firm patents) 1731 119.60 55.08 1.39 303.48
motivation: science 1731 0.58 0.49 0.00 1.00
motivation: challenge 1731 0.89 0.32 0.00 1.00
motivation: career 1731 0.29 0.46 0.00 1.00
motivation: reputation 1731 0.18 0.39 0.00 1.00
motivation: benefit 1731 0.18 0.38 0.00 1.00
motivation: money 1731 0.23 0.42 0.00 1.00
male 1731 0.98 0.14 0.00 1.00
basic research 1731 0.18 0.38 0.00 1.00
applied research 1731 0.34 0.47 0.00 1.00
development 1731 0.71 0.46 0.00 1.00
technical service 1731 0.10 0.30 0.00 1.00
other division 1731 0.06 0.24 0.00 1.00
software development division 1731 0.04 0.19 0.00 1.00
laboratory attached to manufacturing division 1731 0.15 0.35 0.00 1.00
independent laboratory 1731 0.70 0.46 0.00 1.00
2 year college degree or less 1731 0.13 0.33 0.00 1.00
BA degree 1731 0.46 0.50 0.00 1.00
MA degree 1731 0.35 0.48 0.00 1.00
PhD degree 1731 0.03 0.18 0.00 1.00
PhD degree(DO) 1731 0.03 0.18 0.00 1.00
T-score 1409 52.38 9.67 25.00 72.50
Patent output indicators are fractional counts.First year of "inventive span" is the year in which inventors enrolled their companes.

27
Table 3. Mean statistics by level of educations
2 year collegedegree or less
BA MA PhD PhD(DO)
1.73 2.15 2.30 2.52 2.47(1.41) (1.32) (1.24) (1.16) (1.31)
2.29 2.76 2.97 3.16 3.06(1.53) (1.38) (1.33) (1.27) (1.44)
-1.35 -0.78 -0.50 -0.32 -0.73(1.29) (1.17) (1.07) (1.04) (1.24)
-0.79 -0.16 0.16 0.33 -0.14(1.44) (1.25) (1.17) (1.19) (1.41)
23.71 20.35 17.99 18.48 25.25(9.14) (7.61) (7.15) (6.56) (5.98)
1960.12 1960.95 1963.04 1960.41 1955.29(8.01) (6.83) (6.50) (6.96) (5.40)
128.14 117.46 120.03 102.30 129.41(66.19) (55.79) (50.17) (37.12) (57.22)
0.97 0.98 0.99 0.96 0.98(0.16) (0.15) (0.12) (0.19) (0.13)
0.13 0.11 0.23 0.46 0.48(0.34) (0.31) (0.42) (0.50) (0.50)
0.28 0.27 0.42 0.54 0.57(0.45) (0.45) (0.49) (0.50) (0.50)
0.67 0.78 0.67 0.46 0.39(0.47) (0.41) (0.47) (0.50) (0.49)
0.20 0.11 0.08 0.05 0.04(0.40) (0.31) (0.26) (0.23) (0.19)
0.09 0.08 0.03 0.04 0.00(0.28) (0.27) (0.17) (0.19) (-)
0.05 0.05 0.02 0.02 0.00(0.23) (0.21) (0.15) (0.13) (-)
0.17 0.16 0.14 0.11 0.05(0.38) (0.36) (0.34) (0.31) (0.23)
0.54 0.66 0.77 0.84 0.95(0.50) (0.47) (0.42) (0.37) (0.23)
- 49.02 55.51 57.74 61.02(9.63) (8.34) (7.89) (5.49)
Inventive span is based on the first employed year as the initial year.Standard deviations are in parentheses.* p<0.1, ** p<0.05, *** p<0.01
other division***
software development division**
laboratory attached to manufacturing division
independent laboratory***
T-score***
technical service***
ln(patent)***
ln(citation)***
ln(patent/span)***
ln(citation/span)***
inventive span***
birth year***
log(firm patents)**
male
basic research***
applied research***
development***
28
Table 4. Life-cycle cumulative patent outputs and average productivity
ln(patent) ln(citation) ln(patent/span) ln(citation/span) ln(patent) ln(citation) ln(patent/span) ln(citation/span)
(1) (2) (3) (4) (5) (6) (7) (8)
0.012*** 0.010*** 0.005** 0.003 0.012*** 0.010*** 0.005** 0.003(0.003) (0.003) (0.002) (0.002) (0.003) (0.003) (0.002) (0.002)
0.015 0.034 0.011 0.030 -0.039 -0.013 -0.028 -0.002(0.088) (0.096) (0.077) (0.086) (0.087) (0.095) (0.077) (0.086)
0.220* 0.246* 0.223** 0.248** 0.168 0.183 0.178 0.192(0.129) (0.138) (0.112) (0.123) (0.126) (0.135) (0.111) (0.122)
-0.065 -0.042 -0.081 -0.058 -0.051 -0.029 -0.067 -0.044(0.080) (0.085) (0.071) (0.077) (0.079) (0.085) (0.070) (0.078)
-0.161 -0.185* -0.142 -0.166* -0.134 -0.162 -0.119 -0.146(0.100) (0.110) (0.089) (0.100) (0.098) (0.109) (0.088) (0.100)
0.222* 0.212* 0.210** 0.200* 0.207* 0.184 0.195** 0.171(0.114) (0.124) (0.098) (0.111) (0.111) (0.122) (0.097) (0.109)
0.026 0.01 -0.012 -0.028 -0.027 -0.042 -0.052 -0.067(0.107) (0.118) (0.098) (0.110) (0.105) (0.118) (0.097) (0.110)
0.095 0.151 0.103 0.159 0.087 0.142 0.097 0.152(0.101) (0.109) (0.089) (0.099) (0.096) (0.105) (0.085) (0.095)
0.477* 0.351 0.402* 0.277 0.603*** 0.466 0.495** 0.358(0.252) (0.304) (0.225) (0.270) (0.233) (0.295) (0.210) (0.262)
0.303*** 0.267** 0.243*** 0.207*(0.103) (0.115) (0.093) (0.106)
0.098 0.109 0.065 0.076(0.085) (0.093) (0.076) (0.085)
0.095 0.055 0.069 0.028(0.095) (0.104) (0.086) (0.096)
-0.164 -0.235 -0.176 -0.247*(0.137) (0.151) (0.125) (0.140)
0.082 0.185 0.043 0.146(0.245) (0.276) (0.221) (0.254)
0.052 0.237 0.115 0.3(0.255) (0.279) (0.226) (0.252)
0.488** 0.548** 0.422** 0.483**(0.201) (0.221) (0.184) (0.203)
0.641*** 0.722*** 0.538*** 0.620***(0.191) (0.210) (0.173) (0.192)
0.437*** 0.391** 0.468*** 0.422*** 0.386*** 0.336** 0.426*** 0.376***(0.149) (0.161) (0.135) (0.148) (0.142) (0.154) (0.130) (0.142)
0.739*** 0.761*** 0.739*** 0.761*** 0.635*** 0.652*** 0.653*** 0.670***(0.168) (0.176) (0.149) (0.158) (0.161) (0.170) (0.144) (0.155)
1.413*** 1.386*** 1.361*** 1.333*** 1.223*** 1.182*** 1.198*** 1.157***(0.275) (0.298) (0.250) (0.280) (0.276) (0.302) (0.253) (0.286)
1.167*** 1.161*** 1.073*** 1.067*** 0.897*** 0.883*** 0.847*** 0.833***(0.224) (0.247) (0.202) (0.230) (0.224) (0.248) (0.202) (0.231)
-1.902** -1.38 -5.106*** -4.584*** -1.975*** -1.595** -4.131*** -3.751***(0.894) (1.008) (0.843) (0.958) (0.563) (0.649) (0.507) (0.602)
Adj. R square 0.445 0.43 0.45 0.437 0.477 0.456 0.476 0.458
Observation 1736 1736 1736 1736 1731 1731 1731 1731Patent output indicators are fractional counts.Estimation method is OLS.The beginning of inventive span is the first year inventor worked.Firm dummies, technological dummies and cohort dummies are included in all equations.Robust standard errors are in parentheses.
* p<0.1, ** p<0.05, *** p<0.01
MA degree
PhD degree
PhD degree(dissertation only)
_cons
technical service
other division
software development division
laboratory attached tomanufacturing division
independent laboratory
BA degree
motivation: money
ln(firm patents)
male
basic research
applied research
development
motivation: sciense
motivation: challenge
motivation: performance
motivation: career
motivation: reputation
motivation: benefit
29
Table 5. Life-cycle average productivity (based on the standardized first year of 18
years old)
ln(patent/span) ln(citation/span)
(1) (2)
0.009*** 0.008**(0.004) (0.004)
-0.039 -0.012(0.082) (0.090)
0.169 0.185(0.115) (0.126)
(0.035) (0.014)(0.075) (0.081)
-0.147 -0.172*(0.091) (0.102)
0.196* 0.173(0.101) (0.112)
-0.046 -0.062(0.100) (0.113)
0.067 0.125(0.090) (0.100)
0.547** 0.407(0.217) (0.274)
0.258*** 0.222**(0.098) (0.109)
0.078 0.09(0.082) (0.089)
0.088 0.047(0.091) (0.100)
-0.137 -0.212(0.131) (0.145)
0.143 0.237(0.229) (0.260)
0.152 0.331(0.239) (0.260)
0.521*** 0.573***(0.188) (0.206)
0.655*** 0.728***(0.178) (0.196)
0.178 0.155(0.129) (0.141)
0.276** 0.335**(0.137) (0.144)
0.583** 0.613**(0.239) (0.263)
0.449** 0.482**(0.208) (0.233)
-4.438*** -4.052***(0.544) (0.628)
Adj. R square 0.454 0.441
Observation 1731 1731
Patent output indicators are fractional counts.
Estimation method is OLS.
The beginning of inventive span is the first year inventor worked.
Firm dummies, technological dummies and cohort dummies are included in all equations.
Robust standard errors are in parentheses.
* p<0.1, ** p<0.05, *** p<0.01
MA degree
PhD degree
PhD degree(dissertation only)
_cons
development
technical service
other division
software development division
independent laboratory
BA degree
motivation: reputation
motivation: benefit
motivation: money
male
basic research
applied research
laboratory attached tomanufacturing division
ln(firm patents)
motivation: sciense
motivation: challenge
motivation: performance
motivation: career
30
Table 6. Life-cycle cumulative patent outputs and average productivity with T-score
ln(patent) ln(citation) ln(patent/span) ln(citation/span) ln(patent) ln(citation) ln(patent/span) ln(citation/span)
(1) (2) (3) (4) (5) (6) (7) (8)
0.014*** 0.012*** 0.007** 0.005* 0.013*** 0.012*** 0.006** 0.005*(0.003) (0.003) (0.003) (0.003) (0.003) (0.003) (0.003) (0.003)-0.073 -0.103 -0.05 -0.081 -0.062 -0.092 -0.042 -0.072(0.105) (0.112) (0.091) (0.099) (0.106) (0.113) (0.092) (0.100)0.177 0.19 0.153 0.166 0.197 0.21 0.169 0.182
(0.145) (0.154) (0.127) (0.140) (0.146) (0.155) (0.128) (0.140)-0.038 -0.015 -0.055 -0.032 -0.048 -0.024 -0.062 -0.039(0.088) (0.096) (0.077) (0.086) (0.088) (0.096) (0.077) (0.086)-0.148 -0.193 -0.146 -0.191 -0.178 -0.223* -0.17 -0.215*(0.116) (0.130) (0.103) (0.118) (0.119) (0.133) (0.105) (0.120)0.252** 0.235* 0.246** 0.229* 0.259** 0.241* 0.251** 0.234*(0.123) (0.137) (0.108) (0.123) (0.124) (0.138) (0.109) (0.124)0.024 0.032 -0.011 -0.004 0.032 0.039 -0.005 0.002
(0.121) (0.137) (0.112) (0.129) (0.122) (0.138) (0.112) (0.129)0.111 0.165 0.108 0.162 0.102 0.156 0.101 0.155
(0.108) (0.117) (0.094) (0.105) (0.109) (0.118) (0.095) (0.105)0.531* 0.289 0.441* 0.2 0.530* 0.288 0.440* 0.199(0.311) (0.378) (0.261) (0.323) (0.321) (0.390) (0.267) (0.331)0.273** 0.252* 0.219** 0.198* 0.276** 0.255** 0.222** 0.201*(0.113) (0.128) (0.102) (0.117) (0.114) (0.128) (0.102) (0.117)0.129 0.15 0.089 0.11 0.13 0.152 0.09 0.111
(0.091) (0.100) (0.081) (0.091) (0.092) (0.102) (0.082) (0.092)0.11 0.09 0.079 0.059 0.093 0.073 0.066 0.046
(0.109) (0.121) (0.099) (0.111) (0.109) (0.120) (0.098) (0.111)-0.103 -0.156 -0.125 -0.178 -0.116 -0.169 -0.135 -0.188(0.173) (0.186) (0.154) (0.168) (0.171) (0.184) (0.152) (0.167)-0.022 0.149 -0.03 0.14 -0.028 0.142 -0.036 0.135(0.292) (0.319) (0.264) (0.291) (0.292) (0.316) (0.263) (0.289)0.039 0.216 0.123 0.3 0.009 0.186 0.099 0.276
(0.307) (0.334) (0.266) (0.296) (0.311) (0.335) (0.269) (0.296)0.415* 0.456* 0.389* 0.430* 0.425* 0.466* 0.397* 0.437*(0.239) (0.256) (0.214) (0.231) (0.241) (0.257) (0.216) (0.232)0.520** 0.637*** 0.471** 0.588*** 0.546** 0.663*** 0.491** 0.608***(0.227) (0.245) (0.205) (0.223) (0.231) (0.247) (0.208) (0.225)0.014** 0.014** 0.011** 0.011*(0.006) (0.007) (0.005) (0.006)0.142 0.220* 0.132 0.210** 0.186* 0.264** 0.166* 0.245**
(0.105) (0.116) (0.092) (0.103) (0.105) (0.115) (0.091) (0.103)0.806*** 0.791** 0.746*** 0.731** 0.848*** 0.833*** 0.778*** 0.764***(0.268) (0.308) (0.244) (0.292) (0.268) (0.306) (0.245) (0.290)0.365* 0.398 0.311 0.344 0.434** 0.467* 0.366* 0.399*(0.216) (0.253) (0.199) (0.236) (0.218) (0.253) (0.201) (0.238)-0.891 -0.428 -3.612*** -3.148** -0.316 0.149 -3.158*** -2.693**(1.141) (1.295) (1.084) (1.242) (1.135) (1.270) (1.074) (1.216)
Adj. R square 0.474 0.447 0.467 0.442 0.467 0.442 0.462 0.438Observation 1409 1409 1409 1409 1409 1409 1409 1409Patent output indicators are fractional counts.The beginning of inventive span is the first year inventor worked.Firm dummies, technological dummies and cohort dummies are included in all equations.Robust standard errors are in parentheses.
* p<0.1, ** p<0.05, *** p<0.01
MA degree
PhD degree
PhD degree (dissertation only)
_cons
technical service
other division
software development division
laboratory attached tomanufacturing division
independent laboratory
T-score
motivation: benefit
motivation: money
male
basic research
applied research
development
ln(firm patents)
motivation: sciense
motivation: challenge
motivation: performance
motivation: career
motivation: reputation
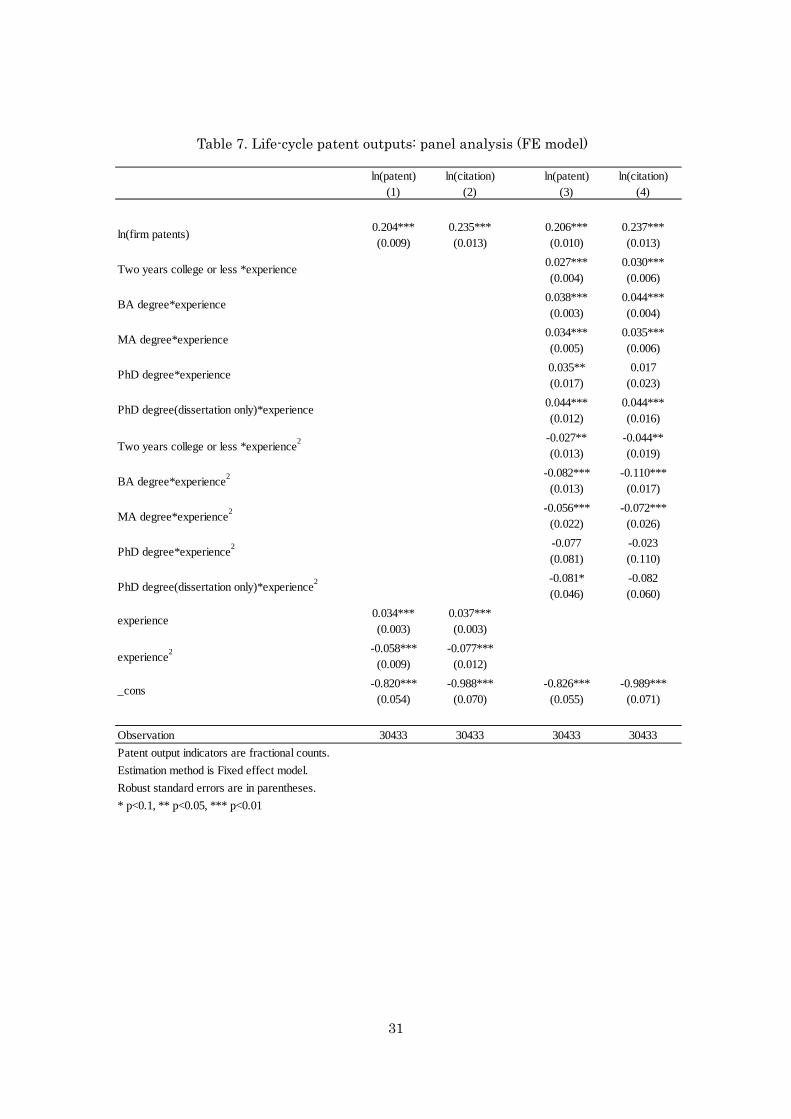
31
Table 7. Life-cycle patent outputs: panel analysis (FE model)
ln(patent) ln(citation) ln(patent) ln(citation)(1) (2) (3) (4)
0.204*** 0.235*** 0.206*** 0.237***(0.009) (0.013) (0.010) (0.013)
0.027*** 0.030***(0.004) (0.006)
0.038*** 0.044***(0.003) (0.004)
0.034*** 0.035***(0.005) (0.006)
0.035** 0.017(0.017) (0.023)
0.044*** 0.044***(0.012) (0.016)
-0.027** -0.044**(0.013) (0.019)
-0.082*** -0.110***(0.013) (0.017)
-0.056*** -0.072***(0.022) (0.026)
-0.077 -0.023(0.081) (0.110)
-0.081* -0.082(0.046) (0.060)
0.034*** 0.037***(0.003) (0.003)
-0.058*** -0.077***(0.009) (0.012)
-0.820*** -0.988*** -0.826*** -0.989***(0.054) (0.070) (0.055) (0.071)
Observation 30433 30433 30433 30433
Patent output indicators are fractional counts.
Estimation method is Fixed effect model.
Robust standard errors are in parentheses.
* p<0.1, ** p<0.05, *** p<0.01
_cons
ln(firm patents)
BA degree*experience2
MA degree*experience2
PhD degree*experience2
PhD degree(dissertation only)*experience2
experience
experience2
Two years college or less *experience
BA degree*experience
MA degree*experience
PhD degree*experience
PhD degree(dissertation only)*experience
Two years college or less *experience2
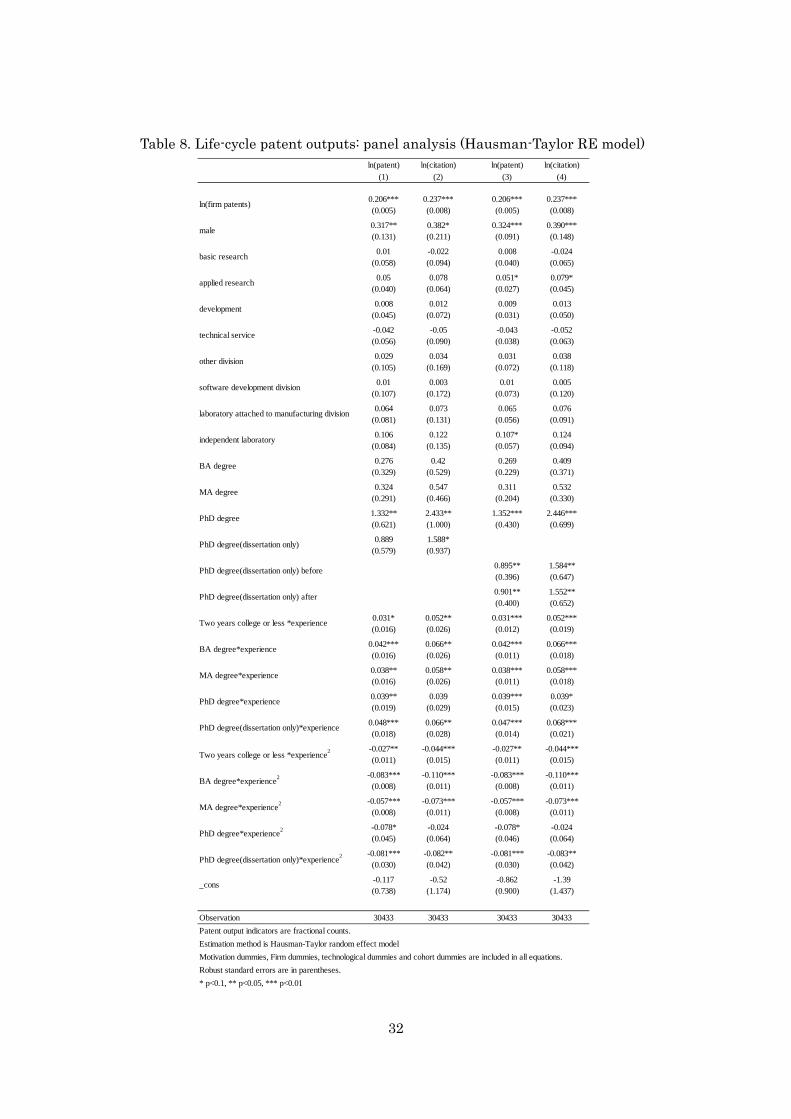
32
Table 8. Life-cycle patent outputs: panel analysis (Hausman-Taylor RE model)
ln(patent) ln(citation) ln(patent) ln(citation)
(1) (2) (3) (4)
0.206*** 0.237*** 0.206*** 0.237***(0.005) (0.008) (0.005) (0.008)
0.317** 0.382* 0.324*** 0.390***(0.131) (0.211) (0.091) (0.148)
0.01 -0.022 0.008 -0.024(0.058) (0.094) (0.040) (0.065)
0.05 0.078 0.051* 0.079*(0.040) (0.064) (0.027) (0.045)
0.008 0.012 0.009 0.013(0.045) (0.072) (0.031) (0.050)
-0.042 -0.05 -0.043 -0.052(0.056) (0.090) (0.038) (0.063)
0.029 0.034 0.031 0.038(0.105) (0.169) (0.072) (0.118)
0.01 0.003 0.01 0.005(0.107) (0.172) (0.073) (0.120)
0.064 0.073 0.065 0.076(0.081) (0.131) (0.056) (0.091)
0.106 0.122 0.107* 0.124(0.084) (0.135) (0.057) (0.094)
0.276 0.42 0.269 0.409(0.329) (0.529) (0.229) (0.371)
0.324 0.547 0.311 0.532(0.291) (0.466) (0.204) (0.330)
1.332** 2.433** 1.352*** 2.446***(0.621) (1.000) (0.430) (0.699)
0.889 1.588*(0.579) (0.937)
0.895** 1.584**(0.396) (0.647)
0.901** 1.552**(0.400) (0.652)
0.031* 0.052** 0.031*** 0.052***(0.016) (0.026) (0.012) (0.019)
0.042*** 0.066** 0.042*** 0.066***(0.016) (0.026) (0.011) (0.018)
0.038** 0.058** 0.038*** 0.058***(0.016) (0.026) (0.011) (0.018)
0.039** 0.039 0.039*** 0.039*(0.019) (0.029) (0.015) (0.023)
0.048*** 0.066** 0.047*** 0.068***(0.018) (0.028) (0.014) (0.021)
-0.027** -0.044*** -0.027** -0.044***(0.011) (0.015) (0.011) (0.015)
-0.083*** -0.110*** -0.083*** -0.110***(0.008) (0.011) (0.008) (0.011)
-0.057*** -0.073*** -0.057*** -0.073***(0.008) (0.011) (0.008) (0.011)
-0.078* -0.024 -0.078* -0.024(0.045) (0.064) (0.046) (0.064)
-0.081*** -0.082** -0.081*** -0.083**(0.030) (0.042) (0.030) (0.042)
-0.117 -0.52 -0.862 -1.39(0.738) (1.174) (0.900) (1.437)
Observation 30433 30433 30433 30433
Patent output indicators are fractional counts.
Estimation method is Hausman-Taylor random effect model
Motivation dummies, Firm dummies, technological dummies and cohort dummies are included in all equations.
Robust standard errors are in parentheses.
* p<0.1, ** p<0.05, *** p<0.01
MA degree*experience2
PhD degree*experience2
PhD degree(dissertation only)*experience2
_cons
BA degree*experience
MA degree*experience
PhD degree*experience
PhD degree(dissertation only)*experience
Two years college or less *experience2
BA degree*experience2
MA degree
PhD degree
PhD degree(dissertation only)
PhD degree(dissertation only) before
PhD degree(dissertation only) after
Two years college or less *experience
technical service
other division
software development division
laboratory attached to manufacturing division
independent laboratory
BA degree
male
basic research
applied research
development
ln(firm patents)

33
Table 9. Average age of first job and first patent invention
Table 10. Time required to compensate for the invention loss due to late start of
inventive activity by a regular PhD.
first job year (A) first invention year (B) (B) - (A)
21.16 29.74 8.58(4.77) (7.48) (7.28)
23.99 29.01 5.02(3.00) (5.49) (5.15)
25.24 28.15 2.91(2.54) (3.51) (3.92)
28.39 30.45 2.05(2.90) (3.83) (2.79)
26.07 29.98 3.91(3.12) (4.48) (3.78)
Standard deviations are in parentheses.
less than two year college
BA degree
MA degree
PhD degree
PhD degree(Dissertation only)
column 1 in Table 8 column 2 in Table 8
patent forward citation
BA degree 4.43 4.61
MA degree 3.43 3.51
PhD degree(dissertation only) 4.59 5.25

34
Table 11. The estimation of Cox Proportional Hazard Model
(1) (2) (3)
-0.108** -0.115*** -0.128**(0.044) (0.044) (0.054)
-0.338** (0.238) (0.209)(0.155) (0.155) (0.184)
(0.264) (0.224) (0.318)(0.209) (0.203) (0.253)
0.03 -0.002 0.106(0.143) (0.145) (0.163)
0.116 0.115 0.007(0.154) (0.154) (0.180)
0.124 0.115 0.201(0.196) (0.198) (0.228)
-0.025 0.065 -0.017(0.194) (0.191) (0.213)
0.083 0.095 0.115(0.160) (0.158) (0.174)
0.136 0.005 0.414(0.472) (0.478) (0.680)
1.351*** 1.394*** 1.388***(0.059) (0.059) (0.066)
-0.626*** -0.641**(0.219) (0.252)
-0.243 -0.188(0.166) (0.188)
0.014 0.103(0.181) (0.213)
0.452** 0.630**(0.214) (0.268)
0.535 0.154(0.371) (0.513)
0.828** 0.489(0.381) (0.494)
0.281 0.046(0.324) (0.444)
0.094 -0.142(0.309) (0.409)
-0.01(0.009)
-0.256 -0.227(0.208) (0.205)
-0.417* -0.289 -0.086(0.217) (0.213) (0.193)
-1.226** -0.958* -0.523(0.506) (0.512) (0.505)
-1.435*** -1.172** -0.873*(0.484) (0.494) (0.528)
-0.242*** -0.215** -0.289***(0.089) (0.092) (0.106)
0.003*** 0.003** 0.004***(0.001) (0.001) (0.001)
Log likelihood -3343.527 -3325.804 -2540.043
Observation 10447 10420 8512
Estimation method is Cox Proportional Hazard model.
Standard error are clustered by firms are in parentheses.
Technological dummies and cohort dummies are included in all equations.
Robust standard errors are in parentheses.* p<0.1, ** p<0.05, *** p<0.01
age2
T-score
BA degree
MA degree
PhD degree
PhD degree(dissertation only)
age
development
technical service
other division
software development division
laboratory attached tomanufacturing division
independent laboratory
motivation: benefit
motivation: money
male
ln(number of inventors)
basic research
applied research
ln(firm patents)
motivation: sciense
motivation: challenge
motivation: performance
motivation: career
motivation: reputation

35
Appendix Table 1. Life-cycle cumulative patent outputs and average productivity (whole counts)
ln(patent) ln(citation) ln(patent/span) ln(citation/span) ln(patent) ln(citation) ln(patent/span) ln(citation/span)
(1) (2) (3) (4) (5) (6) (7) (8)
0.011*** 0.009*** 0.004** 0.003 0.011*** 0.009*** 0.004** 0.002(0.003) (0.003) (0.002) (0.002) (0.002) (0.003) (0.002) (0.002)
0.024 0.069 0.02 0.065 -0.03 0.02 -0.02 0.03(0.084) (0.095) (0.073) (0.085) (0.082) (0.093) (0.072) (0.084)
0.194 0.219 0.196* 0.221* 0.132 0.142 0.141 0.151(0.129) (0.141) (0.111) (0.126) (0.124) (0.137) (0.109) (0.124)
-0.002 0.012 -0.018 -0.004 0.014 0.026 -0.002 0.01(0.076) (0.084) (0.067) (0.076) (0.074) (0.083) (0.066) (0.076)
-0.144 -0.168 -0.125 -0.149 -0.119 -0.143 -0.103 -0.128(0.097) (0.108) (0.086) (0.099) (0.095) (0.108) (0.085) (0.099)
0.181* 0.164 0.169* 0.152 0.157 0.124 0.144 0.111(0.109) (0.122) (0.093) (0.108) (0.106) (0.120) (0.092) (0.107)
0.039 0.037 0.001 -0.001 -0.019 -0.023 -0.044 -0.048(0.104) (0.117) (0.095) (0.109) (0.103) (0.118) (0.095) (0.110)
0.087 0.141 0.096 0.149 0.077 0.13 0.087 0.139(0.097) (0.108) (0.084) (0.097) (0.092) (0.104) (0.080) (0.094)
0.215 0.096 0.14 0.021 0.352 0.226 0.244 0.118(0.248) (0.321) (0.208) (0.283) (0.235) (0.310) (0.196) (0.272)
0.315*** 0.291** 0.255*** 0.231**(0.101) (0.115) (0.092) (0.106)
0.13 0.165* 0.097 0.133(0.081) (0.091) (0.072) (0.082)
0.056 0.035 0.029 0.009(0.091) (0.103) (0.083) (0.094)
-0.224* -0.301** -0.236** -0.313**(0.125) (0.143) (0.112) (0.131)
0.081 0.19 0.043 0.151(0.239) (0.275) (0.217) (0.254)
0.037 0.24 0.1 0.303(0.246) (0.277) (0.213) (0.246)
0.434** 0.495** 0.368** 0.429**(0.194) (0.223) (0.178) (0.205)
0.651*** 0.735*** 0.548*** 0.632***(0.187) (0.212) (0.169) (0.195)
0.399*** 0.368** 0.430*** 0.399*** 0.346** 0.311** 0.385*** 0.350**(0.144) (0.159) (0.130) (0.146) (0.136) (0.153) (0.124) (0.141)
0.743*** 0.779*** 0.743*** 0.779*** 0.624*** 0.652*** 0.642*** 0.670***(0.159) (0.172) (0.141) (0.156) (0.152) (0.167) (0.136) (0.152)
1.490*** 1.452*** 1.438*** 1.399*** 1.271*** 1.217*** 1.246*** 1.191***(0.258) (0.284) (0.235) (0.269) (0.260) (0.292) (0.240) (0.278)
1.233*** 1.226*** 1.138*** 1.132*** 0.923*** 0.905*** 0.873*** 0.856***(0.213) (0.239) (0.194) (0.224) (0.211) (0.240) (0.192) (0.226)
-1.189 0.358 -4.393*** -2.846*** -1.184** 0.267 -3.341*** -1.889***(0.779) (0.909) (0.734) (0.866) (0.549) (0.631) (0.502) (0.592)
Adj. R square 1736 1736 1736 1736 1731 1731 1731 1731
Observation 0.389 0.373 0.401 0.39 0.432 0.41 0.438 0.421
Patent output indicators are whole counts.
Estimation method is OLS.
The beginning of inventive span is the first year inventor worked.
Firm dummies, technological dummies and cohort dummies are included in all equations.
Robust standard errors are in parentheses.
* p<0.1, ** p<0.05, *** p<0.01
MA degree
PhD degree
PhD degree(dissertation only)
_cons
technical service
other division
software development division
laboratory attached tomanufacturing division
independent laboratory
BA degree
motivation: benefit
motivation: money
male
basic research
applied research
development
ln(firm patents)
motivation: sciense
motivation: challenge
motivation: performance
motivation: career
motivation: reputation
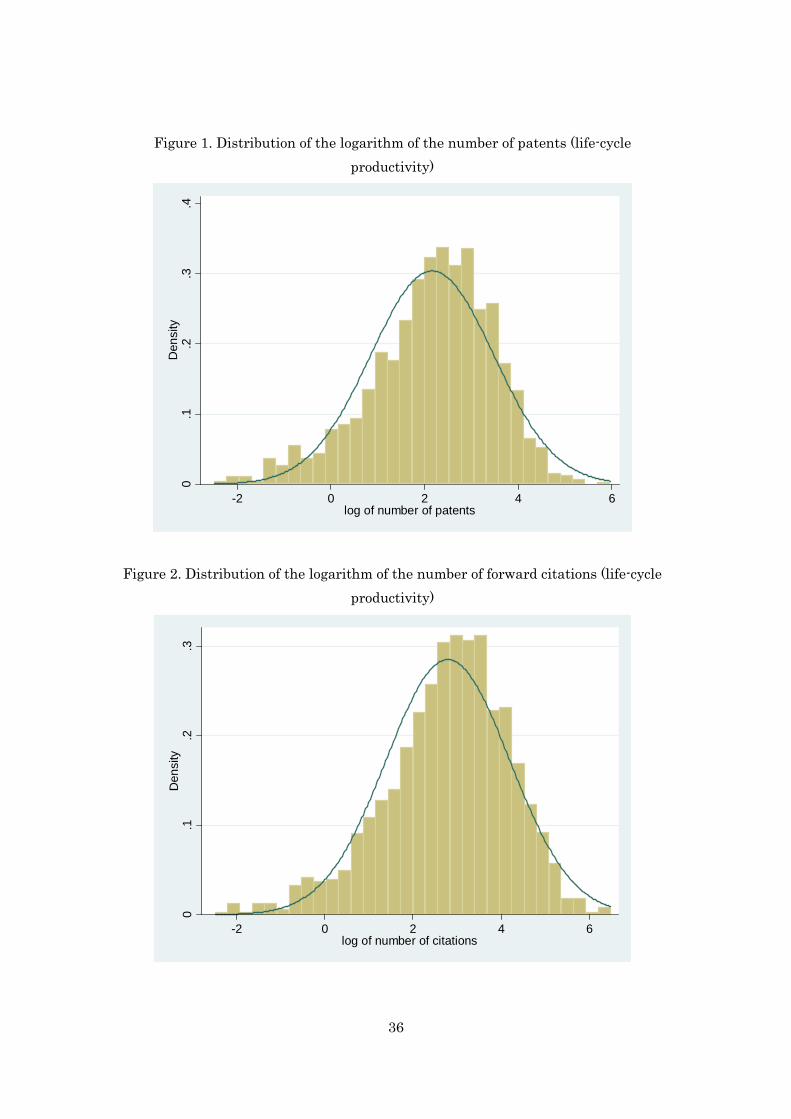
36
Figure 1. Distribution of the logarithm of the number of patents (life-cycle productivity)
Figure 2. Distribution of the logarithm of the number of forward citations (life-cycle productivity)
0.1
.2.3
.4D
ensi
ty
-2 0 2 4 6log of number of patents
0.1
.2.3
Den
sity
-2 0 2 4 6log of number of citations

37
Figure 3. Timing of “Exit” inventive activity by cohort groups
0
5
10
15
20
25
30
1995 1996 1997 1998 1999 2000 2001 2002 2003 2004 2005 2006 2007 2008 2009
1946
1947
1948
1949
1950
1951
1952
1953
1954
1955
1956
1957
1958
1959
1960
1961
1962
1963
1964
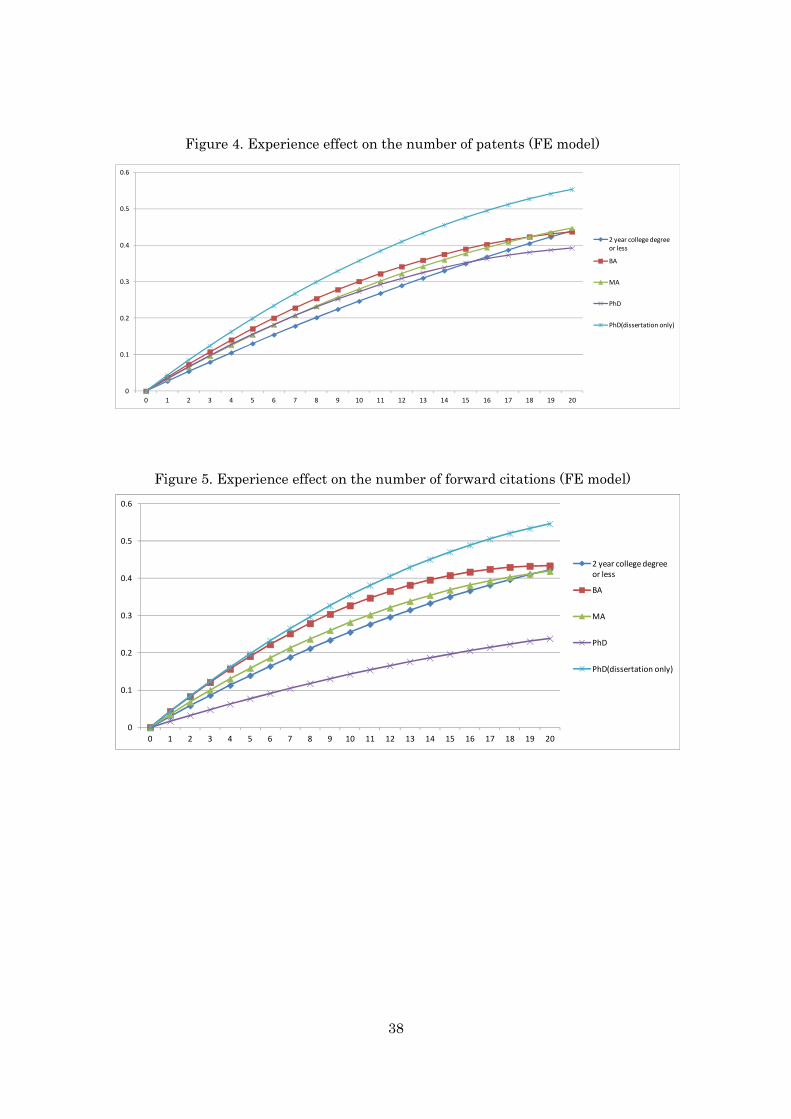
38
Figure 4. Experience effect on the number of patents (FE model)
Figure 5. Experience effect on the number of forward citations (FE model)
0
0.1
0.2
0.3
0.4
0.5
0.6
0 1 2 3 4 5 6 7 8 9 10 11 12 13 14 15 16 17 18 19 20
2 year college degreeor less
BA
MA
PhD
PhD(dissertation only)
0
0.1
0.2
0.3
0.4
0.5
0.6
0 1 2 3 4 5 6 7 8 9 10 11 12 13 14 15 16 17 18 19 20
2 year college degreeor less
BA
MA
PhD
PhD(dissertation only)

39
Figure 6. Experience effect on the number of patents (Hausman-Taylor RE model)
Figure 7. Experience effect on the number of forward citations (Hausman-Taylor RE model)
0
0.2
0.4
0.6
0.8
1
1.2
1.4
1.6
1.8
2
0 1 2 3 4 5 6 7 8 9 10 11 12 13 14 15 16 17 18 19 20
2 year college degreeor less
BA
MA
PhD
PhD(dissertation only)
0
0.5
1
1.5
2
2.5
3
3.5
0 1 2 3 4 5 6 7 8 9 10 11 12 13 14 15 16 17 18 19 20
2 year college degreeor less
BA
MA
PhD
PhD(dissertation only)


![Cooperation and Communication in Multiagent Deep ...larg/hausknecht_thesis/slides/thesis.pdf · Q-Learning is known to overestimate Q-Values [Hasselt ’16]. Several approaches have](https://img.pdfslide.us/doc/110x75/5ec6990d3f83e745073e87cb/cooperation-and-communication-in-multiagent-deep-larghausknechtthesisslidesthesispdf.jpg)