Embed Size (px)
Citation preview
4
Life-Cycle Monitoring and Safety Evaluation of Critical Energy Infrastructure Using Full-
Scale Distributed Optical Fiber Sensors
Zhi Zhou, Jianping He and Jinping Ou School of Civil Engineering, Dalian University of Technology, Dalian
P.R. China
1. Introduction
Critical energy infrastructure, such as huge oil depot and offshore platform, are inclined to
be seriously damaged by the coupling effects of environmental erosion and loading in long-
term service. The failure of these structures will cause large economic damage, huge
personnel loss and environmental pollution. Therefore, it is important to monitor and assess
the safety condition of these structures, so that they can be damage alarming and repaired in
time. The optical fiber sensing techniques, especially fiber Bragg grating (FBG) sensors and
distributed Brillouin fiber sensors, have the advantages of absolute measurement, anti-
electromagnetic interfere, high-durability over the conventional electrical sensors, and have
been widely applied in structural health monitoring (SHM)(OU and ZHOU,2003-2010;
NI,2009; CHAN,2006; INAUDI,2005; WU,2006;BAO,1994; FILIPPO, 2005;JIANG, 2006).
However, the development of applicable engineering optical fiber sensors and self-repairing
optical fiber sensing network to meet the requirements of the life-cycle monitoring and
safety evaluation for these infrastructure is not yet fully studied. In this chapter, some recent
advances are introduced for the full-scale distributed optical fiber based structural health
monitoring techniques for critical energy infrastructure in Dalian University of Technology
(DUT) of mainland China.
2. The engineering full-scale distributed optical fiber sensing technique
Critical infrastructure usually has a long service life, for example, the design service life of a oil reservoir is around 15 years and that of a large-scale bridge can be hundreds of years. In addition, sometimes, these critical structures may be suffering from harsh environments including high temperature, high mechanical strength, or high pressure. However, the present packaging methods for the OF sensors may not be able to meet the requirements of the life-cycle monitoring for these structures from the durability aspect. What’s more, the damages of the critical infrastructure could be substantial, deeply hidden and random. In this case, neither FBG sensors nor Brillouin sensors alone can provide effective monitoring to these structures. FBG sensors can only provide local information, and Brillouin sensors show low spatial resolution, low test accuracy, and high cost for strain and temperature measurements. In an effort of solving these problems, in this chapter, the fabrication of engineering optical fiber
www.intechopen.com

Fiber Optic Sensors
78
sensors, the optimization of measuring signals, and a novel multi-signal engineering collinear optical fiber sensing system are introduced. Fig. 1 shows the schematic of the SHM networks based on the newly developed optical sensing techniques including the sensor configuration, signal optimization and processing, and finally its applications.
Fig. 1. The sketch of the SHM techniques for major energy infrastructures
2.1 Multi-signal engineering collinear optical fiber sensing system
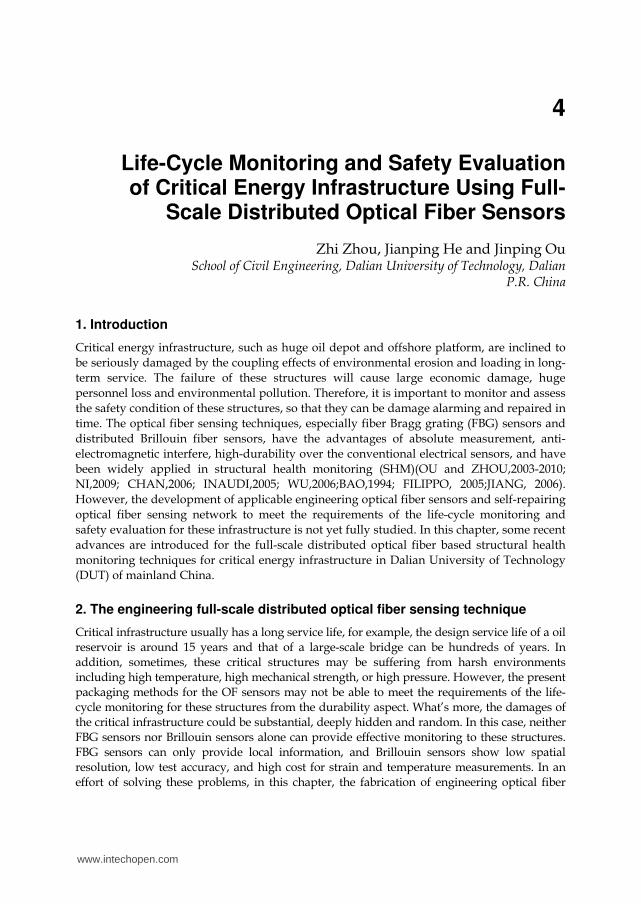
Combining the advantages of both distributed optical fiber sensors and local high-accuracy optical fiber sensors, a multi-signal engineering collinear optical fiber sensing system is proposed to provide local high-precision and full-scale distributed measurement simultaneously, shown as in Figure 2. The collinear system consists of distributed optical fiber sensing system and local optical fiber sensing system, light switcher or coupler and collinear optical fiber sensors. The distributed optical fiber sensing system includes Brillouin optical time domain analysis/refectometry (BOTDA/R) and Roman optical time domain refectometry (ROTDR). The local optical fiber sensing system, on the other hand, includes fiber Bragg grating and P-T sensing system. The collinear system can provide multi-signal by one sensor, which significantly reduces the cost of the sensor layout, and simplifies the layout process.
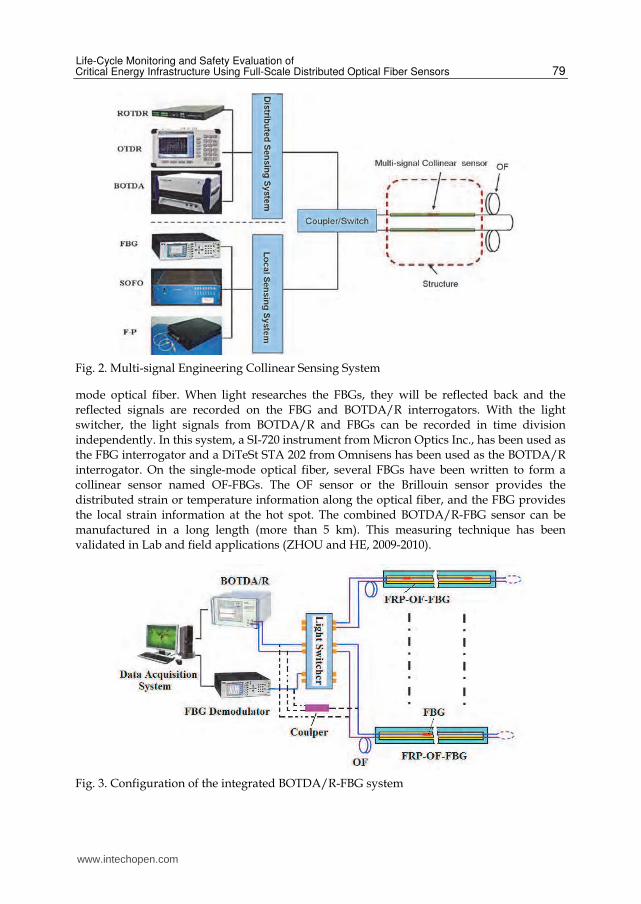
As such, an integrated global and local structural health monitoring technology with a single OF is proposed by combining the BOTDA/R for distributed strain measurement and the FBG for local high-precision strain measurement, as illustrated in Figure 3. Light comes out from the light source, comes up to the light switcher and travels through the single-
www.intechopen.com
Life-Cycle Monitoring and Safety Evaluation of Critical Energy Infrastructure Using Full-Scale Distributed Optical Fiber Sensors
79
Fig. 2. Multi-signal Engineering Collinear Sensing System
mode optical fiber. When light researches the FBGs, they will be reflected back and the reflected signals are recorded on the FBG and BOTDA/R interrogators. With the light switcher, the light signals from BOTDA/R and FBGs can be recorded in time division independently. In this system, a SI-720 instrument from Micron Optics Inc., has been used as the FBG interrogator and a DiTeSt STA 202 from Omnisens has been used as the BOTDA/R interrogator. On the single-mode optical fiber, several FBGs have been written to form a collinear sensor named OF-FBGs. The OF sensor or the Brillouin sensor provides the distributed strain or temperature information along the optical fiber, and the FBG provides the local strain information at the hot spot. The combined BOTDA/R-FBG sensor can be manufactured in a long length (more than 5 km). This measuring technique has been validated in Lab and field applications (ZHOU and HE, 2009-2010).
Fig. 3. Configuration of the integrated BOTDA/R-FBG system
www.intechopen.com

Fiber Optic Sensors
80
2.2 Optimization of distributed Brillouin measuring signals
FBGs use the broadband light source, but BOTDA/R uses a light source with a certain
wavelength of 1550nm. Thus the potential signal interactions may exist between the
BOTDA/R and FBGs signal, including interaction of the reflected light from different optical
light sources. In addition, FBGs are somehow regarded as damages on the single-mode
optical fiber. Their structures, typically the Bragg period, change with various mechanical
and thermal loading, resulting in a complex Brillouin gain spectrum at the locations of
FBGs. Moreover, local complex area or damage at small range may lead to the inaccuracy of
measurement due to the limitation of spatial resolution of present commercial Brillouin
demodulators such as BOTDR made in Japan and BOTDA made in Switzerland with the
smallest spatial resolution of 0.5m. Figure 1 shows the sketch about complex sensing
configuration of optical fiber sensing system. There are packaged OF sensor (FRP-OF), bare
OF, FBG, local complex stress area, damage point (or weld point), coupler and flange and so
on, so the sensing signal at the sensing road is inevitably influent. In follow, we will
introduce the optimization techniques of measuring signals.
2.2.1 Interactions between BOTDA/R and FBG signals
Two collinear OF-FBG sensors packaged by GFRP, named as GFRP-OF-FBG12 and GFRP-
OF-FBG34, had been tested for strain sensing under tension loads. Each OF-FBG sensor has
two FBGs. The initial center wavelengths of GFRP-OF-FBG12 are 1525nm and 1527nm, and
that of GFRP-OF-FBG34 are 1540nm and 1545nm, respectively. Figure 4 shows the test
results. It can be seen that the strain measured by OF around of the position of FBG agree
well with the strain measured by FBG1 and FBG2. While the obtained distributed strain
measured by OF has a huge intensity loss at the locations closed to FBG3 and FBG4, shown
as in Figure 12(b). The more the wavelength of FBG is close to 1550nm, the more the
intensity loss of the Brillouin signal will be in the collinear OF-FBG sensor. Therefore, the
FBGs in a collinear sensor must meet the following two requirements: 遖 The center
wavelength of FBG must be far away from 1550nm. So we should consider the initial center
wavelength and the wavelength under some loads in field applications. In short, the
wavelength of FBG sensor is not closed to 1550nm in its working time. 遘 The wavelength
(a) Test results for GFRP-OF-FBG12 (b) Test results for GFRP-OF-FBG34
Fig. 4. Strain measured by GFRP packaged OF-FBGs
www.intechopen.com

Life-Cycle Monitoring and Safety Evaluation of Critical Energy Infrastructure Using Full-Scale Distributed Optical Fiber Sensors
81
of FBGs must be separated from 2-3nm in the collinear sensor for the wavelength division multiplexing (WDM).
2.2.2 Brillouin gain spectrum curve fitting algorithm
Brillouin distributed optical fiber sensing technology is based on the assumption that Brillouin frequency shift (BFS) obtained from Brillouin gain spectrum linearly depends on the environmental temperature or applied strain on optical fiber. The Brillouin gain spectrum of OF applied axial tensile load has a Lorentz profile, while it becomes complex for complex stress condition or damage within the spatial resolution. Figure 5 shows the comparison of the 3-D mapping of one GFRP packaged OF-FBGs’ Brillouin gain spectrum to that of an unpackaged OF at certain temperature. Brillouin gain spectrum for the GFRP packaged OF-FBGs sensor turns to be more complex than that of the unpackaged OF, especially at the locations of FBGs. This complexity is caused by the complex initial stress induced by the packaging process and the interaction between the FBGs and the Brillouin sensor. Typically, the algorithm to calculate the Brillouin frequency shift provided by present commercial instruments is not flexible, which cannot fully meet the required measurement accuracy of temperature or strain. Thus, local Lorentz single-peak and localized least square fitting algorithms are proposed to fit the Brillouin gain spectrum. By applying optimization, a selected bandwidth of 50MHz has been employed to fit the measured Brillouin gain spectrum with the proposed algorithms based on the assumption that the peak of Brillouin gain spectrum is single. Experiments had been set up to verify the two proposed spectrum fitting algorithm, as shown in Figure 6. One GFRP packaged OF-FBGs sensor had been placed into a water tank with various temperature measurements, and the center wavelength of FBG is about 1527nm.
Fig. 5. Mapping of Brillouin gain spectrum
Fig. 6. Setup of temperature test
www.intechopen.com
Fiber Optic Sensors
82
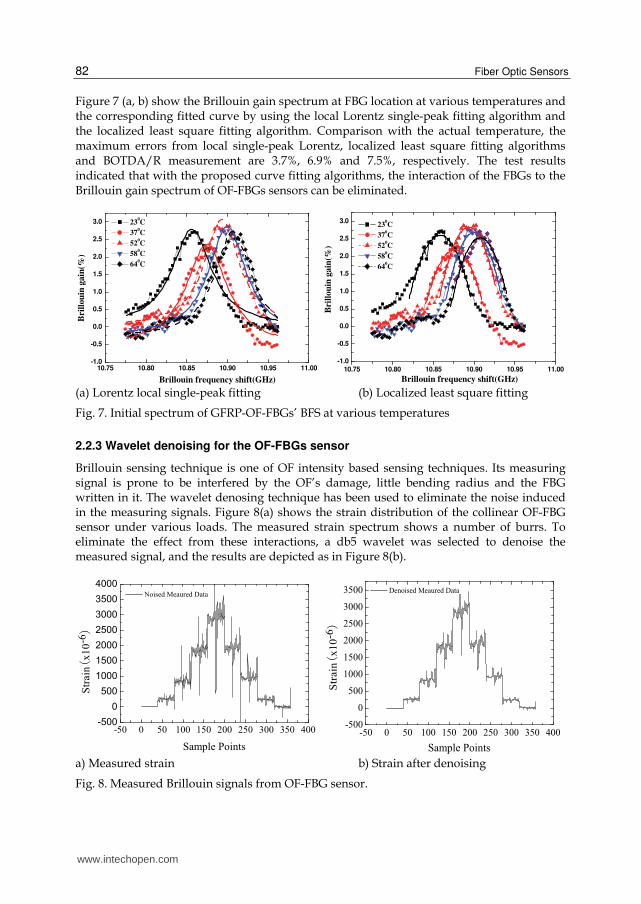
Figure 7 (a, b) show the Brillouin gain spectrum at FBG location at various temperatures and the corresponding fitted curve by using the local Lorentz single-peak fitting algorithm and the localized least square fitting algorithm. Comparison with the actual temperature, the maximum errors from local single-peak Lorentz, localized least square fitting algorithms and BOTDA/R measurement are 3.7%, 6.9% and 7.5%, respectively. The test results indicated that with the proposed curve fitting algorithms, the interaction of the FBGs to the Brillouin gain spectrum of OF-FBGs sensors can be eliminated.
10.75 10.80 10.85 10.90 10.95 11.00-1.0
-0.5
0.0
0.5
1.0
1.5
2.0
2.5
3.0
Brillouin frequency shift(GHz)
Bri
llou
in g
ain
(%)
230C
370C
520C
580C
640C
10.75 10.80 10.85 10.90 10.95 11.00
-1.0
-0.5
0.0
0.5
1.0
1.5
2.0
2.5
3.0
Brillouin frequency shift(GHz)
Bri
llou
in g
ain
(%)
230C
370C
520C
580C
640C
(a) Lorentz local single-peak fitting (b) Localized least square fitting
Fig. 7. Initial spectrum of GFRP-OF-FBGs’ BFS at various temperatures
2.2.3 Wavelet denoising for the OF-FBGs sensor
Brillouin sensing technique is one of OF intensity based sensing techniques. Its measuring signal is prone to be interfered by the OF’s damage, little bending radius and the FBG written in it. The wavelet denosing technique has been used to eliminate the noise induced in the measuring signals. Figure 8(a) shows the strain distribution of the collinear OF-FBG sensor under various loads. The measured strain spectrum shows a number of burrs. To eliminate the effect from these interactions, a db5 wavelet was selected to denoise the measured signal, and the results are depicted as in Figure 8(b).
a) Measured strain b) Strain after denoising
Fig. 8. Measured Brillouin signals from OF-FBG sensor.
www.intechopen.com

Life-Cycle Monitoring and Safety Evaluation of Critical Energy Infrastructure Using Full-Scale Distributed Optical Fiber Sensors
83
Figure 9(a) illustrates the strain measurement comparison of the GFRP-OF-FBGs sensor before and after db5 wavelet denoising and the strain gauge. Figure 9(b) shows the corresponding relative error. With the wavelet denoising, both the strain measured by the BOTDA/R and that by the FBGs agree well with that from the strain gauge. The maximum relative error of the GFRP-OF-FBGs sensor is 18% before denoising and 4% after denoising. The results indicate the feasibility of the wavelet denoising method for the data processing of OF-FBGs sensors (HE and ZHOU, 2009).
a) Strain measurement by various sensors b) Relative measurement error
Fig. 9. Strain measurement comparison before and after denoising
2.2.4 The optimization of distributed Brillouin signal
In common application, both the spatial resolution and distance resolution of commercial
Brillouin sensing system are low. The low spatial resolution will lead to the measurement
inaccuracy for local damage and stress of small-scale structures. And improving the distance
resolution can greatly add the number of measuring point and enrich the information of
measured elements. The equidistance difference measuring method and sensing OF warping
method are proposed here to optimize the test signals’ spatial and distance resolution.
1) Equidistance difference measuring method
Figure 10 shows the principle of the equidistance difference measuring method. With the transmission length of OF changing followed by certain rules, by using the equidistance difference measuring method, the measured zone of Brillouin sensor can be changed. These rules can be described as follow:
1. The transmission length of OF1 is defined as L1, and that of OF2 is defined as L2. With L0 being the difference between L1 and L2, we have 0<| L0|<d0,where d0 is the length of the sampling space.
2. When the Brillouin sensor is connected to OF1 by flange, the measuring points X=[x(1),x(2),…,x(n)] are obtained. While Brillouin sensor is connected to OF2, the measuring points Y=[y(1),y(2),…,y(n)] are gotten. The difference of |y(i)-x(i)| equals to L0 or |x(i+1)-y(i)| equals to d0-L0, where i=1,2,…n.
3. Numbers of measuring points Y(i) can be obtained by using OF3, OF4,…, OFn to connect the Brillouin sensor, only if the length satisfies the rule (1).
www.intechopen.com

Fiber Optic Sensors
84
4. Based on the series of difference set D, the strain information about the measured structure can be refined, where D=|Y(i)-X|.
Fig. 10. Equidistance difference measuring method
Figure 11 shows the measuring results of one OF sensor using the equidistance difference measuring method. Here the length of the Brillouin sensor is 7.26m, the length of the transmission optical fiber (denoted as OF1) is 2.0m. Under different load, the strain applied on Brillouin sensor is shown as in Figure 11(a). When the OF1 is shorten with 0.05m, the length of transmission optical fiber (denoted as OF2) is 1.95m, and the strain measured by Brillouin sensor is shown as in Figure 11(b). Obviously, there is large discrepancy of the distributed strain between these two measurements, denoted as Strain-OF1 and Strain-OF2. Figure 12 shows the difference between the Strain-OF1 and Strain-OF2. It can be seen that the strain difference at some locations are much larger than that of others, which may attribute to the local damages or complex stress conditions. In practice, this method is very useful for multiple stress information to be obtained by one sensor.
2) Sensing OF warping method
The spatial resolution of the developed Brillouin measuring system is too low to accurately measure small-scale structures. A novel OF warping method is proposed for the local fine measurement of small-scale structures. The OF is warped back and forth many times at the key position shown as in Figure 13. The warped OF is much longer than the spatial
a) Strain-OF1 b) Strain-OF2
Fig. 11. Results of the equidistance difference measuring method
www.intechopen.com

Life-Cycle Monitoring and Safety Evaluation of Critical Energy Infrastructure Using Full-Scale Distributed Optical Fiber Sensors
85
Fig. 12. The different between the Strain-OF1 and Strain-OF2
resolution, which can be characterized as type I and type-II, shown as in Figure 13. The strains at straight segments, denoted as O1,…,On, are much larger than that at curve segments. The average strain measured at the straight segments by Brillouin system are closed to the actual strains applied on the OF. With the capability of the warped OF to survive large strain, the OF sensor can detect the occurrence of the whole crack propagation process.
Experiment had been set up to verify the proposed sensing technique, as shown in Figure 14. A common optical fiber is bonded on the surface of uniform strength beam with a length of 40cm. The length of warped OF is 4.5m (denoted as OF-W), and the curve segments are free, the numbers of the straight segments is 15. For comparison, one electronic-resistance strain (ERS) is bonded on the surface of the beam, and another OF with the length of 30cm (denoted as OF-S) is bonded on the beam parallel to the warped OF, shown as in Figure 15. Figure 16 shows the measured distributed strains under various loads. Although the strains on the surface of beam should be equally distributed everywhere, the strain measured by OF is not flat as it should. Two reasons may attribute to this phenomenon: One is that the smallest spatial resolution is larger than the size of beam, and the other one is that the sensing location has optical fiber with free motion. Meanwhile, it can be seen that the strain measured by OF-S has small changes.
Fig. 13. Sensing OF warping method
www.intechopen.com

Fiber Optic Sensors
86
Fig. 14. Test setup of OF warping method
Fig. 15. Sensor layout on the beam
Fig. 16. Distributed strain at various load
Figure 17 gives the comparison of the strains measured by the OF-W, OF-S and the ERS The strain measured by OF-W shows good linearity with a slope of 0.6064. Here, the strain measured by local ERS is acted as the reference value. Using the slope coefficient, the
www.intechopen.com

Life-Cycle Monitoring and Safety Evaluation of Critical Energy Infrastructure Using Full-Scale Distributed Optical Fiber Sensors
87
modified value of OF-W can be obtained, which agrees well with the ERS with the maximum absolute error of 40µε. In practice, OF-based warping sensor can be fabricated by FRP packaging technique with a pre-calibration correction coefficient.
Fig. 17. Strain comparison by different sensors
2.2.5 Temperature self-compensation for BOTDA/R-FBG sensing system
For BOTDA/R-FBG collinear system, another prominent advantage is temperature compensation for strain measurement. Based on the collinear technique, we proposed a novel temperature self-compensation for strain measurement without additional temperature compensation sensor. Without considering the cross sensitivity of strain and temperature, both the Bragg wavelength shift of FBG and the Brillouin frequency shift of BOTDA/R show excellent linearity to the strain and temperature as expressed below in binary matrix:
B T
TB C C Tvε
ε
λ α α εΔ Δ =
ΔΔ (1)
where BλΔ and BνΔ are the changes of the Bragg wavelength and the Brillouin frequency; εΔ and TΔ are the changes of strain and temperature; εα and Tα are the strain and
temperature sensitivity of FBGs, which equal to 1.2 pm/µε and 10.8pm/℃, respectively; Cε and TC are the strain and temperature sensitivity of BOTDA/R, which have values of 0.05MHz/µε and1.0MHz/℃, respectively. So the Eq. (1) can also be expressed as follows:
1T B
T BT C C vε
ε
ε α α λ−
Δ Δ =
Δ Δ (2)
With measured changes of Bragg wavelength ( BλΔ ) and Brillouin frequency shift ( BνΔ ), the changes of strain ( εΔ ) and temperature ( TΔ ) then can be predicted accordingly. Thus, the temperature effect to the BOTDA/R-FBG system can be eliminated or self-compensated. Figure 18 (a, b) show the test results of self temperature compensation. The strain measured by the OF-FBG sensor with self temperature compensation agrees well with the reference strain calculated from absolute temperature compensation by OF or FBG, and the maximum relative error is about 9%. Some of the measured strains or temperatures have large deviation with the references because of the temperature instability of the water tank.
www.intechopen.com

Fiber Optic Sensors
88
(a) FBG (b) OF
Fig. 18. Test results for self temperature compensation verification of OF-FBG
Figure 19 compares the variance of strain measured with and without self temperature compensation at two temperature states at out door. It can be seen that compared to the strain measured by the OF-FBGs sensor without the self temperature compensation, the corresponding strain with the self temperature compensation varies much smaller from the actual strain.
Fig. 19. Strain measurement with temperature inter-compensation
The temperature self-compensation method shows great advantage in practice. As be known, the temperature measured by sensors for temperature compensation may be different from that applied on the strain sensor due to the discrepancy of the sensor layout location, or there are no place for the sensor layout around the strain sensor in some cases. Using the novel temperature self-compensation method, special temperature sensors are not necessary, which can be a promising and cost-efficient sensing technique for field practices (HE and ZHOU, 2010).
2.2.6 Collinear OF sensor based shape monitoring technique
The shape reconstruction is an important way to evaluate the safety of structures such as oil
pipeline, flexible pipe of platform and large-scale pillars. Some researchers have used local
www.intechopen.com

Life-Cycle Monitoring and Safety Evaluation of Critical Energy Infrastructure Using Full-Scale Distributed Optical Fiber Sensors
89
sensors (ERS or FBG) to perform shape reconstruction (ZHU, 2007; QIAN, 2004). However,
the shape reconstruction for the large-scale structures has not been studied fully. Local
sensor used for shape reconstruction could not be able to provide the structural health
condition of the whole structure. In addition, these local sensors cannot bear the large
deformation due to earthquake and other disasters. Based on the advantage of newly
developed collinear sensing technique in this chapter, such as large dynamic range and high
accuracy, a novel method for shape reconstruction has been proposed by using the FRP or
PP packaged collinear sensor. Figure 20 shows the sketch of deformation and sensor layout
of oil tank and flexible pipe.
a) Oil tank
b) Flexible pipe
Fig. 20. Sketch of deformation and sensor layout of oil tank and flexible pipe
www.intechopen.com

Fiber Optic Sensors
90
Using the distributed strain information, the shape reconstruction can be done through the following procedures:
1. Calculating the curvature components (k(i)1, k(i)2 and k(i)3) through the bending strain measured by different sensor, and synthesizing the curvature vector K(i), where the subscript “i” denotes the measuring location.
2. Using the genetic algorithm to optimize the minimum interpolating number between the two neighboring curvatures.
3. Based on the differential geometric method, calculating coordinate position of each measuring location in the osculating plane.
4. 3D visualization based on visual parallel programming platform such as VC++, VB program.
Figure 21 (a, b) shows the simulation results of the shape reconstruction of one plane curve using various numbers of calculated curvatures. For shape reconstruction-I, nine curvatures are used to reconstruct the shape of curve. While for shape reconstruction-II, ninety curvatures are used. The accuracy of reconstruction is highly dependent on the number of curvatures used in the reconstruction. The more the curvatures are used, the higher accuracy of reconstruction can be obtained. Therefore, with a larger number of curvatures obtained by the Brillouin sensor compared to local sensor, the developed sensing system can provide a promising shape reconstruction. In addition, by using the collinear technique, the deformation of key locations can also be checked from the composed FBG sensors.
a) 2y x= b) 4 33 2y x x= + +
Fig. 21. Simulation of shape reconstruction for curve
3. Engineering-suitable high-durability optical fiber sensors
The protection methods of OF sensors, for example, by using the capillary packaging method and the glue as coating, showed the disadvantages of low-durability and low environmental resistance, which disable its potential for the life-cycle monitoring of critical infrastructure. Fiber Reinforced Polymer (FRP), with the advantages of corrosion resistance and high strength, has the natural compatibility with optical fibers. In our group, various FRPs including glass fiber reinforced polymer (GFRP), carbon fiber reinforced polymer (CFRP), and basalt fiber-reinforced polymer (BFRP) etc, are investigated to be used as
www.intechopen.com

Life-Cycle Monitoring and Safety Evaluation of Critical Energy Infrastructure Using Full-Scale Distributed Optical Fiber Sensors
91
packaging and protecting the OF sensors. Figure 22 shows the fabrication process of a FRP-OF smart bar, by which the optical fiber is incorporated into the FRP to form a optical fiber sensor. One or two optical sensors are placed into the FRP bar, with the consideration of the practice convenience. Moreover, Polypropylene can be chosen to develop surface install strain sensor, named as PP-OF belt strain sensor.
Fig. 22. Sketch of the manufacture process of FRP smart bar
Figure 23 shows the products of FRP packaged optical fiber smart bar and PP packaged
optical fiber smart belt. In an effort to meet various layout requirements for different
applications, FRP-OF sensor can be produced into different types of sensors. Figure 24(a)
and 24(b) show the fabricated prototypes of these two types of FRP-OF sensors. The anchors
on both ends of the sensor are designed to improve the bonding between the host matrix
and the sensors. The length of these anchors can be designed based on the requirements of
the dynamic range of the strain measurements. In addition, with the GFRP packaging layer,
several OF-FBGs sensors can be packaged into one GFRP layer for multiple parameters
sensing. The PP-OF sensor can be directly bonded on the surface of structures. The FRP-OF
bar has good sensitivities to strain and temperature. For the FBG system, the strain and
temperature sensitivity coefficients are 1.2 pm/µε and 16.8pm/℃, and for the Brillouin
system, the strain and temperature sensitivity coefficients are 0.05MHz/µε and 1.2MHz/℃.
Comparing with the OF sensors without package, the temperature sensitivity coefficient of
the OF (or FBG) sensors with FRP package turn to be larger (ZHOU and OU, 2009).
a) FRP-OF rib b) PP-OF belt
Fig. 23. High-durability FRP/PP-OF sensor
www.intechopen.com

Fiber Optic Sensors
92
a) The GFRP-OF-FBGs based rod b) The surface installed GFRP-OF-FBGs
Fig. 24. Sensor prototypes of the GFRP-OF-FBGs based sensors
Furthermore, for the distributed strain measurement and shape monitoring of mooring lines and flexible pipes, OF based smart mooring and smart flexible pipe for offshore platform have been investigated.
1) Smart mooring line. In an effort to increase the corrosion resistance of the conventional mooring line, FRP mooring line is developed, shown as Figure 25. Two FBGs are incorporated into the FRP mooring line for the strain measurement. Furthermore, small steel strand is placed into the FRP mooring line to strengthen the elastic module and shear property of FRP depicted as Figure 25(b). This novel smart mooring line acts as either the tension structural member or sensing element. At present, the study on its sensing and mechanical properties is under going.
a) Pure FRP smart mooring line b) FRP smart mooring line with steel
Fig. 25. Smart FRP mooring line
www.intechopen.com

Life-Cycle Monitoring and Safety Evaluation of Critical Energy Infrastructure Using Full-Scale Distributed Optical Fiber Sensors
93
2) OF based smart flexible pipe. Figure 26 shows two types of smart flexible pipes. In type-I, four OF sensors are placed into the outside layer of a flexible pipe at the interval of 90 degree: one OF temperature sensor and three OF strain sensors. The temperature sensor is used for the temperature compensation for strain measurement. In type-II, FRP packaged OF sensors are bonded on the surface of a pipe by clamps. The distributed OF sensor can be either optical fiber sensor or collinear optical fiber sensor. Using the collinear sensor, the distributed strain and local strain information can be obtained. Meanwhile, the point curvature can be gotten from the distributed strain, and reconstructed the shape of flexible pipe.
a) Type-I b) Type-II
Fig. 26. Smart flexible pipe
4. The engineering self-healing optical fiber sensing network
Based on the wavelength-division multiplexing (WDM) technique (spatial-division multiplexing or time-division multiplexing), the FBG sensors can be arranged simply in series or in parallel. The full-scale distributed Brillouin sensing technique uses one common single mode optical fiber to sense the continuous strain or temperature. A sensing network system for the health monitoring of structures can be constructed by using several FBG sensors and the Brillouin sensor, the sensing demodulation system, and the data acquisition system. However, The optical fiber sensing network, especially full scale distributed optical fiber Brillouin sensor network, is weak for disaster resistance. Local failure or transmission breakdown of the sensing network can easily lead to the failure of the whole optical fiber sensing network. The vulnerability of the local sensors and the transmission in the optical fiber sensing network will reduce the robustness of the sensing network. Therefore, the reliability and robustness of sensing network becomes a challenge. Some researchers proposed the self-healing networks. Peng and Tseng developed a novel self-healing network with star topology and ring topology by adding light switchers into the optical fiber Bragg grating network (Peng and Tseng, 2003). This network is prone to failure once more than three nodes are failed. Wei developed a FBG fan-shaped network and invented four remote light switch nodes, which greatly improved its robustness (Wei and Sun, 2007). However, only the connection of the presented self-healing network has been studied, and research on the sensing continuity and exchangeability of damaged sensors has not been discussed. In this chapter, a novel self-healing OF sensing network is proposed. The self-healing sensing
www.intechopen.com

Fiber Optic Sensors
94
network has the advantages of high robustness, self-healing, sensing continuity, and exchangeability of damaged sensors.
4.1 Construction of the self-healing network
Based on the vulnerability analysis, the classification of sensor nodes and sensing routes is figured out. The light switches or couplers are used to develop robust sensing nodes or sensing routes. Figure 27 shows a sketch of the developed self-healing full-scale distributed Brillouin sensing network. The sensing network includes two types of robust nodes: link robust node and resume robust node. At the vulnerable area-I, if route遖 or sensor is broken, the connectivity of the sensing network can be kept by the optical fiber outside the structure遘. At the vulnerable area-n, if road遨or sensor is damaged, the damaged sensor can be replaced by a local FBG sensor遯 to continue monitor the damage expansion.
Fig. 27. The proposed self-healing optical fiber sensing network
4.2 Experimental investigation
One steel sheet, bonded with OF sensor on surface, as shown in Figure 28, was used to verify the proposed self-healing optical fiber sensing network. The high strength epoxy was used for sensor bonding. The length of the specimen is 3.7m, and the length of sensing part is approximately 2.5m. In this study, the middle portion of the steel sheet (approximately 0.8m in length) was chosen as the damage position by cutting a minor crack as shown in Figure 28(b). Axial load was applied to the specimen, and the optical fiber was connected by couplers at the vulnerable element. When the OF was broken due to the crack propagation, the broken sensing portion was replaced by local FBG sensor, and forming a collinear system. Furthermore, the FBG sensor can perform crack monitoring continuously. Here the sensing gauge of the FBG sensor is 6cm, which is too small to act as a Brillouin strain sensor.
a) Network in good condition b) Self-healing network
Fig. 28. Test for sheet steel bonded with OF
www.intechopen.com

Life-Cycle Monitoring and Safety Evaluation of Critical Energy Infrastructure Using Full-Scale Distributed Optical Fiber Sensors
95
4.3 Results and discussions
(I) Undamaged steel sheet. Six-stage loading was applied on the specimen with the strain step of 500µε. Figure 29 depicts the distributed strain, local strain information at different conditions of the steel sheet. Figure 29 shows that the strain curve of the undamaged steel sheet is flat for each axial load stage. The minor fluctuation in the curve is attributed to the system error and strain inconsistency of the curve segment of the OF.
Fig. 29. Distributed strain of undamaged steel
Fig. 30. Strain of damage steel with crack
(II) Pre-damaged steel sheet. In Figure 30, the specimen was pre-damaged by cutting a minor crack at the middle part of steel. Under the second loading step (Step3), there was stress mutation at the strain curve due to the present of the local crack, and other parts of the OF far away from crack keep stable. Under the third loading step (Step4), the maximum strain reached 2384µε at the cracking location, and that at other places was about 1500µε. At the stage of load maintenance, the OF was broken at the cracking location. The broken sensing path was then reconnected. Under the loading steps of step5 and step6, the strain curves had a large depression at the free part or the FBG location. And the crack can be cautiously monitored by the FBG sensor. The FBG sensor’s initial center wavelength was
www.intechopen.com

Fiber Optic Sensors
96
corresponding to the strain of 2384µε, the strain at cracking location reached 4900µε at step6 shown in Figure 30. The self-healing network performed excellently throughout the period of monitoring despite of some multi-signal interactions, which can be solved by the optimization of distributed Brillouin measuring signals mentioned above.
5. OF based life-cycle monitoring and safety evaluation for huge oil deport
The safety evaluation of critical energy infrastructure, such as huge oil depots, offshore platforms, long oil pipelines and so on, is one of the most important concerns worldwide. The tragedy of the Deepwater Horizon alarmed the industry and government that the structural life-cycle monitoring and safety evaluation needs be taken. Our research group has focused on the OF based life-cycle monitoring of offshore platforms, huge oil depots in recent years and the developed SHM system has been successfully implemented to applications such as in the offshore platform and Casing Pipe in mainland China (ZHOU and OU, 2010). In this section, the safety evaluation based on the developed SHM system of a huge oil deport in Daqing, mainland China has been introduced.
5.1 Sensor layout
A oil depot includes the oil tank, the oil pipeline and some other accessory equipments. It has a huge domino effect, which is a local failure (such as the explosion) prone to induce large-scale structural failure due to the distributed density of oil pipes and storage tanks.
The potential damages for oil depot include crack (large strain) and corrosion, which may result in oil leak, tank capsize, and even fire. The proposed full-scale distributed optical fiber sensors have been used to monitor and evaluate the safety of the huge oil depot in long term. Figure 31(a, b) shows the sensor layout for strain and temperature sensing on the oil
pipeline, respectively. PP-OF sensor is used to measure the distributed strain of oil pipeline, and have been directly bonded on the surface of the oil pipe. The FRP-OF sensor is bonded on the surface of oil pipe by steel clamps, acted as a distributed temperature sensor to
monitor the oil leak.
a) PP-OF strain sensing b) FRP-OF temperature sensing
Fig. 31. Sensor layout on the oil pipeline
www.intechopen.com

Life-Cycle Monitoring and Safety Evaluation of Critical Energy Infrastructure Using Full-Scale Distributed Optical Fiber Sensors
97
Figure 32 (a, b) shows the configuration of the SHM system including the signal interrogation for oil pipeline and storage tank, respectively. The FRP-OF rib is installed on the surface of the oil pipe and the storage tanks for oil leak monitoring, and the PP-OF belt strain sensor is placed on the surface of the oil pipe and the storage tanks for large strain and crack monitoring. At the locations prone to damages, robust sensing nodes are designed to form self-healing optical fiber network. In addition to the strain and leak monitoring sensors, for the oil tank, four PP-OF sensors are vertically installed on the oil tank to reconstruct the shape of the oil tank under different loading conditions. Based on the shape reconstruction, the warning of the oil spilling can be provided and the safety of oil tank can be accurately evaluated.
a) Oil Pipe
b) storage tank
Fig. 32. OF based huge oil depot life-cycle monitoring
www.intechopen.com

Fiber Optic Sensors
98
5.2 The laboratory test for OF sensor for safety monitoring on oil pipelines
In some cases, the oil transportation pipes are extremely long. Various service environments result in a complex service conditions for the distributed oil pipe. For example, the petroleum transportation pipeline from MoHe, China to Daqing, China is a section of oil transportation pipeline between Russia to China. It has a length of 960km, passing through large mountains such as the Daxing'an and Xiaoxing'an Mountains. The complex service environments of the pipelines involve high water permafrost at the north and seasonally frozen areas at the south. The oil temperature distribution along the oil pipeline is within the range from -6℃to 10℃. Temperature changes, human activity, and natural disasters will significantly influence the foundation of the oil pipeline. Therefore, monitoring the safety of the oil pipeline is urgently needed. In this study, the proposed collinear BOTDA/R-FBG technique has been suggested to construct the real-time SHM system for the oil pipeline monitoring, as shown in Figure 34. In order to validate the proposed technique, laboratory test has been employed. The polyvinyl chloride (PVC) pipeline is used as the oil pipeline, and the OF based monitoring method is applied on the PVC pipeline to study its behavior under frost-heaving condition in cold areas. This model test is used to investigate the novel monitoring method for the actual pipeline.
Fig. 33. MoHe-Daqing oil pipeline
www.intechopen.com

Life-Cycle Monitoring and Safety Evaluation of Critical Energy Infrastructure Using Full-Scale Distributed Optical Fiber Sensors
99
Fig. 34. SHM system of Mohe-Daqing oil pipeline
1) Indoor Test. A concentrated load was employed on one 4m PVC. To monitor the service behavior of the pipeline, the sensors including the ERS and OF sensors were bonded on the surface of PVC, as shown in Figure 35.
Fig. 35. Sensor installation
The PVC pipe was preloaded three cycles before the data acquisition, and the load was progressively applied on the pipe with a step of 40N. Load had been maintained for two minutes to take data acquisition. The test continued until the PVC pipe or the optical fiber was broken. Figure 36 shows the comparison of the measured strain distribution by the OF sensor and the ERS under various load. It can be seen that the strain measured by the OF agrees well with that measured by the ERS.
2) Outdoor Test. To validate feasibility of the proposed sensing technique in real application environments, tow PVC pipelines were placed into an outdoor water tank with the environmental temperature changing from -10℃ to -20℃ in winter, as shown in Figure 37. The FBG sensors were symmetrically placed on the pipeline, and the OF sensors were installed on the bottom and top surfaces of the PVC pipeline, shown as in Figure 38.
www.intechopen.com

Fiber Optic Sensors
100
3 4 5 6 7 8 9 10 11 12 13 14 15 16
-6000
-4000
-2000
0
2000
4000
6000
8000
Value of Strain Gauges
Value of Strain Gauges
Top of Pipeline
Bottom of Pipeline
Str
ain
(X10
-6)
Position(m)
0(N) 172(N) 329(N)
472(N) 593(N) 694(N)
779(N) 858(N) 927(N)
Fig. 36. Distributed strain by OF and ERS
Fig. 37. Instrumented PVC pipe in water tan
Fig. 38. Sensor installation
www.intechopen.com

Life-Cycle Monitoring and Safety Evaluation of Critical Energy Infrastructure Using Full-Scale Distributed Optical Fiber Sensors
101
In this test, the thawing-settlement was controlled by using the heating rod. Although with the same environments, the frost-heaving was not evenly distributed along the PVC pipeline. Pipelines in “A” area frosted significantly, while that in “B” area almost did not frost, as can be seen in Figure 39. Figure 40 shows the distributed strain of the PVC pipeline from frost-heaving to thawing-settlement. The measured stress by the OF sensor on the top of the PVC pipe was in tensile, and that at the bottom was in compression during the process of frost-heaving. While the stress measured by the OF sensors during the process of thawing-settlement was opposite to that during the process of frost-heaving. Figure 41 shows the strain comparison between the FBG and the OF sensors. It can be seen that the strain trend measured by the OF agreed well with that by the FBG during the process of frost and thaw. Small variance between may be caused by the measuring accuracy difference or irregular frost or thaw. At “A” area of the PVC pipeline, the strain of FBG-A1
decreased from 800µε to -480µε, because the PVC pipeline broke around FBG-A2.
Fig. 39. Profile of frost-heaving
a) Distributed strain at top of PVC b) Distributed strain at bottom of PVC
Fig. 40. Distributed strain measured by OF at frost-thaw process
www.intechopen.com

Fiber Optic Sensors
102
a) A-part b) B-part
Fig. 41. Strain comparison between FBG and OF
6. Applications of full-scale distributed optical fiber sensors in SHM for critical energy infrastructure
6.1 Life-cycle health monitoring of the casing pipe using the OF sensors
Casing pipes in oil well constructions may suddenly buckle as the hydrostatic pressure
difference increases between the inside and outside of the pipes. For the safety of workers and the followed oil transportation process, the construction and service of the casing pipes is critical to be monitored. To meet this need, field test of structural health monitoring of casing pipes had been operated by employing both local FBG and Brillouin sensors on
casing pipe for long-term monitoring. Figure 42 illustrates a sketch of the employed casing pipe monitoring system on a real application of the proposed casing pipe monitoring in Daqing Oilfield, China. Brillouin sensors or FRP-OF bars were installed on the surface of the
casing pipe above non-oil reservoirs and FBG sensors were installed on the hot spots where casing damages often take place.
Fig. 42. Sketch of a structural monitoring system for the casing pipe
www.intechopen.com

Life-Cycle Monitoring and Safety Evaluation of Critical Energy Infrastructure Using Full-Scale Distributed Optical Fiber Sensors
103
6.1.1 Sensor installation
1) Brillouin sensors. A FRP-OF bar was installed on the surface of the casing pipe over its entire length. To ensure that the FRP-OF bar deformed together with the casing pipe, several stainless steel encircling hoops were used to fix the FRP-OF bar on the casing pipe at 2m intervals. After placing the pipe in the down-hole well, the casing pipe and the FRP-OF sensor were wrapped with cement mortar to enhance their deformation compatibility. In addition, the two OF sensors were connected in series to form a measurement loop for the BOTDA measurement system. The bottom end of the FRP-OF bar and the splice joints of the OF sensors must be well protected to prevent damage during the construction. For this purpose, a stainless steel shell was used to cover the OF splice joints, and the gap in the shell was sealed with an epoxy iron mixture, as illustrated in Figure 43(a). Figure 43(b) shows the field installation of an FRP-OF bar and a casing pipe in the Daqing Oilfield, China.
a) Protective steel shell at a solder joint b) Sketch of the FRP-OF bar installation
Fig. 43. Brillouin sensor installation
2) FBG sensors. Four FBG strain sensors were installed at stress concentration areas of the casing pipe. Figure 44 illustrates their field installation on a casing pipe in the Daqing Oilfield, China. They were distributed around the circumference of the pipe at a 90° interval.
Fig. 44. FBG sensor installation
www.intechopen.com

Fiber Optic Sensors
104
To perfectly bond to the casing pipe, the installation surface of each FBG strain sensor must
be polished and cleaned. The FBG strain sensors were then covered by a piece of epoxy glass
cloth for increasing the corrosion resistance and durability. For the purpose of long-term
strain/stress measurements, one additional FBG temperature sensor was installed near the
FBG strain sensors for temperature compensation.
To separate the strain and temperature information, the FBG temperature sensor was
inserted into a small steel tube which was filled with silicone fluid to enhance the thermal
conductivity. The initial center wavelengths of the five FBG sensors must be at least 3nm
apart for reliable measurements. A special fiber optical cable with 8mm in diameter,
protected by a steel strand at free state, was used to transmit the measured optical signals
from the OF and FBG sensors.
6.1.2 Field test and discussion
To validate the installation techniques and measurement effectiveness of both FBG and
BOTDA optical fiber sensor, the proposed SHM system was successfully employed to three
oil wells in the Daqing Oilfield, including Xing10-5Bing3112, Xing10-5Bing3022, and Xing13-
4-PB335.
1) Strain measurements at Xing10-5Bing3112 and Xing10-5Bing 3022.
Two FRP-OF bars installed on the casing pipes of these two oil wells had a length of 818m
for Xing10-5Bing3112 and of 838m for Xing10-5Bing3022, respectively. Four FBG strain
sensors and one FBG temperature sensor were installed in the significant locations of
Xing10-5Bing3022 for high accuracy behavior monitoring. Considering the limitations of the
oil pipe casing techniques and time required by the BOTDA/R measurements, limited
locations with stress concentration on the casing pipe were monitored by the FBG sensors
during the construction. The strains measured by the FBG sensors were recorded by an MOI
si720 interrogator with a sample frequency of 5Hz and measurement accuracy of 1 µε.
Figure 45 and 46 present the strain measured by the FBG sensors during the processes of oil
well casing and grouting . The stress states of the casing pipe during the whole construction
process had been correctly reflected by the installed SHM system. Figure 45(a) and Figure
46(a) show the raw measured data without eliminating the environmental noise. Figure
45(b) and Figure 46(b), on the other hand, show the corresponding denoised data by Db5
wavelet. It shows that the denoising process significantly improve the quality of the
measured signal for real applications.
The two oil wells were opened for operation after the complete of its construction. The strain obtained from the FRP-OF bar was recorded by the BOTDR demodulator produced by NTT
in Japan, with the measuring accuracy of ±50µε and minimum spatial resolution of 1m. Figure 47 presents the strainsmeasured by the FRP-OF sensors on from December 15, 2007
to December 17, 2007. The measured strains remained stable, and all ranged from -120µε to
+120µε. The strains measured over three days by the FRP-OF sensors and its nearby FBG sensors at the stress concentration areas are compared in Figure 48. The strains measured by the FRP-OF sensors fluctuated around those measured by the FBG sensors, which changed little over the three days. This FBG sensor shows more accurancy than the BOTDR/A based FRP-OF sensor. The maximum relative error between these two techniques in strain
www.intechopen.com

Life-Cycle Monitoring and Safety Evaluation of Critical Energy Infrastructure Using Full-Scale Distributed Optical Fiber Sensors
105
0 20000 40000 60000 80000
0
200
400
600
800
1000
1200
FBG1
FBG2
FBG3
FBG4
S
train
(X10
-6)
Sample point
0 20000 40000 60000 80000
0
200
400
600
800
1000
1200
Sample point
Str
ain
(X10
-6)
FBG1
FBG2
FBG3
FBG4
a) Raw data b) Cleansed data
Fig. 45. Strain measurements during casing of the oil well
-2000 0 2000 4000 6000 8000 10000 12000-200
0
200
400
600
800
1000
Opposite well
Decompression
Pressing
Water injection
Cementing
Isolation fluid injection
FBG1
FBG2
FBG3
FBG4
S
train
(x10
-6)
Sample point
-2000 0 2000 4000 6000 8000 10000 12000-200
0
200
400
600
800
1000
Sample point
Opposite well
Decompression
Pressing
Water injection
Cementing
Isolation fluid injection
Str
ain
(x10
-6)
FBG1
FBG2
FBG3
FBG4
a) Raw data b) Cleansed data
Fig. 46. Strain measurements during grouting of the oil well
Fig. 47. Strain distribution of the casing pipe
www.intechopen.com

Fiber Optic Sensors
106
Fig. 48. Strain comparison
measurement is approximately 12%. Throughout the monitoring period, the strain state of the in-service casing pipes was normal, showing no sign of buckling.
2) Geostress measurements and Perforation Experiments for Xing13-4-PB335.
Perforation completion and positioning of the geostress orientation are two key factors in oil and gas explorations.. To measure the geostress or circumferential stress of the casing pipe, a total of 12 FBG strain sensors were installed around the circumference of the casing pipe of Xing13-4-PB335 oil well at a interval of 30° interval. Two FRP-OF bars of 1,133m long were installed along the casing pipe for the stress distribution measurement. The orientations of the 12 FBGs were identified by a multi-arm caliper logging tool. The orientation of the FBG6 corresponding to the marks on the casing pipe as shown in Figure 49 is approximately 311°. The orientations of the perforation are 41° and 221° near the FBG9 and FBG3, respectively. Figure 50 shows in-situ measurements of the strains of the in-service casing pipes. As shown in Figures 51, the orientation of the maximum horizontal stress determined by the cross multipole array acoustic instrument (XMAC) and FBG sensors are approximately 94.67° and 101°, respectively. The relative variance between the two measuring techniques is approximately 6.7%. Figure 52 shows the distribution of circumferential stresses of the casing pipe before and after perforation completion measured by the FBG sensors. The
Fig. 49. Orientation mark of casing pipe
www.intechopen.com

Life-Cycle Monitoring and Safety Evaluation of Critical Energy Infrastructure Using Full-Scale Distributed Optical Fiber Sensors
107
Fig. 50. In-situ measurements of the strains
Fig. 51. The orientation of the maximum horizontal stress by XMAC
Fig. 52. The distribution of circumferential stress measured by FBG sensors
www.intechopen.com

Fiber Optic Sensors
108
orientation of the maximum circumferential stress is vertical to that of perforation, which agrees well with the actual stress state applied on the casing pipe.
Figure 53 shows the strain distribution along the casing pipe before and after perforation,
which was measured by two FRP-OF sensors. The readings from these two sensors were
consistent. The strain difference at any particular position ranges from -200µε to +200µε,
indicating that the axial strain of the casing pipe remains stable before and after the
perforation process. The average strain appears to be proportional to the distance to the
ground surface due to the effects of gravity.
a) Before perforation b) After perforation
Fig. 53. Strain distribution from the FRP-OF
The field application shows that both the FRP-OF sensors and the FBG sensors wrapped in
epoxy glass cloth are stable and durable. They have survived the casing and grouting
processes of oil wells in a harsh construction environment and it indicates that the sensor
installation procedure is feasible.
6.2 The life-cycle monitoring of offshore platform by using OF sensors
Offshore platform plays an important role for oil exploitation and accommodation. The offshore platform, especially deep offshore platform, serviced in a extremely harsh environment. It often involves the coupling effects of wind, tide, current, and corrosion,
which could cause the breakdown of the mooring line, the large deformation of the flexible pipe, and even the collapse of the offshore platform. Stress and state-of-the-art are two key parameters correspond to the safety of the offshore platform. The existing sensors applied
on offshore platform are off-line sensors, such as self-contained tilt sensors and self-contained strain sensors. The cost of the safety assessment based on these techniques is high, and no in-time safety monitoring and pre-warning capability is provided. In an effort of monitoring the offshore platform in long term, our research group has proposed several
different types of sensors to successfully provide the SHM system on offshore platform application in mainland China.
www.intechopen.com
Life-Cycle Monitoring and Safety Evaluation of Critical Energy Infrastructure Using Full-Scale Distributed Optical Fiber Sensors
109
6.2.1 Laboratory model test of T shaped tubular joint
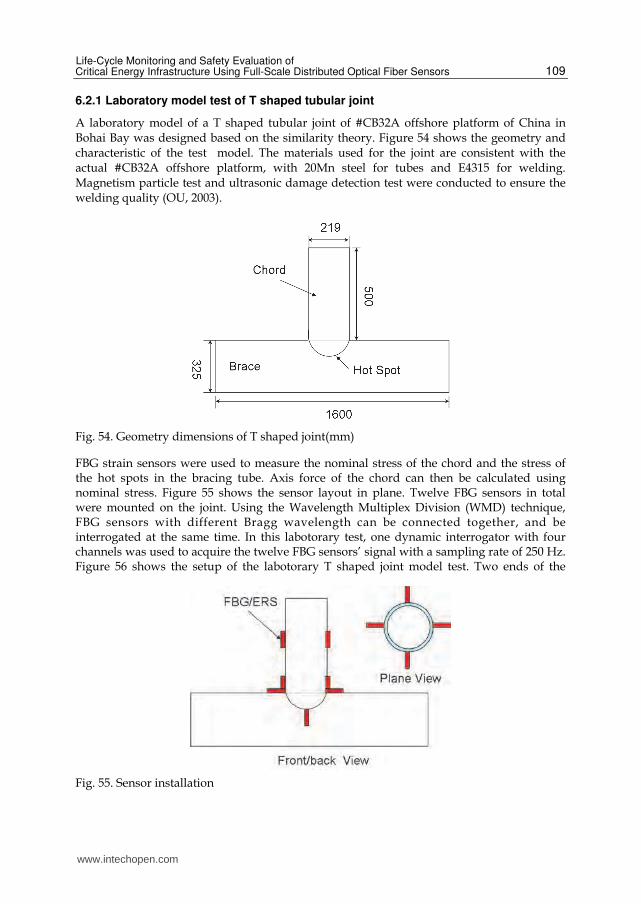
A laboratory model of a T shaped tubular joint of #CB32A offshore platform of China in Bohai Bay was designed based on the similarity theory. Figure 54 shows the geometry and characteristic of the test model. The materials used for the joint are consistent with the actual #CB32A offshore platform, with 20Mn steel for tubes and E4315 for welding. Magnetism particle test and ultrasonic damage detection test were conducted to ensure the welding quality (OU, 2003).
Fig. 54. Geometry dimensions of T shaped joint(mm)
FBG strain sensors were used to measure the nominal stress of the chord and the stress of the hot spots in the bracing tube. Axis force of the chord can then be calculated using nominal stress. Figure 55 shows the sensor layout in plane. Twelve FBG sensors in total were mounted on the joint. Using the Wavelength Multiplex Division (WMD) technique, FBG sensors with different Bragg wavelength can be connected together, and be interrogated at the same time. In this labotorary test, one dynamic interrogator with four channels was used to acquire the twelve FBG sensors’ signal with a sampling rate of 250 Hz. Figure 56 shows the setup of the labotorary T shaped joint model test. Two ends of the
Fig. 55. Sensor installation
www.intechopen.com

Fiber Optic Sensors
110
Fig. 56. Setup of T shaped tubular joint
bracing tube were fixed to the foundation by brace racks. Tensile forces were applied on the
chord tube in axis direction. Electrical fluid servo actuator was connected to the computer to control the loading process . The maximum force output is ±630KN, and the maximum displacement output is ±250mm.
For the T shaped tubular joint under tensile load, the hot spots were located in the joint conjunction between the chord and the brace tube. Figure 57 shows the finite element analysis results for the maximum principle stress contour of the tested model simulated by ANSYS 9.0. A stress concentration along the welding in the joint conjunction was formed, and the maximum stress is observed at the saddle spot.
Fig. 57. Principal strain contour result
1. Measured plane strain of the hot spots. One particular location on the hot spot areas was selected for strain monitoring as shown in Figure 58. Three FBG strain sensors and three ERSs were installed on the required location. The angle between the three sensors was 45 degree, denoted as S1, S2 and S3, and the three sensors formed as strain rosette. Figure 59 shows the principle strain and strain in X direction measured by the two kinds of rosettes. The FBG sensors show great agreement to the ERSs, verifying their feasibility of principle strain measurements.
www.intechopen.com

Life-Cycle Monitoring and Safety Evaluation of Critical Energy Infrastructure Using Full-Scale Distributed Optical Fiber Sensors
111
Fig. 58. Sensor installation of plane strain monitoring test
Fig. 59. Comparison between the principle strain and x direction strain
2. Static test for local strain monitoring For the local strain monitoring, a static test had been operated on the labotorary T shaped tubular joint model. The load was placed on the top of the chord tube, with an increment of 10KN, from 20KN to 60KN. Three loading cycles were conducted. Figure 60 shows the measured strain comparison between the two kinds of sensors, FBG and ERSs. Linear relationship between loading and strain indicates that strains in hot spot were much larger than that in the chord tube.
6.2.2 Field applications of the proposed SHM system on #CB32A Offshore Platform, Bohai Bay, China
#CB32A Offshore Platform represents an important type of platform structures in the oil industry. During the long term service, the platform will be subjected to extremely harsh environmental loads, such as wind, wave tide, water erosion and current loads. To monitor its performance, approximately 259 FBG sensors, 24 acceleration sensors, 178 PVDF sensors, and various other sensors were installed on the offshore platform’s key locations, such as the T-shape tubular joints. As shown in Figure 61, the SHM system included a data
www.intechopen.com

Fiber Optic Sensors
112
Fig. 60. Strain comparison of two kinds of sensors, FBGs and ERSs
model test platform structure
data Acquisition and management system remote wireless monitoring
system
Fig. 61. SHM for CB32A offshore platform
acquisition and management module, a safety assessment module, an early warning module, and a remote wireless real-time monitoring module. The system has been running since 2003, and its stability, monitoring performance, and real-time data collection all exceed the original expectations. Figure 62 shows parts of the monitored data, indicating the applicability and feasibility of the proposed SHM system in the practical applications.
www.intechopen.com

Life-Cycle Monitoring and Safety Evaluation of Critical Energy Infrastructure Using Full-Scale Distributed Optical Fiber Sensors
113
Fig. 62. Parts of the monitored data
7. References
[1] AM Gillooly, L Zhang, I Bennion. High survivability fiber sensor network for smart structures. SPIE, 2004, 5579:99-106.
[2] D Inaudi and B Glisic. Development of Distributed Strain and Temperature Sensing Cables. 17th International Conference on Optical Fibre Sensors. SPIE, 2005,5855:222-225
[3] DS Jiang, YC Hao, SC Liu, Application of FBG load cell on bowstring arch bridge. Instrument Technique and Sensor, 2006,2: 43-44.
[4] Filippo B, Andrea R, Nestore G, et al. Discontinuous Brillouin strain monitoring of small concrete bridges: comparison between near-to-surface and “smart” FRP fiber installation techniques. Proceedings of SPIE 2005; 5765:612-623.
[5] H Li, JP Ou, Z Zhou, Applications of optical fibre Bragg gratings sensing technology-based smart stay cables optics and lasers in engineering, 2009, 47(10):1077-1084.
[6] JP He, Z Zhou, YH Wu, JP Ou. Temperature inter-compensation for single-line optical fiber sensors based on Briilouin and fiber Bragg grating technique. LASER TECHNOLOGY, 2010, 1(34):13-16.
[7] JP He, Z Zhou, GD Chen, JP Ou. Measurement Accuracy Improvement of Brillouin Signal Using Wavelet Denoising Method. Proceedings of SPIE, 2009, 7293(0B):1-7.
[8] JP Ou, H Li. Structural health monitoring in mainland china: review and future trends. Structural Health Monitoring 2010; 9(3):219-231.
[9] JW Qian, QH Zheng, YN Zhang, et al. Deformation sensing and incremental shape reconstruction for intelligent colonoscopy. Optics and Precision Engineering, 2004, 12(5):518-524.
[10] PC Peng, HY seng, S ChiA. A novel fiber-laser-based sensor network with self-healing function. IEEE PHOTONICS TECHNOLOGY LETTERS, 2003, 2(15):275-277.
[11] PC Peng, HY Seng, S ChiA. A hybrid star-ring architecture for fiber Bragg grating sensor system. IEEE PHOTONICS TECHNOLOGY LETTERS, 2003, 9(15):1270-1272.
[12] P Wei, XH Sun. Smart sensor network is enhanced by new models. SPIE-newsroom, 2007, 10.1117/2.1200707.0523.
www.intechopen.com

Fiber Optic Sensors
114
[13] THT Chan, L Yu, HY Tam, etc. Fiber Bragg grating sensors for structural health monitoring of Tsing Ma Bridge: Background and experimental observation. Engineering Structures 2006; 28(5):648–659.
[14] XJ Zhu, MY Lu, H Cao, et al. 3D Reconstruction Method of Space Manipulator vibration shape based on structural curvatures. The Eighth International Conference on Electronic Measurement and Instruments, 2007, 2:772-775.
[15] XF Zhao, ZD Duan,JP Ou. Local Strain Monitoring Study of Offshore Platform T
Shaped Tubular Joint Using Fiber Bragg Grating Sensors. Proceedings of SPIE, 2008,6932(0E):1-11.
[16] XY Bao, DJ Webb, et al. Combined Distributed Temperature and Strain sensor Based on Brillouin Loss in an Optical Fiber.Optics Letters, 1994,19:141-143
[17] YQ Ni, Y Xia, WY Liao, JM Ko. Technology innovation in developing the structural health monitoring system for Guangzhou New TV Tower. Journal of Structural Control and Health Monitoring 2009; 16:73-98.
[18] Z Zhou, JP Ou. Various Types of Optical FBG Sensors and Their Applications SHM. Proceeding of the 2nd International Conference on Structural Monitoring and Intelligent Infrastructures, Shenzhen China, 2005:489-498.
[19] Z.S. Wu, B. Xu, K.J. Hayashi, et al. Distributed Optic Fiber Sensing for A Full-scale PC Girder Strengthened with Prestressed PBO Sheets. Engineering Structures, 2006, 28: 1049~1059.
[20] Z Zhou, JP He, JP Ou. Measurement technique based on the FBG-BOTDA(R) for infrastructures. China Civil Engineering Journal, 2010,3(43):111-118.
[21] Z Zhou, JP He, JP Ou. Fiber-Reinforced Polymer-Packaged Optical Fiber Sensors based on Brillouin Optical Time-Domain Analysis. Optical Engineering, 2008, 47(014401): 1-10
[22] Z Zhou, JP. He, GD Chen, et al. A new kind of smart cable with functionality of full scale monitoring using BOTDR technique. Proceedings of SPIE, 2009, 7293(0L):1-7.
[23] Z Zhou, JP He, JP Ou. Casing Pipe Damage Detection with Optical Fiber Sensors: a Case Study in Oil Well Constructions. Advances in Civil Engineering, 2010, 638967:1-9.
www.intechopen.com

Fiber Optic SensorsEdited by Dr Moh. Yasin
ISBN 978-953-307-922-6Hard cover, 518 pagesPublisher InTechPublished online 22, February, 2012Published in print edition February, 2012
InTech EuropeUniversity Campus STeP Ri Slavka Krautzeka 83/A 51000 Rijeka, Croatia Phone: +385 (51) 770 447 Fax: +385 (51) 686 166www.intechopen.com
InTech ChinaUnit 405, Office Block, Hotel Equatorial Shanghai No.65, Yan An Road (West), Shanghai, 200040, China
Phone: +86-21-62489820 Fax: +86-21-62489821
This book presents a comprehensive account of recent advances and researches in fiber optic sensortechnology. It consists of 21 chapters encompassing the recent progress in the subject, basic principles ofvarious sensor types, their applications in structural health monitoring and the measurement of variousphysical, chemical and biological parameters. It also highlights the development of fiber optic sensors, theirapplications by providing various new methods for sensing and systems, and describing recent developmentsin fiber Bragg grating, tapered optical fiber, polymer optical fiber, long period fiber grating, reflectometry andinterefometry based sensors. Edited by three scientists with a wide knowledge of the field and the community,the book brings together leading academics and practitioners in a comprehensive and incisive treatment of thesubject. This is an essential reference for researchers working and teaching in optical fiber sensor technology,and for industrial users who need to be aware of current developments and new areas in optical fiber sensordevices.
How to referenceIn order to correctly reference this scholarly work, feel free to copy and paste the following:
Zhi Zhou, Jianping He and Jinping Ou (2012). Life-Cycle Monitoring and Safety Evaluation of Critical EnergyInfrastructure Using Full-Scale Distributed Optical Fiber Sensors, Fiber Optic Sensors, Dr Moh. Yasin (Ed.),ISBN: 978-953-307-922-6, InTech, Available from: http://www.intechopen.com/books/fiber-optic-sensors/life-cycle-monitoring-and-safety-evaluation-of-critical-energy-infrastructure-using-full-scale-distr


![The Matrix Cookbook - University of Waterloohwolkowi/matrixcookbook.pdf · · 2013-12-03The Matrix Cookbook [ ] Kaare Brandt Petersen Michael Syskind Pedersen Version: November](https://img.pdfslide.us/doc/110x75/5b08254d7f8b9a93738be902/the-matrix-cookbook-university-of-hwolkowimatrixcookbookpdf2013-12-03the-matrix.jpg)