Embed Size (px)
Citation preview

Life cycle GHG emissions of biofuels: Results from review of studies
Emanuela Menichetti
UNEP-DTIE, Energy Branch
European Environment Agency Expert workshop
Copenhagen, 10 June 2008
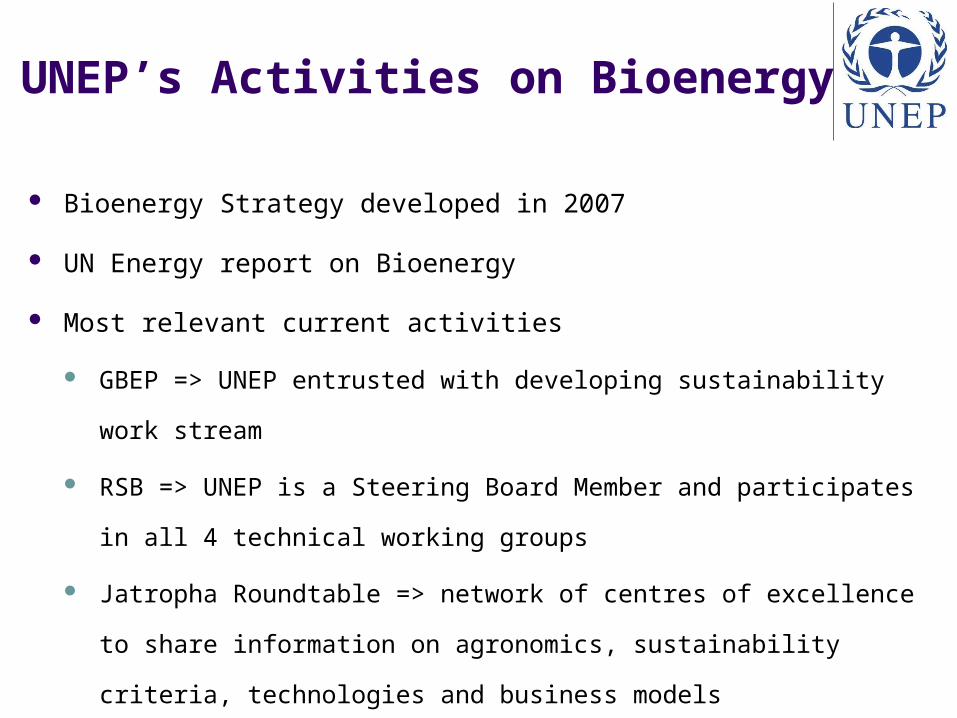
Bioenergy Strategy developed in 2007
UN Energy report on Bioenergy
Most relevant current activities
GBEP => UNEP entrusted with developing sustainability work stream
RSB => UNEP is a Steering Board Member and participates in all 4
technical working groups
Jatropha Roundtable => network of centres of excellence to share
information on agronomics, sustainability criteria, technologies and
business models
UNEP’s Activities on Bioenergy
Two main review studies
Chapter on LCA for the OECD MCM report in cooperation
with the IEA
Report for the International Panel for Sustainable
Resource Management
Life cycle GHG emissions of biofuels

Overview
Review and analysis of 60 studies Full LCA studies: 32% Energy and GHG emission balances: 33% Methodological / review studies: 23% Life cycle inventories: 7% Energy balances: 5%
Focus mostly on transport applications

Selected results for GHG (w/o LUC)
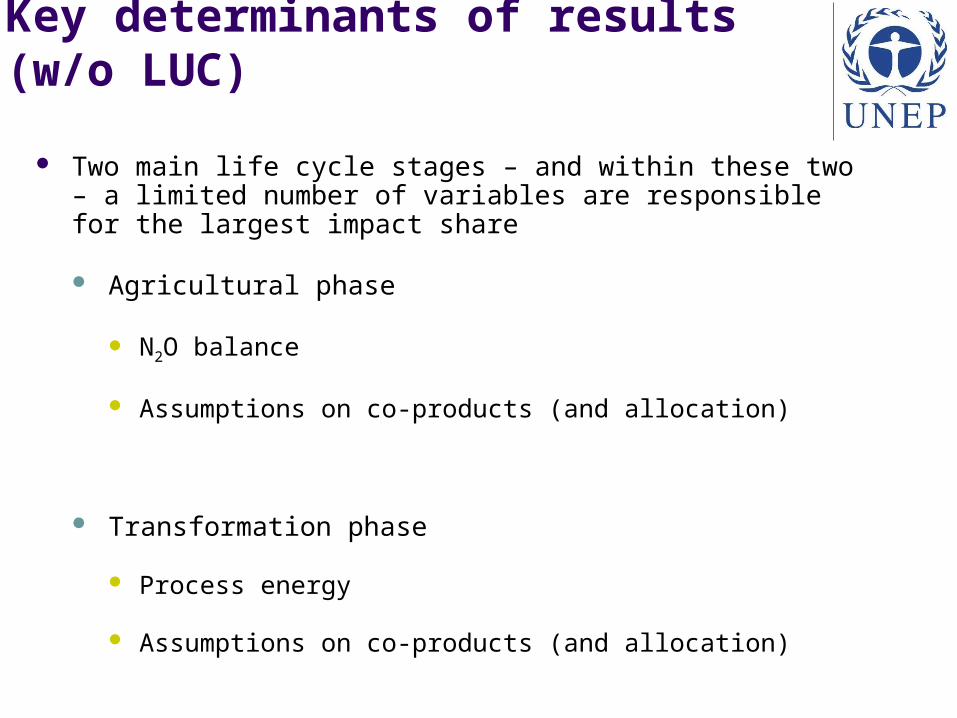
Key determinants of results (w/o LUC)
Two main life cycle stages – and within these two – a limited number of variables are responsible for the largest impact share
Agricultural phase
N2O balance
Assumptions on co-products (and allocation)
Transformation phase
Process energy
Assumptions on co-products (and allocation)
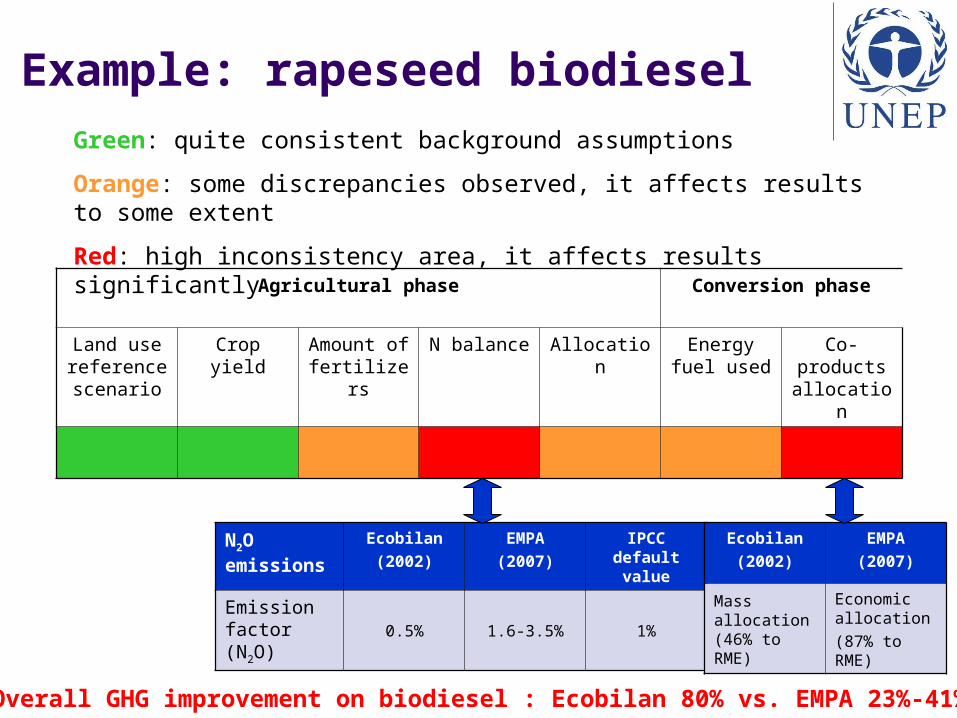
Example: rapeseed biodiesel
Agricultural phase Conversion phase
Land use reference scenario
Crop yield Amount of fertilizers
N balance Allocation Energy fuel used
Co-products allocation
Green: quite consistent background assumptions
Orange: some discrepancies observed, it affects results to some extent
Red: high inconsistency area, it affects results significantly
N2O emissions
Ecobilan
(2002)
EMPA
(2007)
IPCC default value
Emission factor (N2O) 0.5% 1.6-3.5% 1%
Ecobilan
(2002)
EMPA
(2007)
Mass allocation (46% to RME)
Economic allocation
(87% to RME)
Overall GHG improvement on biodiesel : Ecobilan 80% vs. EMPA 23%-41%

Allocation methods
QUESTIONS: What is the most appropriate allocation method for biofuel co-products for
regulation purposes? One method for whole life cycle or mixed approach? Consistency with allocation method(s) in fossil fuel chains?
Sub-division
System expansion
Allocation based on physical criteria
Allocation based on
other criteria
Mixed methods
No allocation
to co-products
Not applicable /
Not available
Mass-based
allocation
Energy content-based
allocation
Economic allocation
1 21 2 3 7 8 1 17
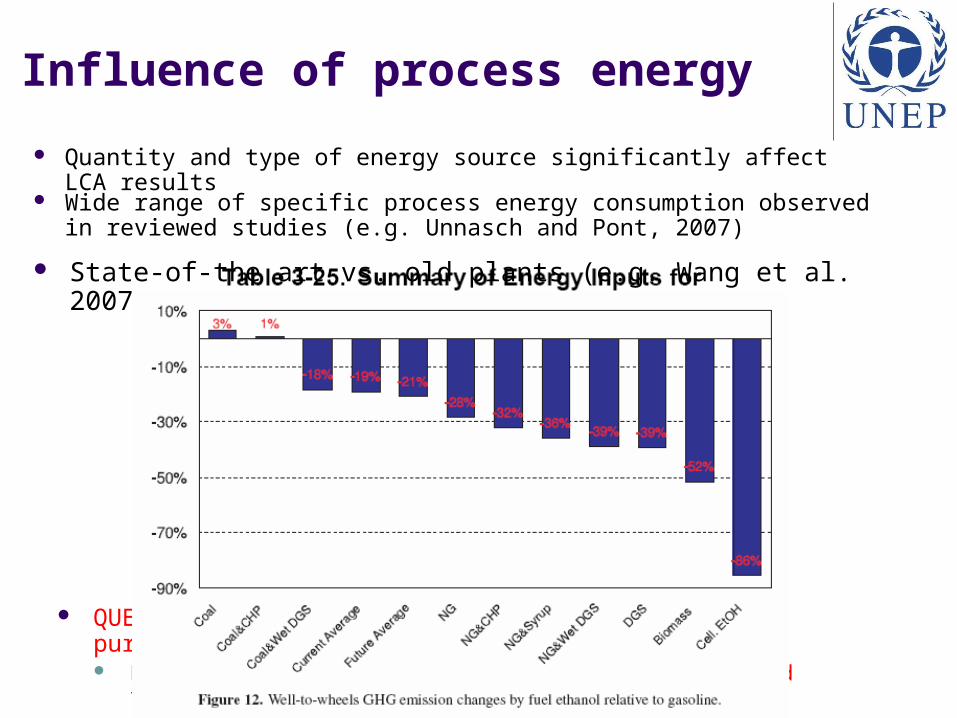
Influence of process energy
QUESTION: What should be used for regulation purposes? Present average mix, state-of-the art, BAT, expected trends?
Quantity and type of energy source significantly affect LCA results
State-of-the art vs. old plants (e.g. Wang et al. 2007)
Wide range of specific process energy consumption observed in reviewed studies (e.g. Unnasch and Pont, 2007)
Other methodological aspects
Various (and non harmonised) LCI databases
Various LCIA methods used
Most studies only cover CO2, N2O and CH4
Various reference scenarios modelled
Uncertainty related to the fossil fuel chain: Variability in assumptions and results of fossil fuel chains
Lack of updated LCA of marginal fossil fuel production (deep
extraction, unconventional oils)
Comparison with average or marginal fossil fuels?
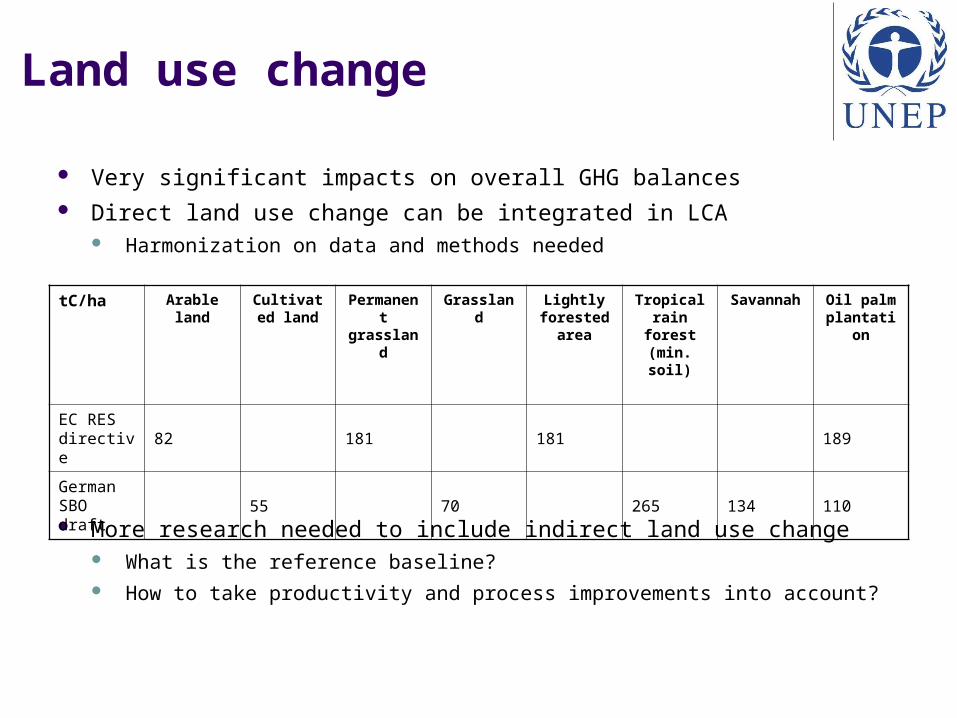
Land use change
Very significant impacts on overall GHG balances Direct land use change can be integrated in LCA
Harmonization on data and methods needed
More research needed to include indirect land use change What is the reference baseline? How to take productivity and process improvements into account?
tC/ha Arable land
Cultivated land
Permanent grassland
Grassland Lightly forested
area
Tropical rain forest (min. soil)
Savannah Oil palm plantation
EC RES directive 82 181 181 189
German SBO draft 55 70 265 134 110
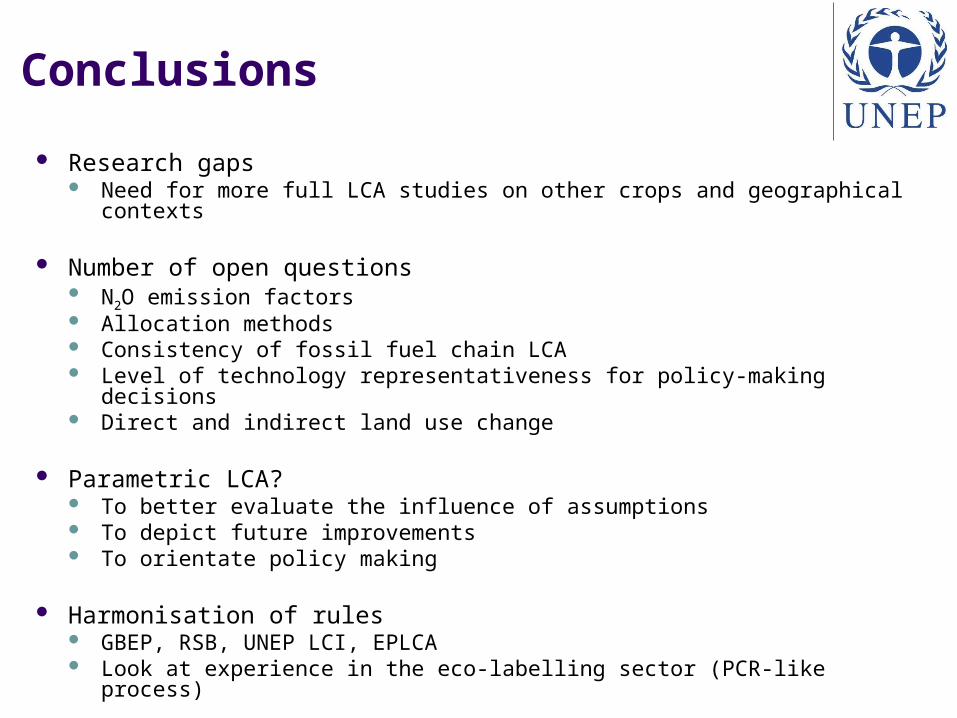
Conclusions
Research gaps Need for more full LCA studies on other crops and geographical contexts
Number of open questions N2O emission factors Allocation methods Consistency of fossil fuel chain LCA Level of technology representativeness for policy-making decisions Direct and indirect land use change
Parametric LCA? To better evaluate the influence of assumptions To depict future improvements To orientate policy making
Harmonisation of rules GBEP, RSB, UNEP LCI, EPLCA Look at experience in the eco-labelling sector (PCR-like process)
Division of Technology, Industry and EconomicsDivision of Technology, Industry and EconomicsEnergy BranchEnergy Branch
15 rue de Milan, 75009 Paris15 rue de Milan, 75009 ParisFranceFrance
tel. : +33.1.44.37.30.07tel. : +33.1.44.37.30.07
fax. : fax. : +33.1.44.37.14. 74+33.1.44.37.14. 74e-mail: [email protected]: [email protected]
www.uneptie.fr/energywww.uneptie.fr/energy