Embed Size (px)
Citation preview
© Copyright 2001 by the MassachusettsInstitute of Technology and YaleUniversity
Volume 4, Number 2
y A P P L I C AT I O N S A N D I M PL E M E N TAT I O N
Journal of Industrial Ecology 135
Life-Cycle Energy, Costs,and Strategies for Improvinga Single-Family HouseGregory A. KeoleianCenter for Sustainable SystemsUniversity of MichiganAnn Arbor, MI, USA
Steven BlanchardClean Air CampaignColorado Springs, CO, USA
Peter ReppeCenter for Sustainable SystemsUniversity of MichiganAnn Arbor, MI, USA
y
Summary
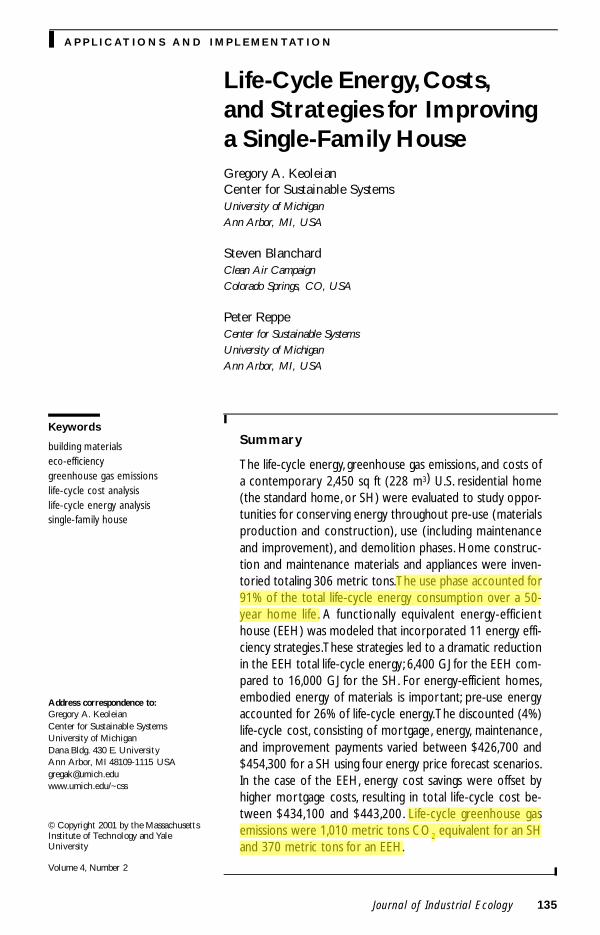
The life-cycle energy, greenhouse gas emissions, and costs ofa contemporary 2,450 sq ft (228 m3) U.S. residential home(the standard home, or SH) were evaluated to study oppor-tunities for conserving energy throughout pre-use (materialsproduction and construction), use (including maintenanceand improvement), and demolition phases. Home construc-tion and maintenance materials and appliances were inven-toried totaling 306 metric tons. The use phase accounted for91% of the total life-cycle energy consumption over a 50-year home life. A functionally equivalent energy-efficienthouse (EEH) was modeled that incorporated 11 energy effi-ciency strategies. These strategies led to a dramatic reductionin the EEH total life-cycle energy; 6,400 GJ for the EEH com-pared to 16,000 GJ for the SH. For energy-efficient homes,embodied energy of materials is important; pre-use energyaccounted for 26% of life-cycle energy. The discounted (4%)life-cycle cost, consisting of mortgage, energy, maintenance,and improvement payments varied between $426,700 and$454,300 for a SH using four energy price forecast scenarios.In the case of the EEH, energy cost savings were offset byhigher mortgage costs, resulting in total life-cycle cost be-tween $434,100 and $443,200. Life-cycle greenhouse gasemissions were 1,010 metric tons CO2 equivalent for an SHand 370 metric tons for an EEH.
y
Keywords
building materialseco-efficiencygreenhouse gas emissionslife-cycle cost analysislife-cycle energy analysissingle-family house
Address correspondence to:Gregory A. KeoleianCenter for Sustainable SystemsUniversity of MichiganDana Bldg. 430 E. UniversityAnn Arbor, MI 48109-1115 [email protected]/~css
136 Journal of Industrial Ecology
y AP P L I C AT I O N S A N D I M P L E M EN TAT I O N
Introduction
The design and construction of a new houseis one of the most resource-intensive and eco-nomically significant decisions made by devel-opers and consumers. In 1998, 1.62 million newhomes were built in the United States, of whichapproximately 1.28 million were single detacheddwellings and 0.34 million were multifamilyunits (NAHB 1999). Household energy con-sumption accounts for approximately 11% of thetotal U.S. energy consumption.1 This translatesinto an average annual household expenditureof $1,282 for all major energy sources. The resi-dential home construction industry accounts for43% of all U.S. construction expenditures(Construction Review 1997). During 1992,single home construction accounted for $49.5billion in total value of business (U.S. Depart-ment of Commerce 1995). Of this amount, theindustry paid $16.7 billion for materials, compo-nents, and supplies and $15.0 billion for con-struction work subcontracted to others. Costs forselected power, fuels, and lubricants for the in-dustry were $647 million. Gaining a better un-derstanding of the specific material and energyflows and costs associated with an individualresidential home requires the application of thetools of industrial ecology.
A comprehensive assessment of the resourceintensity of a residential home requires a life-cycle perspective. The life cycle of a house en-compasses materials production, construction,operation and maintenance, and demolition.Most research on energy consumption has fo-cused on the use phase of a house. More recently,some attention has been directed toward recog-nizing the energy associated with the productionof construction materials. In 1992, the AmericanInstitute of Architects (AIA) began to developthe Environmental Resource Guide for Archi-tects, which featured environmental character-izations of a variety of building materials andcomponents including steel, concrete, wood,glass, brick and mortar, plaster and lath, ceilingsystems, and gypsum board systems (AIA 1992).These characterizations provide a qualitative de-scription of the inputs, outputs, and environ-mental impacts associated with each material’slife cycle. Energy requirements for the produc-
tion of materials also are reported in Btu/lb orMJ/kg, but other quantitative metrics are lim-ited. The National Institute of Standards andTechnology has developed a software tool for se-lecting “environmentally and economically bal-anced building products.” The BEES (Buildingfor Environmental and Economic Sustainability)tool provides a more comprehensive life-cycleinventory analysis for a select group of construc-tion materials (BEES 1998). BEES also provideslife-cycle cost data on the initial investment, re-placement, operation, maintenance and repair,and disposal of alternatives.
A few life-cycle energy analyses have focusedon construction materials in residential dwell-ings.2 Cole (1993) studied the embodied energyof alternative wall assemblies including 2 ´ 6 wallconstruction, increasing roof insulation, and in-creasing the amount of south-facing windowarea. He found that, although the embodied en-ergy (materials production and construction) wasincreased in each case, the use-phase energy sav-ings was more significant. A comparison of howembodied energy and heating energy vary amonggeneric wall systems (Pierquet et al. 1998) foundthat straw bale wall systems provide the bestcombination of higher insulating value and lowerembodied energy. Cole (1999) investigated en-ergy and greenhouse gas emissions associatedwith the construction of alternative structuralsystems and determined the significance of on-site construction relative to total initial embod-ied energy associated with materials productionand fabrication. He found that construction ac-counted for 6% to 16% of the total embodied en-ergy for wood assemblies, 2% to 5% for steelassemblies, and 11% to 25% for concrete assem-blies. Debnath and colleagues (1995) determinedthe energy requirements for major building mate-rials of residential buildings in India. Energy in-tensity varied from 3 to 5 GJ/m2 of floor area forsingle, double, and multistory dwellings. Thestudies by Cole (1999), Debnath and colleagues(1995), and Pierquet and colleagues (1998) indi-cate how alternative structural materials influ-ence the life-cycle energy profile of a home.
This study addresses the primary life-cycleenergy consumption, the corresponding releaseof greenhouse gases, and related costs for theconstruction and use of a typical detached home
Keoleian, Blanchard, and Reppe, Life-Cycle Energy, Costs, and Strategies for Housing 137
A P P L I C AT I O N S AN D I M P L E M EN TATI O N y
in the United States. Whereas previous life-cycle studies have focused on structural elementsof a home, this investigation addresses the entireset of home subsystems and components, includ-ing wall systems, flooring, roof and ceiling sys-tems, foundation and basement, doors andwindows (fenestration systems), appliances andelectrical systems, sanitary systems, andcabinetry. Life-cycle building costs have beenanalyzed previously (ASTM 1993), but this in-vestigation links life-cycle energy and costs for aspecific residential home. In addition, the use ofeffective design strategies to reduce life-cycleenergy and greenhouse gas emissions are ex-plored. Although the use phase currently domi-nates the life-cycle energy consumption, theimportance of materials production and manu-facturing/construction are expected to increaseas designs become more energy-efficient. Thisresearch will demonstrate how eco-efficiencycan influence the life-cycle energy profile.
The research consisted of three primary ele-ments. First, four life-cycle metrics, mass, energy,global warming potential (GWP), and cost,were determined for a 2,450 sq ft home built inAnn Arbor, Michigan, referred to as the Stan-dard Home (SH). Second, a portfolio of primaryenergy-reducing strategies were investigated toimprove the SH. The new structure, referred toas the Energy-Efficient Home (EEH), incorpo-rated the same floor plan and architectural styleas the SH. Third, the same four life-cyclemetrics were calculated for the EEH.
Methods
Life-cycle inventories for the SH and theEEH were calculated, using the mass of con-struction materials, processing, and manufactur-ing energy requirements; annual energyconsumption; energy for demolition; and trans-portation energy requirements. The total life-cycle energy and GWP were determined fromthese model inputs. To ensure that the model re-flected the impact of scheduled home improve-ment projects and maintenance, the frequencyof these activities was estimated along with themass and embodied energy of the materials used.Key features of the life-cycle energy and costanalyses follow. (A more detailed description of
the modeling is provided elsewhere (Blanchardand Reppe 1998).) Although this study focuseson life-cycle energy and greenhouse gas emis-sions, future work should also consider other en-vironmental aspects, including air and waterpollutant emissions and solid waste generation,and their related consequences, including acidi-fication, ozone depletion, smog formation,eutrophication, and human and ecological tox-icity. Although many burdens and impacts aredirectly associated with energy consumption,many effects, nevertheless, originate from non-combustion–related processes.
System Definition
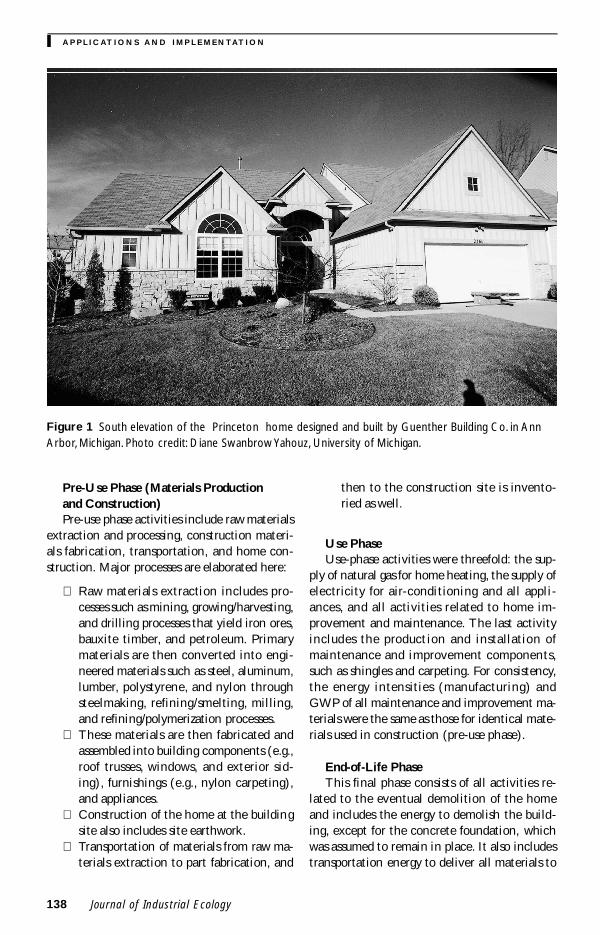
The home studied was a single-family, two-story residence with 2,450 ft2 (228 m2) of primaryliving area, an attached two-car garage (484 ft2),and an unfinished basement (1,675 ft2), recentlybuilt in a new Ann Arbor, Michigan subdivisionand referred to as the Standard Home (SH). Thishome is shown in figure 1. The 2 ´ 4 frame con-struction is typical of the majority of homes builtin the United States. The basis for this analysis isa 50-year service life.
Three options for defining the EEH were ex-plored. Selecting a home with nearly identicalfunctionality was important. Usable floor spaceand equivalent room function were stressed. Thefirst option consisted of finding an energy-effi-cient passive solar home already built in the up-per Midwest with a floor arrangement similar tothat of the SH. A second alternative would haverequired the design of a new energy-efficienthome incorporating passive solar heating, butensuring functional equivalence. The third (andselected method) consisted of modeling the ther-mal characteristics of the SH and making incre-mental changes to achieve the desiredenergy-efficiency attributes. The selected methodensured near functional equivalency, an objec-tive that was much more problematic for the firsttwo methods.
Life-Cycle Phases
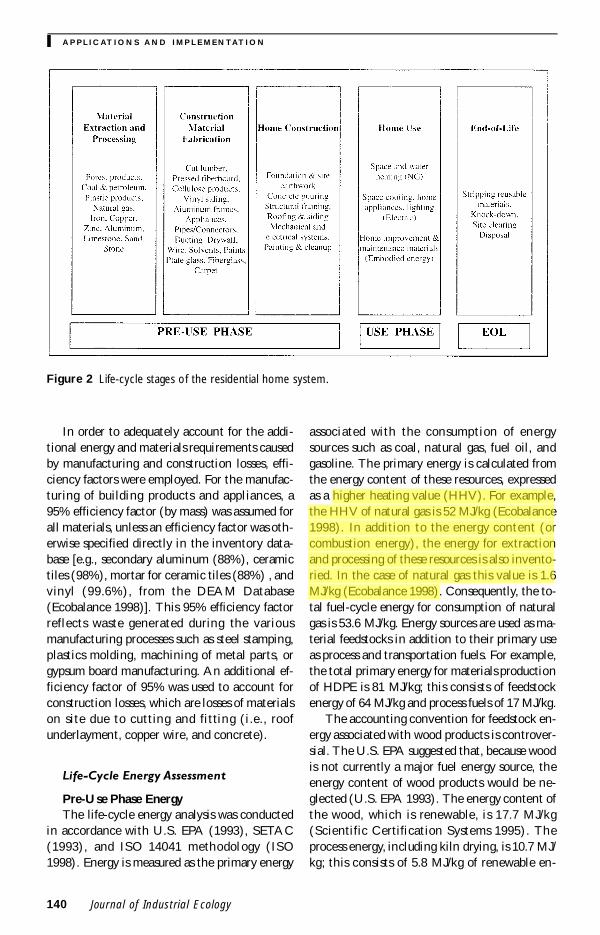
Figure 2 defines the key process phases of thehome life cycle. The boundaries and major ac-tivities of each life-cycle stage are described here.
138 Journal of Industrial Ecology
y AP P L I C AT I O N S A N D I M P L E M EN TAT I O N
Pre-Use Phase (Materials Productionand Construction)Pre-use phase activities include raw materials
extraction and processing, construction materi-als fabrication, transportation, and home con-struction. Major processes are elaborated here:
� Raw materials extraction includes pro-cesses such as mining, growing/harvesting,and drilling processes that yield iron ores,bauxite timber, and petroleum. Primarymaterials are then converted into engi-neered materials such as steel, aluminum,lumber, polystyrene, and nylon throughsteelmaking, refining/smelting, milling,and refining/polymerization processes.
� These materials are then fabricated andassembled into building components (e.g.,roof trusses, windows, and exterior sid-ing), furnishings (e.g., nylon carpeting),and appliances.
� Construction of the home at the buildingsite also includes site earthwork.
� Transportation of materials from raw ma-terials extraction to part fabrication, and
then to the construction site is invento-ried as well.
Use PhaseUse-phase activities were threefold: the sup-
ply of natural gas for home heating, the supply ofelectricity for air-conditioning and all appli-ances, and all activities related to home im-provement and maintenance. The last activityincludes the production and installation ofmaintenance and improvement components,such as shingles and carpeting. For consistency,the energy intensities (manufacturing) andGWP of all maintenance and improvement ma-terials were the same as those for identical mate-rials used in construction (pre-use phase).
End-of-Life PhaseThis final phase consists of all activities re-
lated to the eventual demolition of the homeand includes the energy to demolish the build-ing, except for the concrete foundation, whichwas assumed to remain in place. It also includestransportation energy to deliver all materials to
Figure 1 South elevation of the Princeton home designed and built by Guenther Building Co. in AnnArbor, Michigan. Photo credit: Diane Swanbrow Yahouz, University of Michigan.
Keoleian, Blanchard, and Reppe, Life-Cycle Energy, Costs, and Strategies for Housing 139
A P P L I C AT I O N S AN D I M P L E M EN TATI O N y
landfills or recycling facilities. This study did notaccount for potential energy expenditures orcredits from future reuse or recycling of disposedend-of-life materials.
Omissions
Processes and systems not modeled in thisstudy include:
� site location as it pertains to impacts on lo-cal ecosystems, personal transportation is-sues (e.g., commuting energy consumptioncan be very significant), and urban planningissues (e.g., roads and sewer infrastructure)
� energy and materials issues related to exter-nal house infrastructure (e.g., driveway con-crete, landscaping, and irrigation systems)
� furniture (except built-in kitchen andbathroom cabinets) and curtains
� utility hookups including water and gasmains, and electrical power connections(e.g., excavation of mains, pipes, wiring,and meters) up to the point where theyenter the building
� household supplies including food, cloth-ing, entertainment equipment, and clean-ing materials
� municipal services including the produc-tion and disposal/treatment of potable wa-ter and collection and disposal ofmunicipal solid waste (consequently,methane emissions during biodegradationprocesses were not inventoried)
� worker transportation to manufacturingand construction sites
� changes over time in the mix of powerplant fuels that can affect energy effi-ciency and greenhouse gas emissions
� changes over time in home electricity con-sumption, possibly resulting from newergenerations of energy-efficient appliancesor greater use of home office equipment
EEH Strategies
Numerous primary strategies for loweringlife-cycle energy consumption were investigated.These strategies mainly focused on methods toreduce utility-supplied energy. The reduction of
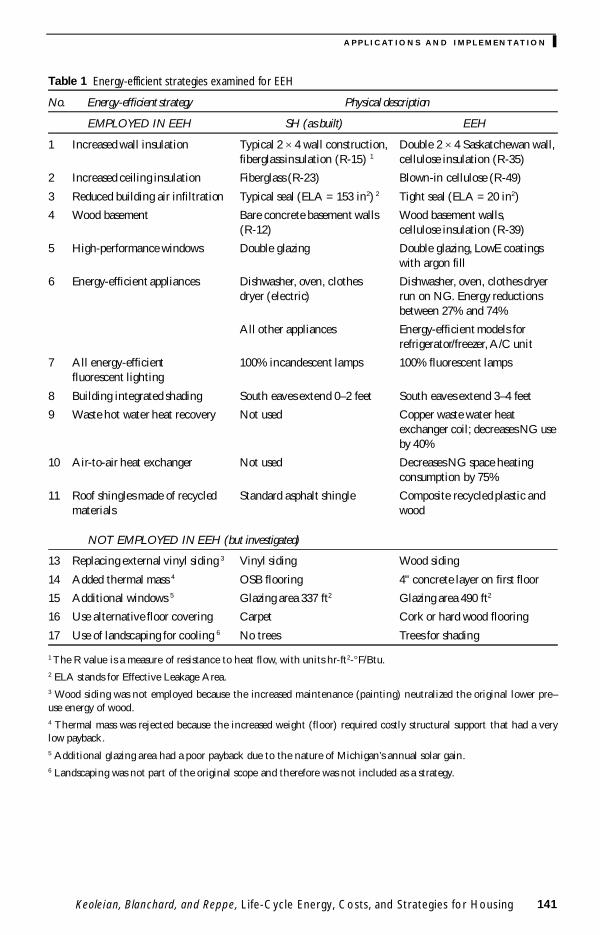
the embodied energy of construction materialsand increased product durability were also ad-dressed. Table 1 below shows the major strate-gies investigated.
Life-Cycle Mass Assessment
The life-cycle mass assessment evaluated thetotal mass of building materials required to con-struct and maintain the SH and EEH over theestimated 50-year service life. The SH mass wasassessed from construction drawings, field mea-surements, and supplier’s data. Many home con-struction materials and appliances (e.g.,windows, carpet, and kitchen appliances) con-sist of a combination of multiple primary mate-rials. Where possible, the mass of eachcomponent material was determined by directmeasurement or by multiplying measured di-mensions (volume) by material density. Homeimprovement and maintenance materials werealso determined.
The greatest difficulty in determining themass composition of individual components oc-curred with electrical appliances. Suppliers donot normally provide such information, andwithout the use of destructive testing, accuratedetermination was not possible. Consequently, astudy of a kitchen range (Jungbluth 1997) wasused as a surrogate to establish the material com-position for all other appliances. A more recentpaper (Deumling 1999) provides compositiondata on refrigerators. Deumling’s work couldlead to refinements on total composition andmass of appliances. Using composition data forsteel, plastics, copper, etc., the material compo-sition of all other electric appliances was esti-mated using shipping weights provided by localdistributors. Although this method introduceserror, it was rather negligible when comparedwith the overall mass of the house system. Ap-pliance mass accounts for less than 1.5% of thetotal life-cycle mass of the home. Over 90% ofthe total mass of each appliance studied wassteel. Thus, the error in estimating the mass ofnonsteel materials for all other appliances is ex-pected to be less than 0.15% of the life-cyclemass of the home. The same procedures wereused to determine overall life-cycle EEH massand material composition.
140 Journal of Industrial Ecology
y AP P L I C AT I O N S A N D I M P L E M EN TAT I O N
Figure 2 Life-cycle stages of the residential home system.
In order to adequately account for the addi-tional energy and materials requirements causedby manufacturing and construction losses, effi-ciency factors were employed. For the manufac-turing of building products and appliances, a95% efficiency factor (by mass) was assumed forall materials, unless an efficiency factor was oth-erwise specified directly in the inventory data-base [e.g., secondary aluminum (88%), ceramictiles (98%), mortar for ceramic tiles (88%) , andvinyl (99.6%), from the DEAM Database(Ecobalance 1998)]. This 95% efficiency factorreflects waste generated during the variousmanufacturing processes such as steel stamping,plastics molding, machining of metal parts, orgypsum board manufacturing. An additional ef-ficiency factor of 95% was used to account forconstruction losses, which are losses of materialson site due to cutting and fitting (i.e., roofunderlayment, copper wire, and concrete).
Life-Cycle Energy Assessment
Pre-Use Phase EnergyThe life-cycle energy analysis was conducted
in accordance with U.S. EPA (1993), SETAC(1993), and ISO 14041 methodology (ISO1998). Energy is measured as the primary energy
associated with the consumption of energysources such as coal, natural gas, fuel oil, andgasoline. The primary energy is calculated fromthe energy content of these resources, expressedas a higher heating value (HHV). For example,the HHV of natural gas is 52 MJ/kg (Ecobalance1998). In addition to the energy content (orcombustion energy), the energy for extractionand processing of these resources is also invento-ried. In the case of natural gas this value is 1.6MJ/kg (Ecobalance 1998). Consequently, the to-tal fuel-cycle energy for consumption of naturalgas is 53.6 MJ/kg. Energy sources are used as ma-terial feedstocks in addition to their primary useas process and transportation fuels. For example,the total primary energy for materials productionof HDPE is 81 MJ/kg; this consists of feedstockenergy of 64 MJ/kg and process fuels of 17 MJ/kg.
The accounting convention for feedstock en-ergy associated with wood products is controver-sial. The U.S. EPA suggested that, because woodis not currently a major fuel energy source, theenergy content of wood products would be ne-glected (U.S. EPA 1993). The energy content ofthe wood, which is renewable, is 17.7 MJ/kg(Scientific Certification Systems 1995). Theprocess energy, including kiln drying, is 10.7 MJ/kg; this consists of 5.8 MJ/kg of renewable en-
Keoleian, Blanchard, and Reppe, Life-Cycle Energy, Costs, and Strategies for Housing 141
A P P L I C AT I O N S AN D I M P L E M EN TATI O N y
Table 1 Energy-efficient strategies examined for EEH
No. Energy-efficient strategy Physical description
EMPLOYED IN EEH SH (as built) EEH
1 Increased wall insulation Typical 2 ´ 4 wall construction, Double 2 ́ 4 Saskatchewan wall,fiberglass insulation (R-15) 1 cellulose insulation (R-35)
2 Increased ceiling insulation Fiberglass (R-23) Blown-in cellulose (R-49)
3 Reduced building air infiltration Typical seal (ELA = 153 in2) 2 Tight seal (ELA = 20 in2)
4 Wood basement Bare concrete basement walls Wood basement walls,(R-12) cellulose insulation (R-39)
5 High-performance windows Double glazing Double glazing, LowE coatingswith argon fill
6 Energy-efficient appliances Dishwasher, oven, clothes Dishwasher, oven, clothes dryerdryer (electric) run on NG. Energy reductions
between 27% and 74%
All other appliances Energy-efficient models forrefrigerator/freezer, A/C unit
7 All energy-efficient 100% incandescent lamps 100% fluorescent lampsfluorescent lighting
8 Building integrated shading South eaves extend 0–2 feet South eaves extend 3–4 feet
9 Waste hot water heat recovery Not used Copper waste water heatexchanger coil; decreases NG useby 40%
10 Air-to-air heat exchanger Not used Decreases NG space heatingconsumption by 75%
11 Roof shingles made of recycled Standard asphalt shingle Composite recycled plastic andmaterials wood
NOT EMPLOYED IN EEH (but investigated)
13 Replacing external vinyl siding 3 Vinyl siding Wood siding
14 Added thermal mass 4 OSB flooring 4" concrete layer on first floor
15 Additional windows 5 Glazing area 337 ft2 Glazing area 490 ft2
16 Use alternative floor covering Carpet Cork or hard wood flooring
17 Use of landscaping for cooling 6 No trees Trees for shading
1 The R value is a measure of resistance to heat flow, with units hr-ft2-°F/Btu.2 ELA stands for Effective Leakage Area.3 Wood siding was not employed because the increased maintenance (painting) neutralized the original lower pre–use energy of wood.4 Thermal mass was rejected because the increased weight (floor) required costly structural support that had a verylow payback.5 Additional glazing area had a poor payback due to the nature of Michigan’s annual solar gain.6 Landscaping was not part of the original scope and therefore was not included as a strategy.
142 Journal of Industrial Ecology
y AP P L I C AT I O N S A N D I M P L E M EN TAT I O N
ergy (burned tree limbs) and 4.9 MJ/kg of non-renewable energy. In this analysis both renew-able and nonrenewable energy components wereinventoried. Consequently, the total energy forwood, including the feedstock energy (17.7 MJ/kg), is 28.5 MJ/kg.
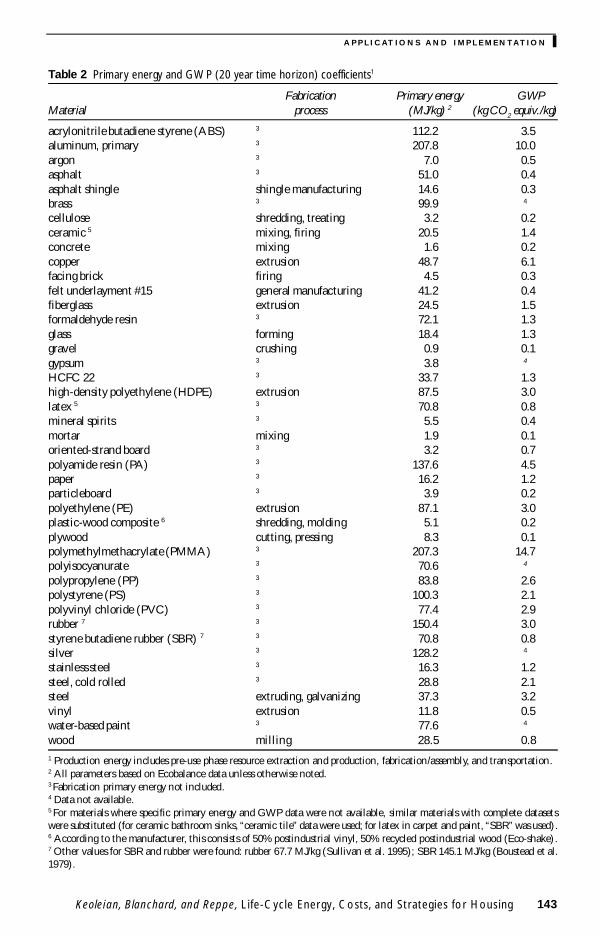
Table 2 provides a list of all materials inven-toried in SH and EEH and gives both the pri-mary energy and global warming potential perunit of mass. The same matrix was used in deter-mining EEH pre-use phase primary energy.
Use-Phase Energy
Natural gas SH annual energy consumption forheating was modeled using “Energy-10,” an en-ergy-modeling software program by the PassiveSolar Industries Council (PSIC 1998). Programinputs include building dimensions and layout,thermal performance of the building envelope,HVAC characteristics, number/type/orientationof windows, building location/latitude, and elec-trical usage (to calculate internal heat gains).
National Renewable Energy Lab (NREL)weather data for Detroit was used to simulateannual temperature, insolation, and wind char-acteristics for Ann Arbor, Michigan. Internalheat gains from waste heat released from electri-cal appliances, lighting, hot water, and humanoccupancy (adults radiate approximately 100Watt/person) were estimated. These heat gainsreduce the amount of natural gas heating re-quired in a home. Other factors that determineannual natural gas heating requirements includethermostat temperature settings, effective airleakage of the building envelope, and internalthermal mass. Using these parameters, Energy-10 calculates the total heating requirements(combustion energy) for one year.
Energy-10 estimated the annual SH naturalgas consumption for heating to be 2,518 MJ (notincluding precombustion energy). To validatethe accuracy of the program output, this valuewas compared with the average annual spaceheating requirement for U.S. midwest homes(average size 1,880 ft2), which is 2,035 MJ (DOE1995). Adjusting this value for SH floor areagives an annual heating value of 2,643 MJ,which is only 5% higher than the value deter-mined by Energy-10.
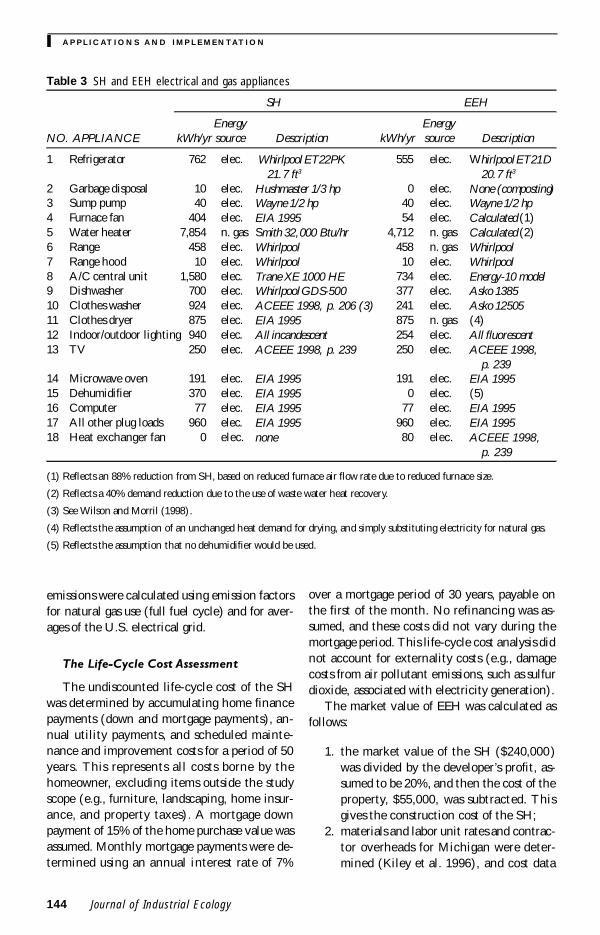
Electricity Table 3 provides a list of electricalappliances used in the SH and selected for use inthe EEH. These electricity consumption valuesare converted to total primary energy for elec-tricity generation using an electricity productionefficiency of 0.32 for the U.S. grid. This analysisassumes a constant production efficiency forboth the SH and the EEH over the 50-year ser-vice life. Increases in the electricity productionefficiency over time would reduce the magnitudeof the difference in total primary energy betweenthe SH and the EEH. Electricity conservationwith the EEH could make renewable technolo-gies, such as photovoltaics, more feasible. Theimplications of grid fuel-mix changes caused bymarginal reductions in electricity demand asmore EEHs are built were not investigated.
Electrical energy consumption was deter-mined independently from Energy-10. The final-ized electricity consumption data for the SH andthe EEH were input into Energy-10 to allow forthe accounting of the electrical waste heat loads.
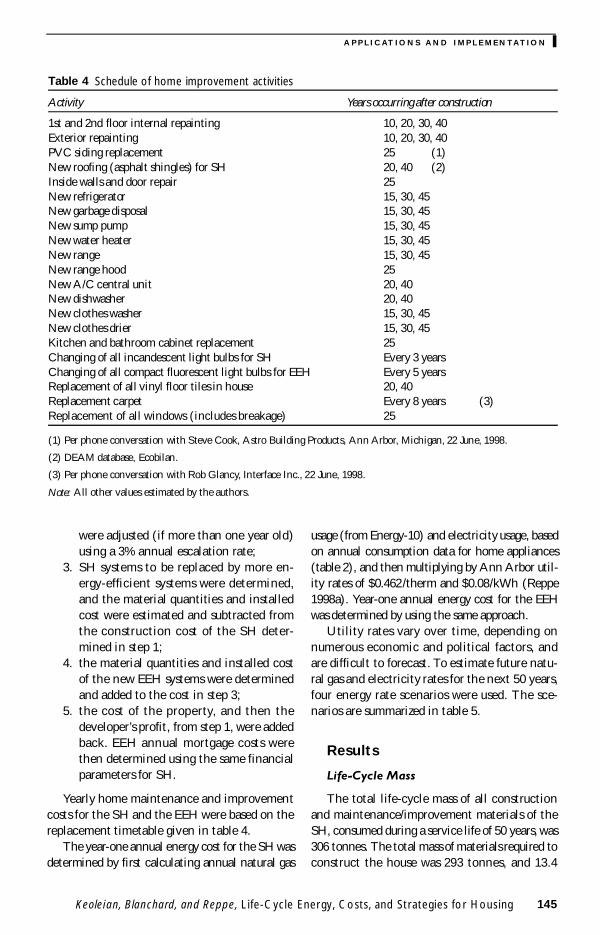
Home improvements and maintenance A schedulewas developed to determine the contributions ofmaintenance and home improvements to life-cycle energy consumption and GWP. The sched-ule accounts for those regular and unplannedmaintenance activities needed to keep the homein good repair (e.g., repair of broken windows,changing of light bulbs), as well as major homeimprovements (e.g., replacement of siding, car-pet, and roofing). Table 4 provides an overview ofhome maintenance and improvement assump-tions, based on a home life of 50 years. Replace-ment rate data were collected from interviewswith contractors, suppliers, and distributors.
Life-Cycle GWP Assessment
Determining life-cycle global warming po-tential was similar to the assessment of life-cycleenergy. Greenhouse gas emissions associatedwith materials production and fabrication stageswere determined by multiplying the emissionfactors in kg of CO2 equivalents per kg of con-struction materials by the life-cycle mass inputsof each material (table 3). Greenhouse gas emis-sions associated with transportation fuels werealso inventoried. Use-phase greenhouse gas
Keoleian, Blanchard, and Reppe, Life-Cycle Energy, Costs, and Strategies for Housing 143
A P P L I C AT I O N S AN D I M P L E M EN TATI O N y
Table 2 Primary energy and GWP (20 year time horizon) coefficients1
Fabrication Primary energy GWPMaterial process (MJ/kg) 2 (kg CO2 equiv./kg)
acrylonitrile butadiene styrene (ABS) 3 112.2 3.5aluminum, primary 3 207.8 10.0argon 3 7.0 0.5asphalt 3 51.0 0.4asphalt shingle shingle manufacturing 14.6 0.3brass 3 99.9 4
cellulose shredding, treating 3.2 0.2ceramic 5 mixing, firing 20.5 1.4concrete mixing 1.6 0.2copper extrusion 48.7 6.1facing brick firing 4.5 0.3felt underlayment #15 general manufacturing 41.2 0.4fiberglass extrusion 24.5 1.5formaldehyde resin 3 72.1 1.3glass forming 18.4 1.3gravel crushing 0.9 0.1gypsum 3 3.8 4
HCFC 22 3 33.7 1.3high-density polyethylene (HDPE) extrusion 87.5 3.0latex 5 3 70.8 0.8mineral spirits 3 5.5 0.4mortar mixing 1.9 0.1oriented-strand board 3 3.2 0.7polyamide resin (PA) 3 137.6 4.5paper 3 16.2 1.2particleboard 3 3.9 0.2polyethylene (PE) extrusion 87.1 3.0plastic-wood composite 6 shredding, molding 5.1 0.2plywood cutting, pressing 8.3 0.1polymethylmethacrylate (PMMA) 3 207.3 14.7polyisocyanurate 3 70.6 4
polypropylene (PP) 3 83.8 2.6polystyrene (PS) 3 100.3 2.1polyvinyl chloride (PVC) 3 77.4 2.9rubber 7 3 150.4 3.0styrene butadiene rubber (SBR) 7 3 70.8 0.8silver 3 128.2 4
stainless steel 3 16.3 1.2steel, cold rolled 3 28.8 2.1steel extruding, galvanizing 37.3 3.2vinyl extrusion 11.8 0.5water-based paint 3 77.6 4
wood milling 28.5 0.81 Production energy includes pre-use phase resource extraction and production, fabrication/assembly, and transportation.2 All parameters based on Ecobalance data unless otherwise noted.3 Fabrication primary energy not included.4 Data not available.5 For materials where specific primary energy and GWP data were not available, similar materials with complete datasetswere substituted (for ceramic bathroom sinks, “ceramic tile” data were used; for latex in carpet and paint, “SBR” was used).6 According to the manufacturer, this consists of 50% postindustrial vinyl, 50% recycled postindustrial wood (Eco-shake).7 Other values for SBR and rubber were found: rubber 67.7 MJ/kg (Sullivan et al. 1995); SBR 145.1 MJ/kg (Boustead et al.1979).
144 Journal of Industrial Ecology
y AP P L I C AT I O N S A N D I M P L E M EN TAT I O N
Table 3 SH and EEH electrical and gas appliances
SH EEH
Energy EnergyNO. APPLIANCE kWh/yr source Description kWh/yr source Description
1 Refrigerator 762 elec. Whirlpool ET22PK 555 elec. Whirlpool ET21D21.7 ft3 20.7 ft3
2 Garbage disposal 10 elec. Hushmaster 1/3 hp 0 elec. None (composting)3 Sump pump 40 elec. Wayne 1/2 hp 40 elec. Wayne 1/2 hp4 Furnace fan 404 elec. EIA 1995 54 elec. Calculated (1)5 Water heater 7,854 n. gas Smith 32,000 Btu/hr 4,712 n. gas Calculated (2)6 Range 458 elec. Whirlpool 458 n. gas Whirlpool7 Range hood 10 elec. Whirlpool 10 elec. Whirlpool8 A/C central unit 1,580 elec. Trane XE 1000 HE 734 elec. Energy-10 model9 Dishwasher 700 elec. Whirlpool GDS-500 377 elec. Asko 138510 Clothes washer 924 elec. ACEEE 1998, p. 206 (3) 241 elec. Asko 1250511 Clothes dryer 875 elec. EIA 1995 875 n. gas (4)12 Indoor/outdoor lighting 940 elec. All incandescent 254 elec. All fluorescent13 TV 250 elec. ACEEE 1998, p. 239 250 elec. ACEEE 1998,
p. 23914 Microwave oven 191 elec. EIA 1995 191 elec. EIA 199515 Dehumidifier 370 elec. EIA 1995 0 elec. (5)16 Computer 77 elec. EIA 1995 77 elec. EIA 199517 All other plug loads 960 elec. EIA 1995 960 elec. EIA 199518 Heat exchanger fan 0 elec. none 80 elec. ACEEE 1998,
p. 239
(1) Reflects an 88% reduction from SH, based on reduced furnace air flow rate due to reduced furnace size.
(2) Reflects a 40% demand reduction due to the use of waste water heat recovery.
(3) See Wilson and Morril (1998).
(4) Reflects the assumption of an unchanged heat demand for drying, and simply substituting electricity for natural gas.
(5) Reflects the assumption that no dehumidifier would be used.
emissions were calculated using emission factorsfor natural gas use (full fuel cycle) and for aver-ages of the U.S. electrical grid.
The Life-Cycle Cost Assessment
The undiscounted life-cycle cost of the SHwas determined by accumulating home financepayments (down and mortgage payments), an-nual utility payments, and scheduled mainte-nance and improvement costs for a period of 50years. This represents all costs borne by thehomeowner, excluding items outside the studyscope (e.g., furniture, landscaping, home insur-ance, and property taxes). A mortgage downpayment of 15% of the home purchase value wasassumed. Monthly mortgage payments were de-termined using an annual interest rate of 7%
over a mortgage period of 30 years, payable onthe first of the month. No refinancing was as-sumed, and these costs did not vary during themortgage period. This life-cycle cost analysis didnot account for externality costs (e.g., damagecosts from air pollutant emissions, such as sulfurdioxide, associated with electricity generation).
The market value of EEH was calculated asfollows:
1. the market value of the SH ($240,000)was divided by the developer’s profit, as-sumed to be 20%, and then the cost of theproperty, $55,000, was subtracted. Thisgives the construction cost of the SH;
2. materials and labor unit rates and contrac-tor overheads for Michigan were deter-mined (Kiley et al. 1996), and cost data
Keoleian, Blanchard, and Reppe, Life-Cycle Energy, Costs, and Strategies for Housing 145
A P P L I C AT I O N S AN D I M P L E M EN TATI O N y
were adjusted (if more than one year old)using a 3% annual escalation rate;
3. SH systems to be replaced by more en-ergy-efficient systems were determined,and the material quantities and installedcost were estimated and subtracted fromthe construction cost of the SH deter-mined in step 1;
4. the material quantities and installed costof the new EEH systems were determinedand added to the cost in step 3;
5. the cost of the property, and then thedeveloper’s profit, from step 1, were addedback. EEH annual mortgage costs werethen determined using the same financialparameters for SH.
Yearly home maintenance and improvementcosts for the SH and the EEH were based on thereplacement timetable given in table 4.
The year-one annual energy cost for the SH wasdetermined by first calculating annual natural gas
usage (from Energy-10) and electricity usage, basedon annual consumption data for home appliances(table 2), and then multiplying by Ann Arbor util-ity rates of $0.462/therm and $0.08/kWh (Reppe1998a). Year-one annual energy cost for the EEHwas determined by using the same approach.
Utility rates vary over time, depending onnumerous economic and political factors, andare difficult to forecast. To estimate future natu-ral gas and electricity rates for the next 50 years,four energy rate scenarios were used. The sce-narios are summarized in table 5.
Results
Life-Cycle Mass
The total life-cycle mass of all constructionand maintenance/improvement materials of theSH, consumed during a service life of 50 years, was306 tonnes. The total mass of materials required toconstruct the house was 293 tonnes, and 13.4
Table 4 Schedule of home improvement activities
Activity Years occurring after construction
1st and 2nd floor internal repainting 10, 20, 30, 40Exterior repainting 10, 20, 30, 40PVC siding replacement 25 (1)New roofing (asphalt shingles) for SH 20, 40 (2)Inside walls and door repair 25New refrigerator 15, 30, 45New garbage disposal 15, 30, 45New sump pump 15, 30, 45New water heater 15, 30, 45New range 15, 30, 45New range hood 25New A/C central unit 20, 40New dishwasher 20, 40New clothes washer 15, 30, 45New clothes drier 15, 30, 45Kitchen and bathroom cabinet replacement 25Changing of all incandescent light bulbs for SH Every 3 yearsChanging of all compact fluorescent light bulbs for EEH Every 5 yearsReplacement of all vinyl floor tiles in house 20, 40Replacement carpet Every 8 years (3)Replacement of all windows (includes breakage) 25
(1) Per phone conversation with Steve Cook, Astro Building Products, Ann Arbor, Michigan, 22 June, 1998.
(2) DEAM database, Ecobilan.
(3) Per phone conversation with Rob Glancy, Interface Inc., 22 June, 1998.
Note: All other values estimated by the authors.
146 Journal of Industrial Ecology
y AP P L I C AT I O N S A N D I M P L E M EN TAT I O N
Table 5 Energy escalation scenarios
Scenario Description of scenario Source
1 (constant) Natural gas rates remain constant for 50 years. Base caseElectricity rates remain constant for 50 years.
2 (declining) Natural gas rates decline 1.1%/yr from 1998 until 2010, and rise EIA/DOEthereafter by 0.03%/yr until 2020. Prices do not change from 2021 to 2048. (1997)
Electricity rates decline 1%/yr from 1998 until 2010, and decline anadditional 0.58%/yr until 2020. They do not change from 2021 to 2048.
3 (rising) Natural gas and electricity rates escalate 4.2%/yr from 1998 until 2010. Wefa Inc.1
This gives an increase of 63% by 2010. Annual escalation between 2011and 2048 is 1%.
4 (German) The cost of energy to home owners in Germany was assumed. Natural Reppegas costs $0.721/therm in 1998 and increases annually 1% until 2048. (1998b)Electricity costs $0.127/kWh in 1998 and increases annually 1% until 2048.
1 See U. S. DOE/EIA (1997, 78).
Note: Escalation rates are real (excludes inflation).
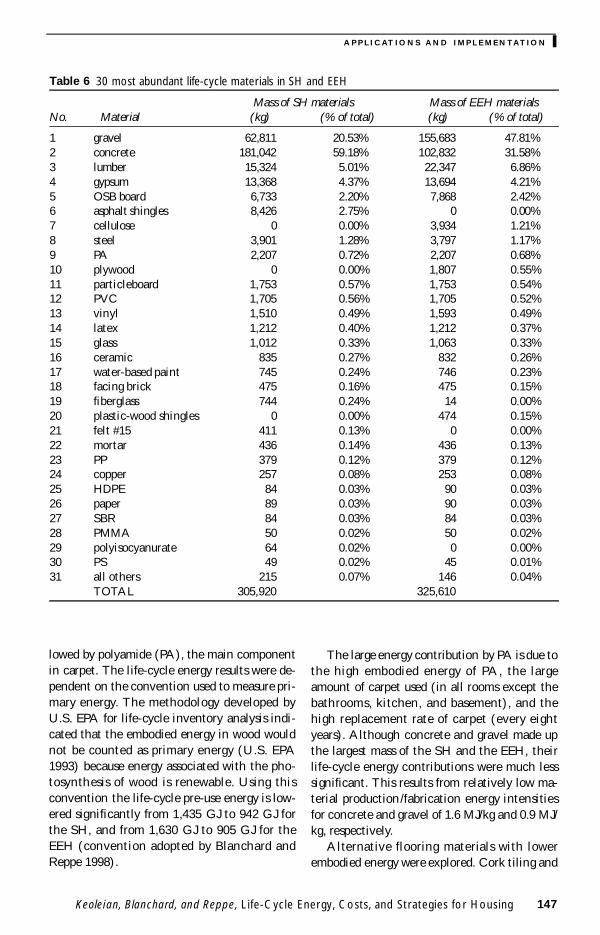
tonnes were required for maintenance and im-provement materials. Table 6 provides a summaryof the 30 materials with the greatest mass in boththe SH and the EEH, and shows their percentagerelative to total life-cycle mass. The greatest massis contributed by concrete and gravel. Both ofthese materials are associated with the buildingfoundation. As expected for a wood-framed home,lumber has the next greatest mass intensity, fol-lowed by gypsum for drywalls, and oriented strandboard (OSB) for wall sheathing and floors.
Changes made to the EEH altered the distri-bution and quantities of many materials. The useof a 2 ´ 8 wood frame/plywood basement greatlyreduced the amount of concrete in the EEH, butincreased the amount of gravel, which was neces-sary to provide adequate drainage. The amount ofwood used in the EEH also increased as a result ofthe double 2 ´ 4 (Saskatchewan) wall system.The EEH substituted cellulose insulation for fi-berglass insulation. OSB usage increased in theEEH, replacing the partial polyisocyanurate exte-rior wall sheathing used in the SH. The designchanges resulted in a life-cycle mass of 325tonnes for the EEH. Of this, the EEH pre-usemass was 318 tonnes, and maintenance and homeimprovement mass was 7.5 tonnes. Maintenance
and improvement mass was reduced by 5.9 tonnescompared with the SH. This reduction in life-cycle mass of replacement materials is due largelyto the substitution of composite wood-plastic roofshingles (Re-New Wood, 1999) that have a 50-year warranty for the asphalt shingles (replacedevery 20 years) used in the SH.
Life-Cycle Energy
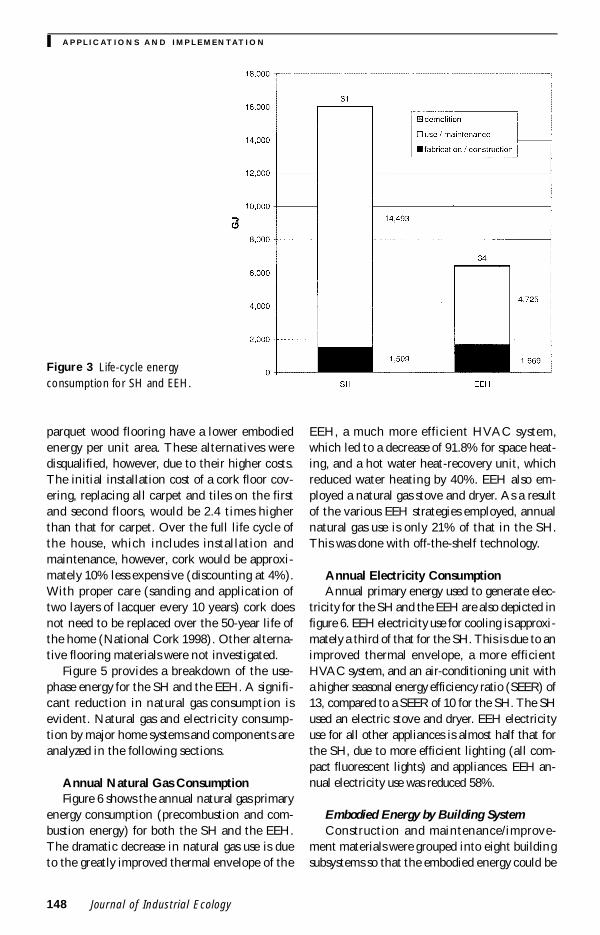
Total life-cycle energy consumption of theSH was determined to be 16,000 GJ (equivalentto 2,614 barrels of crude oil). In contrast, thetotal life-cycle energy of the EEH was 6,400 GJ(equivalent to 1,046 barrels of oil). A 60% re-duction in life-cycle energy was achieved withthe EEH model. The total life-cycle energy persquare meter of living area on an annual basis is390 kWh/m2 · y for SH and 156 kWh/m2 · y forEEH. Figure 3 provides life-cycle energy profilesof each home. The use phase accounts for 91%and 74% of the total life-cycle energy for the SHand the EEH, respectively. The demolition en-ergy is relatively insignificant compared to otherlife-cycle phases.
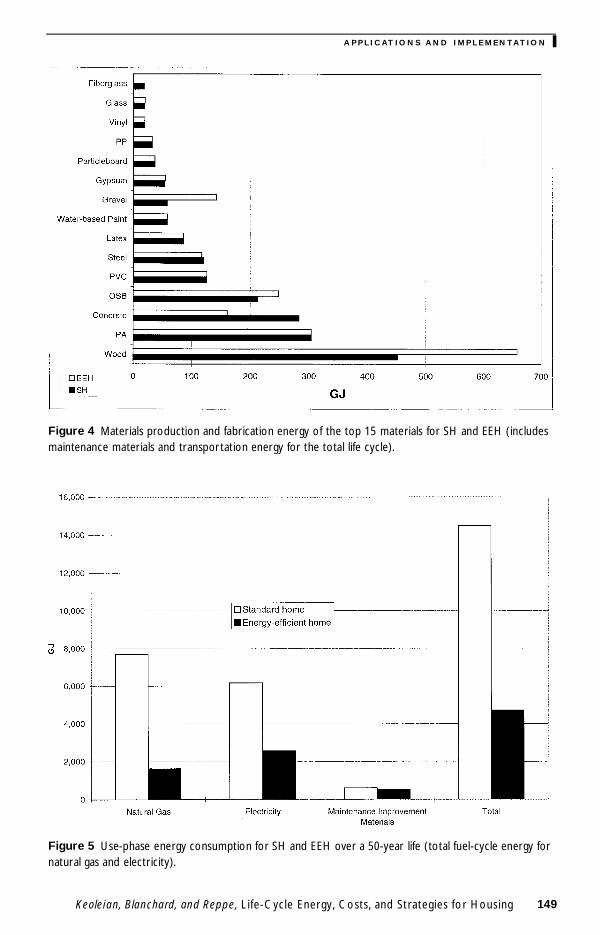
Figure 4 shows the 15 most energy-intensivematerials in the SH and the EEH. In bothhouses, wood consumes the most energy, fol-
Keoleian, Blanchard, and Reppe, Life-Cycle Energy, Costs, and Strategies for Housing 147
A P P L I C AT I O N S AN D I M P L E M EN TATI O N y
lowed by polyamide (PA), the main componentin carpet. The life-cycle energy results were de-pendent on the convention used to measure pri-mary energy. The methodology developed byU.S. EPA for life-cycle inventory analysis indi-cated that the embodied energy in wood wouldnot be counted as primary energy (U.S. EPA1993) because energy associated with the pho-tosynthesis of wood is renewable. Using thisconvention the life-cycle pre-use energy is low-ered significantly from 1,435 GJ to 942 GJ forthe SH, and from 1,630 GJ to 905 GJ for theEEH (convention adopted by Blanchard andReppe 1998).
The large energy contribution by PA is due tothe high embodied energy of PA, the largeamount of carpet used (in all rooms except thebathrooms, kitchen, and basement), and thehigh replacement rate of carpet (every eightyears). Although concrete and gravel made upthe largest mass of the SH and the EEH, theirlife-cycle energy contributions were much lesssignificant. This results from relatively low ma-terial production/fabrication energy intensitiesfor concrete and gravel of 1.6 MJ/kg and 0.9 MJ/kg, respectively.
Alternative flooring materials with lowerembodied energy were explored. Cork tiling and
Table 6 30 most abundant life-cycle materials in SH and EEH
Mass of SH materials Mass of EEH materialsNo. Material (kg) (% of total) (kg) (% of total)
1 gravel 62,811 20.53% 155,683 47.81%2 concrete 181,042 59.18% 102,832 31.58%3 lumber 15,324 5.01% 22,347 6.86%4 gypsum 13,368 4.37% 13,694 4.21%5 OSB board 6,733 2.20% 7,868 2.42%6 asphalt shingles 8,426 2.75% 0 0.00%7 cellulose 0 0.00% 3,934 1.21%8 steel 3,901 1.28% 3,797 1.17%9 PA 2,207 0.72% 2,207 0.68%10 plywood 0 0.00% 1,807 0.55%11 particleboard 1,753 0.57% 1,753 0.54%12 PVC 1,705 0.56% 1,705 0.52%13 vinyl 1,510 0.49% 1,593 0.49%14 latex 1,212 0.40% 1,212 0.37%15 glass 1,012 0.33% 1,063 0.33%16 ceramic 835 0.27% 832 0.26%17 water-based paint 745 0.24% 746 0.23%18 facing brick 475 0.16% 475 0.15%19 fiberglass 744 0.24% 14 0.00%20 plastic-wood shingles 0 0.00% 474 0.15%21 felt #15 411 0.13% 0 0.00%22 mortar 436 0.14% 436 0.13%23 PP 379 0.12% 379 0.12%24 copper 257 0.08% 253 0.08%25 HDPE 84 0.03% 90 0.03%26 paper 89 0.03% 90 0.03%27 SBR 84 0.03% 84 0.03%28 PMMA 50 0.02% 50 0.02%29 polyisocyanurate 64 0.02% 0 0.00%30 PS 49 0.02% 45 0.01%31 all others 215 0.07% 146 0.04%
TOTAL 305,920 325,610
148 Journal of Industrial Ecology
y AP P L I C AT I O N S A N D I M P L E M EN TAT I O N
Figure 3 Life-cycle energyconsumption for SH and EEH.
parquet wood flooring have a lower embodiedenergy per unit area. These alternatives weredisqualified, however, due to their higher costs.The initial installation cost of a cork floor cov-ering, replacing all carpet and tiles on the firstand second floors, would be 2.4 times higherthan that for carpet. Over the full life cycle ofthe house, which includes installation andmaintenance, however, cork would be approxi-mately 10% less expensive (discounting at 4%).With proper care (sanding and application oftwo layers of lacquer every 10 years) cork doesnot need to be replaced over the 50-year life ofthe home (National Cork 1998). Other alterna-tive flooring materials were not investigated.
Figure 5 provides a breakdown of the use-phase energy for the SH and the EEH. A signifi-cant reduction in natural gas consumption isevident. Natural gas and electricity consump-tion by major home systems and components areanalyzed in the following sections.
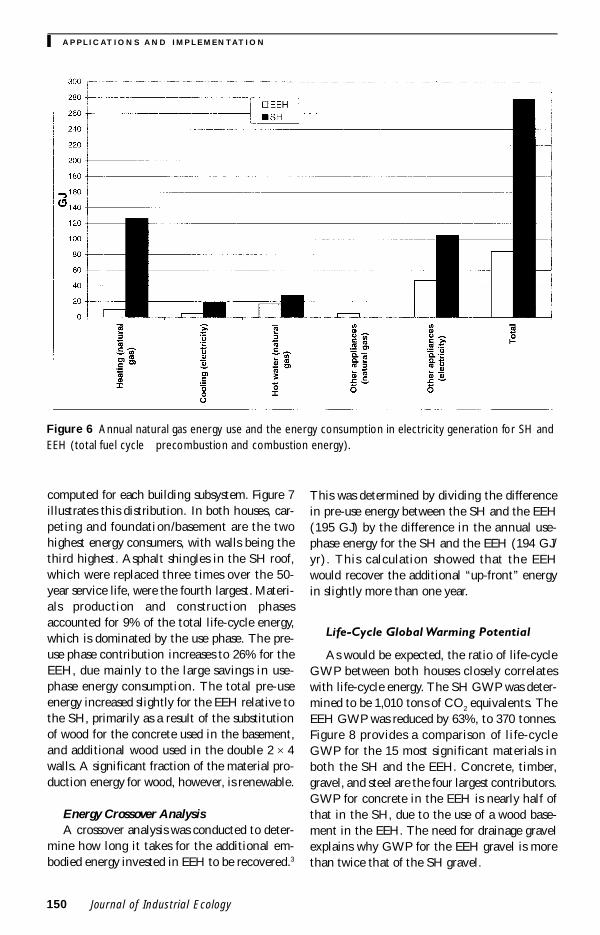
Annual Natural Gas ConsumptionFigure 6 shows the annual natural gas primary
energy consumption (precombustion and com-bustion energy) for both the SH and the EEH.The dramatic decrease in natural gas use is dueto the greatly improved thermal envelope of the
EEH, a much more efficient HVAC system,which led to a decrease of 91.8% for space heat-ing, and a hot water heat-recovery unit, whichreduced water heating by 40%. EEH also em-ployed a natural gas stove and dryer. As a resultof the various EEH strategies employed, annualnatural gas use is only 21% of that in the SH.This was done with off-the-shelf technology.
Annual Electricity ConsumptionAnnual primary energy used to generate elec-
tricity for the SH and the EEH are also depicted infigure 6. EEH electricity use for cooling is approxi-mately a third of that for the SH. This is due to animproved thermal envelope, a more efficientHVAC system, and an air-conditioning unit witha higher seasonal energy efficiency ratio (SEER) of13, compared to a SEER of 10 for the SH. The SHused an electric stove and dryer. EEH electricityuse for all other appliances is almost half that forthe SH, due to more efficient lighting (all com-pact fluorescent lights) and appliances. EEH an-nual electricity use was reduced 58%.
Embodied Energy by Building SystemConstruction and maintenance/improve-
ment materials were grouped into eight buildingsubsystems so that the embodied energy could be
Keoleian, Blanchard, and Reppe, Life-Cycle Energy, Costs, and Strategies for Housing 149
A P P L I C AT I O N S AN D I M P L E M EN TATI O N y
Figure 4 Materials production and fabrication energy of the top 15 materials for SH and EEH (includesmaintenance materials and transportation energy for the total life cycle).
Figure 5 Use-phase energy consumption for SH and EEH over a 50-year life (total fuel-cycle energy fornatural gas and electricity).
150 Journal of Industrial Ecology
y AP P L I C AT I O N S A N D I M P L E M EN TAT I O N
computed for each building subsystem. Figure 7illustrates this distribution. In both houses, car-peting and foundation/basement are the twohighest energy consumers, with walls being thethird highest. Asphalt shingles in the SH roof,which were replaced three times over the 50-year service life, were the fourth largest. Materi-als production and construction phasesaccounted for 9% of the total life-cycle energy,which is dominated by the use phase. The pre-use phase contribution increases to 26% for theEEH, due mainly to the large savings in use-phase energy consumption. The total pre-useenergy increased slightly for the EEH relative tothe SH, primarily as a result of the substitutionof wood for the concrete used in the basement,and additional wood used in the double 2 ´ 4walls. A significant fraction of the material pro-duction energy for wood, however, is renewable.
Energy Crossover AnalysisA crossover analysis was conducted to deter-
mine how long it takes for the additional em-bodied energy invested in EEH to be recovered.3
This was determined by dividing the differencein pre-use energy between the SH and the EEH(195 GJ) by the difference in the annual use-phase energy for the SH and the EEH (194 GJ/yr). This calculation showed that the EEHwould recover the additional “up-front” energyin slightly more than one year.
Life-Cycle Global Warming Potential
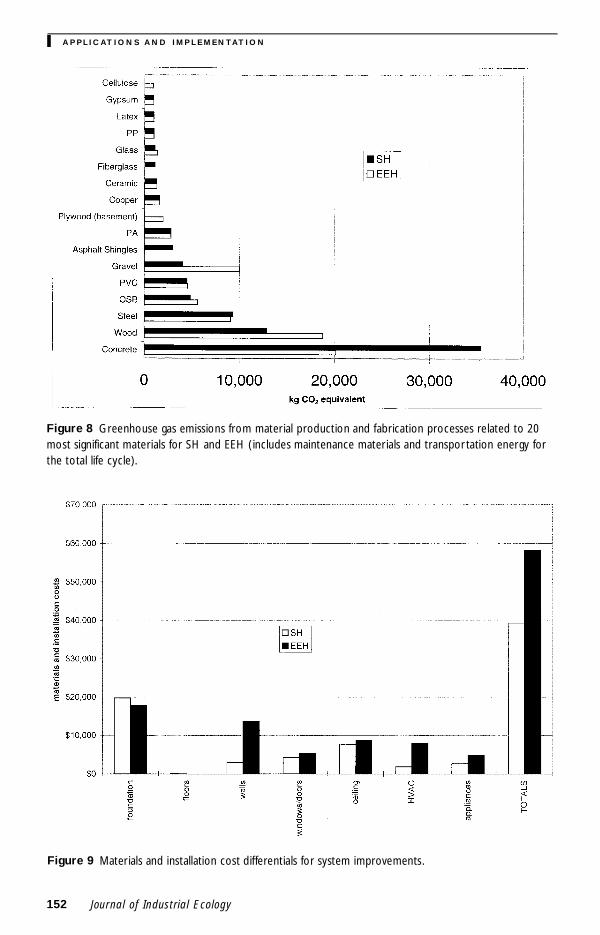
As would be expected, the ratio of life-cycleGWP between both houses closely correlateswith life-cycle energy. The SH GWP was deter-mined to be 1,010 tons of CO2 equivalents. TheEEH GWP was reduced by 63%, to 370 tonnes.Figure 8 provides a comparison of life-cycleGWP for the 15 most significant materials inboth the SH and the EEH. Concrete, timber,gravel, and steel are the four largest contributors.GWP for concrete in the EEH is nearly half ofthat in the SH, due to the use of a wood base-ment in the EEH. The need for drainage gravelexplains why GWP for the EEH gravel is morethan twice that of the SH gravel.
Figure 6 Annual natural gas energy use and the energy consumption in electricity generation for SH andEEH (total fuel cycle precombustion and combustion energy).
Keoleian, Blanchard, and Reppe, Life-Cycle Energy, Costs, and Strategies for Housing 151
A P P L I C AT I O N S AN D I M P L E M EN TATI O N y
Life-Cycle Cost
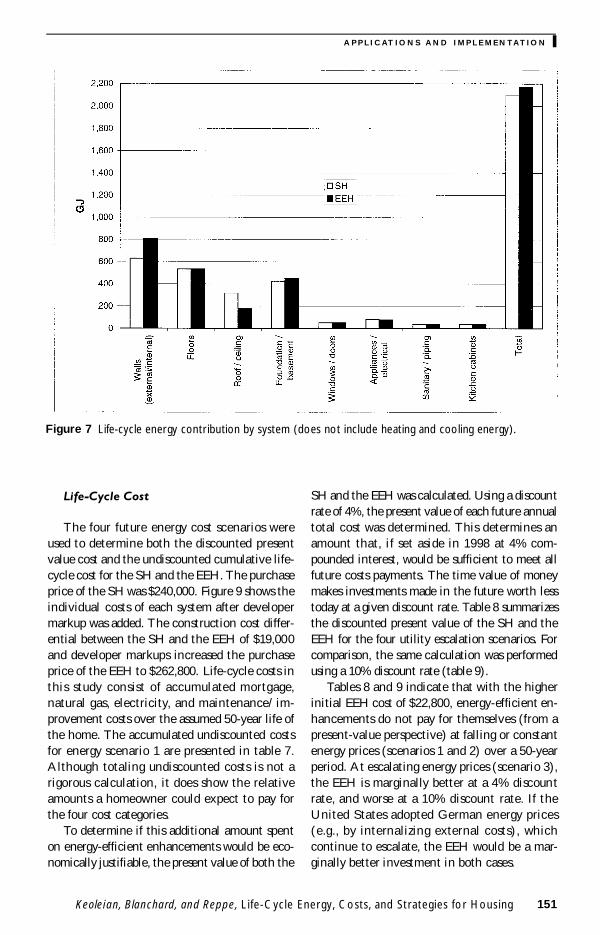
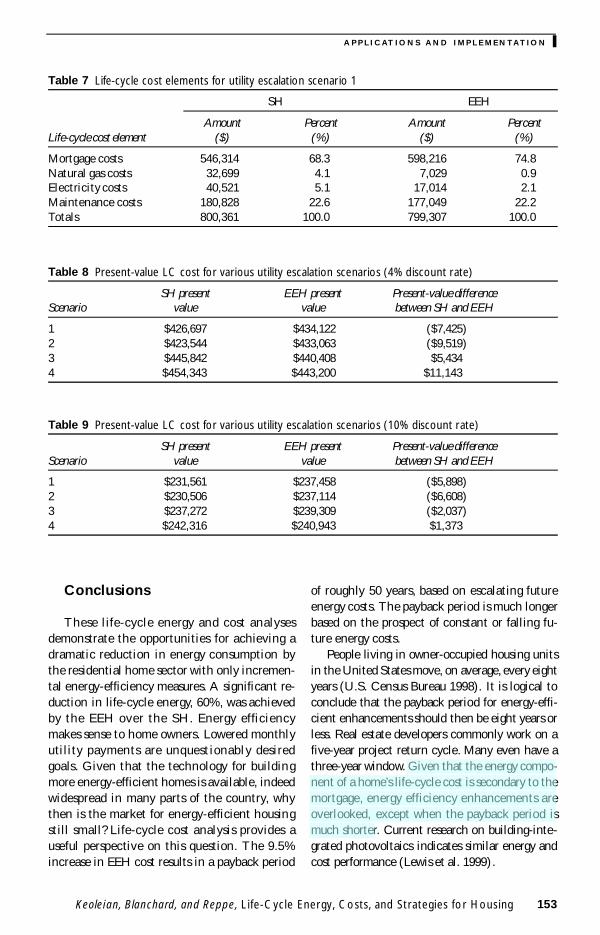
The four future energy cost scenarios wereused to determine both the discounted presentvalue cost and the undiscounted cumulative life-cycle cost for the SH and the EEH. The purchaseprice of the SH was $240,000. Figure 9 shows theindividual costs of each system after developermarkup was added. The construction cost differ-ential between the SH and the EEH of $19,000and developer markups increased the purchaseprice of the EEH to $262,800. Life-cycle costs inthis study consist of accumulated mortgage,natural gas, electricity, and maintenance/ im-provement costs over the assumed 50-year life ofthe home. The accumulated undiscounted costsfor energy scenario 1 are presented in table 7.Although totaling undiscounted costs is not arigorous calculation, it does show the relativeamounts a homeowner could expect to pay forthe four cost categories.
To determine if this additional amount spenton energy-efficient enhancements would be eco-nomically justifiable, the present value of both the
SH and the EEH was calculated. Using a discountrate of 4%, the present value of each future annualtotal cost was determined. This determines anamount that, if set aside in 1998 at 4% com-pounded interest, would be sufficient to meet allfuture costs payments. The time value of moneymakes investments made in the future worth lesstoday at a given discount rate. Table 8 summarizesthe discounted present value of the SH and theEEH for the four utility escalation scenarios. Forcomparison, the same calculation was performedusing a 10% discount rate (table 9).
Tables 8 and 9 indicate that with the higherinitial EEH cost of $22,800, energy-efficient en-hancements do not pay for themselves (from apresent-value perspective) at falling or constantenergy prices (scenarios 1 and 2) over a 50-yearperiod. At escalating energy prices (scenario 3),the EEH is marginally better at a 4% discountrate, and worse at a 10% discount rate. If theUnited States adopted German energy prices(e.g., by internalizing external costs), whichcontinue to escalate, the EEH would be a mar-ginally better investment in both cases.
Figure 7 Life-cycle energy contribution by system (does not include heating and cooling energy).
152 Journal of Industrial Ecology
y AP P L I C AT I O N S A N D I M P L E M EN TAT I O N
Figure 9 Materials and installation cost differentials for system improvements.
Figure 8 Greenhouse gas emissions from material production and fabrication processes related to 20most significant materials for SH and EEH (includes maintenance materials and transportation energy forthe total life cycle).
Keoleian, Blanchard, and Reppe, Life-Cycle Energy, Costs, and Strategies for Housing 153
A P P L I C AT I O N S AN D I M P L E M EN TATI O N y
Conclusions
These life-cycle energy and cost analysesdemonstrate the opportunities for achieving adramatic reduction in energy consumption bythe residential home sector with only incremen-tal energy-efficiency measures. A significant re-duction in life-cycle energy, 60%, was achievedby the EEH over the SH. Energy efficiencymakes sense to home owners. Lowered monthlyutility payments are unquestionably desiredgoals. Given that the technology for buildingmore energy-efficient homes is available, indeedwidespread in many parts of the country, whythen is the market for energy-efficient housingstill small? Life-cycle cost analysis provides auseful perspective on this question. The 9.5%increase in EEH cost results in a payback period
of roughly 50 years, based on escalating futureenergy costs. The payback period is much longerbased on the prospect of constant or falling fu-ture energy costs.
People living in owner-occupied housing unitsin the United States move, on average, every eightyears (U.S. Census Bureau 1998). It is logical toconclude that the payback period for energy-effi-cient enhancements should then be eight years orless. Real estate developers commonly work on afive-year project return cycle. Many even have athree-year window. Given that the energy compo-nent of a home’s life-cycle cost is secondary to themortgage, energy efficiency enhancements areoverlooked, except when the payback period ismuch shorter. Current research on building-inte-grated photovoltaics indicates similar energy andcost performance (Lewis et al. 1999).
Table 7 Life-cycle cost elements for utility escalation scenario 1
SH EEH
Amount Percent Amount PercentLife-cycle cost element ($) (%) ($) (%)
Mortgage costs 546,314 68.3 598,216 74.8Natural gas costs 32,699 4.1 7,029 0.9Electricity costs 40,521 5.1 17,014 2.1Maintenance costs 180,828 22.6 177,049 22.2Totals 800,361 100.0 799,307 100.0
Table 8 Present-value LC cost for various utility escalation scenarios (4% discount rate)
SH present EEH present Present-value differenceScenario value value between SH and EEH
1 $426,697 $434,122 ($7,425)2 $423,544 $433,063 ($9,519)3 $445,842 $440,408 $5,4344 $454,343 $443,200 $11,143
Table 9 Present-value LC cost for various utility escalation scenarios (10% discount rate)
SH present EEH present Present-value differenceScenario value value between SH and EEH
1 $231,561 $237,458 ($5,898)2 $230,506 $237,114 ($6,608)3 $237,272 $239,309 ($2,037)4 $242,316 $240,943 $1,373
154 Journal of Industrial Ecology
y AP P L I C AT I O N S A N D I M P L E M EN TAT I O N
The EEH indicated significant life-cycle en-ergy savings relative to the SH, but this did nottranslate into life-cycle cost advantages. The de-sign of the EEH used in this study focused prima-rily on techniques to reduce life-cycle energy andGWP as much as possible using equipment andmaterials readily obtainable in the U.S. market,without altering the fundamental floor layout orbuilding look. If the overall objective had beento minimize both life-cycle cost and life-cycleenergy, then a different set of improvement strat-egies would have been selected. Another draw-back of the EEH design was maintaining rigidfunctionality with the SH. Several major energy-reducing strategies could not be employed be-cause of the shape, layout, and orientation of theSH. Passive solar space heating can be imple-mented on a wide range of scales. The simplestapproach consists of increased glazing on thesouth-facing wall. For this particular applicationand climate, however, the addition of more win-dows did not enhance energy performance(Blanchard and Reppe 1998). At the other endof the spectrum are homes that employ south-facing greenhouse rooms that generate a naturalheat convection loop throughout the house,storing daytime solar heat with adequately de-signed thermal mass. Although these designs aredifferent from those of the conventional two-story U.S. home, quality of life remains essen-tially unchanged. In fact, the thermal radiativeaspects of passive solar homes make them supe-rior in terms of perceived comfort. Houses thatconsume considerably less use-phase energy willrequire fundamental design modifications.
The life-cycle energy profiles for both the SHand the EEH indicated that most of the energyconsumption is in the use phase, 91% for the SHand 74% for the EEH. The pattern is also char-acteristic of other product systems such as auto-mobiles where about 90% of the energyconsumption occurs in the use phase (Keoleianet al. 1998). Again, the energy consumption inthe use phase is large, whereas the economic in-centives to conserve energy are relatively weak.In the case of automobiles, relatively low gaso-line costs compared to fixed vehicle ownershipcosts (depreciation and insurance) provide littleincentive for encouraging fuel-efficient vehicles.
Special government energy policies can also
be implemented to encourage energy efficiency.For example, carbon trading or tax scenarioswould provide a financial driver for more energy-efficient technologies. The U.S. Department ofEnergy estimated marginal compliance costs un-der certain provisions of the Kyoto Protocol. Aregulatory provision based on an emissions capfor CO2 with a transferable permit system was as-sumed. In this case, compliance costs for CO2 areestimated to be 94.4 to 165.3 dollars (in 1998)per ton of carbon. Adjusting the effective energyprices would shorten the payback period of theEEH and lead to a much more rapid implementa-tion of eco-efficient construction technologies. Avariety of other strategies can be used to promoteeco-efficiency and sustainability, such as more-ef-fective building code standards and appliancestandards, better design tools and guidelines, con-sumer education, and voluntary partnerships fordeveloping new technologies. A recent workshoporganized by the Center for Sustainable Systems(CSS) on sustainable buildings compiled a com-prehensive list of these implementation strategiesthat target designers, builders, inspectors, con-sumers, lenders, insurers, materials suppliers, edu-cators, and other key stakeholders (CSS 2000).
Although pre-use phase energy consumptionaccounts for only 9% to 26% of the homes’ totallife-cycle energy, considerable improvement ispossible. Substantial use of construction materialswith a high content of recycled materials, or or-ganic matter with low embodied energy, couldlower pre-use phase energy. As the trend towardenergy efficiency in the use phase continues, theembodied energy in materials will become moreimportant. The life-cycle energy analysis indi-cated unexpected results and improvement oppor-tunities regarding individual building and homeimprovement components. The impacts of car-peting and roofing are very significant due to theirlarge material production energies and frequencyof replacement over the 50-year estimated servicelife of the house. The substitution of a long-lifeshingle system for the conventional asphalt sys-tem led to a 98% saving of life-cycle energy.
Trends in the average home size in the UnitedStates are not pointing toward a sustainablehousing future. Between 1975 and 1998 the aver-age area of a new single-family home constructedincreased from 1,645 to 2,190 square feet,
Keoleian, Blanchard, and Reppe, Life-Cycle Energy, Costs, and Strategies for Housing 155
A P P L I C AT I O N S AN D I M P L E M EN TATI O N y
whereas the average number of occupants perhousehold decreased from 2.94 to 2.61 over thesame period (Wilson 1999; NAHB 1999; U.S.Census Bureau 1999). This investigation clearlyshows the potential for reducing life-cycle energyconsumption, but the effectiveness of the eco-ef-ficient strategies outlined herein would be offsetby continued increases in home size. Life-cycleassessment has been shown again to be a usefultool in guiding improvement in residential homedesign. Changes in consumption patterns, how-ever, through appropriate local and federal poli-cies on land, energy, and materials consumptionare also required to achieve significant environ-mental progress in the residential home sector.
Notes
1. The U.S. household energy consumption in the1993 was 10.0 quadrillion Btu (5.27 quadrillionBtu natural gas, 3.28 quadrillion Btu electricit y,1.07 quadrillion Btu fuel oil, and 0.38 quadrillionBtu liquid propane gas (LPG)), which accountedfor 10.0 quadrillion Btu/87.3 quadrillion Btu =11% of the total U.S. energy consumption (U.S.DOE/EIA 1995, 10; U.S. DOE/EIA 2000, 9).
2. At the time this article was going to press, theauthors became aware of a recent doctoral disser-tation by Karin Adalberth (2000) and an article(Nishioka et al. 2000) investigating life-cycle en-ergy use in new residential buildings in Swedenand Japan respectivel y.
3. Editor’s note: For a discussion of the mathematicsof crossover analysis, see Field, Kirchain, andClark, “Life Cycle Assessment and Temporal Dis-tributions of Emissions: Limitations of Product-Centered Emission Analyses,” this issue.
References
Adalberth, K. 2000. Energy use and environmentalimpact of new residential buildings. Doctoraldissertation, Lund University, Sweden.
AIA (American Institute of Architects). 1992. Envi-ronmental resource guide subscription. Washing-ton, DC: AIA.
Blanchard, S. and P. Reppe. 1998. Life cycle analysisof a residential home in Michigan. Master’s the-sis, University of Michigan, Ann Arbor.
Boustead, I. and G. F. Hancock. 1979. Handbook ofIndustrial Energy Analysis. Chichester, UK: EllisHorwood Publishers.
Cole, R. J. 1993. Embodied Energy in ResidentialBuilding Construction. In Proceedings: Innova-tive Housing Conference , Vancouver, BC, June21–25, 1: 49–59.
Cole, R. J. 1999. Energy and greenhouse gas emissionsassociated with the construction of alternativestructural systems. Building and Environment 34:335–348.
Construction Review. 1997. 42(4): IV(13).CSS (Center for Sustainable Systems). 2000. Pro-
ceedings of the National Sustainable BuildingsWorkshop, 8–9 October, 1999, University ofMichigan. <http://www.umich.edu/~nppcpub/workshops/index.html>
Debnath, A., S. V. Singh, and Y. P. Singh. 1995.Comparative assessment of energy requirementsfor different types of residential buildings in In-dia. Energy and Buildings 23: 141–146.
Deumling, R. 1999. The Industrial Ecology of House-hold Refrigerators: Product Life and the Demandfor Materials and Energy. Energy and ResourcesGroup, University of California, Berkeley.
Ecobalance. 1998. DEAM, life-cycle inventory data-base. Ecobalance, Inc., Bethesda, MD.
ISO. 1997. Environmental management— Life cycleassessment—Principles and framework, ISO14040 . First edition 1997-06-15, InternationalOrganization for Standards, Geneva.
Jungbluth, N. 1997. Life cycle assessment for stovesand ovens. UNS working paper no. 16.Umweltnaturbund Umweltsozialwissenschaften ,Zürich, Switzerland.
Keoleian, G. A., G. Lewis, R. B. Coulon, V. J.Camobreco, and H. P. Teulon. 1998. LCI model-ing challenges and solutions for a complex prod-uct system: A mid-sized automobile. In Total LifeCycle Conference Proceedings, P-339. SAE Inter-national, Warrendale, PA. Paper No. 982169 :71–84.
Kiley, M. D. and M. Allyn. 1997. 1997 national con-struction estimator, labor & materia l costs,manhours and city cost adjustments for all resi-dential, commercial and industrial construction .Carlsbad, CA: Craftsman Book Company.
Lewis, G. M., G. A. Keoleian, M. R. Moore, D. L.Mazmanian, and M. Navvab. 1999. PV-BILD: Alife cycle environmental and economic assessmenttool for building-int egrated photovoltaic installa -tions. Project Report for National Science Foun-dation / Lucent Technologies Industrial EcologyGrant BES-9727268. Center for SustainableSystems, University of Michigan, Ann Arbor.
NAHB. 1999. National Association of Home Build-ers. http://www.nahb.com.
156 Journal of Industrial Ecology
y AP P L I C AT I O N S A N D I M P L E M EN TAT I O N
Natural Cork, Ltd. 1998. Personal communication.Augusta, GA, July.
Pierquet, P., J. L. Bowyer, and P. Huelman. 1998.Thermal performance and embodied energy ofcold climate wall systems. Forest Products Journal48(6): 53–60.
PSIC (Passive Solar Industries Council). 1998. En-ergy-10, Release 1.2, January 1998., Washing-ton, DC: PSIC.
Re-New Wood, Inc., 1999. Product literatur e forEcoshake. Nagoner, OK: Re-New Wood.
Reppe, P. 1998a. Residential utility bill, Ann Arbor, MI.Reppe, P. 1998b. Personal communication of utility
costs based on July 1998 utility bills from theReppe family residenc e in Langebruck, Ger-many.
SETAC (Society of Environmental Toxicology andChemistry). 1993. Workshop report—Guidelinesfor life-cycle assessme nt: A code of practice .Pensacola, FL: SETAC.
Sullivan, J. L. and J. Hu. 1995. Life cycle energyanalysis for automobiles. SAE Paper 951829.
U.S. Census Bureau. 1998. Seasonality of Moves andDuration of Residence. In Current population re-ports: Househo ld economic studies P70-66, byK. A. Hansen. October.
U.S. Census Bureau. 1999. Estimates of housing units,households, households by age of householder, and
persons per household: July 1, 1998. ST-98-46.U.S. Department of Commerce. 1995. 1992 Census of
construction industries: Industry series generalconstructors—Single-family houses. CC92-I-1.
U.S. DOE/EIA (U.S. Department of Energy, Energy In-formation Administration). 1995. Household energyconsumption and expenditures 1993. DOE/EIA-0321(93) Washington, DC: DOE/EIA, 10.
U.S. DOE/EIA, Office of Integrated Analysis and Fore-casting (U.S. Department of Energy, Energy In-formation Administration). 1997. Annual energyoutlook 1998, with projections to 2020. DOE/EIA-0383(98). Washington, DC: DOE/EIA, 78.
U.S. DOE/EIA (U.S. Department of Energy, EnergyInformation Administration). 2000. Annual en-ergy review 1999. DOE/EIA-0384(99), Washing-ton, DC: DOE/EIA.
U.S. EPA (U. S. Environmental Protection Agency).1993. Life-cycle assessment: Inventory guide-lines and principles. U.S. EPA, Risk ReductionEngineering Lab (EPA/600/R-92/245).
Wilson, A. 1999. Small is beautiful: House size, re-source use and the environment. EnvironmentalBuilding News 8(1).
Wilson, A. and J. Morrill. 1998. Consumer guide tohome energy savings. 6th ed. Washington, DC:The American Council for an Energy-EfficientEconomy.


![A¼qcn {Kma]©mb¯v þ sse^v anj³ - lsgkerala.inlsgkerala.in/ambooripanchayat/files/2017/07/land-house2.pdf · 447,PARAIKAL, THATTAM MUKKU-695505 ˝9! . ˙ ˘!˘ 1106160984 ? SL](https://img.pdfslide.us/doc/110x75/5ce05ce388c993f4758dc520/aqcn-kmambv-b-ssev-anj-447paraikal-thattam-mukku-695505-9.jpg)