Embed Size (px)
Citation preview

ORNL/TM-2014/93
Life Cycle Energy Assessment Methodology, Tool and Case Studies for Additive Manufacturing
July 2014
Prepared by Sachin Nimbalkar Daryl Cox Oak Ridge National Laboratory Kelly Visconti Joseph Cresko Advanced Manufacturing Office, U.S. Department of Energy Beta version for release to America Makes membership and Federal Government use only, further distribution not permitted.

ii
DISCLAIMER
This report is being disseminated by the U. S. Department of Energy. As such, the document was
prepared in compliance with Section 515 of the Treasury and General Government
Appropriations Act for Fiscal Year 2001 (Public Law 106-554) and information quality
guidelines issued by the U. S. Department of Energy. Though this report does not contain
"influential" information as defined in DOE's information quality guidelines or the Office of
Management and Budget's Information Quality Bulletin for Peer Review (Bulletin), the study
was reviewed both internally and externally prior to publication. For purposes of external review,
the study benefited from the advice and comments of the members of both the life cycle analysis
community and additive manufacturing experts on the methodology and utility of the tool. That
panel included representatives from national laboratories, private companies, and academic
institutions. As this report and tool are currently in Beta version, additional peer review and
comments from experts will be sought over the next 12 months (from the Beta version release
date) as the tool is further developed for a full release version.
ORNL/TM-2014/93
Life Cycle Energy Assessment Methodology, Tool and Case
Studies for Additive Manufacturing
Sachin Nimbalkar
Daryl Cox
Energy and Transportation Science Division
Oak Ridge National Laboratory
Kelly Visconti
Joseph Cresko
Advanced Manufacturing Office
U. S. Department of Energy
Prepared for
Advanced Manufacturing Office
Energy Efficiency and Renewable Energy
U.S. DEPARTMENT OF ENERGY
Washington, D.C. 20585
Prepared by
OAK RIDGE NATIONAL LABORATORY
Oak Ridge, Tennessee 37831
Managed by
UT-BATTELLE, LLC
for the
U.S. DEPARTMENT OF ENERGY
Under contract DE-AC05-00OR22725

ii
DOCUMENT AVAILABILITY
Reports produced after January 1, 1996, are generally available free via the U.S. Department of Energy (DOE) Information Bridge. Web site http://www.osti.gov/bridge
Reports produced before January 1, 1996, may be purchased by members of the public from the following source. National Technical Information Service 5285 Port Royal Road Springfield, VA 22161 Telephone 703-605-6000 (1-800-553-6847) TDD 703-487-4639 Fax 703-605-6900 E-mail [email protected] Web site http://www.ntis.gov/support/ordernowabout.htm
Reports are available to DOE employees, DOE contractors, Energy Technology Data Exchange (ETDE) representatives, and International Nuclear Information System (INIS) representatives from the following source. Office of Scientific and Technical Information P.O. Box 62 Oak Ridge, TN 37831 Telephone 865-576-8401 Fax 865-576-5728 E-mail [email protected] Web site http://www.osti.gov/contact.html
This report was prepared as an account of work sponsored by an agency of the United States Government. Neither the United States Government nor any agency thereof, nor any of their employees, makes any warranty, express or implied, or assumes any legal liability or responsibility for the accuracy, completeness, or usefulness of any information, apparatus, product, or process disclosed, or represents that its use would not infringe privately owned rights. Reference herein to any specific commercial product, process, or service by trade name, trademark, manufacturer, or otherwise, does not necessarily constitute or imply its endorsement, recommendation, or favoring by the United States Government or any agency thereof. The views and opinions of authors expressed herein do not necessarily state or reflect those of the United States Government or any agency thereof.
The report is not yet available on the Office of Scientific and Technical Information (OSTI) website. This is the beta version for release to America Makes membership and Federal Government use only. Once finalized, we will publish the report on the OSTI website.
3
PREFACE
The purpose of this guidebook is to define a methodology and associated tool to consistently
calculate the lifecycle energy consumption and savings for research, demonstration and
development (RD&D) projects in additive manufacturing. The intended users are researchers,
funding agencies, and technical staff working in the additive manufacturing industry. This
guidebook supports a tool that can help evaluate when additive manufacturing is a more
advantageous manufacturing method than conventional manufacturing, or to compare to
different additive manufacturing methods. When used in conjunction with scenario analysis, the
methodology can help estimate impacts of R&D for improvements in additive manufacturing
technologies.
Chapter 1 (Introduction) covers the life cycle assessment concept, background on Additive
Manufacturing (AM), sustainable benefits of AM processes, the need for a consistent
methodology to calculate life cycle energy consumption and savings for RD&D projects in AM,
and previous work on AM Energy Use and Life Cycle Assessment.
Chapter 2 (Overview) introduces the life cycle phases and the life cycle assessment
methodology, including identifying and setting boundaries for life cycle phases, and the
calculation of embodied energy of materials, processes, and transportation modes.
Chapter 3 (Tool) provides an outline of the Excel based Additive Manufacturing Energy Impacts
Assessment Tool. It provides detailed instructions for the Excel based calculator tool including
the general calculation process and the typical information that is needed at each step to do the
calculations.
Chapter 4 (Case Studies) provides a walkthrough of four specific case studies as examples using
the AM Energy Impacts Assessment Tool. The two life cycle energy case studies for aircraft
brackets compare 1) the same metal part made by additive manufacturing to the conventional
process; and 2) an optimized metal part designed for additive manufacturing to the
conventionally designed and produced part are discussed in detail. The third case study covers
the Aircraft Ventilation Nozzle manufactured by the Fused Deposition Modelling process. The
fourth case study is based on a Hat Section Mold manufactured by the Fused Deposition
Modelling process.

4
TABLE OF CONTENTS
PREFACE ....................................................................................................................................... 3
LISTS OF TABLES ........................................................................................................................ 5 LISTS OF FIGURES ...................................................................................................................... 6 ABBREVIATIONS, ACRONYMS, AND INITIALISMS ............................................................ 7 ACKNOWLEDGEMENTS ............................................................................................................ 8 CHAPTER 1 - INTRODUCTION .................................................................................................. 9
Background ..................................................................................................................................... 9 Life Cycle Assessment Concept ..................................................................................................... 9 Previous Work on Additive Manufacturing Energy Use and Life-Cycle Assessment ................. 12
Summary of Literature Review ..................................................................................................... 12 Conclusions ................................................................................................................................... 14 CHAPTER 2 – OVERVIEW OF LIFE-CYCLE ASSESSMENT METHODOLOGY ............... 16
CHAPTER 3 – AM ENERGY IMPACTS ASSESSMENT TOOL ............................................. 18 Outline of the Tool ........................................................................................................................ 18 Intro ............................................................................................................................................... 18
Product Details .............................................................................................................................. 19 CM Calculator ............................................................................................................................... 20
AM Calculator .............................................................................................................................. 32 Results ........................................................................................................................................... 47 AM Tool’s Capabilities/Constraints: ............................................................................................ 50
CHAPTER 4 – CASE STUDIES .................................................................................................. 53 Case Study 1: Aerospace Bracket - EBM vs. Conventional Machining....................................... 54
Overview: ...................................................................................................................................... 54 Case Study 2: Topologically Optimized Aerospace Bracket - EBM vs. Conventional Machining
....................................................................................................................................................... 57 Overview: ...................................................................................................................................... 57
Case Study 3: Aircraft Ventilation Assembly – FDM vs. IM ....................................................... 60 Overview: ...................................................................................................................................... 60 Case Study 4: Hat Section Mold/Tool – FDM vs. Conventional Machining ............................... 63 Overview: ...................................................................................................................................... 63
REFERENCES ............................................................................................................................. 67 APPENDIX ................................................................................................................................... 70 Appendix 1: Material Embodied Energy ...................................................................................... 71 Appendix 2: Cutting Tool Materials Embodied Energy ............................................................... 72
Appendix 3a: Primary Shaping Processes Energy ........................................................................ 73 Appendix 3b: Secondary Shaping Processes Embodied Energy .................................................. 73 Appendix 4a: Additive Manufacturing Processes Embodied Energy........................................... 74
Appendix 4b: Additive Manufacturing Processes Embodied Energy .......................................... 74 Appendix 5: Transportation Mode Embodied Energy .................................................................. 75 Appendix 6: Other Transportation Modes Embodied Energy ...................................................... 75 Appendix 7: Use Phase Energy Consumption .............................................................................. 76

5
LISTS OF TABLES
Table 1: Different scenarios for the AM Energy Impacts Assessment Tool ................................ 19 Table 2: Tooling Energy Intensity for a Range of Parts Manufactured ........................................ 24 Table 3: Results Table - Energy Use per Part ............................................................................... 47
Table 4: Energy Prices by Life Cycle Phase ................................................................................. 48 Table 5: Results Table - Energy and Energy Cost Savings per Part ............................................. 49 Table 6: Energy Savings Table (Case study 1) ............................................................................. 54 Table 7: Energy Savings Table (Case study 2) ............................................................................. 57 Table 8: Energy Savings Table (Case study 3) ............................................................................. 60
Table 9: Energy Savings Table (Case study 4) ............................................................................. 63

6
LISTS OF FIGURES
Figure 1: AMO Technology Focus [DOE AMO] ........................................................................... 9 Figure 2: Reduced product life-cycle energy consumption through AM ..................................... 10 Figure 3: End of Life Method [BERGSMA 2013] ....................................................................... 11
Figure 4: Overview of life-cycle assessment methodology. ......................................................... 16 Figure 5: AM Energy Impacts Assessment Tool - Intro Tab........................................................ 18 Figure 6: Product Details Tab ....................................................................................................... 19 Figure 7: Manufacturing Phase Energy Analysis Steps ................................................................ 22 Figure 8: Results Graph - Energy Use per Part............................................................................. 48
Figure 9: Results Graph - Energy Savings per Part ...................................................................... 49 Figure 10: A summary of key inputs and assumption .................................................................. 50
Figure 11: Process Flow Diagram (Case study 1) ........................................................................ 54 Figure 12: Process Flow Diagram (Case study 2) ........................................................................ 57
Figure 13: Process Flow Diagram (Case study 3) ........................................................................ 60 Figure 14: Process Flow Diagram (Case study 4) ........................................................................ 63

7
ABBREVIATIONS, ACRONYMS, AND INITIALISMS
AM Additive Manufacturing
AMO Advanced Manufacturing Office
BBtu Billion Btu (109 Btu)
Btu British Thermal Units
CO2 Carbon dioxide
DOE Department of Energy
EERE Energy Efficiency and Renewable Energy
EIA Energy Information Administration
EPA Environmental Protection Agency
EPACT Energy Policy Act
ITP Industrial Technologies Program
MECS Manufacturing Energy Consumption Survey
MER Monthly Energy Review
MMBtu Million Btu (106 Btu)
MMTCO2 Million metric tons of carbon dioxide
ORNL Oak Ridge National Laboratory
RECS Residential Energy Consumption Survey
TBtu Trillion Btu (1012
Btu)

8
ACKNOWLEDGEMENTS
The authors gratefully acknowledge the support and guidance of Mark Johnson, Stephen Sikirica
and Blake Marshall at DOE's Advanced Manufacturing Office (DOE AMO). The authors also
thank Lonnie Love, Craig Blue, Ron Ott, Ryan Dehoff, Chad Duty, Sujit Das, Amelia Elliott,
and Jennifer Travis from ORNL who assisted in the development Additive Manufacturing
Energy Impacts Assessment Tool and review of this report. Also it is pleasure to acknowledge
the help of William Morrow (LBNL), Alberta Carpenter (NREL), Matthew Riddle (ANL), Rob
Gorham (America Makes), Cameron Rogers (Intern at America Makes) and several America
Makes Principal Investigators, who reviewed the tool, as well as a draft of this report and
provided valuable comments.
9
CHAPTER 1 - INTRODUCTION
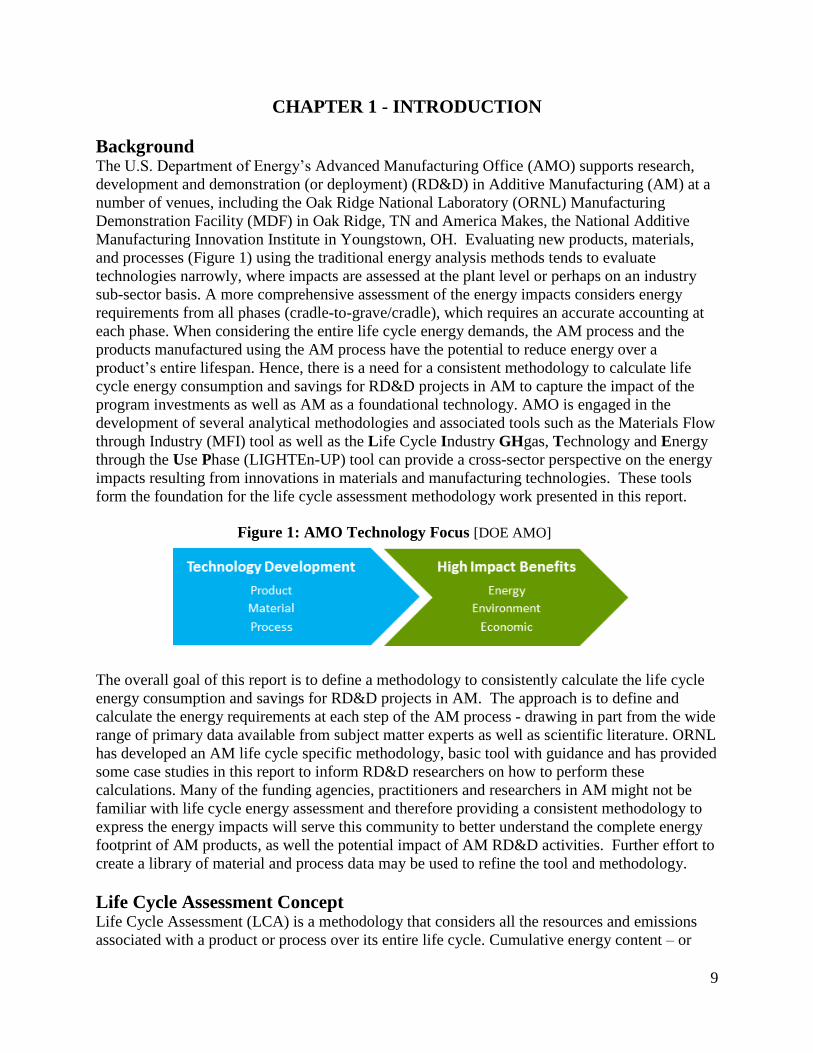
Background The U.S. Department of Energy’s Advanced Manufacturing Office (AMO) supports research,
development and demonstration (or deployment) (RD&D) in Additive Manufacturing (AM) at a
number of venues, including the Oak Ridge National Laboratory (ORNL) Manufacturing
Demonstration Facility (MDF) in Oak Ridge, TN and America Makes, the National Additive
Manufacturing Innovation Institute in Youngstown, OH. Evaluating new products, materials,
and processes (Figure 1) using the traditional energy analysis methods tends to evaluate
technologies narrowly, where impacts are assessed at the plant level or perhaps on an industry
sub-sector basis. A more comprehensive assessment of the energy impacts considers energy
requirements from all phases (cradle-to-grave/cradle), which requires an accurate accounting at
each phase. When considering the entire life cycle energy demands, the AM process and the
products manufactured using the AM process have the potential to reduce energy over a
product’s entire lifespan. Hence, there is a need for a consistent methodology to calculate life
cycle energy consumption and savings for RD&D projects in AM to capture the impact of the
program investments as well as AM as a foundational technology. AMO is engaged in the
development of several analytical methodologies and associated tools such as the Materials Flow
through Industry (MFI) tool as well as the Life Cycle Industry GHgas, Technology and Energy
through the Use Phase (LIGHTEn-UP) tool can provide a cross-sector perspective on the energy
impacts resulting from innovations in materials and manufacturing technologies. These tools
form the foundation for the life cycle assessment methodology work presented in this report.
The overall goal of this report is to define a methodology to consistently calculate the life cycle
energy consumption and savings for RD&D projects in AM. The approach is to define and
calculate the energy requirements at each step of the AM process - drawing in part from the wide
range of primary data available from subject matter experts as well as scientific literature. ORNL
has developed an AM life cycle specific methodology, basic tool with guidance and has provided
some case studies in this report to inform RD&D researchers on how to perform these
calculations. Many of the funding agencies, practitioners and researchers in AM might not be
familiar with life cycle energy assessment and therefore providing a consistent methodology to
express the energy impacts will serve this community to better understand the complete energy
footprint of AM products, as well the potential impact of AM RD&D activities. Further effort to
create a library of material and process data may be used to refine the tool and methodology.
Life Cycle Assessment Concept Life Cycle Assessment (LCA) is a methodology that considers all the resources and emissions
associated with a product or process over its entire life cycle. Cumulative energy content – or
Figure 1: AMO Technology Focus [DOE AMO]

10
embodied energy – of a product over the life of the product can be calculated using LCA. We
will consider the product lifecycle using five phases: 1. Material, 2. Manufacturing, 3 Freight &
Distribution, 4. Use, and 5. Disposal (Figure 2). The methodology for the tool is derived from the
work of numerous LCA researchers, including Michael Ashby [M. ASHBY], B. W. Vigon
[VIGON 1992], Martin Baumers [BAUMERS 2013], Geert Bergsma [BERGSMA 2013], and
other important references listed in the reference chapter.
1. Material Phase: The material phase includes all the energy required to process a material
(or materials) into a form that can be used to fabricate a particular product. The materials
used in conventional as well as additive manufacturing processes may come in different
forms and shapes. For example: metal ingots vs. metal powders, polymer pellets vs.
extruded filaments, etc. The material phase includes all the energy required to process
materials from mines to the manufacturing facility gate. This energy consumption is also
called the embodied energy of the material. Please note – embodied energy of metal
powder includes embodied energy of raw metal and additional energy required in the
atomization process (metal to metal powder). Similarly, embodied energy of extruded
polymer wires include embodied energy of polymer pellets and additional energy
required in the extrusion process.
Figure 2: Reduced product life-cycle energy consumption through AM

11
2. Manufacturing Phase: This phase includes product fabrication steps and the energy
required to fabricate a product (using subtractive or additive process) from manufactured
materials. The total energy consumed in manufacturing phase can be divided into three
parts: i. Energy consumed by primary, secondary, and tertiary shaping and finishing
processes; ii. Energy consumed in post-machining processes such as heat treating, stress
relieving, brazing, HIP, inspection, etc.; and iii. Embodied energy of tooling and machine
tools used in the manufacturing process.
3. Freight and Distribution Phase: This phase includes stepsthat prepare the final product for
shipment, and the transport of the products from one location to the next. Energy use is a
function of the transport mode(s), and weight of the component part, and distance the part
travels through the supply chain.
4. Use Phase: Begins after the distribution of products or materials for intended use and
includes any activity in which the product or package may be reconditioned, maintained,
or serviced to extend its useful life. For example - parts used on the aircrafts, components
mounted on vehicles, etc. In the case of part use, for static products, impact on energy use
may be negligible. However, for transport related products, such as aerospace and
automotive components, energy use is a function of the parts weight, its working life
cycle on the vehicle, and the type of vehicle into which the component parts is integrated.
5. Disposal or End of Life Phase:
Begins after the product has
served its intended purpose and
either will enter a new system
through recycling (open-loop
recycling or closed-loop
recycling) or waste management
(landfill, combustion or
incineration, or composting). In
open-loop recycling, products are
recycled into new products that
are eventually disposed. In
closed-loop recycling, products
are recycled again and again into
the same product. There are
multiple methods available for
accounting energy use in the
disposal or end of life phase.
While selecting the energy
accounting method, it is
important to consider multiple
factors such as promotion of the
collection of secondary materials
as well as question of fairness
(who pays for recycling and who gets benefits?). The AM Energy Impacts tool uses “End
Figure 3: End of Life Method [BERGSMA 2013]
Virgin Material Input
(Ti - 10 lbs)
Recycled Material Input
(Ti - 0 lbs)
PRODUCT A
(10 lbs)
Material to final waste
(Ti - 1 lb)
Material to recycling
(Ti - 9 lbs)
Additional
recycling
(Ti - 9 lbs)
END OF LIFE MODELLING
(Energy burden for virgin and
recycled material
is the same)
(Full Bonus and Burden
attributed to
PRODUCT A)
2.6 MMBtu/part
Landfilling 0.001 MMBtu/part
-2.0 MMBtu/part

12
of Life (EOL)” method [Bergsma, 2013] as it promotes recycling and rewards recycling
effort (see Figure 3). The EOL method uses the following approach:
a. Secondary or recycled materials that are INPUT to a process have the same
attached environmental burden as virgin materials; b. Secondary materials on the OUTPUT side leave the product system causing extra
environmental burden (energy use for melting and transport for collection,
sorting) as well as an environmental bonus (avoided burden virgin material
production); and c. The benefit of recycling goes entirely to product under consideration (e.g. Product
A, Figure 3).
As shown in Figure 3, Product A is manufactured using 10 lbs of virgin Titanium (Ti) material.
Assuming embodied energy of Ti equal to 263,328 Btu/lb, energy consumed per part in the
material phase is 2.6 MMBtu/part. In the disposal phase, 9 lbs of Ti are recycled and 1 lb is
wasted or land-filled. By assuming embodied energy of recycled Ti equal to 37,403 Btu/lb,
avoided energy burden for virgin Ti is -2.0 MMBtu/part (0.3 - 2.4 MMBtu/part). By assuming
landfilling energy intensity equal to 1000 lbs/lb, amount of energy wasted to landfill 1 lb of
wasted Ti is 0.001 MMBtu/part. Hence total disposal energy per part using the EOL approach is
-2.0 MMBtu/part.
Previous Work on Additive Manufacturing Energy Use and Life-Cycle
Assessment Conventional manufacturing (subtractive) processes, such as machining, form an important
comparison technology to metallic AM and injection molding (IM) forms an important
comparison technology for polymer AM. Significant amount of research and number of studies
are conducted assessing the relationship between energy inputs and process parameters and life
cycle energy use for subtractive processes and other processes like IM. On the other hand, a
negligible amount of research has been conducted in evaluating the life cycle energy of products
made using AM processes to date. When assessing the life cycle energy of an AM product, it is
vital to consider the material, manufacture, freight and distribution, use, and the part disposal
phase. Although AM processes may use more energy than conventional processes per unit mass
of material processed, they do enable the production of parts with optimized shapes and
geometric features that reduce raw materials and component weight. For example, in aircraft
parts, the primary environmental and energy efficiency benefit of AM is during the use phase of
the part. By enabling optimized part manufacture, significant weight savings can be realized,
which can greatly reduce the fuel consumption of aircraft. In addition, localized production
enabled by additive manufacturing could lead to a reduction in the energy used in freight and
distribution of final products.
Summary of Literature Review In 2013, Florent Bourhis and Olivier Kerbrat of Institut de Recherche en Communications et
Cybernétique de Nantes, France [IJAMT 2013] presented a methodology to evaluate AM where
all flows consumed (material, fluids, and electricity) are considered in the environmental impact
assessment. Their article presented a life cycle framework to evaluate the energy consumption in
the AM machine. They modeled each feature of the machine such as electricity, material, and
fluid consumption. Their study excluded some parameters like powder production, inert gas

13
production, hydraulic fluid production, and compressed air production and consumption. In
addition, their approach didn’t include powder recycling, material and energy used to
manufacture the machine tools, parts recycling, machine tool recycling, etc.
In June 2013, Martin Baumers of the University of Nottingham (Baumers, 2013) investigated in
their Journal of Industrial Ecology article whether the adoption of AM technology can be used to
reach transparency in terms of energy and financial inputs to manufacturing operations. As per
Baumers, the parallel character of AM (allowing the contemporaneous production of multiple
parts) poses previously unconsidered problems in the estimation of manufacturing energy
consumption. Their research discusses the implementation of a tool for the estimation of process
energy flows and costs occurring in the AM technology variant direct metal laser sintering. They
demonstrated that accurate predictions of manufacturing energy consumption per part can be
made for the production of a basket of sample parts. The AM Energy Impacts Assessment tool
uses the manufacturing phase energy estimation methodology discussed in Baumers’ article.
Components for Energy Efficiency in Transport by Additive Manufacturing (CEEAM) project
[CEEAM 2012] is funded by the Transport iNet (part of the East Midlands Development
Agency, UK). The CEEAM project tackles issues preventing the growth of AM in the high-
performance engineering sector, with a specific focus on the space industry. At present, it is not
possible to exploit the advantages of AM due to concerns with respect to the integrity of the
parts. One of the primary concerns is that every layer must be processed correctly otherwise part
integrity is jeopardized. Moreover, before a new manufacturing process or material can be used
for demanding space applications, a qualification process must be undertaken. The project also
produced lightweight satellite components. The current launch cost of a satellite is about $13,800
per lb of load, so it showed clear economic and environmental benefits to reducing weight.
Within this project, only the final part weight was considered and not the energy implications of
either the raw material used or the manufacturing efficiencies of AM.
Led by Loughborough University in UK, the Atkins project [Atkins 2011] was set out to
understand and quantify the energy efficiency and environmental benefits of using the AM
process for the production of components within the aerospace and automotive supply chain.
Aircraft TV monitor arms were redesigned using topological optimization software to
significantly reduce mass while maintaining strength and stiffness. The parts were then
manufactured using laser sintering or selective laser melting (SLM). These AM processes were
found to consume between 10 and 100 times more energy per lb of material processed than
computer numerical control (CNC) machines but reducing the weight by 5.25 lb/arm for these
parts. Despite increasing the direct energy required to manufacture the part, the AM process
reduces manufacturing sector energy through the reduction of aluminum requirements.
However, these savings are relatively minor compared to the use-phase energy savings that
lighter aircraft parts allow if deployed into airline fleets.
The research work at The University of Texas at Austin [UT Austin 2010] quantified the
material and energy use of Selective Laser Sintering (SLS) nylon parts and compared these
estimates with Injection Molding (IM) parts. The results indicated that SLS nylon parts are not as
energy efficient as IM parts when considering nylon material and energy consumed during the
material and part production process. They didn’t take into consideration freight and distribution,

14
use phase, and end of life phases in their research work. Supply chain effects such as reduced
freight and distribution and infrastructure costs could make SLS more favorable. Additionally,
one of the advantages of SLS is its ability to produce parts that cannot be manufactured using
IM. These parts, with optimized geometries, have the opportunity to increase the efficiency of
end-use applications.
The SAVING project (Sustainable product development via design optimization and AdditiVe
manufacturING) was established in September 2009 [SAVING 2009] and funded by the
Technology Strategy Board in the United Kingdom. The SAVINGS project focused on design
and process optimization, applied to AM, with the objective of creating innovative designs that
could be manufactured or used more efficiently than with conventional practices. Design
optimization and analysis of hollow and cellular structures was investigated, and parts were
manufactured using the EOS Direct Metal Laser Sintering (DMLS) process. Through a series of
case studies from the aerospace and automotive industries (cylinder head, heat exchanger, airline
buckle, etc.), the project demonstrated that DMLS can be used to reduce the energy impact of
vehicles by designing and manufacturing parts that weigh less.
In 2004, Jeffrey Dahmus and Timothy Gutowski with Massachusetts Institute of Technology
[MIT 2004] presented a system-level environmental analysis of conventional machining process
in their ASME paper. The analysis presented considers not only the environmental impact of the
conventional material removal process, but also the impact of associated processes such as
material preparation and cutting fluid preparation. This larger system view results in a more
complete assessment of machining. Energy analyses show that the energy requirements of actual
material removal can be quite small when compared to the total energy associated with machine
tool operation. Also, depending on the energy intensity of the materials being machined, the
energy of material production can, in some cases, far exceed the energy required for machine
tool operation. This work can be used to do similar kind of analysis on AM processes.
Conclusions The literature review indicates that while previous studies have advanced the practice of LCA
assessment for additive manufacturing, none have been sufficiently comprehensive - either not
covering the full life cycle (i.e. lacking raw material inputs, or end of life inputs) of a product, or
based on a limited to a narrow set of additive processes. A tool and approach to cover the
complete life cycle of a product and account for the range of additive processes and materials
was lacking – which this methodology and the AM tool seek to address.
It was also noted from the literature review that there are significant inconsistencies in the energy
intensity data for additive manufacturing processes. Compared to the traditional manufacturing
processes (machining, casting, forging, etc.), process energy intensity data for relatively new
additive manufacturing processes is very limited. Detailed data about MJ/kg (or Btu/lb) for AM
processes and for different materials is often lacking. The energy experiments conducted by
other researchers so far (see literature summary) were incomplete; the work did not include a full
range of power measurements on different additive machines using a range of materials nor have
previous studies identify power levels in different operating modes. In general, previous work
was focused on specific technologies (e.g. EBM machines) rather than covering all technology
platforms (EBM, SLM, FDM, etc.).

15
Within the LCA framework, there are areas where the integration of additional data can improve
the energy estimates. There is a need to design and conduct experimental studies on energy,
production time, and consumables (compressed air, nitrogen, argon, helium, etc.) and to develop
process energy intensity (Btu/lb) and machine productivity (lb/hr) databases for various additive
manufacturing platforms and materials. Experimental studies could provide detailed data on
energy intensities for the most common AM processes and for different materials. The
methodology and tool have been designed to be adaptable to new data and information that can
expand the fidelity of the energy estimates. The data from additional experimental studies could
be used to validated the AM tool and be directly used in the AM tool to make it more valuable,
accurate, and consistent.

16
CHAPTER 2 – OVERVIEW OF LIFE-CYCLE ASSESSMENT
METHODOLOGY
Figure 4 shows the procedure and associated inputs required and outputs generated for life-cycle
energy assessment of a product manufactured either by conventional or additive manufacturing
process. The inputs to the calculator are of two types: i. User Inputs and ii. Database Inputs.
User Inputs are shown in the top left of the flow diagram and include:
Bill of materials,
Manufacturing process choice,
Freight and distribution requirements,
Use phase sector,
Duty cycle (the details of the energy and intensity of use), and
Disposal route
Life Cycle Energy
Assessment of
Conventional and
Additive Manufacturing
User Inputs Bill of Materials
Manufacturing processes
Freight and distribution needs
Use phase sector
Duty cycles
Disposal route
Database Inputs Data for material embodied energies,
Process energies,
Freight and distribution energies, and
Recycle energies
Figure 4: Overview of life-cycle assessment methodology. User inputs are combined with the data drawn from databases of embodied energy of materials, processes,
freight and distribution energies and energy conversion efficiencies to create the energy use breakdown.
17
Database Inputs are shown in the top left of the flow diagram and include:
Data for material embodied energies,
Process energies,
Freight and distribution energies, and
Recycle energies – energy conversion efficiencies that are drawn from look-up tables
stored in other tabs.
The Outputs are the energy footprint of each phase of life, represented as bar charts and in
tabular form. The results also provide energy savings per part of each phase of life and overall
energy savings with respect to conventional manufacturing process.
The procedure is explained in detail in chapter 3 and illustrated by case studies in chapter 4.

18
CHAPTER 3 – AM ENERGY IMPACTS ASSESSMENT TOOL
Outline of the Tool This section provides guidance on how to use the Excel based tool and utilize the built-in life
cycle framework. The tool is also referred as the calculator in this report.
The AM Energy Impacts Assessment Tool includes the following seven major tabs:
Intro Tab
Product Details Tab
CM Calculator Tab (CM – Conventional Manufacturing)
AM Calculator Tabs 1 and 2 (AM – Additive Manufacturing)
Results Tabs 1 and 2
Intro All users are recommended to start their analysis with the Intro Tab (see Figure 5). The Intro tab
provides a drop down menu of different LCA scenarios for analysis. It also explains the LCA
framework and defines various LCA terms used in the analysis.
Terms and definitions
LCA Framework
Different Scenarios
for Analysis
Figure 5: AM Energy Impacts Assessment Tool - Intro Tab
19
The AM Energy Impacts Assessment tool can be used to run four different scenarios which are
described in Table 1. The user selects a specific scenario for analysis using the drop-down menu.
Based on the user’s selection some tabs are automatically hidden or made visible. For example –
if user selects scenario 1, tabs CM Calculator, AM Calculator (1), and Results (1) are shown but
AM Calculator (2) and Results (2) are kept hidden. The Table 1 provides more information.
Table 1: Different scenarios for the AM Energy Impacts Assessment Tool
Scenario # Scenario Details Approach
Scenario 1 Part manufactured by conventional
vs. additive manufacturing
Use tabs - CM Calculator and AM
Calculator (1), Outcomes in tab Results (1).
Scenario 2 Additive manufacturing process A
vs. process B
Use tabs - AM Calculator 1 and AM
Calculator 2, Outcomes in tab Results (2).
Scenario 3 Additive manufacturing process
with different part geometries
Use tabs - AM Calculator 1 and AM
Calculator 2, Outcomes in tab Results (2).
Scenario 4
Additive manufacturing process
with improved efficiency
(efficiency 1 vs. 2)
Use tabs - AM Calculator 1 and AM
Calculator 2, Outcomes in tab Results (2).
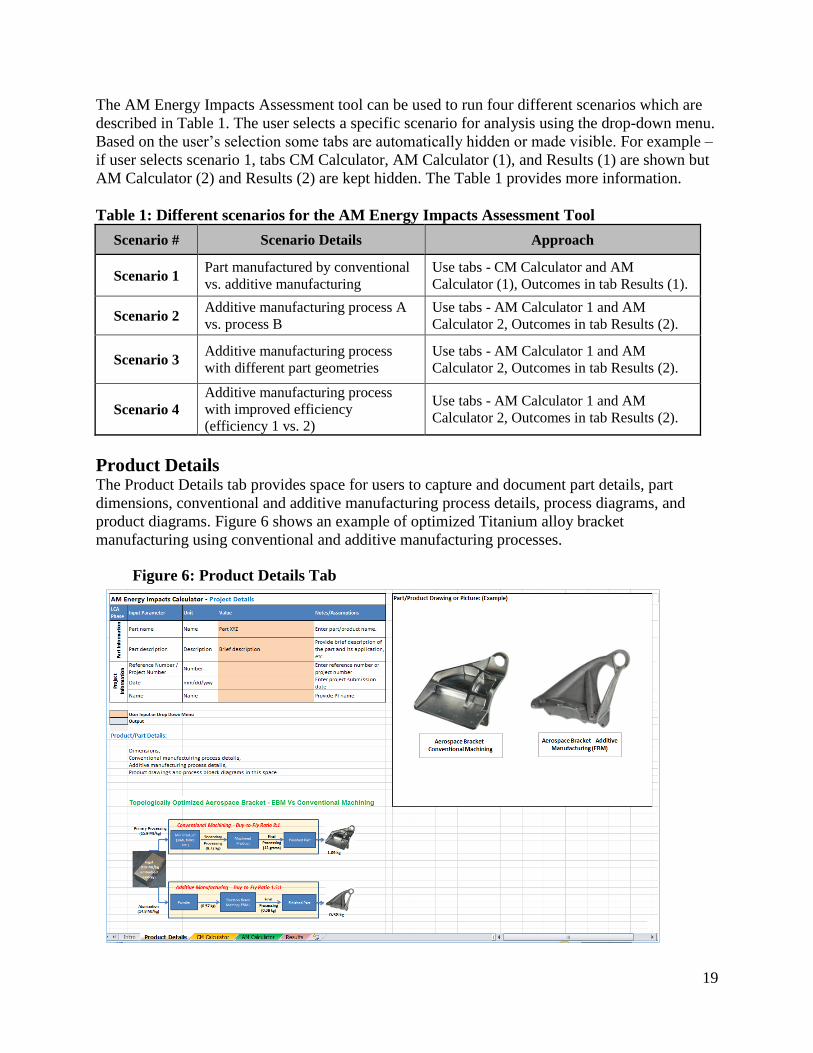
Product Details The Product Details tab provides space for users to capture and document part details, part
dimensions, conventional and additive manufacturing process details, process diagrams, and
product diagrams. Figure 6 shows an example of optimized Titanium alloy bracket
manufacturing using conventional and additive manufacturing processes.
Figure 6: Product Details Tab

20
CM Calculator CM stands for Conventional Manufacturing. CM Calculator Tab covers life cycle assessment for
conventional manufacturing process to determine energy used over the lifetime of a product,
from cradle to grave.
When using the CM Calculator Tab, use the following color codes. The light orange color cells
are user input cells where data is either entered by the user or selected from a drop down menu.
Light blue color cells indicate outputs from calculations programmed in the tool. Cells with
white background include labels, instructions, notes and formulae. No inputs are needed from the
users in these white background cells.
User input or Drop Down Menu
Outputs from Calculations
Energy Output
The CM calculator tab begins with the part information. Once user provides this information in
the CM calculator tab, the same information is copied to the AM calculator tab and results
section.
Part Information:
AM Energy Impacts Assessment Tool - Conventional Manufacturing Process
LCA Phase
Input Parameter Unit Value Tool Guidance
Par
t In
form
atio
n
Part name Name Part XYZ Enter part/product name manufactured by the conventional manufacturing process under consideration.
Part description Description Brief
Description Provide brief description of the part and its application, etc.
The CM lifecycle assessment calculator covers all five lifecycle phases, described here for
energy.
Material Phase Energy Analysis:
In this step, the user is asked to draw up a bill of materials and provide the mass of each
component used in the product and the material of which it is made. As described in Chapter 1,
the materials used in conventional as well as additive manufacturing processes may come in
different forms and shapes (For example: metal ingots vs. metal powders, polymer pellets vs.
extruded wires, etc.). At present, the tool can only handle parts made from two materials. User
provides data for material # 1 first. If material # 1 amount in the product is < 100% (this means
the product is produced using more than one material), the tool brings up options for a second
material. The tool’s ability to handle parts made from more than two materials will be added in
subsequent revisions. Data for the embodied energy (Btu/lb) per unit mass for each material is
retrieved from the database. Please note – embodied energy of metal powder includes embodied

21
energy of raw metal and additional energy required in the atomization process (metal to metal
powder). Similarly, embodied energy of extruded polymer wires include embodied energy of
polymer pellets and additional energy required in the extrusion process. Multiplying the mass of
each component by its embodied energy and summing give the total material energy – the first
bar of the bar chart in Figure 2.
Conventional Manufacturing Process
LCA Phase
Input Parameter Unit/Part
Value (Note – these
terms are used in the formulae
below)
Tool Guidance
Typical life-span of the product manufactured using conventional method
Years LSCM Enter product life in terms of # of cycles, years, months, or days.
Mat
eri
al
Material # 1 consumed to produce final part
Select M1 Select material # 1 name from the drop-down list. The current version of the tool allows only two input materials.
Material # 1 amount - % of total initial mass
% M1,% Enter material # 1 amount as a % of total initial mass. If material # 1 amount is < 100%, tools brings up a second material option.
Total input material initial mass
Lb/part Minitial,CM Enter input material initial mass - this should include scrap, waste, and material loss during the manufacturing process.
Final part mass Lb/part Mfinal,CM Enter final mass of the component/part after going through all the manufacturing and post-manufacturing processes.
Ratio between initial material used and the weight of the final product - Conventional Manufacturing Process
Ratio Minitial,CM/ Mfinal,CM
The weight ratio between initial input material used for a component and the weight of the final component itself.
Total engineered scrap or waste generated onsite while producing final part
Lb/part Escrap This is the difference between total input material initial mass and final part mass.
Percent of engineered scrap recovered and recycled onsite
% Escrap%,recycle
User provides a percent of total engineered scrap recovered and recycled on-site. This is different from the recycled material after end of life.
Material # 1 embodied energy (primary or virgin)
Btu/lb EEpM,1 Embodied Energy for input Material # 1 (primary or virgin) - pulled from the "Embodied Energy - Material" tab.
Material # 1 embodied energy (recycled engineered scrap)
Btu/lb EEsM,1 Embodied Energy for input Material # 1 (recycled engineered scrap) - pulled from the "Embodied Energy - Material" tab.
Material Phase Energy Use per Part
Btu/part M_EU_CM The total material energy per part – the first
bar of the bar chart (Figure 2).

22
Equations:
For parts built with single material:
M_EU_CM = (M1,% * Minitial,CM - M1,% *( Escrap%,recycle* Escrap))* EEpM,1+(M1,% *(
Escrap%,recycle * Escrap)* EEsM,1)
For parts built with two materials:
M_EU_CM = (M1,% * Minitial,CM - M1,% *( Escrap%,recycle* Escrap))* EEpM,1+(M1,% *(
Escrap%,recycle * Escrap)* EEsM,1) + (M2,% * Minitial,CM – M2,% *( Escrap%,recycle* Escrap))*
EEpM,2+(M2,% *( Escrap%,recycle * Escrap)* EEsM,2)
Manufacturing Phase Energy Analysis:
Manufacturing phase energy analysis is done in three steps: Step A, B, and C.
It is possible that there might be a few additional manufacturing steps that don’t fit into steps A,
B, and C. The AM tool assumes that those additional manufacturing steps are common between
conventional and additive manufacturing processes and hence could be ignored. The
“infrastructure” energy requirements (like lighting, heating, ventilation, and air conditioning) are
also assumed to be equal for CM and AM processes. In reality, AM process could increase or
decrease the infrastructure energy requirements.
Manufacturing Phase Energy Analysis – Step A:
Step A of the manufacturing analysis focuses on primary, secondary, and tertiary shaping and
finishing processes since they are generally the most energy-intensive steps of conventional
manufacturing. The process energy intensities per unit mass are retrieved from the database, as in
Appendix 3. Multiplying the mass of each component by its primary, secondary, and tertiary
shaping energy intensities and summing give an estimate of the total manufacturing energy in
Step A.
Step A
Computes energy use
per part for primary,
secondary, and tertiary
shaping and finishing
processes
Step B
Computes energy use per
part for post-machining
processes such as heat
treating, stress relieving,
brazing, HIP, inspection,
etc.
Step C
Accounts for embodied
energy of tooling & machine
tools & computes energy
use/part by taking into
account no. of parts produced
during the lifetime of tooling
& machine tools
Manufacturing Phase Energy Analysis
Figure 7: Manufacturing Phase Energy Analysis Steps

23
LCA Phase
Input Parameter Unit Value Tool Guidance M
anu
fact
uri
ng –
Ste
p A
Conventional Manufacturing Process Steps (Step A):
Primary Shaping Process Select CM_PP Select primary mode of material processing. Metals, typically, are cast, rolled, or forged. Polymers are molded or extruded.
Primary Shaping Process Energy Intensity
Btu/lb EICM_PP Energy intensity per lb of initial material for the primary shaping process - pulled from the "Embodied Energy - Process" tab.
Secondary Process (machining/joining/finishing)
Select CM_SP Select secondary mode of material processing. Secondary processes take a shaped part and add features, join, and finish it.
Secondary Process Energy Intensity
Btu/lb EICM_SP Energy intensity per lb of material removed by the secondary process - pulled from the "Embodied Energy - Process" tab.
% of material removed by secondary process
% MCM_SP,%
Calculated. MCM_SP,% = 0.9*(( Minitial,CM –
Mfinal,CM)/ Minitial,CM). It is assumed that 90%
of the total mass difference is removed by secondary process.
Tertiary Process (machining/joining/finishing)
Select CM_TP Select tertiary mode of material processing. Tertiary processes mainly include finishing operations like grinding.
Tertiary Process Energy Intensity
Btu/lb EICM_TP Energy intensity per lb of material removed by the tertiary process - pulled from the "Embodied Energy - Process" tab.
% of material removed by tertiary process
% MCM_TP,%
Calculated. MCM_TP,% = 0.1*(( Minitial,CM –
Mfinal,CM)/ Minitial,CM). It is assumed that 10%
of the total mass difference is removed by tertiary process.
Manufacturing Phase Energy Analysis – Step B:
Step B of the manufacturing energy analysis computes energy use per part for post-machining
process or processes. Post-machining processes include heat treatment, stress relieving, brazing,
Hot Isostatic Pressing (HIP), inspection, etc. Multiplying the mass of material per part going
through post-machining processes with post-machining process energy intensity gives an
estimate of manufacturing energy Step B.
LCA Phase
Input Parameter Unit Value Tool Guidance
Man
ufa
ctu
rin
g –
Ste
p B
Accounting for Post-machining process or processes (Part B):
Enter post-machining process or processes (heat treating, stress relieving, brazing, HIP, inspection, etc.)
User defined
CM_PostM
Manually enter post-machining processes. Post-machining processes include heat treating, stress relieving, brazing, HIP, etc.). Care should be taken when the energy content of a secondary process is calculated based on batch processing. When the batch size changes there can be a significant change in the energy intensity per part.

24
LCA Phase
Input Parameter Unit Value Tool Guidance
Enter post-machining process or processes Energy Intensity
Btu/lb EICM_PostM
Provide post-machining process energy intensity. If more than one post-machining processes are involved, calculate combined energy intensity.
% of material going through post-machining processes (heat treating, stress relieving, brazing, HIP, inspection, etc.)
% MCM_PostM,% Provide % of material going through the post-machining processes. Typically, this number is going to be 100% of the final mass.
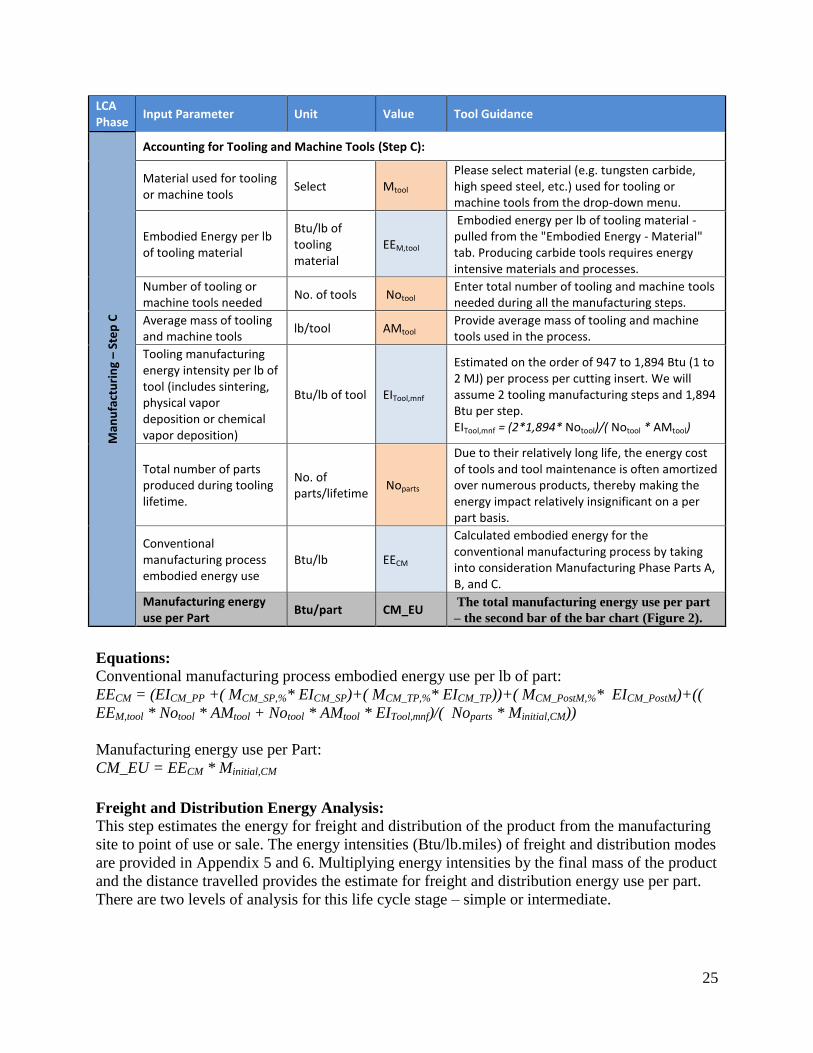
Manufacturing Phase Energy Analysis – Step C:
Step C of the manufacturing energy analysis accounts for embodied energy of tooling and
machine tools used in the conventional manufacturing process.
While tooling plays a major role in the conventional machining process, the direct energy impact
of tooling is limited [DAHMUS 200]. Due to their relatively long life, the energy cost of tools
and tool maintenance is often amortized over numerous products, thereby making the energy
impact relatively insignificant on a per part basis. This is true if parts are manufactured in high
volume, but at low volumes, tooling can be a high part of the energy footprint (see Table 2). And
hence AM process can have advantages for low volume applications. For example, producing
carbide tools does require some energy intensive materials and processes. Tungsten, with an
embodied energy of approximately 172,000 Btu/lb, comprises most of the mass of carbide
cutters. Some of the manufacturing steps, including sintering, which are used to form the carbide
tool, and physical vapor deposition (PVD) or chemical vapor deposition (CVD), which is used to
coat the carbide, are also quite energy intensive, with estimates on the order of 947 to 1,894 Btu
(1 to 2 MJ) per process per cutting insert. While these energy values are not trivial, the fact that
carbide cutting tools can be used numerous times on multiple surfaces means that this energy
investment is distributed over numerous parts.
Table 2: Tooling Energy Intensity for a Range of Parts Manufactured (Material embodied energies – [DAHMUS 2004], [AZOM], and [M. ASHBY]).
Tooling Material
Material
Embodied
Energy
(Btu/lb)
Tooling Embodied Energy per Part (Btu/lb per part)
10 parts 100 parts 1000 parts 10,000 parts 100,000 parts
Carbon tool steels 13,972 1,397 140 14 1.4 0.1
High speed steel
(HSS) 36,328 3,633 363 36 3.6 0.4
Cast cobalt alloys 80,611 8,061 806 81 8.1 0.8
Cemented carbide 429,923 42,992 4,299 430 43.0 4.3
Ceramics (alumina,
silicon nitride,
silicon carbide)
429,923 42,992 4,299 430 43.0 4.3
Cubic Boron Nitride
(CBN) 107,481 10,748 1,075 107 10.7 1.1
Tungsten Carbide
(WC) 171,969 17,197 1,720 172 17.2 1.7
25
LCA Phase
Input Parameter Unit Value Tool Guidance M
anu
fact
uri
ng –
Ste
p C
Accounting for Tooling and Machine Tools (Step C):
Material used for tooling or machine tools
Select Mtool Please select material (e.g. tungsten carbide, high speed steel, etc.) used for tooling or machine tools from the drop-down menu.
Embodied Energy per lb of tooling material
Btu/lb of tooling material
EEM,tool
Embodied energy per lb of tooling material - pulled from the "Embodied Energy - Material" tab. Producing carbide tools requires energy intensive materials and processes.
Number of tooling or machine tools needed
No. of tools Notool Enter total number of tooling and machine tools needed during all the manufacturing steps.
Average mass of tooling and machine tools
lb/tool AMtool Provide average mass of tooling and machine tools used in the process.
Tooling manufacturing energy intensity per lb of tool (includes sintering, physical vapor deposition or chemical vapor deposition)
Btu/lb of tool EITool,mnf
Estimated on the order of 947 to 1,894 Btu (1 to 2 MJ) per process per cutting insert. We will assume 2 tooling manufacturing steps and 1,894 Btu per step. EITool,mnf = (2*1,894* Notool)/( Notool * AMtool)
Total number of parts produced during tooling lifetime.
No. of parts/lifetime
Noparts
Due to their relatively long life, the energy cost of tools and tool maintenance is often amortized over numerous products, thereby making the energy impact relatively insignificant on a per part basis.
Conventional manufacturing process embodied energy use
Btu/lb EECM
Calculated embodied energy for the conventional manufacturing process by taking into consideration Manufacturing Phase Parts A, B, and C.
Manufacturing energy use per Part
Btu/part CM_EU The total manufacturing energy use per part
– the second bar of the bar chart (Figure 2).
Equations:
Conventional manufacturing process embodied energy use per lb of part: EECM = (EICM_PP +( MCM_SP,%* EICM_SP)+( MCM_TP,%* EICM_TP))+( MCM_PostM,%* EICM_PostM)+((
EEM,tool * Notool * AMtool + Notool * AMtool * EITool,mnf)/( Noparts * Minitial,CM))
Manufacturing energy use per Part:
CM_EU = EECM * Minitial,CM
Freight and Distribution Energy Analysis:
This step estimates the energy for freight and distribution of the product from the manufacturing
site to point of use or sale. The energy intensities (Btu/lb.miles) of freight and distribution modes
are provided in Appendix 5 and 6. Multiplying energy intensities by the final mass of the product
and the distance travelled provides the estimate for freight and distribution energy use per part.
There are two levels of analysis for this life cycle stage – simple or intermediate.

26
If significant, there should be a consideration of packaging as it relates to distribution. Parts
made at or near the point of use may require little or no packaging whereas items packed for
shipment often require materials that cause recycling problems and expenses.
LCA Phase
Input Parameter Unit Value Tool Guidance
Fre
igh
t an
d D
istr
ibu
tio
n
Analysis Level Select FD_AL
Select analysis level - Simple or Intermediate. Depending upon analysis level, user gets more granularities in terms of freight and distribution modes and associated energy intensities.
Freight and distribution method (Primary Mode)
Select FDmodeprimary Select freight and distribution primary mode.
Freight and distribution average energy use (Primary Mode)
Btu/lb.mile EIFD,primary
The approximate energy of transportation (primary mode) – pulled from “Freight or Transportation” Tab.
Average freight and distribution distance travelled by a part by primary mode
miles/mode DISTFD,primary
Provide average distance travelled by the product using the primary mode of transportation from the manufacturing site to point of use or sale. User can use this mode to cover international portion of the freight too.
Freight and distribution method (Secondary Mode)
Select FDmodesecondary Select freight and distribution secondary mode.
Freight and distribution average energy use (Secondary Mode)
Btu/lb.mile EIFD,secondary
The approximate energy of transportation (secondary mode) – pulled from “Freight or Transportation” Tab.
Average freight and distribution distance travelled by a part by secondary mode
Miles/mode DISTFD,secondary
Provide average distance travelled by the product using the secondary mode of transportation from the manufacturing site to point of use or sale. User can use this mode to cover domestic part of the freight too.
Freight and distribution energy use per part
Btu/part FD_EU The total freight and distribution
energy use per part – the third bar
of the bar chart (Figure 2).
Equations:
Freight and distribution energy use per part:
FD_EU = Mfinal,CM *( EIFD,primary * DISTFD,primary + EIFD,secondary * DISTFD,secondary)
Use Phase Energy Analysis:
The use phase energy analysis is important and is explained here. There are two different classes
of contributions for use phase analysis: products used in the transportation sector or non-
transportation sector use. The user enters the typical life-span of the product in the first row, then
selects the sector where the product will be used. Another option within the sector allows for

27
calculation of use phase energy when a product can be used in the transportation sector as well as
another sector (i.e. electric to thermal energy conversion).
LCA Phase
Input Parameter Unit Value Tool Guidance
Use
Typical life-span of the product manufactured using conventional method
Years P_Life
Product life-span in years. If you know the product life-span in days/months/# cycles, convert it into number of years.
Sector/application area where this part is being used
Select APP_Area
Select sector/application area from: Transportation, Commercial Buildings, Residential, Industry, and Space. Transportation sector includes cars, trucks, buses, aircrafts, and even space shuttles. The "transportation + other" scenario takes care of applications where AM product is installed on or carried by a moving vehicle and also improving energy conversion efficiency (electric to thermal, thermal to mechanical, etc.). Under this scenario, the use phase energy consumption per part is the summation of transport and energy conversion related impacts.
In the application area A which includes the transportation sector, products that form part of, or
carried by, a transportation system (aerospace, automobiles, etc.) add to the mass of the system
during transportation and thereby increase its energy consumption. The transportation table in
appendix 5 and 6 lists the energy use per unit weight and distance. Multiplying this by the
product weight and the distance over which it is carried gives an estimate of the associated use
phase energy.
Use
Ph
ase
- S
tep
A
If the use phase is in transportation sector: Products that form part of, or are carried by, a transportation system add to its mass and thereby augment its energy burden. Strategy is to minimize mass and rolling resistance if the product is part of a system that moves.
Is this product part of or carried by a vehicle?
Select Yes/No If a product that form part of, or are carried by, a transportation system; select Yes, else select No.
Select fuel and mobility type
Select Trans_Type Select transportation or mobility mode.
Average energy use Btu/lb.mile EITrans
Average energy use per weight per distance – pulled from “Use Phase” Tab. In principle, average energy use by mobility type in the use phase should be different from the freight and distribution phase. Use phase energy numbers should be just the additional energy use associated with an increase in mass, whereas freight energy use should include not only the energy use
28
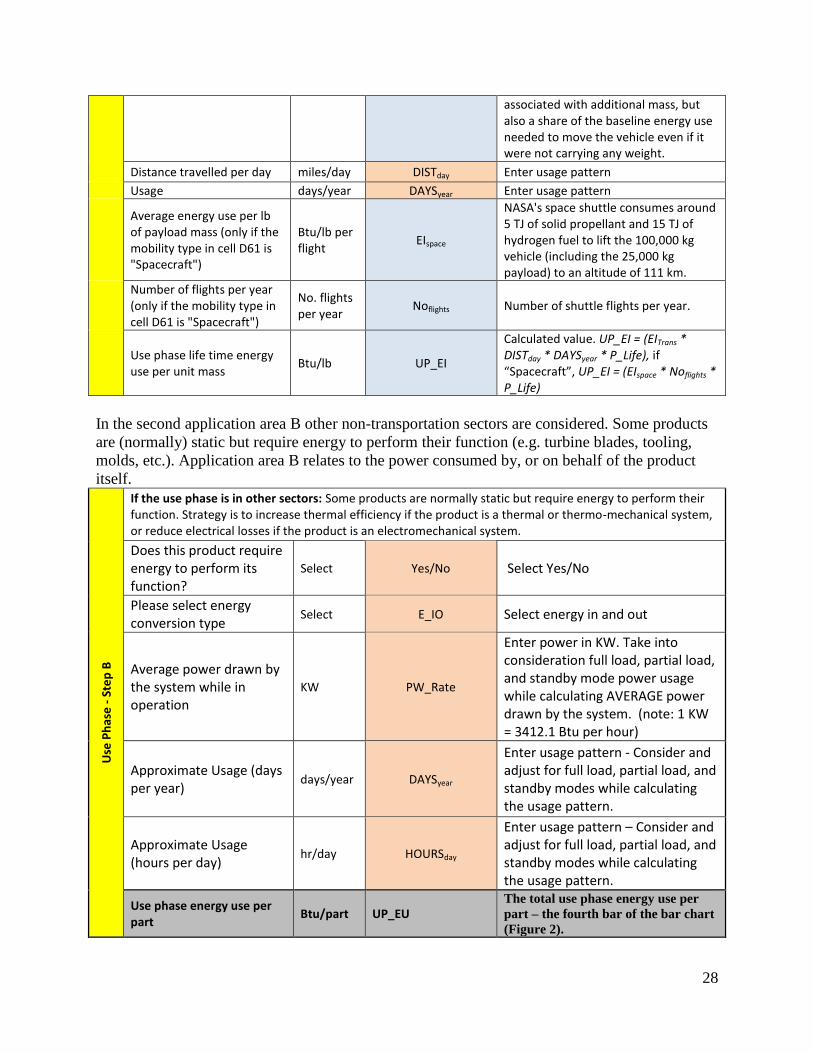
associated with additional mass, but also a share of the baseline energy use needed to move the vehicle even if it were not carrying any weight.
Distance travelled per day miles/day DISTday Enter usage pattern
Usage days/year DAYSyear Enter usage pattern
Average energy use per lb of payload mass (only if the mobility type in cell D61 is "Spacecraft")
Btu/lb per flight
EIspace
NASA's space shuttle consumes around 5 TJ of solid propellant and 15 TJ of hydrogen fuel to lift the 100,000 kg vehicle (including the 25,000 kg payload) to an altitude of 111 km.
Number of flights per year (only if the mobility type in cell D61 is "Spacecraft")
No. flights per year
Noflights Number of shuttle flights per year.
Use phase life time energy use per unit mass
Btu/lb UP_EI
Calculated value. UP_EI = (EITrans * DISTday * DAYSyear * P_Life), if “Spacecraft”, UP_EI = (EIspace * Noflights * P_Life)
In the second application area B other non-transportation sectors are considered. Some products
are (normally) static but require energy to perform their function (e.g. turbine blades, tooling,
molds, etc.). Application area B relates to the power consumed by, or on behalf of the product
itself.
Use
Ph
ase
- S
tep
B
If the use phase is in other sectors: Some products are normally static but require energy to perform their function. Strategy is to increase thermal efficiency if the product is a thermal or thermo-mechanical system, or reduce electrical losses if the product is an electromechanical system.
Does this product require energy to perform its function?
Select Yes/No Select Yes/No
Please select energy conversion type
Select E_IO Select energy in and out
Average power drawn by the system while in operation
KW PW_Rate
Enter power in KW. Take into consideration full load, partial load, and standby mode power usage while calculating AVERAGE power drawn by the system. (note: 1 KW = 3412.1 Btu per hour)
Approximate Usage (days per year)
days/year DAYSyear
Enter usage pattern - Consider and adjust for full load, partial load, and standby modes while calculating the usage pattern.
Approximate Usage (hours per day)
hr/day HOURSday
Enter usage pattern – Consider and adjust for full load, partial load, and standby modes while calculating the usage pattern.
Use phase energy use per part
Btu/part UP_EU The total use phase energy use per
part – the fourth bar of the bar chart
(Figure 2).

29
Equations:
Use phase energy use per part:
If the use phase is only in transportation sector:
UP_EU = UP_EI * Mfinal,CM
If the use phase is only in other sector:
UP_EU = (PW_Rate * DAYSyear * HOURSday * P_Life* 3412.1 Btu/kWh)
If the use phase is in both transportation and some other sector:
UP_EU = (UP_EI * Mfinal,CM) + (PW_Rate * DAYSyear * HOURSday * P_Life* 3412.1 Btu/kWh)
Disposal Phase Energy Analysis:
The fifth and final life cycle stage is disposal or end of life. Normally, after a component/part has
been used and the part has fulfilled its intended purpose, it goes through one of the following
disposal processes:
Landfill
Combustion or incineration
Composting
Open-loop recycling
Closed-loop recycling
Other (Re-engineering/Reuse)
Recycling decreases the amount of solid waste entering landfills and reduces the production
requirements of virgin or raw materials. In open-loop recycling, products are recycled into new
products that are eventually disposed of. In closed-loop recycling, products are recycled again
and again into the same product.
LCA Phase
Input Parameter Unit Value Tool Guidance
Dis
po
sal (
End
of
Life
)
PRIMARY disposal method for material # 1
Select DISPM1,Pmode
Please select primary disposal method option for material # 1 – Landfill, Combustion or incineration, Composting, Open-loop recycling, Closed-loop recycling, or Other (Re-engineering/Reuse). In open-loop recycling, products are recycled into new products that are eventually disposed of. In closed-loop recycling, products are recycled again and again into the same product.
Fraction of material # 1 disposed through the selected PRIMARY disposal method
% of final part mass
DISPM1,%, Pmode A fraction of material # 1 disposed using user selected primary disposal method
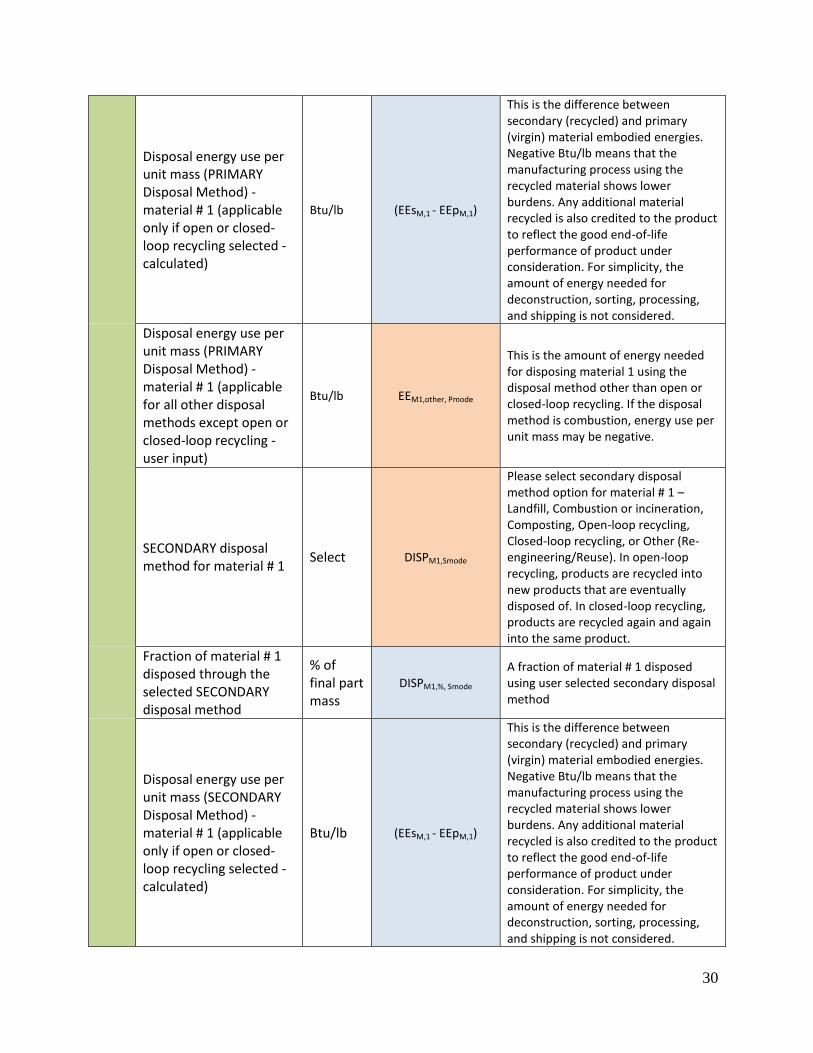
30
Disposal energy use per unit mass (PRIMARY Disposal Method) - material # 1 (applicable only if open or closed-loop recycling selected - calculated)
Btu/lb (EEsM,1 - EEpM,1)
This is the difference between secondary (recycled) and primary (virgin) material embodied energies. Negative Btu/lb means that the manufacturing process using the recycled material shows lower burdens. Any additional material recycled is also credited to the product to reflect the good end-of-life performance of product under consideration. For simplicity, the amount of energy needed for deconstruction, sorting, processing, and shipping is not considered.
Disposal energy use per unit mass (PRIMARY Disposal Method) - material # 1 (applicable for all other disposal methods except open or closed-loop recycling - user input)
Btu/lb EEM1,other, Pmode
This is the amount of energy needed for disposing material 1 using the disposal method other than open or closed-loop recycling. If the disposal method is combustion, energy use per unit mass may be negative.
SECONDARY disposal method for material # 1
Select DISPM1,Smode
Please select secondary disposal method option for material # 1 – Landfill, Combustion or incineration, Composting, Open-loop recycling, Closed-loop recycling, or Other (Re-engineering/Reuse). In open-loop recycling, products are recycled into new products that are eventually disposed of. In closed-loop recycling, products are recycled again and again into the same product.
Fraction of material # 1 disposed through the selected SECONDARY disposal method
% of final part mass
DISPM1,%, Smode A fraction of material # 1 disposed using user selected secondary disposal method
Disposal energy use per unit mass (SECONDARY Disposal Method) - material # 1 (applicable only if open or closed-loop recycling selected - calculated)
Btu/lb (EEsM,1 - EEpM,1)
This is the difference between secondary (recycled) and primary (virgin) material embodied energies. Negative Btu/lb means that the manufacturing process using the recycled material shows lower burdens. Any additional material recycled is also credited to the product to reflect the good end-of-life performance of product under consideration. For simplicity, the amount of energy needed for deconstruction, sorting, processing, and shipping is not considered.

31
Disposal energy use per unit mass (SECONDARY Disposal Method) - material # 1 (applicable for all other disposal methods except open or closed-loop recycling - user input)
Btu/lb EEM1,other, Smode
This is the amount of energy needed for disposing material 1 using the disposal method other than open or closed-loop recycling. If the disposal method is combustion, energy use per unit mass may be negative.
Disposal (End of Life) energy use per part
Btu/part DISP_EU The total disposal energy use per
part – the fifth bar of the bar chart
(Figure 2).
Equations:
Disposal energy use per part:
If only one material:
For open or closed-loop Recycling:
DISP_EU = Mfinal,CM * M1,%*( DISPM1,%,Pmode *(EEsM,1 - EEpM,1))+ Mfinal,CM * M1,%*(
DISPM1,%,Smode *(EEsM,1 - EEpM,1))
For Other Disposal Methods:
DISP_EU = Mfinal,CM * M1,%* DISPM1,%,Pmode *EEM1,other+ Mfinal,CM * M1,%* DISPM1,%,Smode
*EEM1,other
If two raw materials:
For open or closed-loop Recycling:
DISP_EU = Mfinal,CM * M1,%*( DISPM1,%,Pmode *(EEsM,1 - EEpM,1))+ Mfinal,CM * M1,%*(
DISPM1,%,Smode *(EEsM,1 - EEpM,1))+ Mfinal,CM * M2,%*( DISPM2,%,Pmode *(EEsM,2 - EEpM,2))+
Mfinal,CM * M2,%*( DISPM2,%,Smode *(EEsM,2 - EEpM,2))
For Other Disposal Methods:
DISP_EU = Mfinal,CM * M1,%* DISPM1,%,Pmode *EEM1,other+ Mfinal,CM * M1,%* DISPM1,%,Smode
*EEM1,other + Mfinal,CM * M2,%* DISPM2,%,Pmode *EEM2,other+ Mfinal,CM * M2,%* DISPM2,%,Smode
*EEM2,other

32
AM Calculator Although the CM and AM Calculators both cover all five phases of life cycle (material,
manufacturing, freight & distribution, use, and disposal), questions and steps used in different
phases are slightly different. The design of AM Calculator (1) and (2) is similar. As mentioned in
the Intro tab section, depending upon the scenario for analysis, the user selects either AM
Calculator (1) or both AM Calculators (1) and (2). In this section, the design of the AM
Calculator (1) tab is explained. Similar steps are provided in AM Calculator (2).
Part Information:
AM Energy Impacts Assessment Tool - Additive or Advanced Manufacturing Process
LCA Phase
Input Parameter Unit Value Tool Guidance
Par
t In
form
atio
n
Part name Name Part XYZ Enter part/product name manufactured by the additive manufacturing process under consideration.
Part description Description Brief Description
Provide brief description of the part and its application, etc.
Raw Material Energy Analysis:
The raw material energy analysis for the AM tab follows the same methodology as the CM tab.
Additive Manufacturing Process
LCA Phase
Input Parameter Unit
Value (Note – these terms
are used in the formulae below)
Tool Guidance
Typical life-span of the product manufactured using the additive manufacturing method
Years LSAM Enter product life in terms of # of cycles, years, months, or days.
Mat
eri
al
Additive Manufacturing Process/Technique
Select AMTech Select the type of additive manufacturing process to evaluate
Material # 1 consumed to produce final part
Select M1 Select material # 1 name from the drop-down list. The current version of the tool allows only two raw materials.
Material # 1 amount - % of total initial mass
% M1,% Enter material # 1 amount as a % of total initial mass. If material # 1 amount is < 100%, tool brings up a second material option.
% Reduction in material - Initial mass
% Minitial,%Red Calculated. Minitial,%Red = (Minitial,CM - Minitial,AM)/ Minitial,CM
% Reduction in Final part mass
% Mfinal,%Red Calculated. Mfinal,%Red = (Mfinal,CM - Mfinal,AM)/ Mfinal,CM

33
Additive Manufacturing Process
LCA Phase
Input Parameter Unit
Value (Note – these terms
are used in the formulae below)
Tool Guidance
Total input material initial mass
lb/part Minitial,AM Enter input material initial mass - this should include scrap, waste, and material loss during the manufacturing process.
Final part mass lb/part Mfinal,AM Enter final mass of the component/part after going through all the manufacturing and post-manufacturing processes.
Ratio between initial material used and the weight of the final product - Additive Manufacturing Process
Ratio Minitial,AM/ Mfinal,AM
The weight ratio between initial input material used for a component and the weight of the final component itself.
Total engineered scrap or waste generated onsite while producing final part
lb/part Escrap This is the difference between total input material initial mass and final part mass.
Percent of engineered scrap recovered and recycled onsite
% Escrap%,recycle
User provides a percent of total engineered scrap recovered and recycled on-site. This is different from the recycled material after end of life.
Material # 1 embodied energy (primary or virgin)
Btu/lb EEpM,1 Embodied Energy for input Material # 1 (primary or virgin) - pulled from the "Embodied Energy - Material" tab.
Material # 1 embodied energy (recycled engineered scrap)
Btu/lb EEsM,1 Embodied Energy for input Material # 1 (recycled engineered scrap) - pulled from the "Embodied Energy - Material" tab.
Material Energy Use per Part
Btu/part M_EU_AM The total material energy per part – the first
bar of the bar chart (Figure 2).
Equations:
If only one raw material:
M_EU_AM = (M1,% * Minitial,AM - M1,% *( Escrap%,recycle* Escrap))* EEpM,1+(M1,% *(
Escrap%,recycle * Escrap)* EEsM,1)
If there are two raw materials:
M_EU_AM = (M1,% * Minitial,AM - M1,% *( Escrap%,recycle* Escrap))* EEpM,1+(M1,% *(
Escrap%,recycle * Escrap)* EEsM,1) + (M2,% * Minitial,AM – M2,% *( Escrap%,recycle* Escrap))*
EEpM,2+(M2,% *( Escrap%,recycle * Escrap)* EEsM,2)
Manufacturing Energy Analysis:
Manufacturing energy analysis in additive manufacturing tab differs from the CM tab and can be
performed using three different analysis levels with increasing levels of complexity:

34
a. Simple
b. Intermediate, and
c. Advanced
a. Simple analysis:
LCA Phase
Input Parameter Unit Value Tool Guidance
Man
ufa
ctu
rin
g -
Sim
ple
Analysis Level Select M_AL Analysis levels - Simple, Intermediate, and Advanced
Additive manufacturing process embodied energy use
Btu/lb EIAM_PP
Embodied energy per lb processed for the AM primary process - pulled from the "Embodied Energy - Process" tab. Simple method uses published data based on the type of the AM method (SLM, DMLS, EBM, LS, FDM, and Other)
Secondary Process (machining/joining/finishing)
Select AM_SP
Select secondary mode of material processing. Secondary processes take a shaped part and add features, join, and finish it.
Secondary Process Energy Intensity
Btu/lb EIAM_SP Embodied energy per lb processed for the secondary process - pulled from the "Embodied Energy - Process" tab.
% of material removed by secondary process
% MAM_SP,% Calculated. MAM_SP,% = ((Minitial,AM – Mfinal,AM)/ Minitial,AM).
Enter post-machining process or processes (heat treating, stress relieving, brazing, HIP, inspection, etc.)
User defined
AM_PostM
Manually enter post-machining process or processes. Post-machining processes include heat treating, stress relieving, brazing, HIP, inspection, etc.). Care should be taken when the energy content of a secondary process is calculated based on batch processing. When the batch size changes there can be a significant change in the energy intensity per part.
Enter post-additive manufacturing process or processes energy intensity
Btu/lb EIAM_PostM
Provide post-machining process energy intensity. If multiple post-machining processes are involved, calculate combined energy intensity.
% of material going through post-additive manufacturing processes (heat treating, stress relieving, brazing, HIP, inspection, etc.)
% MAM_PostM,%
Provide % of material going through the post-machining processes. Typically, this number is going to be 100%.
Additive Manufacturing process embodied energy use
Btu/lb EEAM,Simple Embodied energy of additive manufacturing process using the simple method.

35
Equations:
Additive manufacturing process embodied energy by simple method: EEAM,Simple = (EIAM_PP + (MAM_SP,%* EIAM_SP) + (MAM_PostM,%* EIAM_PostM)
b. Intermediate analysis:
LCA Phase
Input Parameter Unit Value Tool Guidance
Man
ufa
ctu
rin
g -
Inte
rme
dia
te
Machine Model Enter AM_Machine Intermediate method uses the NAME PLATE data based on the Machine Specs and part material.
Total Build Time or Production Time
Hr/build
T_build
Total production time includes machine tool cleaning, preheating, exposure, recoating, and cooling down. Include cleaning time only if a machine needs cleaning for each cycle. However, if maintenance, cleaning, etc. takes place during non-production shifts, then do not include it here.
Number of parts produced per build operation
Number of parts/build
NP This steps accounts for multiple parts in a single build and its impact on energy.
Average Power Level in Standby, Preheating, and Cooling Down Modes
kW PStandby
Take an average of energy consumption per hour in Standby, Preheating, and Cooling Down Modes. During preheating there will be a constant energy flow to bring the system to operating temperature, much like preheating an oven. During the build the two large power consumers will be maintaining the environmental temperature and portion of the system depositing raw material (laser, extruder, etc.). Stand-by will involve intermittent power consumption to keep the system at a holding temperature without material deposition.
% of total build time the machine is in Standby, Preheating, and Cooling Down Modes
% Standby% Enter % of total build time the machine is in Standby, Preheating, and Cooling Down Modes.

36
LCA Phase
Input Parameter Unit Value Tool Guidance
Average Energy Consumption per hour (kW) when AM machine is in production mode.
kW PProd Average Power Level in Heating, Exposure, and Recoating Mode.
% of total build time the machine is in production mode and producing parts
% Prod% Calculated. % of total build time the machine is in Heating, Exposure, and Recoating Mode.
AM Process Productivity lb/hr AMProductivity
Enter machine productivity in lb of mass produced per hour. This depends upon machine type, AM process type, material, the total batch volume (V) and production batch height (h).
Secondary Process (machining/joining/finishing)
Select AM_SP
Select secondary mode of material processing. Secondary processes take a shaped part and add features, join, and finish it.
Secondary Process Energy Intensity
Btu/lb EIAM_SP
Embodied energy per lb processed for the secondary process - pulled from the "Embodied Energy - Process" tab.
% of material removed by secondary process
% MAM_SP,% Calculated. MAM_SP,% = ((Minitial,AM – Mfinal,AM)/ Minitial,AM).
Enter post-machining process or processes (heat treating, stress relieving, brazing, HIPing, inspection, etc.)
User defined
AM_PostM
Manually enter post-machining process or processes. Post-machining processes include heat treating, stress relieving, brazing, HIPing, inspection, etc.).
Enter post-additive manufacturing process or processes energy intensity
Btu/lb EIAM_PostM
Provide post-machining process energy intensity. If multiple post-machining processes are involved, calculate combined energy intensity.
% of material going through post-additive manufacturing processes (heat treating, stress relieving, brazing, HIPing, inspection, etc.)
% MAM_PostM,%
Provide % of material going through the post-machining processes. Typically, this number is going to be 100%.
Additive Manufacturing process embodied energy use
Btu/lb EEAM,Intermd Embodied energy of additive manufacturing process using the intermediate method.

37
Equations:
Additive manufacturing process embodied energy using the intermediate method: EEAM,Intermd = (3412.1 Btu/kWh)*(( T_build * PStandby * Standby%)/(NP * Minitial,AM)) +(3412.1
Btu/kWh)*(( T_build * PProd * Prod%)/ (NP * Minitial,AM )) + (MAM_SP,%* EIAM_SP) + (MAM_PostM,%*
EIAM_PostM)
c. Advanced analysis:
Advanced analysis is done in three steps: 1) calculating build time; 2) estimating manufacturing
energy consumption; and 3) estimating manufacturing embodied energy. The advanced method
is derived based on Martin Baumers’s work on estimating process energy flows and costs
occurring in the AM technology variant direct metal laser sintering [BAUMERS 2013].
Steps 1 – Calculating Build Time:
LCA Phase
Input Parameter Unit Value Tool Guidance
Man
ufa
ctu
rin
g -
Bu
ild T
ime
Est
imat
ion
Analysis Level Select Advanced Analysis levels - Simple, Intermediate, and Advanced
Build Time Estimation: The estimate for total build time, TBuild, is obtained by combining data from a hierarchy of elements of time consumption.
Part name Name PN_AM
Use the method of build time estimation and energy consumption estimation based on the part geometry, material, and machine specs. This method is documented in the article "Transparency Built in, Journal of Industrial Ecology, 2012 [BAUMERS 2013]. This is a bottom up approach method.
Number of parts produced per build operation
Number of parts/build
NP This step accounts for multiple parts in a single build and its impact on energy.
Fixed time consumption per build operation
seconds/build TJob
Provide fixed time consumption per build operation irrespective of number of parts produced. For example, time required for machine atmosphere generation and machine warm-up.
Fixed time consumption per layer
seconds per layer
Tper_Layer Time required for completing one layer of the material.
The total number of build layers
layers/build l Total number of layers per build operation.
Total layer dependent time consumption
Seconds/build TLayer Obtained by multiplying the fixed time consumption per layer, TLayer, by the total number of build layers l;

38
LCA Phase
Input Parameter Unit Value Tool Guidance
The total build time needed for the deposition of part geometry approximated by the voxels
Seconds/build TVoxel
The summation of the time needed to process each voxel, TVoxel xyz, in a three-dimensional array representing the discretized build configuration
Build Time per Part Seconds/part Tbuild
A voxel (volumetric pixel or Volumetric Picture Element) is a volume element, representing a value on a regular grid in three dimensional space.
Equations:
Total build time is calculated using the following equation:
Tbuild = (Tjob + (Tper_Layer * l) + TVoxel)/NP
Steps 2 – Manufacturing Energy Consumption Estimation:
LCA Phase
Input Parameter Unit Value Tool Guidance
Man
ufa
ctu
rin
g -
Ener
gy C
on
sum
pti
on
Est
imat
ion
Energy Consumption Estimation:
Fixed energy consumption per build operation
Btu Ejob
EJob contains all energy consumption attributable to the build job, including energy consumed by the wire erosion process to remove the parts from the build plate.
Time-dependent energy consumption rate
Btu/second ETime_Rate
A purely time-dependent element of power consumption must be expected in the continuous operation of the AM machine. This is denoted by the energy consumption rate ETime_Rate (measured in Btu/s), which is multiplied by Tbuild to estimate total time-dependent energy consumption. Modeling ETime as a constant reflects its interpretation as a mean baseline level of energy consumption throughout the build, originating from continuously operating machine components such as cooling fans, pumps, and the control system.
Time-dependent energy consumption
Btu/build ETime
Obtained by multiplying the time dependent energy consumption rate, ETime_Rate, by the
total build time Tbuild. ETime = ETime_Rate * Tbuild
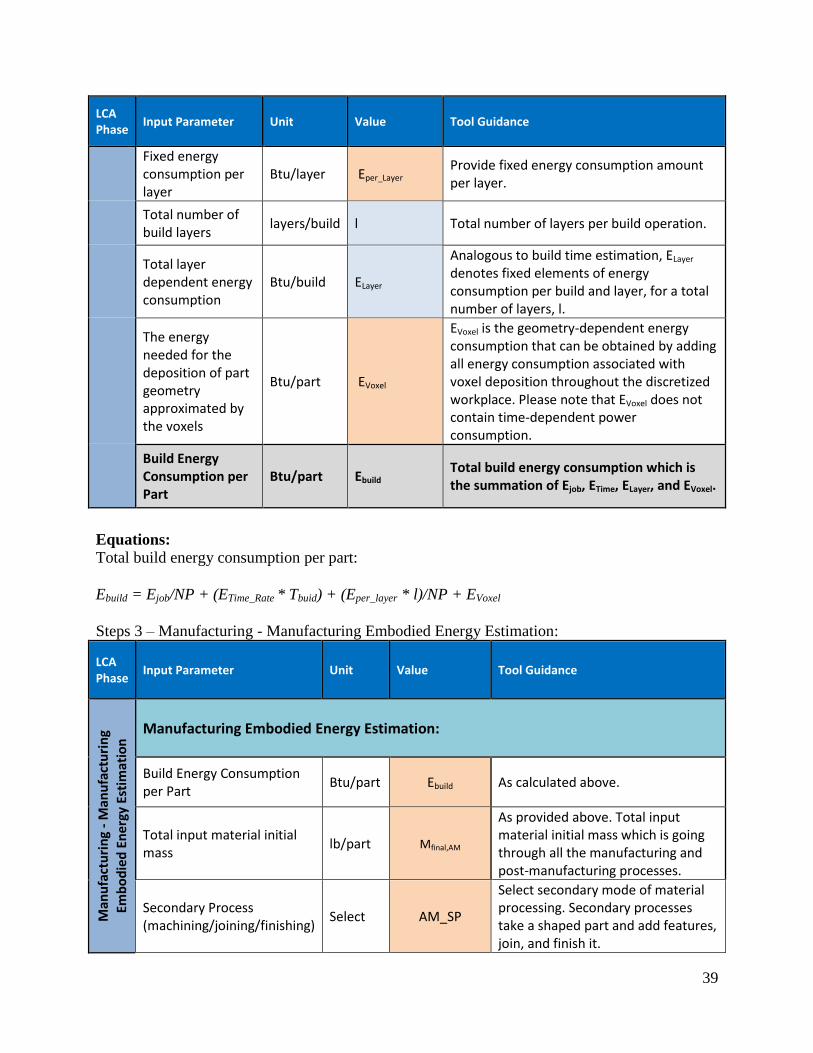
39
LCA Phase
Input Parameter Unit Value Tool Guidance
Fixed energy consumption per layer
Btu/layer Eper_Layer Provide fixed energy consumption amount per layer.
Total number of build layers
layers/build l Total number of layers per build operation.
Total layer dependent energy consumption
Btu/build ELayer
Analogous to build time estimation, ELayer denotes fixed elements of energy consumption per build and layer, for a total number of layers, l.
The energy needed for the deposition of part geometry approximated by the voxels
Btu/part EVoxel
EVoxel is the geometry-dependent energy consumption that can be obtained by adding all energy consumption associated with voxel deposition throughout the discretized workplace. Please note that EVoxel does not contain time-dependent power consumption.
Build Energy Consumption per Part
Btu/part Ebuild Total build energy consumption which is the summation of Ejob, ETime, ELayer, and EVoxel.
Equations:
Total build energy consumption per part:
Ebuild = Ejob/NP + (ETime_Rate * Tbuid) + (Eper_layer * l)/NP + EVoxel
Steps 3 – Manufacturing - Manufacturing Embodied Energy Estimation:
LCA Phase
Input Parameter Unit Value Tool Guidance
Man
ufa
ctu
rin
g -
Man
ufa
ctu
rin
g Em
bo
die
d E
ner
gy E
stim
atio
n Manufacturing Embodied Energy Estimation:
Build Energy Consumption per Part
Btu/part Ebuild As calculated above.
Total input material initial mass
lb/part Mfinal,AM
As provided above. Total input material initial mass which is going through all the manufacturing and post-manufacturing processes.
Secondary Process (machining/joining/finishing)
Select AM_SP
Select secondary mode of material processing. Secondary processes take a shaped part and add features, join, and finish it.

40
LCA Phase
Input Parameter Unit Value Tool Guidance
Secondary Process Energy Intensity
Btu/lb EIAM_SP
Embodied energy per lb processed for the secondary process - pulled from the "Embodied Energy - Process" tab.
% of material removed by secondary process
% MAM_SP,% Calculated. MAM_SP,% = ((Minitial,AM – Mfinal,AM)/ Minitial,AM).
Enter post-machining process or processes (heat treating, stress relieving, brazing, HIPing, inspection, etc.)
User defined
AM_PostM
Manually enter post-machining process or processes. Post-machining processes include heat treating, stress relieving, brazing, HIPing, inspection, etc.).
Enter post-additive manufacturing process or processes energy intensity
Btu/lb EIAM_PostM
Provide post-machining process energy intensity. If more than one post-maching processes are involved, calculate combined energy intensity.
% of material going through post-additive manufacturing processes (heat treating, stress relieving, brazing, HIPing, inspection, etc.)
% MAM_PostM,%
Provide % of material going through the post-machining processes. Typically, this number is going to be 100%.
Additive Manufacturing process embodied energy use
Btu/lb EEAM,Advanced
This is obtained by adding build energy consumption intensity and post-additive manufacturing processes energy intensities.
Manufacturing energy use per Part
Btu/part AM_EU The total manufacturing energy per
part – the first bar of the bar chart
(Figure 2).
Equations:
Additive manufacturing process embodied energy using advanced method of calculations
provides the energy on a mass basis:
EEAM,Advanced = (Ebuild/ Mfinal,AM) + (MAM_SP,%* EIAM_SP) + (MAM_PostM,%* EIAM_PostM)
The final calculation in this section is to calculate the additive manufacturing energy use per part
based on the mass of the part entered by the user:
Simple method:
AM_EU = EEAM,Simple * Minitial,AM
Intermediate method:

41
AM_EU = EEAM,Intermd * Minitial,AM
Advanced method:
AM_EU = EEAM,Advanced* Minitial,AM
Freight and Distribution Energy Analysis:
This step for the AM tab uses the same methodology as the CM tab.
LCA Phase
Input Parameter Unit Value Tool Guidance
Frei
ght
and
Dis
trib
uti
on
Analysis Level Select FD_AL
Select analysis level - Simple or Intermediate. Depending upon analysis level, user gets more granularities in terms of freight and distribution modes and associated energy intensities.
Freight and distribution method (Primary Mode)
Select FDmodeprimary Select freight and distribution primary mode.
Freight and distribution average energy use (Primary Mode)
Btu/lb.mile EIFD,primary The approximate energy of transportation (primary mode) – pulled from “Freight or Transportation” Tab.
Average freight and distribution distance travelled by a part by primary mode
miles/mode DISTFD,primary
Provide average distance travelled by the product using the primary mode of transportation from the manufacturing site to point of use or sale. User can use this mode to cover international portion of the freight too.
Freight and distribution method (Secondary Mode)
Select FDmodesecondary Select freight and distribution secondary mode.
Freight and distribution average energy use (Secondary Mode)
Btu/lb.mile EIFD,secondary The approximate energy of transportation (secondary mode) – pulled from “Freight or Transportation” Tab.
Average freight and distribution distance travelled by a part by secondary mode
Miles/mode DISTFD,secondary
Provide average distance travelled by the product using the secondary mode of transportation from the manufacturing site to point of use or sale. User can use this mode to cover domestic part of the freight too.
Freight and distribution energy use per part
Btu/part FD_EU The total freight and distribution energy
use per part – the third bar of the bar chart
(Figure 2).
Equations:
Freight and distribution energy use per part:
FD_EU = Mfinal,AM *( EIFD,primary * DISTFD,primary + EIFD,secondary * DISTFD,secondary)

42
Use Phase Energy Analysis:
The use phase energy analysis for the AM calculations follows the same methodology as the CM
tab.
LCA Phase
Input Parameter Unit Value Tool Guidance
Use
Typical life-span of the product manufactured using Additive Manufacturing Process
Years P_Life Product life-span in years. If you know the product life-span in days/months/# cycles, convert it into number of years.
Sector/application area where this part is being used
Select APP_Area
Select sector/application area from: Transportation, Commercial Buildings, Residential, and Industry. Transportation sector includes cars, trucks, buses, aircrafts, and even space shuttles. The "transportation + other" scenario takes care of applications where AM product is installed on or carried by a moving vehicle and also improving energy conversion efficiency (electric to thermal, thermal to mechanical, etc.). Under this scenario, the use phase energy consumption per part is the summation of transport and energy conversion related impacts.
LCA Phase
Input Parameter Unit Value Tool Guidance
Use
Ph
ase
- S
tep
A
If the use phase is in transportation sector: Products that form part of, or are carried by, a transportation system add to its mass and thereby augment its energy burden. Strategy is to minimize mass and rolling resistance if the product is part of a system that moves.
Is this product part of or carried by a vehicle?
Select Yes/No If a product that form part of, or are carried by, a transportation system; select Yes, else select No.
Select fuel and mobility type
Select Trans_Type Select transportation or mobility mode.
Average energy use Btu/lb.mile EITrans
Average energy use per weight per distance – pulled from “Use Phase” Tab. In principle, average energy use by mobility type in the use phase should be different from the freight and distribution phase. Use phase energy numbers should be just the additional energy use associated with an increase in mass, whereas freight energy use should include not only the energy use associated with additional mass, but also a share of the baseline energy use needed to move the vehicle even if it were not carrying any weight.

43
Distance travelled per day miles/day DISTday Enter usage pattern
Usage Days/year DAYSyear Enter usage pattern
Average energy use per lb of payload mass (only if the mobility type in cell D95 is "Spacecraft")
Btu/lb per flight
EIspace
NASA's space shuttle consumes around 5 TJ of solid propellant and 15 TJ of hydrogen fuel to lift the 100,000 kg vehicle (including the 25,000 kg payload) to an altitude of 111 km.
Number of flights per year (only if the mobility type in cell D95 is "Spacecraft")
No. flights per year
Noflights Number of shuttle flights per year.
Use phase life time energy use per unit mass
Btu/lb UP_EI Calculated value. UP_EI = (EITrans * DISTday * DAYSyear * P_Life), if “Spacecraft”, UP_EI = (EIspace * Noflights * P_Life)
Use
Ph
ase
- S
tep
B
If the use phase is in other sectors: Some products are normally static but require energy to perform their function. Strategy is to increase thermal efficiency if the product is a thermal or thermo-mechanical system, or reduce electrical losses if the product is an electromechanical system.
Does this product require energy to perform its function?
Select Yes/No
Select Yes/No. If a product is normally static but requires energy to perform their function, select Yes, else select No.
Please select energy conversion type
Select E_IO Select energy in and out
Average power drawn by the system while in operation
KW PW_Rate
Enter power in KW. Take into consideration full load, partial load, and standby mode power usage while calculating AVERAGE power drawn by the system. (note: 1 KW = 3412.1 Btu per hour)
Improvement in system efficiency from scenario 1 to 2 (only used while comparing CM and AM scenarios)
% EFF_IMP
Improvement in system efficiency from scenario 1 to 2 scenario due to improved part geometry, reduced weight, improved performance, etc. If there is no improvement then use 0%.
Approximate Usage (days per year)
Days/year DAYSyear
Enter usage pattern - Take into consideration and adjust for full load, partial load, and standby mode power usage while calculating the usage pattern.
Approximate Usage (hours per day)
hr/day HOURSday
Enter usage pattern - Take into consideration and adjust for full load, partial load, and standby modes while calculating the usage pattern.
Use phase energy use per part
Btu/part UP_EU The total use phase energy use/part – the
fourth bar of the bar chart (Figure 2).

44
Equations:
Use phase energy use per part:
If the use phase is only in transportation sector:
UP_EU = UP_EI * Mfinal,AM
If the use phase is only in other sector:
UP_EU = (PW_Rate * (1- EFF_IMP)*DAYSyear * HOURSday * P_Life* 3412.1 Btu/kWh)
If the use phase is in both transportation and some other sector:
UP_EU = (UP_EI * Mfinal,AM) + (PW_Rate * (1- EFF_IMP)* DAYSyear * HOURSday * P_Life*
3412.1 Btu/kWh)
Disposal Phase Energy Analysis:
This step for the AM tab uses the same methodology as the CM tab.
LCA Phase
Input Parameter Unit Value Tool Guidance
Dis
po
sal (
End
of
Life
)
PRIMARY disposal method for material # 1
Select DISPM1,Pmode
Please select primary disposal method option for material # 1 – Landfill, Combustion or incineration, Composting, Open-loop recycling, Closed-loop recycling, or Other (Re-engineering/Reuse). In open-loop recycling, products are recycled into new products that are eventually disposed of. In closed-loop recycling, products are recycled again and again into the same product.
Fraction of material # 1 disposed through the selected PRIMARY disposal method
% of final part mass
DISPM1,%, Pmode A fraction of material # 1 disposed using user selected primary disposal method
Disposal energy use per unit mass (PRIMARY Disposal Method) - material # 1 (applicable only if open or closed-loop recycling selected - calculated)
Btu/lb (EEsM,1 - EEpM,1)
This is the difference between secondary (recycled) and primary (virgin) material embodied energies. Negative Btu/lb means that the manufacturing process using the recycled material shows lower burdens. Any additional material recycled is also credited to the product to reflect the good end-of-life performance of product under consideration. For simplicity, the amount of energy needed for deconstruction, sorting, processing, and shipping is not considered.
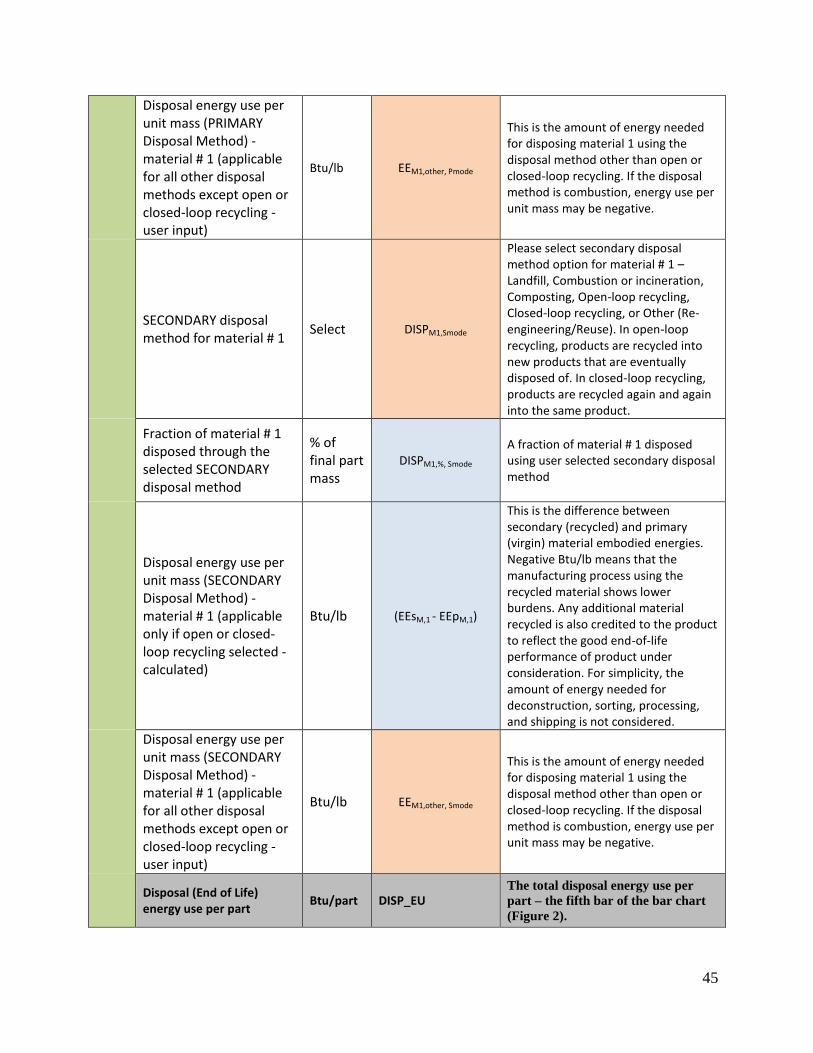
45
Disposal energy use per unit mass (PRIMARY Disposal Method) - material # 1 (applicable for all other disposal methods except open or closed-loop recycling - user input)
Btu/lb EEM1,other, Pmode
This is the amount of energy needed for disposing material 1 using the disposal method other than open or closed-loop recycling. If the disposal method is combustion, energy use per unit mass may be negative.
SECONDARY disposal method for material # 1
Select DISPM1,Smode
Please select secondary disposal method option for material # 1 – Landfill, Combustion or incineration, Composting, Open-loop recycling, Closed-loop recycling, or Other (Re-engineering/Reuse). In open-loop recycling, products are recycled into new products that are eventually disposed of. In closed-loop recycling, products are recycled again and again into the same product.
Fraction of material # 1 disposed through the selected SECONDARY disposal method
% of final part mass
DISPM1,%, Smode A fraction of material # 1 disposed using user selected secondary disposal method
Disposal energy use per unit mass (SECONDARY Disposal Method) - material # 1 (applicable only if open or closed-loop recycling selected - calculated)
Btu/lb (EEsM,1 - EEpM,1)
This is the difference between secondary (recycled) and primary (virgin) material embodied energies. Negative Btu/lb means that the manufacturing process using the recycled material shows lower burdens. Any additional material recycled is also credited to the product to reflect the good end-of-life performance of product under consideration. For simplicity, the amount of energy needed for deconstruction, sorting, processing, and shipping is not considered.
Disposal energy use per unit mass (SECONDARY Disposal Method) - material # 1 (applicable for all other disposal methods except open or closed-loop recycling - user input)
Btu/lb EEM1,other, Smode
This is the amount of energy needed for disposing material 1 using the disposal method other than open or closed-loop recycling. If the disposal method is combustion, energy use per unit mass may be negative.
Disposal (End of Life) energy use per part
Btu/part DISP_EU The total disposal energy use per
part – the fifth bar of the bar chart
(Figure 2).

46
Equations:
Disposal energy use per part:
If only one material:
For open or closed-loop Recycling:
DISP_EU = Mfinal,AM * M1,%*( DISPM1,%,Pmode *(EEsM,1 - EEpM,1))+ Mfinal,AM * M1,%*(
DISPM1,%,Smode *(EEsM,1 - EEpM,1))
For Other Disposal Methods:
DISP_EU = Mfinal,AM * M1,%* DISPM1,%,Pmode *EEM1,other+ Mfinal,AM * M1,%* DISPM1,%,Smode
*EEM1,other
If two raw materials:
For open or closed-loop Recycling:
DISP_EU = Mfinal,AM * M1,%*( DISPM1,%,Pmode *(EEsM,1 - EEpM,1))+ Mfinal,AM * M1,%*(
DISPM1,%,Smode *(EEsM,1 - EEpM,1))+ Mfinal,AM * M2,%*( DISPM2,%,Pmode *(EEsM,2 - EEpM,2))+
Mfinal,AM * M2,%*( DISPM2,%,Smode *(EEsM,2 - EEpM,2))
For Other Disposal Methods:
DISP_EU = Mfinal,AM * M1,%* DISPM1,%,Pmode *EEM1,other+ Mfinal,AM * M1,%* DISPM1,%,Smode
*EEM1,other + Mfinal,AM * M2,%* DISPM2,%,Pmode *EEM2,other+ Mfinal,AM * M2,%* DISPM2,%,Smode
*EEM2,other

47
Results The design of Results tabs (1) and (2) are similar. As mentioned in the Intro tab section,
depending upon the scenario chosen by the user for analysis, the results are shown in either
Results tab (1) or Results tab (2). In this section, we are explaining the design for Results tab (1).
Similar tables and charts are provided in Results tab (2).
Energy Use per Part:
Table 3 summarizes the energy use at each phase as calculated in the AM and CM tabs and
provides the total energy use per part on a life cycle basis.
Table 3: Results Table - Energy Use per Part
Life Cycle Phases Unit Conventional
Manufacturing Additive
Manufacturing
Material Energy Btu/part 23,445 11,372
Manufacturing Energy Btu/part 2,491 15,913
Freight and Distribution Energy
Btu/part 425 416
Use Phase Energy Btu/part 12,742,943 6,237,335
Disposal (End of Life) Energy Use*
Btu/part 1,408 1,166
Total Energy Use per Part
Btu/part 12,770,713 6,266,203

48
Figure 8: Results Graph - Energy Use per Part
Figure 8 shows the graphical representation of Table 3 results on a logarithmic scale as presented
in the Results tab.
* Negative energy use per part in disposal phase means that the manufacturing process using the recycled material
shows lower burdens. Any additional material recycled is also credited to the product to reflect the good end-of-life
performance of product under consideration.
Energy and Energy Cost Savings per Part:
Table 4: Energy Prices by Life Cycle Phase
Table 4 allows the user to enter the cost of energy for each step of the life cycle analysis in order
for an estimate of the cost of energy at each stage and in total to be calculated in Table 5.
Default values are provided in $/MMBtu but are user entered values for maximum flexibility and
to account for variation in energy costs.
Provide Unit Energy Prices by each life cycle phase
Input Parameter Unit Value Tool Guidance
Raw material related unit energy price
$/MMBtu $5 Typically, material manufacturing industry uses coal, coke, electricity, natural gas, and fuel oils.
Manufacturing related unit energy price
$/MMBtu $5 Typically manufacturing industry uses natural gas, electricity, coal and fuel oils.
Freight and Distribution related unit energy price
$/MMBtu $9 Typically transportation industry uses gasoline or diesel as their primary fuels.
Use phase related unit energy price
$/MMBtu $15 If the use phase is aerospace industry - jet fuel, passenger vehicle, trucks, trains - gasoline or diesel.
Disposal (End of Life) related unit energy price
$/MMBtu $4
It's a combination of gasoline (for transportation), electricity (for sorting and processing), natural gas (for incineration), etc.
1
10
100
1,000
10,000
100,000
1,000,000
10,000,000
100,000,000
Material Energy ManufacturingEnergy
Freight andDistribution
Energy
Use PhaseEnergy
Disposal (End ofLife) Energy
Use*
Conventional Manufacturing
Additive Manufacturing
Ener
gy U
se p
er P
art
(Btu
per
Par
t)
Logarithmic Scale
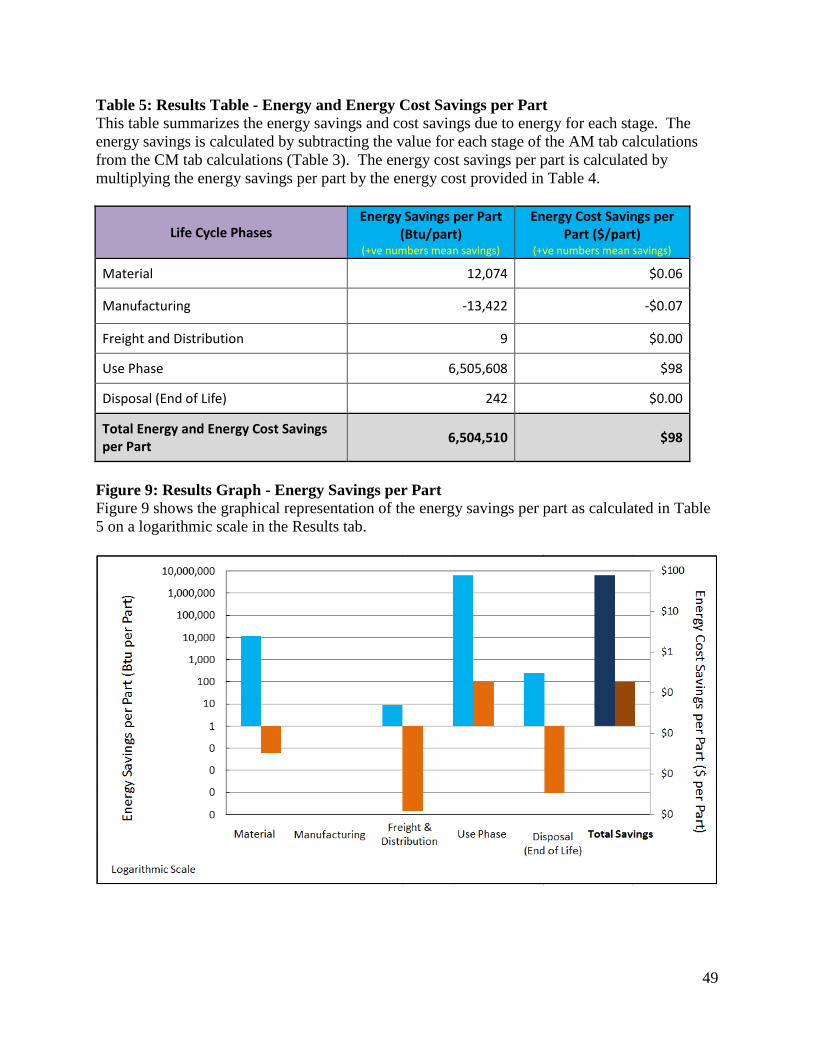
49
Table 5: Results Table - Energy and Energy Cost Savings per Part
This table summarizes the energy savings and cost savings due to energy for each stage. The
energy savings is calculated by subtracting the value for each stage of the AM tab calculations
from the CM tab calculations (Table 3). The energy cost savings per part is calculated by
multiplying the energy savings per part by the energy cost provided in Table 4.
Life Cycle Phases Energy Savings per Part
(Btu/part) (+ve numbers mean savings)
Energy Cost Savings per Part ($/part)
(+ve numbers mean savings)
Material 12,074 $0.06
Manufacturing -13,422 -$0.07
Freight and Distribution 9 $0.00
Use Phase 6,505,608 $98
Disposal (End of Life) 242 $0.00
Total Energy and Energy Cost Savings per Part
6,504,510 $98
Figure 9: Results Graph - Energy Savings per Part
Figure 9 shows the graphical representation of the energy savings per part as calculated in Table
5 on a logarithmic scale in the Results tab.

50
Summary of Key Inputs and Assumptions:
The results section also includes a summary table of the key inputs and assumptions (see Figure
10) used in the life-cycle analysis. This table helps users in clearly presenting their
inputs/assumptions along with output tables and charts to support the outcomes of their analysis.
Figure 10: A summary of key inputs and assumption
AM Tool’s Capabilities/Constraints:
DOE/ORNL organized a project review meeting to review the Additive Manufacturing life cycle
energy impacts analysis work which was held at ORNL on February 5 and 6, 2015. The intent
was to bring-in outside and internal researchers including ORNL AM experts, to review the AM
LCA tool and essentially have a project review meeting on the needs and utility of such
methodology, and examine the current state-of-the-art and the anticipated advancements in AM,
data needs and availability, standards, etc. As an outcome of this project review meeting, the
following next steps for the AM LCA tool and future improvement opportunities were identified:
The current database of AM LCA tool has the limited energy intensity data for
additive manufacturing processes
The literature review indicates that there are significant inconsistencies in the energy
intensity data for additive manufacturing processes. Compared to the traditional
manufacturing processes (machining, casting, forging, etc.), process energy intensity data
for relatively new additive manufacturing processes is very limited. Detailed data about
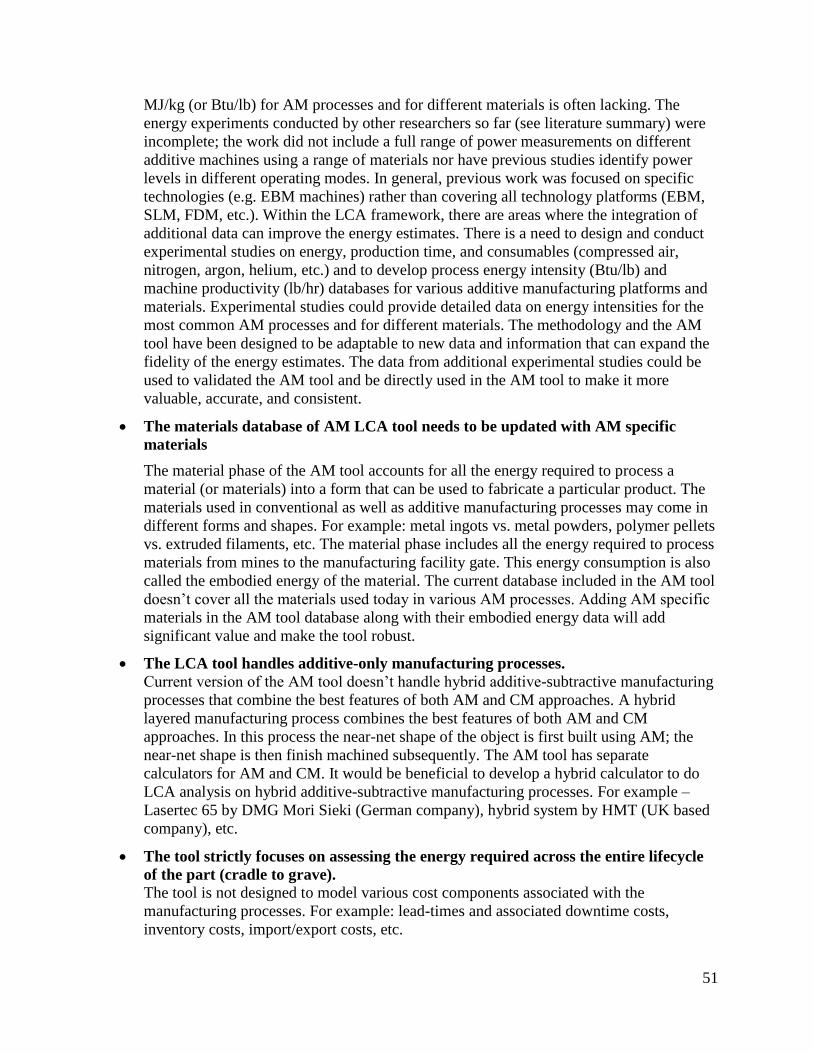
51
MJ/kg (or Btu/lb) for AM processes and for different materials is often lacking. The
energy experiments conducted by other researchers so far (see literature summary) were
incomplete; the work did not include a full range of power measurements on different
additive machines using a range of materials nor have previous studies identify power
levels in different operating modes. In general, previous work was focused on specific
technologies (e.g. EBM machines) rather than covering all technology platforms (EBM,
SLM, FDM, etc.). Within the LCA framework, there are areas where the integration of
additional data can improve the energy estimates. There is a need to design and conduct
experimental studies on energy, production time, and consumables (compressed air,
nitrogen, argon, helium, etc.) and to develop process energy intensity (Btu/lb) and
machine productivity (lb/hr) databases for various additive manufacturing platforms and
materials. Experimental studies could provide detailed data on energy intensities for the
most common AM processes and for different materials. The methodology and the AM
tool have been designed to be adaptable to new data and information that can expand the
fidelity of the energy estimates. The data from additional experimental studies could be
used to validated the AM tool and be directly used in the AM tool to make it more
valuable, accurate, and consistent.
The materials database of AM LCA tool needs to be updated with AM specific
materials
The material phase of the AM tool accounts for all the energy required to process a
material (or materials) into a form that can be used to fabricate a particular product. The
materials used in conventional as well as additive manufacturing processes may come in
different forms and shapes. For example: metal ingots vs. metal powders, polymer pellets
vs. extruded filaments, etc. The material phase includes all the energy required to process
materials from mines to the manufacturing facility gate. This energy consumption is also
called the embodied energy of the material. The current database included in the AM tool
doesn’t cover all the materials used today in various AM processes. Adding AM specific
materials in the AM tool database along with their embodied energy data will add
significant value and make the tool robust.
The LCA tool handles additive-only manufacturing processes.
Current version of the AM tool doesn’t handle hybrid additive-subtractive manufacturing
processes that combine the best features of both AM and CM approaches. A hybrid
layered manufacturing process combines the best features of both AM and CM
approaches. In this process the near-net shape of the object is first built using AM; the
near-net shape is then finish machined subsequently. The AM tool has separate
calculators for AM and CM. It would be beneficial to develop a hybrid calculator to do
LCA analysis on hybrid additive-subtractive manufacturing processes. For example –
Lasertec 65 by DMG Mori Sieki (German company), hybrid system by HMT (UK based
company), etc.
The tool strictly focuses on assessing the energy required across the entire lifecycle
of the part (cradle to grave).
The tool is not designed to model various cost components associated with the
manufacturing processes. For example: lead-times and associated downtime costs,
inventory costs, import/export costs, etc.

52
The tool assesses the energy required to fabricate the end-use part.
The tool doesn’t specifically assess the energy required to build support
structures/anchors. Also ignores post-processing of support structures. Parts made with
the material extrusion, material jetting, vat photo-polymerization, and metal powder bed
fusion processes use supports, which need to be removed after the build. Metal AM parts
are often heat treated to remove internal stresses prior to the removal of support
structures.
The LCA tool focuses and is tested on commonly used AM processes – powder bed
fusion, material extrusion, and directed energy deposition. The tool is not currently designed for or tested on parts produced by material jetting,
binder jetting, sheet lamination, and vat photo-polymerization AM processes.
The tool currently contains a limited number of conventional manufacturing
processes that may be compared to the additive manufacturing process part. The tool can be limited on the number of conventional processes built into the tool input
fields without modification. Also, energy intensity data provided in the tool may not
cover all post-processing techniques including Heat treating, vibration grinding, micro-
machining process, electro-chemical machining, spray coating, metal coating, etc.
The tool can be used to compare an additively manufactured and a conventionally
manufactured part. However, the LCA tool may be limited when comparing an additive
part that has consolidated hundreds of conventional parts due to part accuracy of energy
consumption for consolidation operation or assembly process(es).
There are two different classes of contributions for use phase analysis: products
used in the transportation sector or non-transportation sector (or stationary) use.
The use phase of tool is extensively tested with multiple transport related products (for
example - parts used on the aircrafts, components mounted on vehicles, etc.). The use
phase needs to be tested for stationary applications too. Some products are normally static
or stationary but require energy to perform their function. The parts manufactured by AM
processes may help us to increase thermal efficiency if the product is a thermal or
thermo-mechanical system, or reduce electrical losses if the product is an
electromechanical system. It would be beneficial to test the tool with multiple stationary
applications.

53
CHAPTER 4 – CASE STUDIES
This chapter provides an overview of four specific case studies that demonstrate the application
of the AM Energy Impacts Assessment Tool. The first page for each case study provides a
process flow diagram and energy savings table. The second page provides a summary of user
inputs and assumptions used in the energy use per part analysis.
The four case studies included in this report are:
1. Aerospace Bracket – Electron Beam Machining (EBM) Vs. Conventional Machining
2. Topologically Optimized Aerospace Bracket - EBM vs. Conventional Machining
3. Aircraft Ventilation Assembly – Fused Deposition Modelling (FDM) vs. Injection
Molding (IM), and
4. Hat Section Mold/Tool – FDM vs. Conventional Machining
The first two life cycle energy case studies for aircraft brackets compare 1) the same metal part
made through additive manufacturing to the part made through the conventional process; and 2)
an optimized metal part designed for additive manufacturing to the part designed and produced
through the conventional process. The third case study covers the Aircraft Ventilation Nozzle
manufactured by the FDM process. It compares the aircraft ventilation nozzle produced by FDM
process with the traditional Injection Molding (IM) process. The fourth case study is based on a
Hat Section Mold manufactured by the FDM process. This case study compared Hat Section
Mold manufactured by the FDM process with the traditional machining process.

54
Case Study 1: Aerospace Bracket - EBM vs. Conventional Machining
Overview: The part shown in Figure 11 is a bracket used in aircrafts to affix cabin structures (kitchens,
lavatories, galleys, etc.). As previously discussed, some parts have an energy footprint for many
years after they leave the factory. This is particularly relevant for the aerospace components
which have long service life and where mass reductions can lead to both energy and cost savings.
We have therefore selected a recognizable aerospace bracket as the basis of our first case study.
The bracket under consideration is manufactured by conventional milling and machining
processes with a buy-to-fly ratio of 33:1. The same bracket (same geometry) can be produced by
Electron Beam Melting (EBM) process with a significantly lower buy-to-fly ratio (1.5:1). Figure
11 and Table 6 compare the lifecycle energy consumption of a conventional production system
with that of an electron beam melting powder bed fusion AM process for a titanium aircraft
cabin bracket. The energy savings are primarily the result of significantly reduced buy-to-fly
ratio enabled by additive process.
Table 6: Energy Savings Table (Case study 1)
Life Cycle Phases Unit Conventional
Manufacturing*
Additive
Manufacturing
Energy Savings
per Part
Material Energy Btu/part 78,383 8,794 69,590
Manufacturing Energy Btu/part 3,195 2,308 886
Freight and Distribution
Energy** Btu/part 455 455 0
Final weight 0.027 lb
Atomization
(6,363 Btu/lb)
Primary Processing (1,720 Btu/lb)
Electron Beam Melting (EBM)
Finished Part
Finished Part Machined Product
Powder
Ingot (263,328 Btu/lbm embodied energy)
Mill Product (slab, billet,
etc.)
Conventional Machining - Buy-to-Fly Ratio 33:1
(0.044 lb)
Final
Processing (0.027 lb)
Secondary
Processing (0.89 lb)
Additive Manufacturing - Buy-to-Fly Ratio 1.5:1
Final
Processing
(0.027 lb)
Figure 11: Process Flow Diagram (Case study 1)

55
Use Phase Energy Btu/part 1,120,311 1,120,311 0
Disposal (End of Life)
Energy Use Btu/part (4,880) (4,880) 0
Total Energy Use per
Part Btu/part 1,197,464 1,126,988 70,476
*The benchmark energy consumption for conventional manufacturing methods is based on using current best
practices and optimal equipment and methodologies for conventional manufacturing. Comparing less than the best
for each technology is not really equally comparing the two technologies.
**It is assumed that the parts cannot be manufactured locally and must be shipped, thereby adding shipping charges
that could otherwise be avoided. This phase doesn’t account for the transport of the commodity product to the AM
facility. That part is included in material phase.
Assumptions (Case study # 1): Life Cycle
Phase
Parameter Conventional
Manufacturing
Additive Manufacturing
Manufacturing
Process
Process(es) Name: Forging - Primary
Machining - Finishing
Electron Beam Melting
(EBM)
Material Phase Material Name and embodied energy: Aerospace Bracket –
Titanium alloy
263,328 Btu/lb (primary)
37,403 Btu/lb (recycled)
Aerospace Bracket –
Titanium alloy powder
269,691 Btu/lb (primary)
43,766 Btu/lb (recycled)
Amount of material as a % of total
initial mass:
100% 100%
Percent of engineered scrap recovered
and recycled onsite.
80% 80%
Total material initial mass: 0.89 lb 0.044 lb
Final part mass: 0.027 lb 0.027 lb
Manufacturing
Phase
Primary manufacturing or shaping
process and embodied energy:
Metals - Rough rolling,
forging – 1,720 Btu/lb
Electron Beam Melting
(EBM) – 51,133 Btu/lb
Freight and
Distribution
Analysis level: Simple Simple
Primary mode for Freight and
distribution and embodied energy:
Long-Distance Truck
3.06 Btu/lb/mile
Long-Distance Truck
3.06 Btu/lb/mile
Average freight and distribution
distance travelled by a part by
primary mode:
3,107 miles 3,107 miles
Secondary mode for Freight and
distribution and embodied energy:
Local Truck
8.4 Btu/lb/mile
Local Truck
8.4 Btu/lb/mile
Average freight and distribution
distance travelled by a part by
secondary mode:
870 miles 870 miles
Use Phase Typical life-span of the product: 15 Years 15 Years
Use phase sector: Transportation Transportation
Fuel and mobility type (embodied
energy):
Long haul aircraft –
Kerosene
2.18 Btu/lb/mile
Long haul aircraft –
Kerosene
2.18 Btu/lb/mile
Distance travelled per day and usage
per year
4,971 miles per day and
255 days per year
4,971 miles per day and
255 days per year

56
If the use phase is in other sector: NA NA
Energy input and output: NA NA
Power rating:
Usage (hours per day and days per
year)
NA NA
Disposal (End
of Life)
Disposal method for material
(embodied energy):
Closed Loop Recycling Closed Loop Recycling
Fraction of material # 1 disposed
through the selected disposal method
80% 80%
Disposal energy use per unit mass -
material # 1 (difference between
secondary (recycled) and primary
material embodied energies.)
-225,925 Btu/lb
-225,925 Btu/lb

57
Case Study 2: Topologically Optimized Aerospace Bracket - EBM vs.
Conventional Machining
Overview: The part shown in Figure 12 is again an aerospace bracket with a different geometry/design
compared to the bracket discussed in case study 1. This bracket is typically produced by
conventional milling and machining processes with a very high buy-to-fly ratio (8:1). The same
bracket (a bracket with same functionality but with a topologically optimized geometry) can be
produced by Electron Beam Melting (EBM) process with a significantly less buy-to-fly ratio
(1.5:1). The optimized design results in a bracket that is 65% lighter, saving manufacturing
materials and resulting in use phase energy savings. Figure 12 and Table 7 compare the lifecycle
energy consumption of a conventional production system with that of an electron beam melting
powder bed fusion AM process for a titanium aircraft cabin bracket. The energy savings are
primarily due to two reasons: 1) a significantly reduced buy-to-fly ratio, and 2) light-weighing of
the final part enabled by additive process.
Table 7: Energy Savings Table (Case study 2)
Life Cycle Phases Unit Conventional
Manufacturing*
Additive
Manufacturing
Energy Savings
per Part
Material Energy Btu/part 2,021,120 263,900 1,757,221
Manufacturing Energy Btu/part 65,485 65,872 (387)
Atomization
(6,363 Btu/lb)
Primary Processing (1,720 Btu/lb)
Electron Beam Melting (EBM)
Finished Part
Finished Part Machined Product
Powder
Ingot (263,328 Btu/lb
embodied energy)
Mill Product (slab, billet,
etc.)
Conventional Machining - Buy-to-Fly Ratio 8:1
(1.26 lb)
Final
Processing (2.40 lb)
Secondary
Processing (19.22 lb)
Additive Manufacturing - Buy-to-Fly Ratio 1.5:1
Final
Processing
(0.84 lb)
0.84 lb
2.40 lb
Figure 12: Process Flow Diagram (Case study 2)

58
Freight and Distribution
Energy** Btu/part 40,462 14,161 26,301
Use Phase Energy Btu/part 99,583,158 34,854,105 64,729,052
Disposal (End of Life)
Energy Use Btu/part (433,775) (151,821) (281,954)
Total Energy Use per
Part Btu/part 101,276,449 35,046,216 66,230,233
*The benchmark energy consumption for conventional manufacturing methods is based on using current best
practices and optimal equipment and methodologies for conventional manufacturing. Comparing less than the best
for each technology is not really equally comparing the two technologies.
**It is assumed that the parts cannot be manufactured locally and must be shipped, thereby adding shipping charges
that could otherwise be avoided. This phase doesn’t account for the transport of the commodity product to the AM
facility. That part is included in material phase.
Assumptions (Case study # 2): Life Cycle
Phase
Parameter Conventional
Manufacturing
Additive
Manufacturing
Manufacturing
Process
Process Name: Forging - Primary
Machining - Finishing
Electron Beam Melting
(EBM)
Material Phase Material Name and embodied energy: Titanium alloy
263,328 Btu/lb (primary)
37,403 Btu/lb (recycled)
Titanium alloy powder
269,691 Btu/lb (primary)
43,766 Btu/lb (recycled)
Amount of material as a % of total
initial mass:
100% 100%
Percent of engineered scrap recovered
and recycled onsite
80% 80%
Total material initial mass: 19.22 lb 1.26 lb
Final part mass: 2.4 lb 0.84 lb
Manufacturing
Phase
Primary manufacturing or shaping
process and embodied energy:
Metals - Rough rolling,
forging – 1,720 Btu/lb
Electron Beam Melting
(EBM) – 51,133 Btu/lb
Freight and
Distribution
Analysis level: Simple Simple
Primary mode for Freight and
distribution and embodied energy:
Long-Distance Truck
3.06 Btu/lb/mile
Long-Distance Truck
3.06 Btu/lb/mile
Average freight and distribution
distance travelled by a part by primary
mode:
3,107 miles 3,107 miles
Secondary mode for Freight and
distribution and embodied energy:
Local Truck
8.44 Btu/lb/mile
Local Truck
8.44 Btu/lb/mile
Average freight and distribution
distance travelled by a part by
secondary mode:
870 miles 870 miles
Use Phase Typical life-span of the product: 15 Years 15 Years
Use phase sector: Transportation Transportation
Fuel and mobility type (embodied
energy):
Long haul aircraft –
Kerosene
2.18 Btu/lb/mile
Long haul aircraft –
Kerosene
2.18 Btu/lb/mile

59
Distance travelled per day and usage per
year
4,971 miles per day and
255 days per year
4,971 miles per day and
255 days per year
If the use phase is in other sector: NA NA
Energy input and output: NA NA
Power rating:
Usage (hours per day and days per year) NA NA
Disposal (End
of Life)
Disposal method for material (embodied
energy):
Closed Loop Recycling Closed Loop Recycling
Fraction of material # 1 disposed
through the selected disposal method
80% 80%
Disposal energy use per unit mass -
material # 1 (difference between
secondary (recycled) and primary
material embodied energies.)
-225,925 Btu/lb
-225,925 Btu/lb

60
Case Study 3: Aircraft Ventilation Assembly – FDM vs. IM
Overview: The part shown in Figure 13 is an aircraft cabin air ventilation nozzle, which can be recognized
by flyers over the world. The nozzle is in fact an assembly of five individual parts, which are
fitted together post manufacture. These five component parts and their relative supply chains are
used as the basis for this comparative case study. This case study looks at the product lifecycles
of identical assemblies produced by FDM and injection molding. The data for the case study 3 is
taken from the Stratasys white paper published in year 2010 [STRATASYS 2010]. Figure 13 and
Table 8 compare the lifecycle energy consumption of a conventional production system with that
of a Fused Deposition Modeling AM process for an Ultem 9085 aircraft ventilation model. The
energy savings are primarily due to the lighter weight of the final part enabled by FDM process.
Table 8: Energy Savings Table (Case study 3)
Life Cycle Phases Unit Conventional
Manufacturing*
Additive
Manufacturing
Energy Savings
per Part
Material Energy Btu/part 5,914 6,022 (109)
Manufacturing Energy Btu/part 858 7,934 (7,076)
Freight and Distribution
Energy** Btu/part 425 394 31
Use Phase Energy Btu/part 3,091,634 2,863,829 227,805
Initial Mass (0.105 lb)
Filament Extrusion (2,150 Btu/lb)
Primary Processing (8,169 Btu/lb)
Fused Deposition
Modeling (FDM) Finished Part
Finished Part
Extruded Ultem 9085
Ultem 9085 (56,320 Btu/lb)
Injection Molding
Conventional Machining - Buy-to-Fly Ratio 1.1:1
Primary Processing
(76,526 Btu/lb)
Additive Manufacturing - Buy-to-Fly Ratio 1.2:1
Final
Processing
(0.088 lb)
0.088 lb
0.095 lb
Final
Processing
(0.095 lb)
Initial Mass (0.103 lb)
Figure 13: Process Flow Diagram (Case study 3)

61
Disposal (End of Life)
Energy Use Btu/part 1,736 1,608 128
Total Energy Use per
Part Btu/part 3,100,566 2,879,787 220,779
*The benchmark energy consumption for conventional manufacturing methods is based on using current best
practices and optimal equipment and methodologies for conventional manufacturing. Comparing less than the best
for each technology is not really equally comparing the two technologies.
**It is assumed that the parts cannot be manufactured locally and must be shipped, thereby adding shipping charges
that could otherwise be avoided. This phase doesn’t account for the transport of the commodity product to the AM
facility. That part is included in material phase.
Assumptions (Case study # 3) - Reference: [STRATASYS 2010]: Life Cycle
Phase
Parameter Conventional
Manufacturing
Additive Manufacturing
Manufacturing
Process
Process Name: Injection Molding (IM) Fused Deposition Modeling
(FDM)
Material Phase Material Name and embodied
energy:
ULTEM 9085 dried pellets
– 56,320 Btu/lb
ULTEM 9085 extruded
filaments – 58,470 Btu/lb
Amount of material as a % of
total initial mass:
100% 100%
Percent of engineered scrap or
waste material recovered and
recycled onsite
0% 0%
Total material initial mass: 0.105 lb/part (Part material
+ 10% spruces.
0.103 lb/part (Part material +
17% support. For calculation,
we have assumed that the
support material has the same
embodied energy as the build
material)
Final part mass: 0.095 lb/part 0.088 lb/part (parts can be
produced with variable
density, reducing material
consumption and part weight)
Manufacturing
Phase
Primary manufacturing or
shaping process and embodied
energy:
Injection Molding
(embodied energy 8,169
Btu/lb)
Fused Deposition Modeling
(embodied energy 76,526
Btu/lb)
Freight and
Distribution
Analysis level: Intermediate Intermediate
Primary mode for Freight and
distribution and embodied
energy:
32 metric ton truck – Diesel
(0.65 Btu/lb/mile)
32 metric ton truck – Diesel
(0.65 Btu/lb/mile)
Average freight and distribution
distance travelled by a part by
primary mode:
1,189 miles (Raw material
source - Delaware,
Production location - Eden
Prairie)
1,189 miles (Raw material
source - Delaware,
Production location - Eden
Prairie)
Secondary mode for Freight and
distribution and embodied
energy:
Light goods vehicle – Diesel
(1.73 Btu/lb/mile)
Light goods vehicle – Diesel
(1.73 Btu/lb/mile)
Average freight and distribution
distance travelled by a part by
secondary mode:
2,141 miles (Assumed that
the final customer is located
at an aircraft assembly
facility in California)
2,141 miles (Assumed that
the final customer is located
at an aircraft assembly
facility in California)

62
Life Cycle
Phase
Parameter Conventional
Manufacturing
Additive Manufacturing
Use Phase* Typical life-span of the product: 30 years 30 years
Use phase sector: Transportation Transportation
Fuel and mobility type
(embodied energy):
Short haul aircraft –
kerosene
(2.18 Btu/lb.mile)
Short haul aircraft – kerosene
(2.18 Btu/lb.mile)
Distance travelled per day and
usage per year
2,485 miles per day, 200
days per year.
2,485 miles per day, 200 days
per year.
If the use phase is in other
sector:
NA NA
Energy input and output: NA NA
Power rating: NA NA
Usage (hours per day and days
per year)
NA NA
Disposal (End
of Life)
Disposal method for material
(embodied energy):
Disposal method – Landfill Disposal method – Landfill
Fraction of material # 1
disposed through the selected
disposal method:
100% (Ultem 9085 or
Polyethermide (PEI) is not a
commodity polymer and as
such it is highly unlikely
that there will be a cost
effective recycling route for
this material)
100% (Ultem 9085 or
Polyethermide (PEI) is not a
commodity polymer and as
such it is highly unlikely that
there will be a cost effective
recycling route for this
material)
Disposal energy use per unit
mass - material # 1 (applicable
for other disposal methods
except open or closed-loop
recycling - user input)
18,272 Btu/lb 18,272 Btu/lb
*As mentioned before, the data for the case study 3 is taken from the Stratasys white paper
published in year 2010 [STRATASYS 2010]. The Stratasys white paper mainly focuses on the
CO2 emissions in material, manufacturing, freight & distribution, and use phases. It doesn’t
calculate CO2 emissions per part in the disposal phase. The outcomes from the AM tool closely
match with the results provided in the Stratasys white paper except the use phase. The use phase
energy use per part (Btu/part) results are significantly different because of the following two
reasons:
1. The energy intensity number for the short haul aircrafts in the Stratasys white paper is
14.1 Btu/lb.mile and in the AM Tool 2.18 Btu/lb.mile.
2. The total distance travelled by the short haul aircraft during its lifetime in the Stratasys
white paper is 73 million kilometers and 24 million kilometers in the AM tool.

63
Case Study 4: Hat Section Mold/Tool – FDM vs. Conventional Machining
Overview: The part shown in Figure 14 is a hat section mold/tool. In last few years, FDM process has
demonstrated to provide a variety of pattern, mold, and tooling options that can significantly
reduce cycle times and cost. The ability to rapidly process Computer Aided Drafting (CAD) files
is an effective means to optimize the mold design, cycle times, and cost of the desired
molds/tooling. The case study 4 confirms that FDM tooling is not only functional but also
demonstrates a number of programmatic and ergonomic advantages. Because FDM tooling is
lighter than traditional tooling methods (forging or casting with heavy machining), the need for
fork trucks, hoists, and dollies are reduced. The lightweight molds also reduce energy
consumption in the freight and distribution phase. Figure 14 and Table 9 compare the lifecycle
energy consumption of a conventional production system for a stainless steel hat section mold
with that of a Fused Deposition Modeling AM process for an Ultem 9085 hat section mold. The
energy savings are primarily due to the light-weighing of the final part and the reduction in initial
raw material needed to produce the hat section mold.
Table 9: Energy Savings Table (Case study 4)
Life Cycle Phases Unit Conventional
Manufacturing*
Additive
Manufacturing
Energy Savings
per Part
Material Energy Btu/part 850,345 288,450 561,895
Manufacturing Energy Btu/part 137,132 378,905 (241,774)
Ultem 9085
(56,320 Btu/lb)
Filament Extrusion
2,150 Btu/lb (Initial Mass 3.7 lb)
Primary Processing 4,299 Btu/lb
(Initial Mass 27.8 lb)
Fused Deposition
Modeling (FDM)
Finished Part Polymer mold
Finished Part Steel Mold
Heavy Machining (Milling)
Extruded Ultem 9085
Filament
Stainless Steel (23,646 Btu/lb)
Metal Casting or Forging
Conventional Machining - Buy-to-Fly Ratio 1.3:1
Primary Processing
(76,526 Btu/lb)
Final
Processing (12,898 Btu/lb)
Secondary
Processing (709 Btu/lb)
Additive Manufacturing - Buy-to-Fly Ratio 1.1:1
Final
Processing
(3,439 Btu/lb)
3.4 lb
21.4 lb
Figure 14: Process Flow Diagram (Case study 4)

64
Freight and Distribution
Energy** Btu/part 296,449 36,666 259,782
Use Phase Energy Btu/part 0 0 0
Disposal (End of Life)
Energy Use Btu/part (533,620) 195 (533,815)
Total Energy Use per
Part Btu/part 750,305 704,216 46,089
*The benchmark energy consumption for conventional manufacturing methods is based on using current best
practices and optimal equipment and methodologies for conventional manufacturing. Comparing less than the best
for each technology is not really equally comparing the two technologies.
**It is assumed that the parts cannot be manufactured locally and must be shipped, thereby adding shipping charges
that could otherwise be avoided. This phase doesn’t account for the transport of the commodity product to the AM
facility. That part is included in material phase.
Assumptions (Case study # 4): Life Cycle
Phase
Parameter Conventional
Manufacturing
Additive Manufacturing
Manufacturing
Process
Process Name: Metal casting and heavy
machining (milling)
Fused Deposition
Modeling (FDM)
Material Phase Material 1 Name and embodied
energy:
Stainless Steel – 36,328
Btu/lb (Primary), 5,159
Btu/lb (Secondary)
ULTEM 9085 extruded
filaments – 58,470 Btu/lb
(Primary and Secondary)
Amount of material 1 as a % of
total initial mass:
100% 100%
Percent of engineered scrap
recovered and recycled onsite
80% 0%
Total material initial mass: 27.8 lb 3.7 lb
Final part mass: 21.4 lb 3.4 lb
Manufacturing
Phase
Primary manufacturing or shaping
process and embodied energy:
Casting (embodied energy
4,299 Btu/lb), Heavy
Machining (709 Btu/lb),
Grinding (12,898 Btu/lb).
Fused Deposition
Modeling (embodied
energy 76,526 Btu/lb),
Other finishing processes
(3,439 Btu/lb)
Accounting for Tooling and
Machine Tools:
Tungsten Carbide (171,969
Btu/lb) machine tools,
Number of tooling 3 and
average mass per tooling 1 1
lb/tool. Total number of
parts produced during
tooling lifetime 100.
NA
Freight and
Distribution
Analysis level: Simple Simple
Primary mode for Freight and
distribution and embodied energy:
Ship Long-Distance Truck
Average freight and distribution
distance travelled by a part by
primary mode:
7,456 miles (imported from
China)
2,485 miles (Domestic
travel)
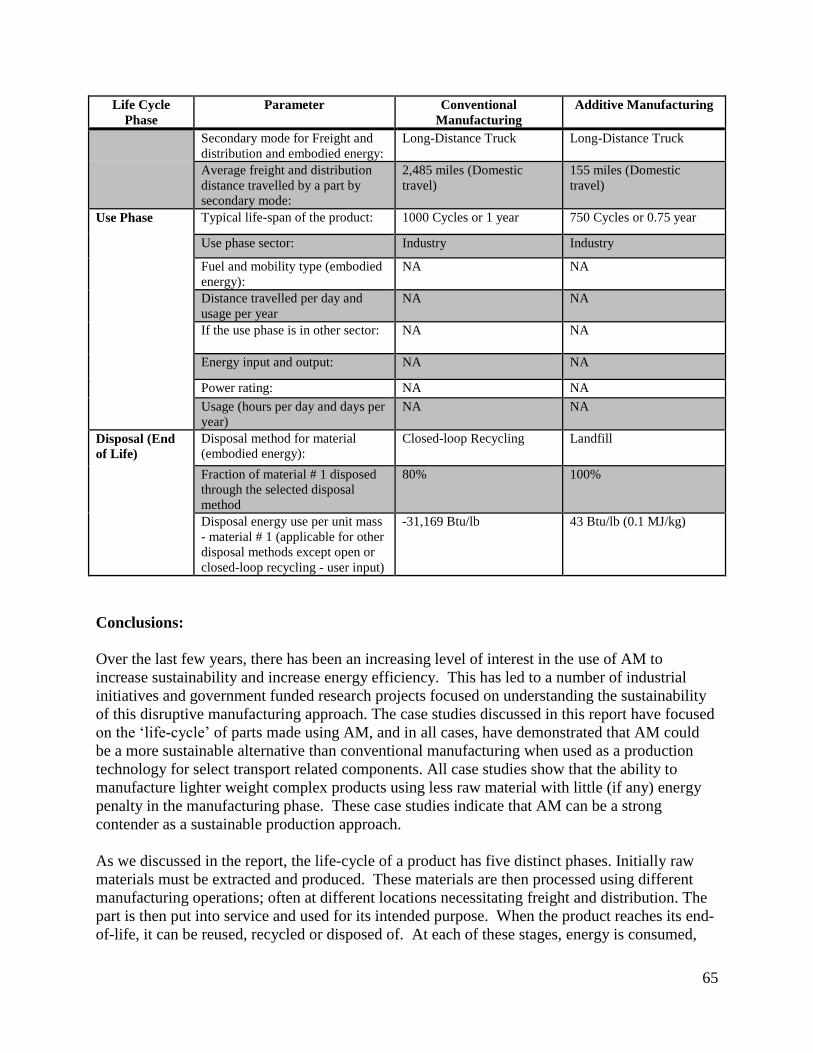
65
Life Cycle
Phase
Parameter Conventional
Manufacturing
Additive Manufacturing
Secondary mode for Freight and
distribution and embodied energy:
Long-Distance Truck Long-Distance Truck
Average freight and distribution
distance travelled by a part by
secondary mode:
2,485 miles (Domestic
travel)
155 miles (Domestic
travel)
Use Phase Typical life-span of the product: 1000 Cycles or 1 year 750 Cycles or 0.75 year
Use phase sector: Industry Industry
Fuel and mobility type (embodied
energy):
NA NA
Distance travelled per day and
usage per year
NA NA
If the use phase is in other sector: NA NA
Energy input and output: NA NA
Power rating: NA NA
Usage (hours per day and days per
year)
NA NA
Disposal (End
of Life)
Disposal method for material
(embodied energy):
Closed-loop Recycling Landfill
Fraction of material # 1 disposed
through the selected disposal
method
80% 100%
Disposal energy use per unit mass
- material # 1 (applicable for other
disposal methods except open or
closed-loop recycling - user input)
-31,169 Btu/lb 43 Btu/lb (0.1 MJ/kg)
Conclusions:
Over the last few years, there has been an increasing level of interest in the use of AM to
increase sustainability and increase energy efficiency. This has led to a number of industrial
initiatives and government funded research projects focused on understanding the sustainability
of this disruptive manufacturing approach. The case studies discussed in this report have focused
on the ‘life-cycle’ of parts made using AM, and in all cases, have demonstrated that AM could
be a more sustainable alternative than conventional manufacturing when used as a production
technology for select transport related components. All case studies show that the ability to
manufacture lighter weight complex products using less raw material with little (if any) energy
penalty in the manufacturing phase. These case studies indicate that AM can be a strong
contender as a sustainable production approach.
As we discussed in the report, the life-cycle of a product has five distinct phases. Initially raw
materials must be extracted and produced. These materials are then processed using different
manufacturing operations; often at different locations necessitating freight and distribution. The
part is then put into service and used for its intended purpose. When the product reaches its end-
of-life, it can be reused, recycled or disposed of. At each of these stages, energy is consumed,

66
for example - the electrical energy needed to run machine tools, or the energy consumed by
vehicles used within the supply chain. For many static products (e.g. parts used in industrial
plants, commercial buildings, or residential homes), the vast majority of energy use comes from
the production of the raw materials. Hence, using fewer raw materials has a significant benefit.
Additional innovations in design enabled by additive manufacturing could also lead to more
efficient energy generation (e.g. turbine blades) which could offer additional sustainability
benefits. For transport related products, such as aerospace or automotive components, the use
phase energy consumption contributes most significantly to the overall life-cycle energy use of
the part. Simply speaking, the more a part weighs, the more load it places on the engine of a car,
plane or train, and the greater the fuel consumption. Hence, if we can reduce part weight with
AM, then we can reduce the overall life-cycle energy use of the part and reduce the resulting
greenhouse gas emissions.

67
REFERENCES
AMERICAN AIRLINES 2007:
"Committed to Preserving the Wonders of Our World," American Airlines, Prepared by AMR,
2007. Available: http://www.aa.com/content/images/amrcorp/amrerr.pdf.
ATKINS 2011:
The Atkins – Rapid Manufacturing a Low Carbon Footprint, http://www.atkins-project.com
AZOM:
AZoM.com. An Original Source of AZOM data is Granta Design Limited -
www.grantadesign.com and Ceram Research Limited - www.ceram.co.uk.
BAUMERS 2011:
“Energy Inputs to Additive Manufacturing: Does Capacity Utilization Matters?” M. Baumers, C.
Tuck, R. Wildman, I. Ashcroft, R. Hague Loughborough University, August 2011.
BAUMERS 2013:
“Transparency Build-in, Energy Consumption and Cost Estimation for Additive Manufacturing,”
Martin Baumers, Chris Tuck, et.al., Journal of Industrial Ecology, Volume 17, Issue, 3, pages
418-431, June 2013.
BERGSMA 2013:
“End-of-life Best Approach for Allocating Recycling Benefits in LCAs of Metal Packaging,”
Geert Bergsma Maartje Sevenster, February 2013.
BOURHIS 2013:
“Sustainable Manufacturing: Evaluation and Modeling of Environmental Impacts in Additive
Manufacturing,” Florent Bourhis, et.al., International Journal for Advanced Manufacturing
Technologies, June 2013.
CEEAM 2012:
Components for Energy Efficiency in Transport by Additive Manufacturing (CEEAM2012),
http://www2.le.ac.uk/departments/physics/research/src/res/additive.
DAHMUS 2004:
“An Environmental Analysis of Machining,” Jeffrey B. Dahmus and Timothy G. Gutowski, 2004
ASME International Mechanical Engineering Congress and RD&D Expo, November 13-19,
2004, Anaheim, California USA.
DOE AMO:
U.S. Department of Energy’s Advanced Manufacturing Office,
http://www1.eere.energy.gov/manufacturing
FACANHA & HORVATH 2007:
68
"Evaluation of life-cycle air emission factors of freight transportation," Facanha, C., and
Horvath, A., Environmental Science & Technology, 41(20), Pp 7138-7144, 2007.
GEYER 2012:
“User Guide for Version 3 of the WorldAutoSteel Energy and GHG Model,” Roland Geyer,
University of California at Santa Barbara, CA, On Behalf of WorldAutoSteel – World Steel
Association January 6, 2012.
GHENAI 2012:
“Sustainable Engineering and Eco Design,” Chaouki Ghenai, Chapter in book: Sustainable
Development - Energy, Engineering and Technologies - Manufacturing and Environment, 2012.
HAMMOND & JONES 2011:
“Inventory of Carbon & Energy (ICE),” Geoff Hammond and Craig Jones, Sustainable Energy
Research Team (SERT), University of Bath, UK, 2011.
http://web.mit.edu/2.813/www/readings/ICEv2.pdf.old
HELMS & LAMBRECHT 2006:
"The potential contribution of light-weighting to reduce transport energy consumption," Helms,
H., and U. Lambrecht, The International Journal of Life Cycle Assessment, 2006.
IJAMT 2013:
“Sustainable Manufacturing: Evaluation and Modeling of Environmental Impacts in Additive
Manufacturing,” Florent Bourhis, et.al., International Journal for Advanced Manufacturing
Technologies, June 2013.
KEOUGH 2011:
“Austempered Ductile Iron (ADI) – A Green Alternative,” J. R. Keough, the American Foundry
Society, Schaumburg, Illinois, USA (www.afsinc.org), 2011.
LUFTHANSA 2011:
"Fuel efficiency at the Lufthansa Group - Cutting costs and protecting the environment,"
Lufthansa Group, 2011. Available: http://www.lufthansagroup.com/fileadmin/downloads/en/LH-
fuel-efficiency-0612.pdf.
M. ASHBY:
Material and the Environment - Eco-Informed Material Choice, Second Edition, Michael F.
Ashby.
MIT 2004:
“An Environmental Analysis of Machining,” Jeffrey Dahmus and Timothy Gutowski,
Massachusetts Institute of Technology 2004 ASME International Mechanical Engineering
Congress and RD&D Expo November 13-19, 2004, Anaheim, California USA.
OECD 1997:

69
“The Environmental Effects of Freight”, Table 9, Truck Air Pollution Emission Factors, in
grams/tonne-km. Available at http://www.oecd.org/trade/envtrade/2386636.pdf
PENN STATE:
Polymer Properties:
http://engr.bd.psu.edu/rxm61/METBD470/Lectures/PolymerProperties%20from%20CES.pdf
SAVING 2009:
The SAVING project (Sustainable product development via design optimization and AdditiVe
manufacturING), http://www.manufacturingthefuture.co.uk.
STRATASYS 2010:
“The Sustainability of Fused Deposition Modeling - Establishing the Green Credentials,”
Stratasys White Paper, 2010.
STROGEN & HORVATH 2013:
“Greenhouse Gas Emissions from the Construction, Manufacturing, Operation and Maintenance
of US Distribution Infrastructure for Petroleum and Biofuels,” Bret Strogen and Arpad Horvath,
Journal of Infrastructure Systems, Volume 19, Issue 4, Pp 371-383, December 2013.
STODOLSKY & VYAS 1995:
“Life-Cycle Energy Savings Potential from Aluminum-Intensive Vehicles,” F. Stodolsky, A.
Vyas, R. Cuenca, and L. Gaines, Transportation Technology R&D Center, Argonne National
Laboratory, 1995. http://www.transportation.anl.gov/pdfs/TA/106.pdf
UT AUSTIN 2010:
“Assessing Energy Requirements and Material Flows of Selective Laser Sintering of Nylon
Parts,” Telenko, C. and Seepersad, C., Solid Freeform Fabrication Proceedings; Pp 289-297,
2010.
VICTORIA:
Embodied Energy Coefficients - Victoria University of Wellington, New Zealand.
http://www.victoria.ac.nz/architecture/centres/cbpr/resources/pdfs/ee-coefficients.pdf
VIGON 1992:
Life-Cycle Assessment – Inventory Guidelines and Principles, B. W. Vigon, et.al., November
1992.

70
APPENDIX
This appendix contains different values for embodied energies in Life Cycle phases including
raw material, process, use, freight and distribution, and recycle. This data represents the most
updated values that were obtained from various credible sources. It should be mentioned that this
data will be continuously updated as more information becomes available. The data used in this
calculator is included in the following six appendices:
Appendix 1: Raw Material Embodied Energy (Btu/lb) Appendix 2: Cutting Tools Material Embodied Energy (Btu/lb)
Appendix 3a and 3b: Primary Shaping Processes Embodied Energy (Btu/lb)
Appendix 4a and 4b: Additive Manufacturing Processes Embodied Energy (Btu/lb)
Appendix 5: Transportation Mode Embodied Energy (Btu/lb.mile)
Appendix 6: Other Transportation Modes Embodied Energy (Btu/lb.mile)
Appendix 7: Use Phase Energy Consumption (Btu/lb.mile)
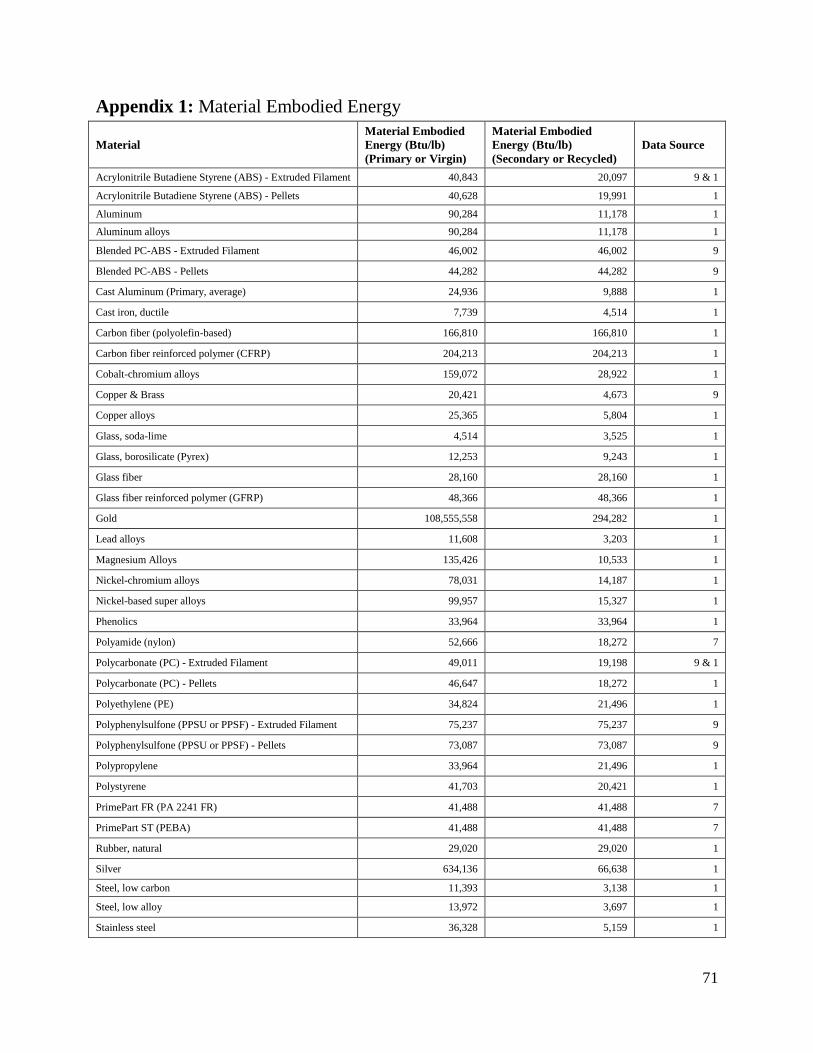
71
Appendix 1: Material Embodied Energy
Material
Material Embodied
Energy (Btu/lb)
(Primary or Virgin)
Material Embodied
Energy (Btu/lb)
(Secondary or Recycled)
Data Source
Acrylonitrile Butadiene Styrene (ABS) - Extruded Filament 40,843 20,097 9 & 1
Acrylonitrile Butadiene Styrene (ABS) - Pellets 40,628 19,991 1
Aluminum 90,284 11,178 1
Aluminum alloys 90,284 11,178 1
Blended PC-ABS - Extruded Filament 46,002 46,002 9
Blended PC-ABS - Pellets 44,282 44,282 9
Cast Aluminum (Primary, average) 24,936 9,888 1
Cast iron, ductile 7,739 4,514 1
Carbon fiber (polyolefin-based) 166,810 166,810 1
Carbon fiber reinforced polymer (CFRP) 204,213 204,213 1
Cobalt-chromium alloys 159,072 28,922 1
Copper & Brass 20,421 4,673 9
Copper alloys 25,365 5,804 1
Glass, soda-lime 4,514 3,525 1
Glass, borosilicate (Pyrex) 12,253 9,243 1
Glass fiber 28,160 28,160 1
Glass fiber reinforced polymer (GFRP) 48,366 48,366 1
Gold 108,555,558 294,282 1
Lead alloys 11,608 3,203 1
Magnesium Alloys 135,426 10,533 1
Nickel-chromium alloys 78,031 14,187 1
Nickel-based super alloys 99,957 15,327 1
Phenolics 33,964 33,964 1
Polyamide (nylon) 52,666 18,272 7
Polycarbonate (PC) - Extruded Filament 49,011 19,198 9 & 1
Polycarbonate (PC) - Pellets 46,647 18,272 1
Polyethylene (PE) 34,824 21,496 1
Polyphenylsulfone (PPSU or PPSF) - Extruded Filament 75,237 75,237 9
Polyphenylsulfone (PPSU or PPSF) - Pellets 73,087 73,087 9
Polypropylene 33,964 21,496 1
Polystyrene 41,703 20,421 1
PrimePart FR (PA 2241 FR) 41,488 41,488 7
PrimePart ST (PEBA) 41,488 41,488 7
Rubber, natural 29,020 29,020 1
Silver 634,136 66,638 1
Steel, low carbon 11,393 3,138 1
Steel, low alloy 13,972 3,697 1
Stainless steel 36,328 5,159 1

72
Titanium alloy (Ti-6Al-4V) 263,328 37,403 1
Titanium alloy powder (Ti-6Al-4V) 269,691 43,766
Ti alloy +
atomization (14.8
MJ/kg)
ULTEM 9085 - Extruded Filament 58,470 58,470 9
ULTEM 9085 - Pellets 56,320 56,320 9
Zinc 21,926 4,020 2
Zinc die-casting alloys 25,795 4,729 1
Sources (Appendix 1) - see the reference section for more details.
1. [M. ASHBY]
2. [VICTORIA]
3. [KEOUGH 2011]
4. [ATKINS 2011]
5. [HAMMOND & JONES 2011]
6. [GHENAI 2012]
7. [PENN STATE]
8. [STODOLSKY & VYAS 1995]
9. [STRATASYS 2010]
Appendix 2: Cutting Tool Materials Embodied Energy
Raw Material
Raw Material
Embodied Energy
(MJ/kg)
(Primary or
Virgin)
Raw Material
Embodied
Energy (Btu/lb)
(Primary or
Virgin)
Source
Carbon tool steels 32.5 13,972 3
High speed steel (HSS) 84.5 36,328 3
Cast cobalt alloys 188 80,611 2
Cemented carbide 1,000 429,923 2
Ceramics (alumina, silicon nitride, silicon carbide) 1,000 429,923 2
Cubic Boron Nitride (CBN) 250 107,481 2
Tungsten Carbide (WC) 400 171,969 1
Sources (Appendix 2) - see the reference section for more details.
1. [DAHMUS 2004]
2. [AZOM]
3. [M. ASHBY]

73
Appendix 3a: Primary Shaping Processes Energy
Primary shaping processes Average Energy
Intensity (MJ/kg)
Average Energy
Intensity (Btu/lb) Data Source
Metals – Casting 10 4,299
[M. ASHBY]
Metals - Rough rolling, forging 15.9 6,838
Metals - Extrusion, foil rolling 15 6,449
Metals - Wire drawing 30 12,898
Metals - Metal powder forming 25 10,748
Metals - Vapor phase methods 50 21,496
Polymers – Extrusion 4.25 1,827
Polymers – Molding 19 8,169
Ceramic powder form 25 10,748
Glass molding 3 1,290
Hybrids - Compression molding 13.5 5,804
Hybrids - Spray/Lay up 16 6,879
Hybrids - Filament winding 3.35 1,440
Hybrids - Autoclave molding 200 85,985
Other Primary Process User Input User Input
Appendix 3b: Secondary Shaping Processes Embodied Energy
Secondary Processes Average Energy
Intensity (MJ/kg)
Average Energy
Intensity (Btu/lb) Data Source
Machining – Heavy 108.9 46,819
[M. ASHBY]
Machining - Finishing (light) 8 3,439
Machining – Grinding 30 12,898
Machining - Water jet, EDM, Laser 2750 1,182,288
Joining - Gas welding 1.9 817
Joining - Electric welding 2.6 1,118
Joining - Fasteners, small 0.03 13
Joining - Fasteners, large 0.075 32
Joining - Adhesives, cold 10.5 4,514
Joining - Adhesives, heat-curing 29 12,468
Painting – Painting 55 23,646
Painting - Baked coatings 65 27,945
Painting - Powder coating 76.5 32,889
Electroplating 90 38,693
Other Secondary Process 8 3,439
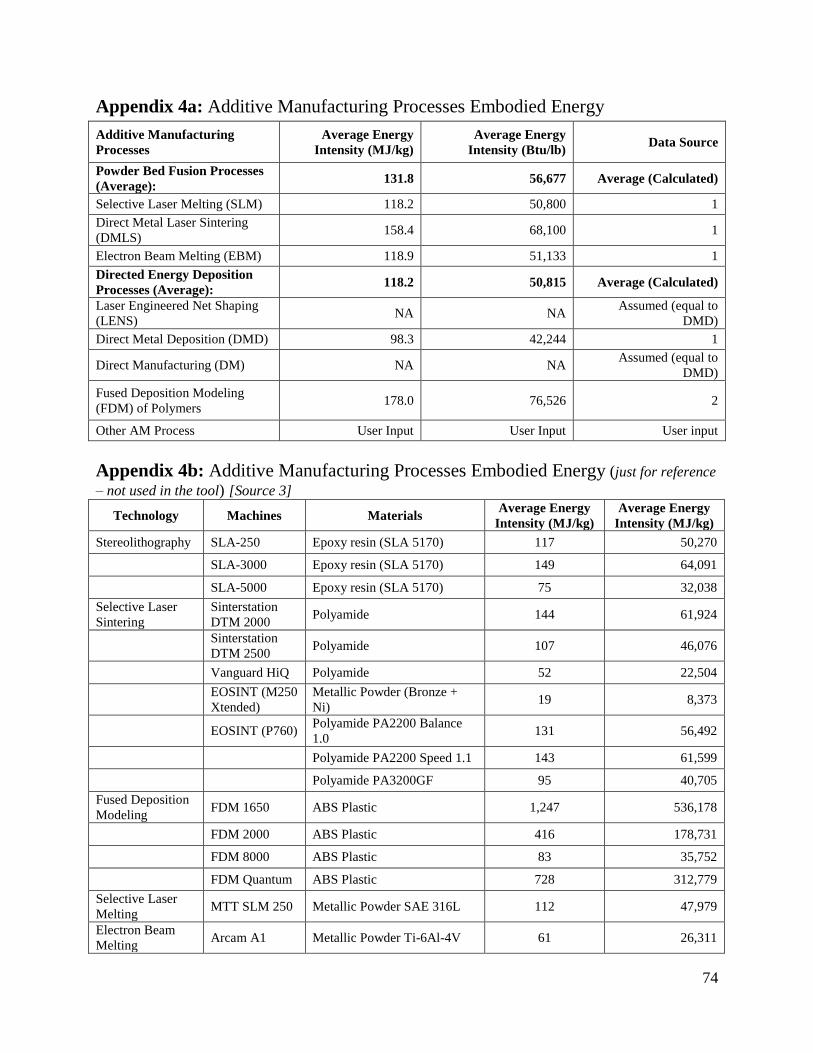
74
Appendix 4a: Additive Manufacturing Processes Embodied Energy
Additive Manufacturing
Processes
Average Energy
Intensity (MJ/kg)
Average Energy
Intensity (Btu/lb) Data Source
Powder Bed Fusion Processes
(Average): 131.8 56,677 Average (Calculated)
Selective Laser Melting (SLM) 118.2 50,800 1
Direct Metal Laser Sintering
(DMLS) 158.4 68,100 1
Electron Beam Melting (EBM) 118.9 51,133 1
Directed Energy Deposition
Processes (Average): 118.2 50,815 Average (Calculated)
Laser Engineered Net Shaping
(LENS) NA NA
Assumed (equal to
DMD)
Direct Metal Deposition (DMD) 98.3 42,244 1
Direct Manufacturing (DM) NA NA Assumed (equal to
DMD)
Fused Deposition Modeling
(FDM) of Polymers 178.0 76,526 2
Other AM Process User Input User Input User input
Appendix 4b: Additive Manufacturing Processes Embodied Energy (just for reference
– not used in the tool) [Source 3]
Technology Machines Materials Average Energy
Intensity (MJ/kg)
Average Energy
Intensity (MJ/kg)
Stereolithography SLA-250 Epoxy resin (SLA 5170) 117 50,270
SLA-3000 Epoxy resin (SLA 5170) 149 64,091
SLA-5000 Epoxy resin (SLA 5170) 75 32,038
Selective Laser
Sintering
Sinterstation
DTM 2000 Polyamide 144 61,924
Sinterstation
DTM 2500 Polyamide 107 46,076
Vanguard HiQ Polyamide 52 22,504
EOSINT (M250
Xtended)
Metallic Powder (Bronze +
Ni) 19 8,373
EOSINT (P760) Polyamide PA2200 Balance
1.0 131 56,492
Polyamide PA2200 Speed 1.1 143 61,599
Polyamide PA3200GF 95 40,705
Fused Deposition
Modeling FDM 1650 ABS Plastic 1,247 536,178
FDM 2000 ABS Plastic 416 178,731
FDM 8000 ABS Plastic 83 35,752
FDM Quantum ABS Plastic 728 312,779
Selective Laser
Melting MTT SLM 250 Metallic Powder SAE 316L 112 47,979
Electron Beam
Melting Arcam A1 Metallic Powder Ti-6Al-4V 61 26,311
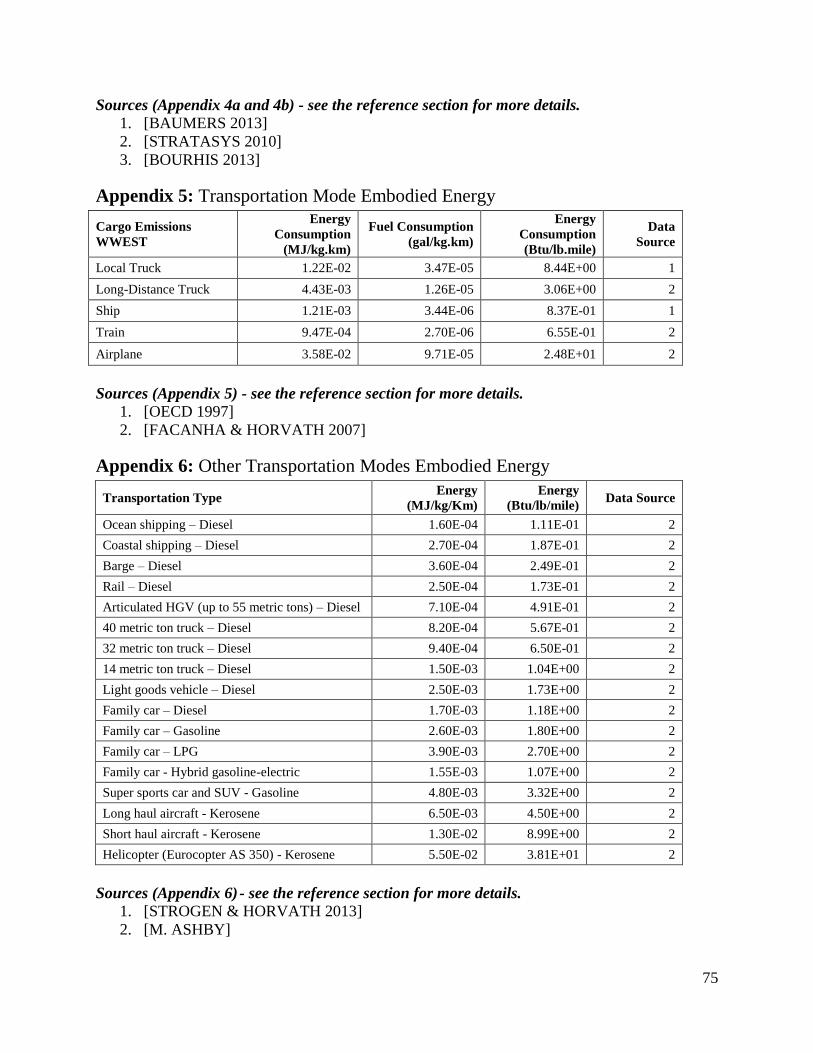
75
Sources (Appendix 4a and 4b) - see the reference section for more details.
1. [BAUMERS 2013]
2. [STRATASYS 2010]
3. [BOURHIS 2013]
Appendix 5: Transportation Mode Embodied Energy
Cargo Emissions
WWEST
Energy
Consumption
(MJ/kg.km)
Fuel Consumption
(gal/kg.km)
Energy
Consumption
(Btu/lb.mile)
Data
Source
Local Truck 1.22E-02 3.47E-05 8.44E+00 1
Long-Distance Truck 4.43E-03 1.26E-05 3.06E+00 2
Ship 1.21E-03 3.44E-06 8.37E-01 1
Train 9.47E-04 2.70E-06 6.55E-01 2
Airplane 3.58E-02 9.71E-05 2.48E+01 2
Sources (Appendix 5) - see the reference section for more details.
1. [OECD 1997]
2. [FACANHA & HORVATH 2007]
Appendix 6: Other Transportation Modes Embodied Energy
Transportation Type Energy
(MJ/kg/Km)
Energy
(Btu/lb/mile) Data Source
Ocean shipping – Diesel 1.60E-04 1.11E-01 2
Coastal shipping – Diesel 2.70E-04 1.87E-01 2
Barge – Diesel 3.60E-04 2.49E-01 2
Rail – Diesel 2.50E-04 1.73E-01 2
Articulated HGV (up to 55 metric tons) – Diesel 7.10E-04 4.91E-01 2
40 metric ton truck – Diesel 8.20E-04 5.67E-01 2
32 metric ton truck – Diesel 9.40E-04 6.50E-01 2
14 metric ton truck – Diesel 1.50E-03 1.04E+00 2
Light goods vehicle – Diesel 2.50E-03 1.73E+00 2
Family car – Diesel 1.70E-03 1.18E+00 2
Family car – Gasoline 2.60E-03 1.80E+00 2
Family car – LPG 3.90E-03 2.70E+00 2
Family car - Hybrid gasoline-electric 1.55E-03 1.07E+00 2
Super sports car and SUV - Gasoline 4.80E-03 3.32E+00 2
Long haul aircraft - Kerosene 6.50E-03 4.50E+00 2
Short haul aircraft - Kerosene 1.30E-02 8.99E+00 2
Helicopter (Eurocopter AS 350) - Kerosene 5.50E-02 3.81E+01 2
Sources (Appendix 6) - see the reference section for more details.
1. [STROGEN & HORVATH 2013]
2. [M. ASHBY]

76
Appendix 7: Use Phase Energy Consumption
Mobility Type Energy (MJ/kg. Km) Energy (Btu/lb.mile) Source
Ocean shipping - Diesel 1.60E-04 1.11E-01 2
Coastal shipping - Diesel 2.70E-04 1.87E-01 2
Barge - Diesel 3.60E-04 2.49E-01 2
Rail - Diesel 3.00E-05 2.08E-02 1
Articulated HGV (up to 55 metric tons) - Diesel 7.10E-04 4.91E-01 2
Articulated truck 2.10E-04 1.45E-01 1
40 metric ton truck - Diesel 8.20E-04 5.67E-01 2
32 metric ton truck - Diesel 9.40E-04 6.50E-01 2
14 metric ton truck - Diesel 1.50E-03 1.04E+00 2
Light goods vehicle - Diesel 2.50E-03 1.73E+00 2
Family car - Diesel 1.07E-03 7.40E-01 1
Family car - Gasoline 1.13E-03 7.82E-01 1
Family car - LPG 1.13E-03 7.82E-01 1
Family car - Hybrid gasoline-electric 6.32E-04 4.37E-01 3
Electric vehicles 1.49E-04 1.03E-01 3
Super sports car and SUV - Gasoline 1.04E-03 7.20E-01 2
Airplanes (average) 3.51E-03 2.43E+00 1,4,5
Long haul aircraft - Kerosene 3.51E-03 2.43E+00 3
Short haul aircraft - Kerosene 3.51E-03 2.43E+00 3
Helicopter (Eurocopter AS 350) - Kerosene 5.50E-02 3.81E+01 2
Note: In principle, average energy use by mobility type in the use phase should be different from the freight and
distribution phase. Use phase energy numbers should be just the additional energy use associated with an increase in
mass, whereas freight energy use should include not only the energy use associated with additional mass, but also a
share of the baseline energy use needed to move the vehicle even if it were not carrying any weight.
Sources (Appendix 7) - see the reference section for more details.
1. [HELMS & LAMBRECHT 2006]
2. [M. ASHBY]
3. [GEYER 2012]
4. [AMERICAN AIRLINES 2007]
5. [LUFTHANSA 2011]