Embed Size (px)
Citation preview

Life Cycle Cost Analysis of Municipal Pavements in Southern and Eastern Ontario
Anne Holt, P.Eng. Applied Research Associates, Inc.
5401 Eglinton Avenue West, Suite 105, Toronto, ON, Canada, M9C 5K6 Tel: 416-621-9555, fax: 416-621-4917, email: [email protected]
Sherry Sullivan, MASc, P.Eng, LEEDAP
Cement Association of Canada 704-1500 Don Mills Road, ON, M3B 3K4
Tel: 416-449-3708, fax: 416-449-9755, email: [email protected]
David K. Hein, P.Eng. Applied Research Associates, Inc.
5401 Eglinton Avenue West, Suite 105, Toronto, ON, Canada, M9C 5K6 Tel: 416-621-9555, fax: 416-621-4917, email: [email protected]
Paper prepared for presentation at the Effects of Increased Loading on Pavements Session
of the 2011 Annual Conference of the Transportation Association of Canada Edmonton, Alberta
September 2011

1
ABSTRACT
Many municipalities are seeking ways to more efficiently manage budgets and improve roadway performance. While there are many pavement types available to municipalities, the most common alternatives have historically been asphalt and concrete pavements. The recently released mechanistic-empirical pavement design guide pavement design procedure and associated software application (DarwinME) has provided pavement designers with a very comprehensive procedure to develop specific pavement designs that will suite the purpose of the agency while minimizing costs. More robust design inputs have led to improvements in the design of both asphalt and concrete pavements based on long term pavement performance. The designs, maintenance and rehabilitation plans developed for this project are able to sustain an adequate level of service for Ontario municipalities over a 50 year service life.
Pavement type selection is one of the more challenging engineering decisions facing roadway administrators. The process outlined in the paper includes a variety of engineering factors such as materials and structural performance which must be weighed against the initial and life-cycle costs, as well as, sustainable benefits. The technical part of the evaluation includes an analysis of pavement life-cycle strategies including initial and future costs for construction and maintenance activities.
INTRODUCTION
Both rigid and flexible pavements are commonly used in Ontario for both provincial highways and municipal roads. Each pavement type is designed and constructed based on local traffic and site conditions.
Rigid pavements in Ontario typically consist of a Jointed Plain Concrete Pavement (JPCP) over a granular base which provides uniform support for the concrete slabs. The structural strength of a concrete pavement is largely within the concrete itself due to its rigid nature. Concrete’s rigidness spreads the load over a large area and keeps the pressure on the subgrade low, which is why less base material is required.
Flexible pavements typically consist of Hot-Mix Asphalt (HMA) pavement over a granular base and subbase to distribute the traffic loads over the underlying layers. The asphalt concrete materials used in Ontario municipalities typically consist of Superpave asphalt mix designs.
This paper describes the pavement type selection process between concrete and asphalt pavements, and provides typical pavement cross-section information and accompanying maintenance and rehabilitation (M&R) plans that are appropriate for use by Ontario municipalities. These designs are established to be structurally equivalent and have the same design life such that a fair comparison may be made (ARA 2011). The M&R plans have been developed for both pavement types to ensure that a reasonable level of service will be maintained through preventative maintenance and rehabilitation activities commonly used by Ontario municipalities.
Creating equivalent pavement designs has historically been difficult due to differences in the pavement design procedures used for rigid and flexible pavements. However, the most recent release of the AASHTO pavement design guide, the Mechanistic-Empirical Pavement Design Guide (MEPDG) (AASHTO 2008), provides a more robust design procedure that uses substantially more design information and a larger source of data to calibrate the performance predictions than previous editions. Equivalent designs used in this document are based on the MEPDG. This paper describes pavement designs and maintenance plans for collector, minor arterial and major arterial roadways in Southern and Eastern Ontario.

2
MECHANISTIC-EMPIRICAL PAVEMENT DESIGN GUIDE
The MEPDG is the pavement design guide developed for AASHTO under the U.S. National Cooperative Highway Research Program (NCHRP) Project 1-37A. The MEPDG uses mechanistic-empirical principles to predict the deterioration of pavements and their expected service lives. The design procedure is very comprehensive and uses state-of-the-practice mechanistic models to predict the accumulation of pavement distresses based on the traffic loads and the material properties. This process is repeated hundreds of thousands of times to account for all of the possible traffic load combinations and the changes in materials due to age and climatic conditions.
To ensure that the models closely represent the distress conditions of in-service pavements, the process was calibrated to match known performance information from the Long Term Pavement Performance study and other test tracks across North America. These comprehensive data sources have been used to perform an empirical calibration to the field conditions documented from over 20 years of detailed performance observations. The design procedures used in the Guide are based on mechanistic-empirical concepts, which are a quantum leap from the old AASHO Road Test empirical designs that are used by many Canadian transportation agencies.
Mechanistic-empirical design focuses on pavement performance and accounts for many factors that have not been well addressed previously. All of these new design inputs that directly affect pavement performance such as materials, climate, traffic loads and construction procedures are used to estimate the distress condition of the pavement over time (Figure 1).
Figure 1: General Pavement Design Procedure and Analysis
One of the other major advancements of the MEPDG and the accompanying software is the ability to establish local calibration of the models. Since there are many differences in both the climate and materials used by different agencies, there are many factors that are expected to contribute to the variability in the analysis. As a part of the implementation of the MEPDG by Canadian transportation agencies, local calibration efforts are being completed to both develop the appropriate inputs as well as to monitor the performance of their pavements. The following inputs are used by the MEPDG to model the pavement performance:

3
General Inputs General Information Site/Project Identification Analysis Parameters Traffic Traffic Volume Adjustment Factors Axle Load Distribution Factors General Traffic Inputs Climate
Structure Drainage and Surface Properties Pavement Structural Layers Asphalt Concrete Layers Rigid Concrete Layers Granular Layers Foundation/Subgrade Thermal Cracking Distress Potential
Traffic Information
The volume and composition of traffic has always been a major focus of pavement design due to the impact it has on determining the thickness of the pavement. Traffic has been traditionally described as the number of vehicles using the road in terms of the Average Annual Daily Traffic (AADT). In the 1993 AASHTO Design Guide (AASHTO 1993), the traffic was described in terms of Equivalent Single Axle Loads (ESALs), which described the total damage caused by different vehicles in terms of the damage caused by 80 kN single axles.
The MEPDG takes a different approach to more accurately evaluate the damage caused by each axle load on a specific cross-section over the range of conditions it is expected to endure, commonly known as axle load spectra. To accomplish this, the MEPDG uses a large range of traffic parameters. This level of traffic detail is not commonly available for municipal roadways and some assumptions or regional defaults are necessary.
Traffic Volume
The most common traffic input is the number of vehicles expected to pass over a roadway during its design life. As the load applied by passenger vehicles is very low, the MEPDG does not consider them in the analysis. The number of load applications from trucks and buses is summarized using the Average Annual Daily Truck Traffic (AADTT). For the purpose of providing equivalent designs a range of AADTT values are used ranging from 250 to 10,000 trucks per day. These traffic levels represent collector, minor arterial, and major arterial roadways.
For the purposes of this analysis, it is assumed that half of the traffic travels are in each direction. Collector and minor arterial roadways are assumed to have only one lane in each direction, while major arterial roadways are assumed to have 2 lanes in each direction, with 80 percent of the commercial vehicle traffic in the design lane. A compound growth rate of 2 percent was used to account for increases in vehicle volume over time.
Truck Type Distribution
The MEPDG uses a rigorous process to estimate the traffic loads on a roadway. To complete this part of the process, the traffic volume for each month is divided into the 13 vehicle classes as established by the US Federal Highway Administration (FHWA). Light vehicles, class 1 through 3 (motorcycles and light passenger vehicles), are ignored with the remaining vehicle classes being the focus of the pavement structural design.
The types of vehicles that travel a roadway are typically dependent on the functional classification, the location, and the proximity to industry and natural resources. While conditions may vary locally, typical distributions for the three functional classifications being modelled are shown in Table 1.

4
Table 1. Expected Commercial Vehicle Distribution for Municipal Roadways
FHWA Class
Commercial Vehicle Distribution of Commercial Vehicles
Collector Minor
Arterial Major
Arterial
4
Two or Three Axle Buses
2.9 % 3.3 % 1.8 %
5
Two-Axle, Six-Tire, Single Unit Trucks
56.9 % 34.0 % 24.6 %
6
Three-Axle Single Unit Trucks
10.4 % 11.7 % 7.6 %
7
Four or More Axle Single Unit Trucks
3.7 % 1.6 % 0.5 %
8
Four or Less Axle Single Trailer Trucks
9.2 % 9.9 % 5 %
9
Five-Axle Single Trailer Trucks
15.3 % 36.2 % 31.3 %
10
Six or More Axle Single Trailer Trucks
0.6 % 1.0 % 9.8 %
11
Five or Less Axle Multi-Trailer Trucks
0.3 % 1.8 % 0.8 %
12
Six-Axle Multi-Trailer Trucks
0.4 % 0.2 % 3.3 %
13
Seven or More Axle Multi-Trailer Trucks
0.3 % 0.3 % 15.3 %
The commercial vehicle distributions are used in conjunction with axle type and load distributions for Southern and Eastern Ontario. The default values for the following list of parameters were used to represent Ontario municipal conditions:
Hourly vehicle distribution Monthly vehicle distribution Vehicle length and axle spacing
Climate Conditions
A significant factor influencing the performance of pavements is climate. While the climate conditions do not differ substantially across Ontario, Mount Forest was selected as having a typical climate representing Southern and Eastern Ontario. Extreme temperatures located in other locations are often accounted for by adjusting materials such as the asphalt binder type. Table 2 is a summary pavement surface temperatures expected based on the Mount Forest climate data.
Table 2. Average Monthly Quintile Surface Temperature – Mount Forest
Month
1st Quintile
(ºC)
2nd Quintile
(ºC)
3rd Quintile
(ºC)
4th Quintile
(ºC)
5th Quintile
(ºC)
Mean Temp.
(ºC)
Std. Dev. (ºC)
January -13.0 -8.4 -5.5 -2.9 0.3 -5.9 4.8 February -13.2 -8.7 -5.5 -2.7 1.4 -5.7 5.2
5
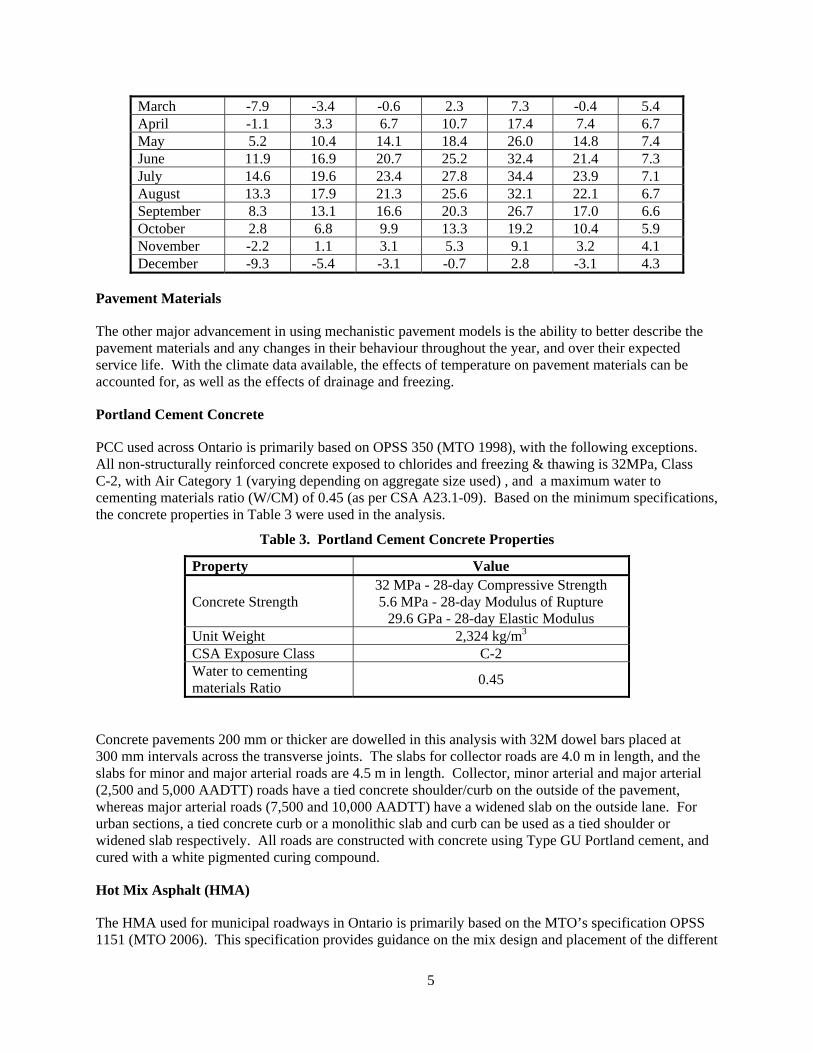
March -7.9 -3.4 -0.6 2.3 7.3 -0.4 5.4 April -1.1 3.3 6.7 10.7 17.4 7.4 6.7 May 5.2 10.4 14.1 18.4 26.0 14.8 7.4 June 11.9 16.9 20.7 25.2 32.4 21.4 7.3 July 14.6 19.6 23.4 27.8 34.4 23.9 7.1 August 13.3 17.9 21.3 25.6 32.1 22.1 6.7 September 8.3 13.1 16.6 20.3 26.7 17.0 6.6 October 2.8 6.8 9.9 13.3 19.2 10.4 5.9 November -2.2 1.1 3.1 5.3 9.1 3.2 4.1 December -9.3 -5.4 -3.1 -0.7 2.8 -3.1 4.3
Pavement Materials
The other major advancement in using mechanistic pavement models is the ability to better describe the pavement materials and any changes in their behaviour throughout the year, and over their expected service life. With the climate data available, the effects of temperature on pavement materials can be accounted for, as well as the effects of drainage and freezing.
Portland Cement Concrete
PCC used across Ontario is primarily based on OPSS 350 (MTO 1998), with the following exceptions. All non-structurally reinforced concrete exposed to chlorides and freezing & thawing is 32MPa, Class C-2, with Air Category 1 (varying depending on aggregate size used) , and a maximum water to cementing materials ratio (W/CM) of 0.45 (as per CSA A23.1-09). Based on the minimum specifications, the concrete properties in Table 3 were used in the analysis.
Table 3. Portland Cement Concrete Properties
Property Value
Concrete Strength 32 MPa - 28-day Compressive Strength 5.6 MPa - 28-day Modulus of Rupture
29.6 GPa - 28-day Elastic Modulus Unit Weight 2,324 kg/m3 CSA Exposure Class C-2 Water to cementing materials Ratio
0.45
Concrete pavements 200 mm or thicker are dowelled in this analysis with 32M dowel bars placed at 300 mm intervals across the transverse joints. The slabs for collector roads are 4.0 m in length, and the slabs for minor and major arterial roads are 4.5 m in length. Collector, minor arterial and major arterial (2,500 and 5,000 AADTT) roads have a tied concrete shoulder/curb on the outside of the pavement, whereas major arterial roads (7,500 and 10,000 AADTT) have a widened slab on the outside lane. For urban sections, a tied concrete curb or a monolithic slab and curb can be used as a tied shoulder or widened slab respectively. All roads are constructed with concrete using Type GU Portland cement, and cured with a white pigmented curing compound.
Hot Mix Asphalt (HMA)
The HMA used for municipal roadways in Ontario is primarily based on the MTO’s specification OPSS 1151 (MTO 2006). This specification provides guidance on the mix design and placement of the different
6
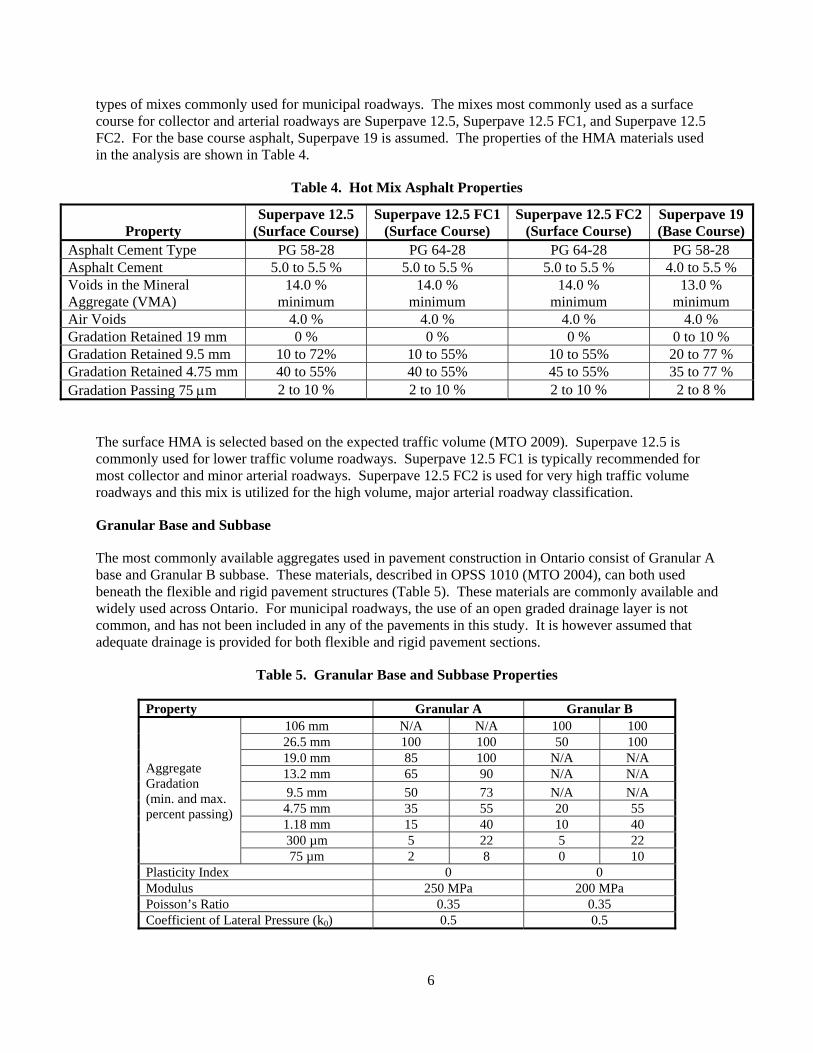
types of mixes commonly used for municipal roadways. The mixes most commonly used as a surface course for collector and arterial roadways are Superpave 12.5, Superpave 12.5 FC1, and Superpave 12.5 FC2. For the base course asphalt, Superpave 19 is assumed. The properties of the HMA materials used in the analysis are shown in Table 4.
Table 4. Hot Mix Asphalt Properties
Property Superpave 12.5
(Surface Course)Superpave 12.5 FC1
(Surface Course) Superpave 12.5 FC2
(Surface Course) Superpave 19 (Base Course)
Asphalt Cement Type PG 58-28 PG 64-28 PG 64-28 PG 58-28 Asphalt Cement 5.0 to 5.5 % 5.0 to 5.5 % 5.0 to 5.5 % 4.0 to 5.5 % Voids in the Mineral Aggregate (VMA)
14.0 % minimum
14.0 % minimum
14.0 % minimum
13.0 % minimum
Air Voids 4.0 % 4.0 % 4.0 % 4.0 % Gradation Retained 19 mm 0 % 0 % 0 % 0 to 10 % Gradation Retained 9.5 mm 10 to 72% 10 to 55% 10 to 55% 20 to 77 % Gradation Retained 4.75 mm 40 to 55% 40 to 55% 45 to 55% 35 to 77 % Gradation Passing 75 m 2 to 10 % 2 to 10 % 2 to 10 % 2 to 8 %
The surface HMA is selected based on the expected traffic volume (MTO 2009). Superpave 12.5 is commonly used for lower traffic volume roadways. Superpave 12.5 FC1 is typically recommended for most collector and minor arterial roadways. Superpave 12.5 FC2 is used for very high traffic volume roadways and this mix is utilized for the high volume, major arterial roadway classification.
Granular Base and Subbase
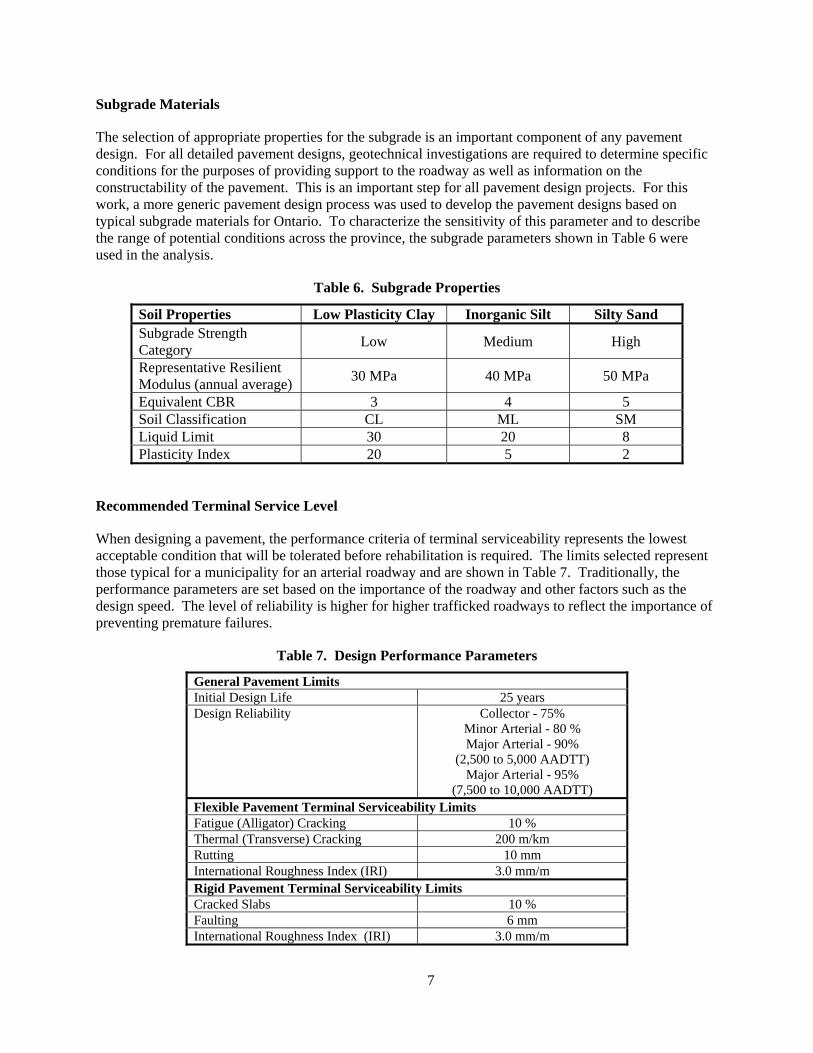
The most commonly available aggregates used in pavement construction in Ontario consist of Granular A base and Granular B subbase. These materials, described in OPSS 1010 (MTO 2004), can both used beneath the flexible and rigid pavement structures (Table 5). These materials are commonly available and widely used across Ontario. For municipal roadways, the use of an open graded drainage layer is not common, and has not been included in any of the pavements in this study. It is however assumed that adequate drainage is provided for both flexible and rigid pavement sections.
Table 5. Granular Base and Subbase Properties
Property Granular A Granular B
Aggregate Gradation (min. and max. percent passing)
106 mm N/A N/A 100 100 26.5 mm 100 100 50 100 19.0 mm 85 100 N/A N/A 13.2 mm 65 90 N/A N/A
9.5 mm 50 73 N/A N/A 4.75 mm 35 55 20 55 1.18 mm 15 40 10 40 300 µm 5 22 5 22 75 µm 2 8 0 10
Plasticity Index 0 0 Modulus 250 MPa 200 MPa Poisson’s Ratio 0.35 0.35 Coefficient of Lateral Pressure (k0) 0.5 0.5
7
Subgrade Materials
The selection of appropriate properties for the subgrade is an important component of any pavement design. For all detailed pavement designs, geotechnical investigations are required to determine specific conditions for the purposes of providing support to the roadway as well as information on the constructability of the pavement. This is an important step for all pavement design projects. For this work, a more generic pavement design process was used to develop the pavement designs based on typical subgrade materials for Ontario. To characterize the sensitivity of this parameter and to describe the range of potential conditions across the province, the subgrade parameters shown in Table 6 were used in the analysis.
Table 6. Subgrade Properties
Soil Properties Low Plasticity Clay Inorganic Silt Silty Sand Subgrade Strength Category
Low Medium High
Representative Resilient Modulus (annual average)
30 MPa 40 MPa 50 MPa
Equivalent CBR 3 4 5 Soil Classification CL ML SM Liquid Limit 30 20 8 Plasticity Index 20 5 2
Recommended Terminal Service Level
When designing a pavement, the performance criteria of terminal serviceability represents the lowest acceptable condition that will be tolerated before rehabilitation is required. The limits selected represent those typical for a municipality for an arterial roadway and are shown in Table 7. Traditionally, the performance parameters are set based on the importance of the roadway and other factors such as the design speed. The level of reliability is higher for higher trafficked roadways to reflect the importance of preventing premature failures.
Table 7. Design Performance Parameters
General Pavement Limits Initial Design Life 25 years Design Reliability Collector - 75%
Minor Arterial - 80 % Major Arterial - 90%
(2,500 to 5,000 AADTT) Major Arterial - 95%
(7,500 to 10,000 AADTT) Flexible Pavement Terminal Serviceability Limits Fatigue (Alligator) Cracking 10 % Thermal (Transverse) Cracking 200 m/km Rutting 10 mm International Roughness Index (IRI) 3.0 mm/m Rigid Pavement Terminal Serviceability Limits Cracked Slabs 10 % Faulting 6 mm International Roughness Index (IRI) 3.0 mm/m

8
DEVELOPMENT OF RECOMMENDED PAVEMENT DESIGNS
In order to develop pavement designs for both the concrete and asphalt pavements, a defined process was used to assess the structural capacity of various trial cross-sections. Since the pavement designs were established for municipal pavements in Ontario, the materials chosen as well as many of the design features were established based on current Ontario design standards and common practice.
The thickness of the granular and bound surface layers was the primary factor used to satisfy the design requirements. An initial design was selected based on typical municipal cross-sections and then evaluated within the MPEDG. For each trial section, the MEPDG analysis was completed and reviewed to modify the trial design. The design process was completed for each combination of subgrade, traffic volume, and pavement type. The primary mode of failure for the pavements was not always the same. For low traffic flexible pavements, the most common cause of failure was a reduction in smoothness. For higher traffic flexible pavements however, fatigue cracking was the limiting factor. For rigid pavements, the modes of failure were primarily based on the pavement design features such as slab length and reinforcing steel properties. The low traffic designs without dowels typically failed due to a reduced joint load-transfer. However with the addition of dowel bars and a widened slab for higher volume designs, the load transfer was substantially improved and smoothness became the critical distress.
In order to ensure that the results were fair and reasonable, all of the design cross-sections were then reviewed by a panel of design experts. The proposed designs were compared to municipal standards and other design procedures such as StreetPave (ACPA 2005) and the 1993 AASHTO Guide for the Design of Pavement Structures (AASHTO 1993). The review was completed to ensure that the cross-sections matched conditions and municipal performance expectations in Ontario.
The resulting pavement designs are shown in Table 8. These designs are considered to be typical for municipal pavements across Ontario. It is however important to note that conditions do vary across the province and some adjustments may be necessary to ensure that they are appropriate for local conditions. A detailed pavement design report should be prepared for each project by a qualified engineer.
LIFE CYCLE PAVEMENT COSTS
When selecting a pavement alternative, it is important to understand the expected pavement performance and costs for the entire life-cycle of the pavement. The overall costs and value need to be determined over many years to effectively consider the different options in terms of pavement type, design life, and future rehabilitation. Life-cycle cost analysis (LCCA) has been used for many years to assist in making decisions regarding pavement type as well as selecting pavement preservation options.
In a typical LCCA, two or more alternate choices are available for an initial pavement design or cross-section. Based on the initial pavement designs, the expected maintenance and rehabilitation over the design life are then determined and incorporated into a single, inflation adjusted, cost in order to evaluate and to compare the different options in a fair and consistent manner.
The pavements designed for this project have an initial design life of 25 years. At the end of the initial service life, some form of rehabilitation, such as a mill and overlay for a flexible pavement, or slab repairs for a rigid pavement, is usually required. An analysis period of 50 years was used for this project to include the initial service life as well as at least one major rehabilitation activity.
The maintenance and rehabilitation plans provided were developed for municipal roadways with speeds between 50 km/h and 80 km/h. Recommended plans were established to provide a reasonable level of service throughout the asset life.

9
Table 8 – Representative Pavement Designs for Ontario Municipalities
Average Annual Daily Truck Traffic (AADTT) - 25 Year Pavement Design
Collector Minor Arterial Major Arterial
250 500 1,000 1,500 2,500 5,000 7,500 10,000
Su
bgr
ade
Str
engt
h
30 MPa (CBR=3)
PCC 180 mm PCC
200 mm Granular A 190 mm PCC
200 mm Granular A 200 mm PCC
200 mm Granular A 200 mm PCC
200 mm Granular A 200 mm PCC
200 mm Granular A 200 mm PCC
200 mm Granular A 210 mm PCC
200 mm Granular A 230 mm PCC
200 mm Granular A
HMA
40 mm SP 12.5 80 mm SP 19
150 mm Granular A 350 mm Granular B
40 mm SP 12.5 80 mm SP 19
150 mm Granular A 400 mm Granular B
40 mm SP 12.5 FC1 90 mm SP 19
150 mm Granular A 450 mm Granular B
40 mm SP 12.5 FC1 100 mm SP 19
150 mm Granular A 450 mm Granular B
40 mm SP 12.5 FC1 110 mm SP 19
150 mm Granular A 450 mm Granular B
40 mm SP 12.5 FC1 120 mm SP 19
150 mm Granular A 600 mm Granular B
40 mm SP 12.5 FC1 130 mm SP 19
150 mm Granular A 600 mm Granular B
40 mm SP 12.5 FC2 140 mm SP 19
150 mm Granular A 600 mm Granular B
40 MPa (CBR=4)
PCC 180 mm PCC
200 mm Granular A 190 mm PCC
200 mm Granular A 200 mm PCC
200 mm Granular A 200 mm PCC
200 mm Granular A 200 mm PCC
200 mm Granular A 200 mm PCC
200 mm Granular A 200 mm PCC
200 mm Granular A 210 mm PCC
200 mm Granular A
HMA
40 mm SP 12.5 80 mm SP 19
150 mm Granular A 300 mm Granular B
40 mm SP 12.5 80 mm SP 19
150 mm Granular A 350 mm Granular B
40 mm SP 12.5 FC1 80 mm SP 19
150 mm Granular A 350 mm Granular B
40 mm SP 12.5 FC1 100 mm SP 19
150 mm Granular A 350 mm Granular B
40 mm SP 12.5 FC1 100 mm SP 19
150 mm Granular A 400 mm Granular B
40 mm SP 12.5 FC1 120 mm SP 19
150 mm Granular A 450 mm Granular B
40 mm SP 12.5 FC1 130 mm SP 19
150 mm Granular A 500 mm Granular B
40 mm SP 12.5 FC2 140 mm SP 19
150 mm Granular A 550 mm Granular B
50 MPa (CBR=5)
PCC 180 mm PCC
200 mm Granular A 190 mm PCC
200 mm Granular A 200 mm PCC
200 mm Granular A 200 mm PCC
200 mm Granular A 200 mm PCC
200 mm Granular A 200 mm PCC
200 mm Granular A 200 mm PCC
200 mm Granular A 200 mm PCC
200 mm Granular A
HMA
40 mm SP 12.5 80 mm SP 19
150 mm Granular A 300 mm Granular B
40 mm SP 12.5 80 mm SP 19
150 mm Granular A 300 mm Granular B
40 mm SP 12.5 FC1 80 mm SP 19
150 mm Granular A 300 mm Granular B
40 mm SP 12.5 FC1 100 mm SP 19
150 mm Granular A 300 mm Granular B
40 mm SP 12.5 FC1 100 mm SP 19
150 mm Granular A 350 mm Granular B
40 mm SP 12.5 FC1 110 mm SP 19
150 mm Granular A 400 mm Granular B
40 mm SP 12.5 FC1 130 mm SP 19
150 mm Granular A 450 mm Granular B
40 mm SP 12.5 FC2 140 mm SP 19
150 mm Granular A 500 mm Granular B
Concrete Slab and Joint Properties
No dowels Slab length = 4 m
Tied shoulder/curb *
32M Dowel bars, 300 mm spacing Slab length = 4.5 m Tied shoulder/curb *
32M Dowel bars, 300 mm spacing Slab length = 4.5 m Tied shoulder/curb *
32M Dowel bars, 300 mm spacing Slab length = 4.5 m
0.5 m Widened outside slab or integral curb *
Notes:
• All materials are based on current OPS Specifications Reliability Levels
• Subgrade levels are based on three common subgrade materials in Ontario • AADTT 250 to 500 - 75%
- Low Category (30 MPa) - Low Plasticity Clay Subgrade • AADTT 1,000 to 1,500 - 80%
- Medium Category (40 MPa) - Low Plasticity Silt Subgrade • AADTT 2,500 to 5,000 - 90%
- High Category (50 MPa) - Sandy Silt Subgrade • AADTT 7,500 to 10,000 - 95%
* For urban sections, a tied concrete curb or a monolithic slab and curb can be used as a tied shoulder or widened slab respectively.

10
Concrete Pavement Maintenance and Rehabilitation Plans
Concrete pavements are often constructed for their long service life and the reduced level of maintenance expected due to their slower rate of deterioration. Four maintenance and rehabilitation plans for each pavement type were developed to coincide with the different functional classifications of the roadways. The initial pavement designs were developed based on the three subgrade types shown in Table 9.
For the maintenance and rehabilitation of concrete pavements, the most common activities include improving joint performance through resealing, partial depth repairs, and slab replacements with full depth repairs. On higher volume roadways, the smoothness of the roadway has more significance and some surface texturization is recommended to ensure an acceptable performance.
The recommended maintenance and rehabilitation plans are outlined in Table 9 through Table 12. These plans were developed to provide a consistent level of service in a cost effective manner. The maintenance and rehabilitation quantities provided are for a 1km length of roadway and will need to be adjusted for different section lengths.
Table 9. Rigid Collector Pavement Preservation Plan (AADTT 250-500)
Expected Year
Activity Description Quantity
(per 1 km of road)
12 Reseal joints 10 %
25 Partial depth PCC repair 2 %
25 Full depth PCC repair 5 %
25 Reseal joints 20 %
40 Partial depth PCC repair 5 %
40 Full depth PCC repair 10 %
40 Reseal joints 20 %
Table 10. Rigid Minor Arterial Pavement Preservation Plan (AADTT 1,000-1,500)
Expected Year
Activity Description Quantity
(per 1 km of road)
12 Reseal joints 20 %
25 Partial depth PCC repair 5 %
25 Full depth PCC repair 10 %
25 Reseal joints 25 %
40 Partial depth PCC repair 5 %
40 Full depth PCC repair 15 %
40 Reseal joints 25 %

11
Table 11. Rigid Major Arterial Pavement Preservation Plan (AADTT 2,500-5,000)
Expected Year
Activity Description Quantity
(per 1 km of road)
12 Reseal joints 25 %
12 Partial depth PCC repair 2 %
25 Partial depth PCC repair 5 %
25 Full depth PCC repair 10 %
25 Reseal joints 25 %
40 Partial depth PCC repair 5 %
40 Full depth PCC repair 15 %
40 Reseal joints 25 %
Table 12. Rigid Major Arterial Pavement Preservation Plan (AADTT 7,500-10,000)
Expected Year
Activity Description Quantity
(per 1 km of road)
12 Reseal joints 25 %
12 Partial depth PCC repair 2 %
25 Partial depth PCC repair 5 %
25 Full depth PCC repair 10 %
25 Reseal joints 50 %
25 Texturize 25 %
40 Partial depth PCC repair 5 %
40 Full depth PCC repair 15 %
40 Reseal joints 50 %
40 Texturize 50 %
Hot Mix Asphalt Pavement Maintenance and Rehabilitation Plans
Hot mix asphalt pavements have been commonly used by Ontario municipalities due to their history of use and experience with maintenance and rehabilitation. HMA pavements typically deteriorate faster than PCC pavements and require a more extensive maintenance schedule to maintain an acceptable level of service.
The recommend maintenance and rehabilitation schedules for HMA pavements are outlined in Table 13 through Table 16. These plans use a combination of preventative maintenance and rehabilitation to ensure a cost effective preservation plan. The maintenance and rehabilitation quantities provided are for a 1km length of roadway and will need to be adjusted for different section lengths.

12
Table 13. Flexible Collector Pavement Preservation Plan (AADTT 250-500)
Expected Year
Activity Description Quantity
(per 1 km of road)
10 Rout and seal 250 m
10 Spot repairs, mill 40 mm/patch 40 mm 2 %
20 Mill HMA 40 mm
20 Resurface with Superpave 12.5 40 mm
25 Rout and seal 500 m
30 Spot repairs, mill 40 mm/patch 40 mm 5 %
35 Mill HMA 40 mm
35 Full depth asphalt base repair 5 %
35 Resurface with Superpave 12.5 40 mm
40 Rout and seal 500 m
43 Spot repairs, mill 40 mm/patch 40 mm 5 %
48 Mill HMA 40 mm
48 Resurface with Superpave 12.5 40 mm
Table 14. Flexible Minor Arterial Pavement Preservation Plan (AADTT 1,000-1,500)
Expected Year
Activity Description Quantity
(per 1 km of road)
10 Rout and seal 250 m
10 Spot repairs, mill 40 mm/patch 40 mm 2 %
15 Spot repairs, mill 40 mm/patch 40 mm 10 %
20 Mill HMA 40 mm
20 Resurface with Superpave 12.5FC1 40 mm
25 Rout and seal 500 m
30 Spot repairs, mill 40 mm/patch 40 mm 5 %
35 Mill HMA 40 mm
35 Full depth asphalt base repair 10 %
35 Resurface with Superpave 12.5FC1 40 mm
40 Rout and seal 500 m
43 Spot repairs, mill 40 mm/patch 40 mm 5 %
48 Mill HMA 90 mm
48 Resurface with Superpave 19 50 mm
48 Resurface with Superpave 12.5FC1 40 mm

13
Table 15. Flexible Major Arterial Pavement Preservation Plan (AADTT 2,500-5,000)
Expected Year
Activity Description Quantity
(per 1 km of road)
5 Rout and seal 200 m
10 Rout and seal 500 m
10 Spot repairs, mill 40 mm/patch 40 mm 5 %
20 Mill HMA 40 mm
20 Resurface with Superpave 12.5FC1 40 mm
25 Rout and seal 1000 m
30 Spot repairs, mill 40 mm/patch 40 mm 10 %
35 Mill HMA 90 mm
35 Resurface with Superpave 19 50 mm
35 Resurface with Superpave 12.5FC1 40 mm
40 Rout and seal 1500 m
45 Spot repairs, mill 40 mm/patch 40 mm 10 %
48 Mill HMA 40 mm
48 Full depth asphalt base repair 5 %
48 Resurface with Superpave 12.5FC1 40 mm
Table 16. Flexible Major Arterial Pavement Preservation Plan (AADTT 7,500-10,000)
Expected Year
Activity Description Quantity
(per 1 km of road)
8 Rout and seal 200 m
8 Spot repairs, mill 40 mm/patch 40 mm 5 %
13 Rout and seal 1000 m
13 Spot repairs, mill 40 mm/patch 40 mm 15 %
18 Mill HMA 50 mm
18 Full depth asphalt base repair 10 %
18 Resurface with Superpave 12.5FC2 50 mm
23 Rout and seal 500 m
28 Rout and seal 1500 m
28 Spot repairs, mill 40 mm/patch 40 mm 10 %
32 Mill HMA 90 mm
32 Resurface with Superpave 19 50 mm
32 Resurface with Superpave 12.5FC2 40 mm
37 Rout and seal 1500 m
40 Spot repairs, mill 40 mm/patch 40 mm 10 %
45 Mill HMA 50 mm
45 Full depth asphalt base repair 10 %
45 Resurface with Superpave 12.5FC2 50 mm
48 Rout and seal 1500 m
14
Pavement Construction Unit Costs
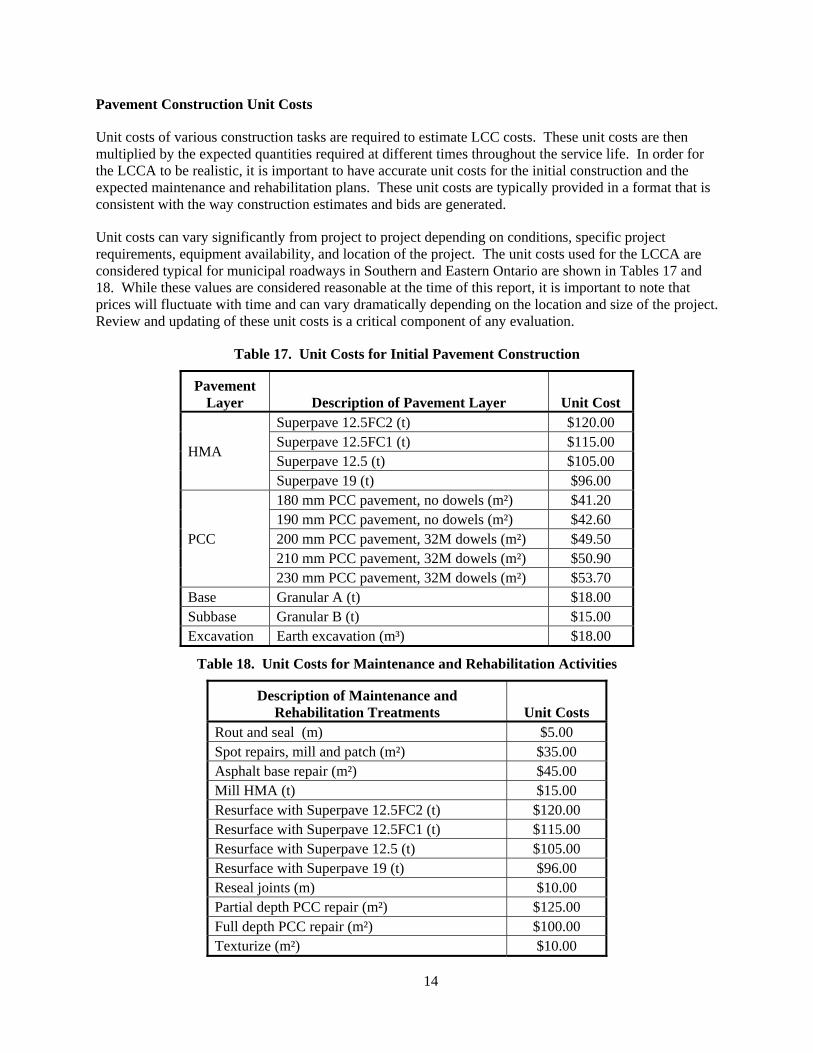
Unit costs of various construction tasks are required to estimate LCC costs. These unit costs are then multiplied by the expected quantities required at different times throughout the service life. In order for the LCCA to be realistic, it is important to have accurate unit costs for the initial construction and the expected maintenance and rehabilitation plans. These unit costs are typically provided in a format that is consistent with the way construction estimates and bids are generated.
Unit costs can vary significantly from project to project depending on conditions, specific project requirements, equipment availability, and location of the project. The unit costs used for the LCCA are considered typical for municipal roadways in Southern and Eastern Ontario are shown in Tables 17 and 18. While these values are considered reasonable at the time of this report, it is important to note that prices will fluctuate with time and can vary dramatically depending on the location and size of the project. Review and updating of these unit costs is a critical component of any evaluation.
Table 17. Unit Costs for Initial Pavement Construction
Pavement Layer Description of Pavement Layer Unit Cost
HMA
Superpave 12.5FC2 (t) $120.00 Superpave 12.5FC1 (t) $115.00 Superpave 12.5 (t) $105.00 Superpave 19 (t) $96.00
PCC
180 mm PCC pavement, no dowels (m²) $41.20 190 mm PCC pavement, no dowels (m²) $42.60 200 mm PCC pavement, 32M dowels (m²) $49.50 210 mm PCC pavement, 32M dowels (m²) $50.90 230 mm PCC pavement, 32M dowels (m²) $53.70
Base Granular A (t) $18.00 Subbase Granular B (t) $15.00 Excavation Earth excavation (m³) $18.00
Table 18. Unit Costs for Maintenance and Rehabilitation Activities
Description of Maintenance and Rehabilitation Treatments Unit Costs
Rout and seal (m) $5.00 Spot repairs, mill and patch (m²) $35.00 Asphalt base repair (m²) $45.00 Mill HMA (t) $15.00 Resurface with Superpave 12.5FC2 (t) $120.00 Resurface with Superpave 12.5FC1 (t) $115.00 Resurface with Superpave 12.5 (t) $105.00 Resurface with Superpave 19 (t) $96.00 Reseal joints (m) $10.00 Partial depth PCC repair (m²) $125.00 Full depth PCC repair (m²) $100.00 Texturize (m²) $10.00

15
Excavation Costs
The costs of excavation are not always necessary to include in an LCCA. They are not applicable to many sites where the pavement geometry is adjusted and the final road grade can be adjusted. Depending on the longitudinal profile and the existing grade of new construction projects, the extent of excavation required may be reduced during the geometric design process.
Due to the difference in the material strength, the total thickness required for PCC pavements is less than that of HMA pavements. When a pavement is being placed to match an existing grade, excavation of existing materials is required. For thicker pavement structures, this can add cost for more earth movement and for any haulage and disposal of material that cannot be used on site. The excavation costs, where appropriate, can be a substantial project cost. The typical pavement sections provided have been designed to include excavation costs when necessary. The thinner pavement structure required by concrete pavements can make this a definitive cost advantage.
In the case of pavement reconstruction, the grade of the pavement surface is typically maintained and materials must be excavated to a depth where the new cross-section can be placed. Since the vast majority of pavement works completed by municipalities are for existing roadways and not green field construction, it has been assumed that excavation needs to be accounted for, and has been included in the examples provided.
Estimating Life-Cycle Costs
To ensure a fair comparison of different options, life cycle costs are typically evaluated in terms of their Net Present Worth (NPW). The present worth represents the cost of a future activity in terms of today’s dollars. The initial costs and on-going costs are then combined to evaluate the total project present worth.
The future costs are discounted to adjust for inflation and interest rates. The discount rate used to adjust the future costs is typically set at an agency level. The current discount rate used by the Province of Ontario is 5.0%.
When evaluating the life-cycle cost, it is typically understood that there is a margin of error due to possible differences in quantities, unit costs, and pavement performance over the service life. Comparisons with marginal differences in cost may require further investigation into other factors to determine the optimal pavement type.
An example LCCA for a major arterial roadway (AADTT = 2,500) on the low strength subgrade is shown in Tables 19 and 20. This example shows the reduced cost of activities due to discounting, as well as the relatively low cost of the maintenance and rehabilitation compared to the initial construction. The LCCA process has also been followed and cost comparisons have been generated for other conditions. Full costs comparisons have been developed for all combinations of pavement type, traffic level, and subgrade material. Summaries of the LCCA results can be found in Tables 21 through 23.

16
Table 19. Example LCCA for a Major Arterial Concrete Pavement (AADTT = 2,500)
Initial Pavement Structure
Pavement layer
Description of pavement layer, Amount (Quantity) Amount
Quantity per km
Price per unit of
quantity Cost
Surface 200 mm PCC pavement, 32M dowels (m²) 200 7500 $ 49.50 $ 742,500
Base Granular A, mm (t) 200 3600 $ 18.00 $ 129,600
Excavation Earth Excavation, mm (m3) 400 3000 $ 18.00 $ 108,000
Total Initial Cost $ 980,100
Pavement Maintenance and Rehabilitation Action Plan
Years after initial
construction
Description of pavement layer, Amount (Quantity)
AmountQuantity per km
Price per unit of
quantity Cost
Net present worth
12 Partial depth PCC repair, % area (m²)
2 300 $ 125.00 $ 37,500 $ 20,881
12 Reseal joints, % Length (m) 25 833 $ 10.00 $ 8,333 $ 4,640
25 Partial depth PCC repair, % area (m²)
5 750 $ 125.00 $ 93,750 $ 27,685
25 Full depth PCC repair, % area (m²)
10 1500 $ 100.00 $ 150,000 $ 44,295
25 Reseal joints, % Length (m) 25 833 $ 10.00 $ 8,333 $ 2,461
40 Partial depth PCC repair, % area (m²)
5 750 $ 125.00 $ 93,750 $ 13,317
40 Full depth PCC repair, % area (m²)
15 2250 $ 100.00 $ 225,000 $ 31,960
40 Reseal joints, % Length (m) 25 833 $ 10.00 $ 8,333 $ 1,184
50 Residual Value $ 109,028 $ 9,508
Total M&R Cost $ 515,972 $ 136,916
Table 20. Example LCCA for a Major Arterial Asphalt Pavement (AADTT = 2,500)
Initial Pavement Structure
Pavement layer
Description of pavement layer, Amount (Quantity) Amount
Quantity per km
Price per unit of
quantity Cost
Surface Superpave 12.5FC1, mm (t) 40 1,512 $ 115.00 $ 173,880
Binder Superpave 19, mm (t) 110 4,059 $ 96.00 $ 389,664
Base Granular A, mm (t) 150 5,400 $ 18.00 $ 97,200
Subbase Granular B, mm (t) 450 13,500 $ 15.00 $ 202,500
Excavation Earth excavation (m³) 750 11,250 $ 18.00 $ 202,500
Total Initial Cost $ 1,065,744

17
Pavement Maintenance and Rehabilitation Action Plan
Years after initial
construction
Description of pavement layer, Amount (Quantity)
AmountQuantity per km
Price per unit of
quantity Cost
Net present worth
5 Rout and seal, m (m) 200 200 $ 5.00 $ 1,000 $ 784
10 Rout and seal, m (m) 500 500 $ 5.00 $ 2,500 $ 1,535
10 Spot repairs, mill 40 mm/patch 40 mm, % area (m²)
5 750 $ 35.00 $ 26,250 $ 16,115
20 Mill HMA, mm (t) 40 1500 $ 15.00 $ 22,500 $ 8,480
20 Resurface with Superpave 12.5FC1, mm (t)
40 1512 $ 115.00 $ 173,880 $ 65,534
25 Rout and seal, m (m) 1000 1000 $ 5.00 $ 5,000 $ 1,477
30 Spot repairs, mill 40 mm/patch 40 mm, % area (m²)
10 1500 $ 35.00 $ 52,500 $ 12,147
35 Mill HMA, mm (t) 90 3375 $ 15.00 $ 50,625 $ 9,178
35 Resurface with Superpave 19, mm (t)
50 1845 $ 96.00 $ 177,120 $ 32,110
35 Resurface with Superpave 12.5FC1, mm (t)
40 1512 $ 115.00 $ 173,880 $ 31,523
40 Rout and seal, m (m) 1500 1500 $ 5.00 $ 7,500 $ 1,065
45 Spot repairs, mill 40 mm/patch 40 mm, % area (m²)
10 1500 $ 35.00 $ 52,500 $ 5,843
48 Mill HMA, mm (t) 40 1500 $ 15.00 $ 22,500 $ 2,163
48 Full depth asphalt base repair, % area (m²)
5 750 $ 45.00 $ 33,750 $ 3,245
48 Resurface with Superpave 12.5FC1, mm (t)
40 1512 $ 115.00 $ 173,880 $ 16,717
50 Residual value $ 191,775 $ 16,723
Total M&R Cost $ 553,480 $ 191,192
Table 21. Summary of LCCA Results for Low Subgrade Strength
Typical Ontario Municipal Pavements
LIFE CYCLE COST ANALYSIS SUMMARY Listed by 25 Year AADTT and Pavement Type for Low Strength Subgrade
Item Collector
250 PCC 250 HMA 500 PCC 500 HMA
Initial Cost $ 425,100 $ 430,236 $ 436,950 $ 448,236
M&R Cost (Discounted) $ 32,955 $ 64,406 $ 32,955 $ 64,406
Total Cost $ 458,055 $ 494,642 $ 469,905 $ 512,642
LCC Difference 7% 8%

18
Item Minor Arterial
1,000 PCC 1,000 HMA 1,500 PCC 1,500 HMA
Initial Cost $ 490,050 $ 494,748 $ 490,050 $ 513,810
M&R Cost (Discounted) $ 57,553 $ 87,998 $ 57,553 $ 86,278
Total Cost $ 547,603 $ 582,746 $ 547,603 $ 600,088
LCC Difference 6% 9%
Item Major Arterial
2,500 PCC 2,500 HMA 5,000 PCC 5,000 HMA
Initial Cost $ 980,100 $ 1,065,744 $ 980,100 $ 1,211,868
M&R Cost (Discounted) $ 136,916 $ 191,192 $ 136,916 $ 191,192
Total Cost $ 1,117,016 $ 1,256,936 $ 1,117,016 $ 1,403,060
LCC Difference 11% 20%
Item Major Arterial
7,500 PCC 7,500 HMA 10,000 PCC 10,000 HMA
Initial Cost $ 1,070,720 $ 1,333,325 $ 1,121,280 $ 1,382,054
M&R Cost (Discounted) $ 170,523 $ 342,478 $ 170,523 $ 349,035
Total Cost $ 1,241,243 $ 1,675,803 $ 1,291,803 $ 1,731,090
LCC Difference 26% 25%
Table 22. Summary of LCCA Results for Medium Subgrade Strength
Typical Ontario Municipal Pavements
LIFE CYCLE COST ANALYSIS SUMMARY Listed by 25 Year AADTT and Pavement Type for Medium Strength Subgrade
Item Collector
250 PCC 250 HMA 500 PCC 500 HMA
Initial Cost $ 425,100 $ 412,236 $ 436,950 $ 430,236
M&R Cost (Discounted) $ 32,955 $ 64,406 $ 32,955 $ 64,406
Total Cost $ 458,055 $ 476,642 $ 469,905 $ 494,642
LCC Difference 4% 5%
Item Minor Arterial
1,000 PCC 1,000 HMA 1,500 PCC 1,500 HMA
Initial Cost $ 490,050 $ 439,686 $ 490,050 $ 477,810
M&R Cost (Discounted) $ 57,553 $ 87,998 $ 57,553 $ 86,278
Total Cost $ 547,603 $ 527,684 $ 547,603 $ 564,088
LCC Difference 4% 3%
Item Major Arterial
2,500 PCC 2,500 HMA 5,000 PCC 5,000 HMA
Initial Cost $ 980,100 $ 991,620 $ 980,100 $ 1,103,868
M&R Cost (Discounted) $ 136,916 $ 200,051 $ 136,916 $ 191,192
Total Cost $ 1,117,016 $ 1,191,671 $ 1,117,016 $ 1,295,060
LCC Difference 6% 14%

19
Item Major Arterial
7,500 PCC 7,500 HMA 10,000 PCC 10,000 HMA
Initial Cost $ 1,045,440 $ 1,256,525 $ 1,070,720 $ 1,343,654
M&R Cost (Discounted) $ 170,523 $ 342,478 $ 170,523 $ 349,035
Total Cost $ 1,215,963 $ 1,599,003 $ 1,241,243 $ 1,692,690
LCC Difference 24% 27%
Table 23. Summary of LCCA Results for High Subgrade Strength
Typical Ontario Municipal Pavements
LIFE CYCLE COST ANALYSIS SUMMARY Listed by 25 Year AADTT and Pavement Type for High Strength Subgrade
Item Collector
250 PCC 250 HMA 500 PCC 500 HMA
Initial Cost $ 425,100 $ 412,236 $ 436,950 $ 412,236
M&R Cost (Discounted) $ 32,955 $ 64,406 $ 32,955 $ 64,406
Total Cost $ 458,055 $ 476,642 $ 469,905 $ 476,642
LCC Difference 4% 1%
Item Minor Arterial
1,000 PCC 1,000 HMA 1,500 PCC 1,500 HMA
Initial Cost $ 490,050 $ 421,686 $ 490,050 $ 459,810
M&R Cost (Discounted) $ 57,553 $ 87,998 $ 57,553 $ 86,278
Total Cost $ 547,603 $ 509,684 $ 547,603 $ 546,088
LCC Difference 7% 0%
Item Major Arterial
2,500 PCC 2,500 HMA 5,000 PCC 5,000 HMA
Initial Cost $ 980,100 $ 955,620 $ 980,100 $ 1,029,744
M&R Cost (Discounted) $ 136,916 $ 191,192 $ 136,916 $ 191,192
Total Cost $ 1,117,016 $ 1,146,812 $ 1,117,016 $ 1,220,936
LCC Difference 3% 9%
Item Major Arterial
7,500 PCC 7,500 HMA 10,000 PCC 10,000 HMA
Initial Cost $ 1,045,440 $ 1,218,125 $ 1,045,440 $ 1,305,254
M&R Cost (Discounted) $ 170,523 $ 342,478 $ 170,523 $ 349,035
Total Cost $ 1,215,963 $ 1,560,603 $ 1,215,963 $ 1,654,290
LCC Difference 22% 26%
CONCLUSIONS
As municipalities across the country are facing increasing financial pressures, they are seeking ways to more efficiently manage budgets and improve roadway performance. While there are many pavement types available to municipalities, the most common alternatives have historically been asphalt and

20
concrete pavements. Although both pavement types have been extensively used by municipalities, the use of alternate bids with life cycle cost in the process for pavement choice evaluation is fairly new. The MEPDG process has many advantages over historic pavement design procedures. More robust design inputs have led to improvements in the design of both asphalt and concrete pavements based on long term pavement performance. The designs developed will meet the needs of municipalities. These designs have been evaluated to ensure that they are consistent with municipal practices across Ontario. Pavement type selection is one of the more challenging engineering decisions facing roadway administrators. The process includes a variety of engineering factors such as materials and structural performance which must be weighed against the initial and life-cycle costs, as well as, sustainable benefits. The technical part of the evaluation includes an analysis of pavement life-cycle strategies including initial and future costs for construction and maintenance, supplemental costs for engineering and contract administration and traffic control/protection and societal costs such as user delay and environmental impact. Non-economic factors such as roadway geometry, availability of local materials, qualified contractors and construction experience, conservation of materials/energy, stimulation of competition, impact on winter maintenance, light reflectance, safety and comfort can also be factored into the decision process. The evaluation helps to select an alternative that is consistent with the agency’s financial goals, policy decisions, and experience.
The results of this study show an increase in life-cycle cost for flexible pavements as traffic levels increase, particularly with low strength subgrade soils. This trend is typically because with increasing traffic loads, the thickness of the granular base/subbase and asphalt concrete layers required to support the traffic are proportionally higher than the increase in concrete thickness required.
The decision to use life-cycle cost analysis and evaluate sustainable benefits including non-economic factors as part of the pavement type selection process provides government agencies with better knowledge of the true cost of a roadway rather than just considering the initial cost of the pavement. As this report shows, concrete pavements can offer both attractive initial construction costs and favourable life cycle costs when compared to asphalt.
REFERENCES
AASHTO. Guide for the Design of Pavement Structures. Washington, DC: American Association of State Highway and Transportation Officials, 1993.
AASHTO. Mechanistic-Empirical Pavement Design Guide: A Manual of Practice, Interim Edition. Washington, DC: American Association of State Highway and Transportation Officials, 2008.
ACPA. StreetPave Software (MC003P). Skokie, IL, 2005.
ARA. Life-Cycle Cost: 2006 Update. Toronto, ON: Applied Research Associates, Inc., 2006.
ARA. “Methodology for the Development of Equivalent Pavement Structural Design Matrix for Municipal Roadways.” Toronto, Ontario, 2011.
MTO. Construction Specification for Concrete Pavement and Concrete Base. Toronto, ON: Ministry of Transportation, Ontario, 1998.
MTO. Material Specification for Aggregates - Base, Subbase, Select Subgrade, and Backfill Material. Toronto, ON: Ministry of Transportation, Ontario, 2004.

21
MTO. Material Specification for Hot Mix Asphalt. Toronto, ON: Ministry of Tranportation Ontario, 2008.
MTO. Material Specification for Superpave and Stone Mastic Asphalt Mixtures. Toronto, ON: MTO, 2006.
MTO. Material Specification for Superpave and Stone Mastic Asphalt Mixtures. Toronto, ON: MTO, 2005.
MTO. Ministry Directive: The Use of Surface Course Types on Provincial Highways. Toronto, ON: Ministry of Transportation, Ontario, 2009.