Embed Size (px)
Citation preview
Life Cycle Assessment study of Polylactic Acid food packaging including Food Waste
Ana Carolina Cruz Alarico
Thesis to obtain the Master of Science Degree in
Chemical Engineering
Supervisor(s): Dr. Ana Morão (Corbion) Professor Ana Maria de Figueiredo Brites Alves
Examination Committee
Chairperson: Professor Henrique Aníbal Santos de Matos Supervisor: Professor Ana Maria de Figueiredo Brites Alves Member of the Committee:
Professor Sebastião Manuel Tavares da Silva Alves
November 2017
ii
This work was done in collaboration with
&
iii
Acknowledgments
I would like to deeply thank my supervisors Dr. Ana Mourao and Dr. Diana Visser for all the help
and guidance, they provide throughout the project. I would also like to thank Francois de Bie and Vlad
Jaso from Total-Corbion, for their patience, for helping and encouraging me to conclude this project
and for the time they dedicated to our long discussions and meetings. In addition, my deepest thanks
to Professor Ana Maria Alves for allowing me to take this internship at Corbion Purac, Gorinchem. It
was an incredible six-month journey and truly worthy experience for both my professional and
personal life which I will certainly never forget.
I would like to thank my roommates in Utrecht, for the amazing time we spend together. I will
never forget all the trips we made and funny moments we spent together. For my colleagues at the
office at Corbion, they were all very kind and helpful. A special thank you to my family, to all their
support, specially my parents. Finally, the biggest thank you to all my friends in Portugal, to Grupo
Maravilha and to Rodrigo.
iv
Resumo
A necessidade urgente de reduzir a emissão de gases de efeito estufa na atmosfera assim como
os resíduos alimentares destinados a aterros, levaram ao desenvolvimento de plásticos produzidos
a partir de fontes renováveis. No entanto, o bio-plástico líder de mercado usado para fabricar
embalagens de alimentos, é o ácido (poli)láctico (PLA) produzido pela Total-Corbion.
A análise apresentada nesta dissertação é um estudo sobre o ciclo de vida de embalagens
fortemente contaminadas com resíduos alimentares húmidos. Este trabalho tem dois objetivos:
primeiro, analisar qual será a melhor opção de fim-de-vida da embalagem de alimentos e, em
segundo lugar, determinar qual a etapa do ciclo de vida que tem o maior impacto ambiental. Assim,
recorrendo à metodologia de Avaliação de Ciclo de Vida (ACV), foi realizado um estudo desde o
nascimento até a morte de todos os sistemas, tendo como cenários finais: a compostagem,
incineração, digestão anaeróbica e aterro sanitário.
O presente estudo mostra que a incineração é mais favorável para embalagens destinadas
a alimentos com baixo teor de humidade (<70%) como: copo de café, copo de iogurte e cápsula de
café. A compostagem é mais favorável para embalagens com alto teor de humidade, como saco de
chá e pepino. A digestão anaeróbica é a melhor opção para todos os sistemas analisados, mas
tecnicamente não é um processo desenvolvido. O aterro sanitário é a pior opção, de uma perspetiva
do ciclo de vida porque, embora o PLA permaneça inerte em aterros sanitários, o desperdício de
alimentos decompõe-se em emissões nocivas.
Palavras-Chave
Bio-plásticos ∙ ACV ∙ PLA ∙ Fim-de-vida
v
Abstract
The pressing need, in recent decades, to reduce the emission of greenhouse gases into the
atmosphere, and the amount of food waste destined for landfills, has led to the wide development of
bio-based plastics produced from renewable sources. However, the most important bio-plastic on the
market, used to manufacture food packaging, is the poly(lactic acid) (PLA) produced by Total-Corbion.
The analysis presented in this dissertation, is a Life Cycle Assessment (LCA) study of packaging
heavily contaminated with wet food residues, to determine the impact of packaging and food waste.
The aim of this work is twofold: first, to analyse what might be the best end-of-life (EOL) option for
PLA food packaging with food content and second, to determine which life cycle stage has the biggest
impact. Therefore, by using the LCA methodology, a LCA cradle-to-grave was conducted for all the
different food packaging systems, taking into consideration as final scenarios composting,
incineration, anaerobic digestion and landfill.
The present assessment shows that, incineration is more favorable for food packaging with low
moisture content (<70%), such as: coffee cups, yogurt cups and coffee capsules. Industrial
composting is more favorable for food packaging with high moisture content, such as tea bags and
cucumber wrapping. Anaerobic digestion is the best option for all systems but it is unfortunately
technically challenging. Lastly, landfill, is the worse option, from a LCA perspective, because even
though PLA will remain inert in landfills, food waste decomposes into harmful gaseous emissions.
Keywords
Bioplastics ∙ LCA ∙ PLA ∙ End-of-life
vi
Table of Contents
INTRODUCTION ................................................................................................................................. 1
1.1 Motivation 2
1.2 Outline of the report 2
STATE-OF-ART .................................................................................................................................. 4
2.1 Biodegradable food packaging life cycle assessment 4
2.2 Waste management life cycle assessment 6
2.3 Directives of plastic packaging waste 6
2.4 Directives of bio-waste management 7
SCIENTIFIC BACKGROUND AND METHODOLOGY ...................................................................... 8
3.1 Biogenic carbon cycle 8
3.2 Theoretical framework 8
3.2.1 Goal definition and scoping 10
3.2.2 Life cycle inventory 11
3.2.3 Life cycle impact assessment 11
3.2.4 Life cycle interpretation 14
3.2.5 Implementation 14
3.2.6 Identification of key concepts 14
LIFE CYCLE ASSESSMENT OF PLA FOOD PACKAGING ........................................................... 16
4.1 Goal and scope definition 16
4.1.1 Goal 16
4.1.2 Objectives 16
4.1.3 Scope 17
4.2 Life cycle inventory analysis 25
vii
4.2.1 Food supply 25
4.2.2 Material and manufacturing 25
4.2.3 Distribution 29
4.2.4 Use stage 30
4.2.5 End-of-life 31
4.3 Results and Discussion 44
4.3.1 Comparison of end-of-life options for each system 44
4.3.2 Overall life cycle results 51
4.3.3 GWP comparison of bio-based PLA and fossil-based polymers 52
4.4 Sensitivity Analysis 53
4.4.1 Incineration 53
4.4.2 Anaerobic Digestion 54
4.4.3 Industrial Composting 54
CONCLUSIONS ................................................................................................................................ 57
5.1 Future work suggestions and study improvement 57
BIBLIOGRAPHY ............................................................................................................................... 58
APPENDIXES ..................................................................................................................................... A
7.1 Appendix A1 – Heat of Combustion Calculations A
7.2 Appendix A2 – PLA Processing and LCA dataset C
7.2.1 Compounding C
7.2.2 Extrusion D
7.2.3 Thermoforming E
7.2.4 Injection moulding E
7.2.5 Blown film extrusion F
7.2.6 Spund Bond process – Spinning of PLA fibers F
7.3 Appendix A3 – Waste treatment options H
7.3.1 Incineration H
7.3.2 Industrial Composting I
7.3.3 Anaerobic Digestion J
viii
7.3.4 Landfill K
7.4 Appendix A4 – Incineration dataset L
7.5 Appendix A5 – Composting dataset N
7.6 Appendix A6 - Anaerobic Digestion dataset O
7.7 Appendix A7 – Results of all Life Cycle Stages P
7.7.1 Non-renewable and renewable energy impacts for all stages P
7.7.2 Eutrophication potential R
7.7.3 Acidification potential S
7.7.4 Water Scarcity T
7.7.5 Land use U
ix
List of Figures Figure 1 - Food packaging life cycle (Bohlmann, 2004). .................................................................... 5
Figure 2 - Biogenic carbon cycle vs fossil carbon cycle (NCASI). ...................................................... 8
Figure 3 - Life cycle stages (Source: EPA, 1993). .............................................................................. 9
Figure 4 - LCA framework (Source: ISO, 1997). ............................................................................... 10
Figure 5 - Description of five different food packaging systems. ...................................................... 18
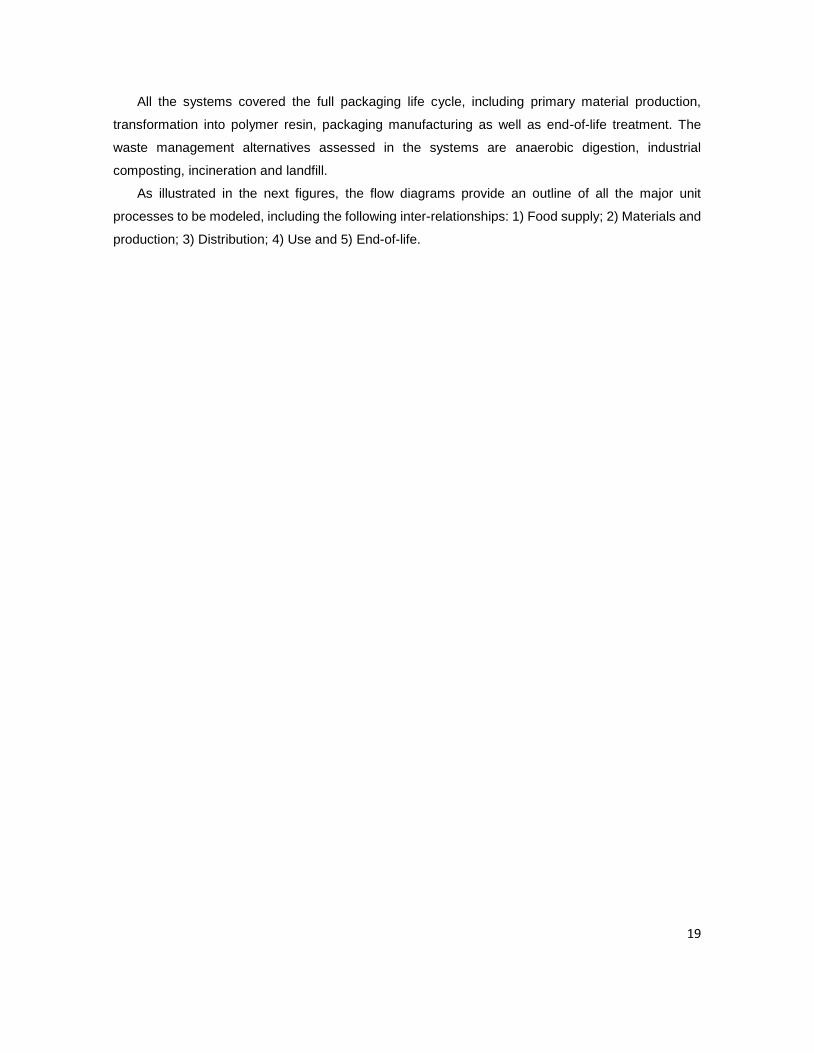
Figure 6 - Life cycle of coffee cups.................................................................................................... 20
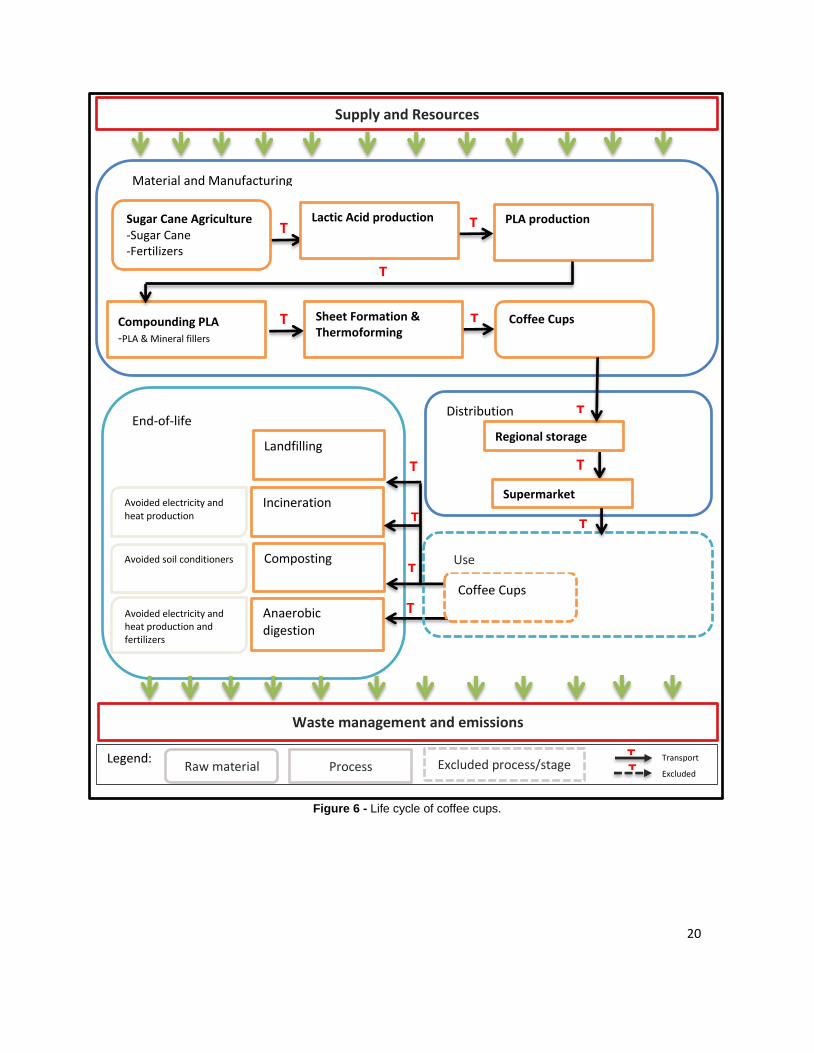
Figure 7 - Life cycle of yogurt cups. .................................................................................................. 21
Figure 8 - Life cycle of coffee capsules. ............................................................................................ 22
Figure 9 - Life cycle of tea bags. ....................................................................................................... 23
Figure 10 - Life cycle of cucumber wrapping. ................................................................................... 24
Figure 11 - Process of PLA manufacture. ......................................................................................... 26
Figure 12 - Coffee cup manufacturing process. ................................................................................ 27
Figure 13 – Yogurt cup manufacturing process. ............................................................................... 27
Figure 14 - Coffee capsule manufacturing process. ......................................................................... 28
Figure 15 - Tea bags manufacturing process. .................................................................................. 28
Figure 16 - Cucumber wrapping film manufacturing process. .......................................................... 28
Figure 17- Process model of waste incineration and technologies. .................................................. 32
Figure 18 - Process model of composting. ........................................................................................ 38
Figure 19 - Process model of anaerobic digestion. ........................................................................... 41
Figure 20 - Process diagram of landfill. ............................................................................................. 43
Figure 21 - Global warming potential of landfill. ................................................................................ 44
Figure 22 - Global warming impact of the waste treatments: composting and incineration and
reference flows of the packaging systems. ....................................................................................... 45
Figure 23 - Anaerobic digestion of five food packaging systems. ..................................................... 46
Figure 24 - Non-renewable energy of end-of-life options. ................................................................. 47
Figure 25 - Renewable energy of end-of-life options. ....................................................................... 47
Figure 26 - Eutrophication potential of end-of-life options. ............................................................... 48
Figure 27 - Acidification potential of End-of-life options. ................................................................... 48
Figure 28 - Water scarcity of end-of-life options. .............................................................................. 49
Figure 29 - Land use of end-of-life options. ...................................................................................... 49
Figure 30 - Theoretical graph about a correlation between GWP, food waste and the moisture matter
of each system. ................................................................................................................................. 50
Figure 31 - Overall comparative results for global warming potential. .............................................. 51
Figure 32 - Global warming potential of fossil-based plastics vs bioplastics. ................................... 52
x
Figure 33 - Sensitivity analysis of the impact of CHP plant efficiency. ............................................. 53
Figure 34 - Sensitivity analysis at PLA and food biodegradability under anaerobic conditions. ....... 54
Figure 35 - Sensitivity analysis on the impact of food and PLA biodegradability under aerobic
conditions. ......................................................................................................................................... 55
Figure 36- Sensitivity analysis of the impact of methane release on a composting plant. ............... 56
Figure A- 1 – Spundbond process. .................................................................................................... G
Figure A- 2- Scheme of a typical Swiss municipal solid waste incinerator (Doka G., 2003)................ I
Figure A- 3- Schematic of polymer biodegradation mechanism. ........................................................ J
Figure A- 4- Non-renewable and renewable energy impacts of Packaging stage. ............................. P
Figure A- 5- Non-renewable and renewable energy impacts of Food Supply stage. ......................... P
Figure A- 6- Non-renewable and renewable energy impacts of Distribution stage. ........................... Q
Figure A- 7- Non-renewable and renewable energy impacts of Use stage. ...................................... Q
Figure A- 8- Eutrophication potential of Packaging and Food supply stages. .................................... R
Figure A- 9- Eutrophication potential of Distribution and Use stages. ................................................ R
Figure A- 10- Acidification potential of Packaging and Food supply stages. ...................................... S
Figure A- 11- Acidification potential of Distribution and Use stages. .................................................. S
Figure A- 12- Water Scarcity potential of Packaging and Food supply stages. .................................. T
Figure A- 13- Water Scarcity potential of Distribution and Use stages. .............................................. T
Figure A- 14- Land use potential of Packaging and Food supply stages. .......................................... U
Figure A- 15- Land use potential of Distribution and Use stages. ....................................................... U
xi
List of Tables Table 1 - Impact category, characterization models and impact category indicator. ........................ 13
Table 2 -Study systems. .................................................................................................................... 17
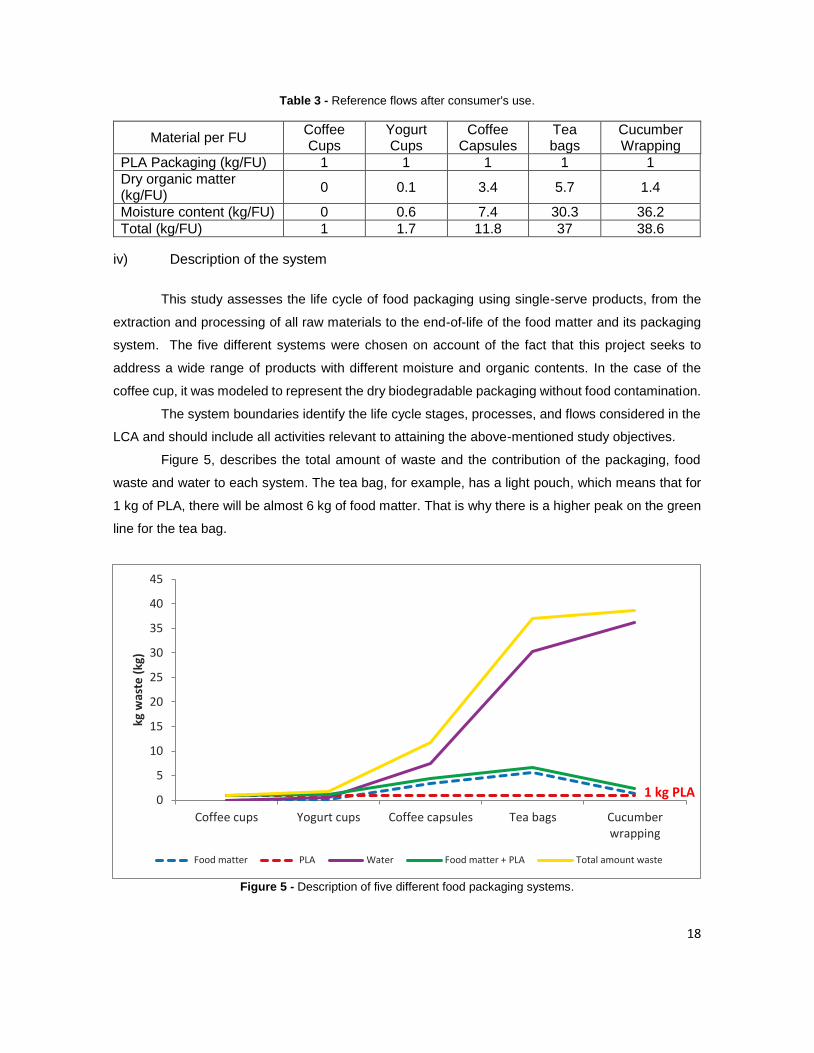
Table 3 - Reference flows after consumer's use. .............................................................................. 18
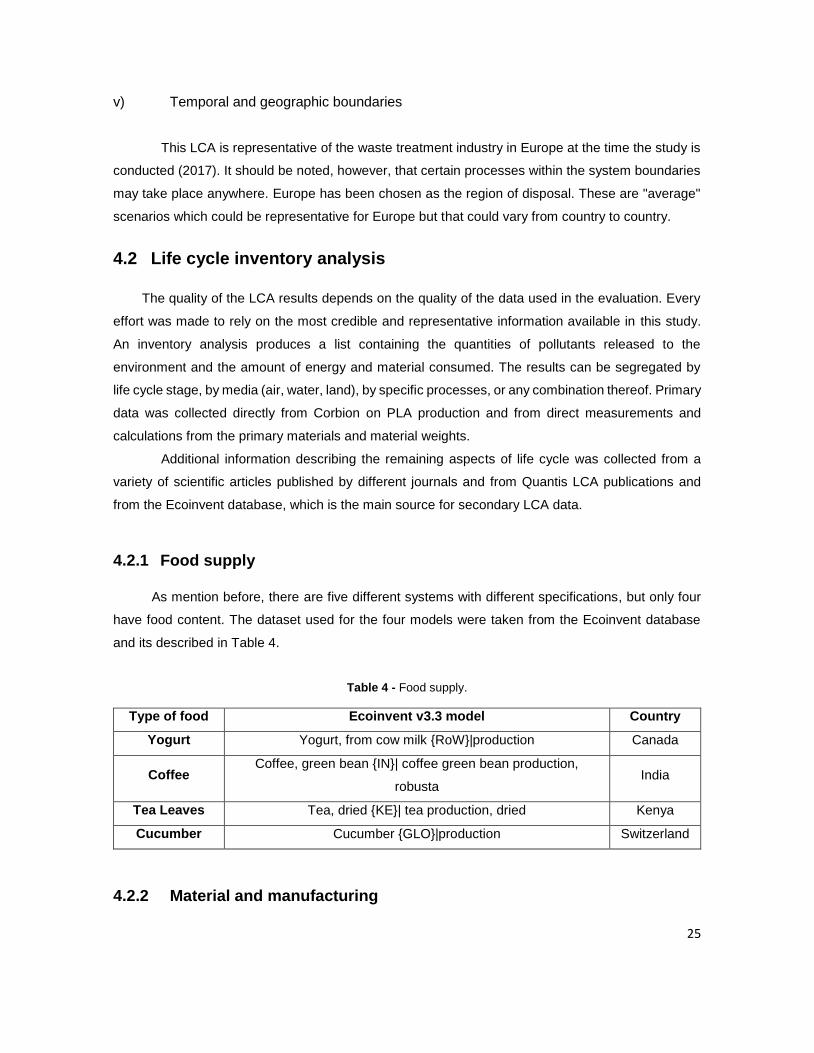
Table 4 - Food supply. ....................................................................................................................... 25
Table 5 - Assumptions for packaging distribution. ............................................................................ 29
Table 6 - Assumptions for distribution. All assumptions are based on (Quantis, 2011). .................. 29
Table 7- Use stage main data and assumptions. All data on the machine production, transport and
use are based on (Quantis, 2011). .................................................................................................... 30
Table 8 - Ancillary materials and respective functions (Doka G., 2003). .......................................... 33
Table 9 – Composition and calorific values of food........................................................................... 35
Table 10 - Composition and calorific values of PLA.......................................................................... 35
Table 11 - Calorific values of PLA food packaging including food waste, as disposed (i.e. Including
changes in composition due to the use phase). ................................................................................ 36
Table 12 - C/N mass ratio of feedstock. ............................................................................................ 39
Table 13- Biogas composition. .......................................................................................................... 42
Table 14 - Sensitivity analysis of incineration with energy recovery. ................................................ 53
Table 15 - Sensitivity Analysis on anaerobic digestion. .................................................................... 54
Table 16 - Sensitivity analysis on composting. ................................................................................. 55
Table A- 1 - Reference flows per kg of waste after consumer's use. .................................................. A
Table A- 2- Different conversion processes per product. .................................................................... C
Table A- 3- Life cycle inventory data for high-heat PLA compounding step. ...................................... C
Table A- 4- Life cycle inventory data for masterbatch production. ...................................................... D
Table A- 5- Life cycle inventory data for sheet formation. ................................................................... D
Table A- 6- Life cycle inventory data for sheet formation. ................................................................... D
Table A- 7- Life cycle inventory data for Thermoforming. ................................................................... E
Table A- 8- Life cycle inventory data for Injection moulding. .............................................................. F
Table A- 9– Life cycle inventory data for the incinerator. .................................................................... L
Table A- 10- Life cycle inventory data for the composting. ................................................................. N
Table A- 11- Life cycle inventory of anaerobic digestion. .................................................................. O
xii
Nomenclature
AD Anaerobic Digestion
AP Acidification Potential
C Carbon (element)
C0.5H2.9O1.4N0.002 Tea leaves
C0.8H3.3O1.3N0.04 Yogurt
C2.9H5.8O2.8N0.14 Cucumber
C4.4H9.5O3.6N0.1 Coffee
C6H8O4 Poly(lactic) acid
CaO Burnt lime
CH4 Methane
CHP Combined Heat and power
CO Carbon Monoxide
CO2 Carbon Dioxide
EOL End-of-life
EP Eutrophication Potential
ESP Electrostatic precipitator
EU European Union
FU Functional Unit
GHGs Greenhouse gases
GWP Global Warming Potential
H Hydrogen (element)
H2O Water
HCl Hydrogen Chloride
HF Hydrogen Fluoride
HHV High Heating Value
IPCC Intergovernmental Panel on Climate Change
ISO International Organization for Standardization
Kg CO2-eq Kilograms of carbon dioxide equivalent
Kg PO43--eq Kilograms of phosphate equivalent
Kg SO2--eq Kilograms of sulphur dioxide equivalent
LCA Life Cycle Assessment
LCI Life Cycle Inventory
LCIA Life Cycle Impact Assessment
xiii
LHV Low Heating Value
LHVdry Low Heating Value Dry
LHVwet Low Heating Value Wet
LU Land Use
MSWI Municipal Solid Waste Installations
N Nitrogen (element)
NaOH Sodium Hydroxide
NH3 Ammonia
NHx Nitrogen hydroxide
NREU Nonrenewable energy use
NO2 Nitrogen Dioxide
NOX Nitrogen Oxides
N2O Dinitrogen Oxide
O Oxygen (element)
O2 Oxygen
PE Polyethylene
PET Polyethylene Terephthalate
PLA Poly(lactic acid)
PP Polypropylene
PS Polystyrene
REU Renewable energy use
SCR Selective Catalytic Reduction
SO2 Sulfur Dioxide
SOx Sulfur Oxides
TPS Thermoplastic elastomers
WF Water Footprint
WSI Water Scarcity
WtE Waste to energy
xiv
Glossary
Biodegradation
Biodegradation is a term used in ecology to indicate the
biochemical processes in which organic substances produced
directly or indirectly from photosynthesis are broken down, and
transformed back into the inorganic state.
Biodegradability
Biodegradability refers to a potentiality (i.e. the ability to be
degraded by biological agents).
Combined Heat and Power Simultaneous production of electricity and heat, both of which
are used. The central and most fundamental principle of
cogeneration is that, in order to maximize the many benefits
that arise from it, systems should be based on the heat demand
of the application. This can be an individual building, an
industrial factory or a town/city served by district heat/cooling.
Through the utilization of the heat, the efficiency of a
cogeneration plant can reach 90% or more.
Glass Transition Temperature The glass transition temperature for short is the reversible
transition in amorphous materials (or in amorphous regions
within semicrystalline materials) from a hard and relatively
brittle "glassy" state into a viscous or rubbery state as the
temperature is increased.
Co-product Any of two or more functional flows from a co-production
process.
Cradle-to-grave The term cradle to grave is used in reference to a firm's
perspective on the environmental impact created by their
products or activities from the beginning of its life cycle to its
end or disposal.

ii
1
Chapter 1 Introduction
The growth of the global population combined with the increasing need for food and the quick
pace of modern life, has increased production of single-serve packaging systems. Unfortunately, this
type of plastic packaging ends up in the waste bin relatively soon due to its single-use design. This
inefficient concept has increased both the production of plastics waste and the presence of food
packaging in waste streams (Plastic Zero, 2017).
In order to address this issue, the European Commission has passed Directive 2008/98/EC on
waste (Waste Framework Directive). The Waste Framework Directive obligates European Union (EU)
member states, when implementing EU waste legislation and policy, to apply the waste management
hierarchy in priority order. The hierarchy consists of five levels: 1) Prevention; 2) Reuse; 3) Recycling;
4) Other recovery and 5) Disposal. The five criteria are maintained in broad terms in the revised
directive and are listen in priority order (Council T. E., 2008).
There is clear scientific evidence that greenhouse gas emissions arising from fossil fuel
combustion, and land-use change as a result of human activities, are increasing the volatility of the
Earth’s climate (Solomon S, 2007). To achieve an environmentally sustainable economy that reduces
greenhouse gas emissions, companies in various industrial categories have tried to move from fossil
based resources to more sustainable resources for their products and production processes.
Biodegradable plastics, such as PLA, constitute an encouraging case since they can be handled in
all end-of-life options outlined in the waste hierarchy, including industrial composting and anaerobic
digestion. These biodegradable plastics can help move food packaging up the waste hierarchy and
divert food waste from landfills.
In line with waste hierarchy, recycling is the second best option for waste management, but for
post-consumer plastics this disposal treatment is much more complicated. This is because post-
consumer plastic waste is highly contaminated with impurities and a great amount of sorting must be
carried out. Although the mechanical recycling of bio-plastics is technically feasible, the cost of sorting
and the small volume of bio-plastics currently on the market significantly rule out the development of
a waste stream exclusively for them (Günter Müller, 2014).
As consumers shift to a more sustainable pattern of consumption and demand for sensitivity to
these sustainability principles increases, the calculation of credible environmental profiles for food
packaging becomes an important step towards a circular economy. LCA’s a method defined by the
International Organization for Standardization (ISO), is the leading tool to assess food packaging
environmental performance. An LCA study evaluates the relative potential environmental and human
health impacts of products and services throughout their life cycle. The assessment begins, with raw
2
material extraction and includes all aspects of production, use, and end-of-life treatment. (Quantis c. ,
2015). Many software products have been developed to assist and facilitate LCAs, utilizing extensive
databases containing reliable and validated data on several processes. One of the most popular LCA
software programs has been used in this project, SimaPro, and the Ecoinvent v3.3 database has
been used to model the life cycles of the different systems.
Thus, the main aim of this project is to assess and compare the environmental impacts coming
from the life cycle of PLA plastic food packaging with food content, focusing on the disposal options,
as well as providing information about the impact of the other stages.
1.1 Motivation
Consumers are increasingly demanding fresh and processed foods all year round, often sourced
globally, in a form that is safe and convenient. A combination of different materials is used in the
primary and secondary packaging to contain, protect, preserve, distribute and sell each food item.
PLA packaging is designed to effectively contain and protect food across the supply chain while
minimizing both food and plastic waste. Thus, this biodegradable plastic will help divert food waste
from landfills.
The biodegradability of bio-plastics is an interesting characteristic because it offers new recycling
routes in waste management, such as organic recycling (through composting or anaerobic digestion).
This is a positive feature because more recovery options mean more effective plastic recovery.
Therefore, this project is divided into one main research question and one sub research questions:
1. From the environmental perspective, which end-of-life treatment is most suitable to process
PLA food packaging including the organic waste?
2. Which stage has the biggest environmental impact?
A discussion of bio-based vs fossil-based materials was carried out but it falls outside of the scope
of this thesis.
1.2 Outline of the report
This document is structured as followed. The first chapter contains the introduction and
motivation for the work. The literature review is presented in chapter 2, State-of-art, to explain the
previous research that has been done throughout the years. In chapter 3, Scientific Background and
Methodology, where the theoretical framework is described as well as the approach of the project.
3
Chapter 4 defines the goal and scope, followed by a life cycle inventory analysis, involving data
collection and calculation procedures. The life cycle impact assessment subsection which explains
the categories assessed and the life cycle Interpretation with the results and sensitivity analysis. To
finalize, the last chapter comprises the conclusions and suggestions for future work.
4
Chapter 2
State-of-art
This chapter is divided in four subsections. Starting with a recent review of the literature on the
biodegradable food packaging life-cycle assessment and waste management life-cycle assessment
to give a brief over view of the currently situation of the alternative materials. The last two subsections,
are European legislations regarding plastic packaging waste and bio-waste.
2.1 Biodegradable food packaging life cycle assessment
A number of LCA studies have been published comparing food plastic packaging with other
types of packaging as well as comparing and assessing different types of plastic. Various bio-based
packaging materials, more specifically PLA, have been investigated and reported on. Extensive
research focused on measuring environmental sustainability and identifying environmental
performance-improvement objectives regarding PLA has been conducted by Nature WorksTM.
A cradle-to-grave LCA about two polymers that can be used in food packaging applications:
PLA and polypropylene (PP), was performed by a group of consultants and reported on (Bohlmann,
2004). The purpose of their study, was to validate the hypothesis of whether biodegradable polymers
offer the potential of addressing a wide range of environmental concerns associated with conventional
polymers such as greenhouse gas emissions and sustainability. The overall environmental burden of
a product including the system used for manufacturing it and its end-of-life treatment was considered,
but it was focused on the disposal phase, because this stage was extremely important for short-lived
consumer products such as packaging.
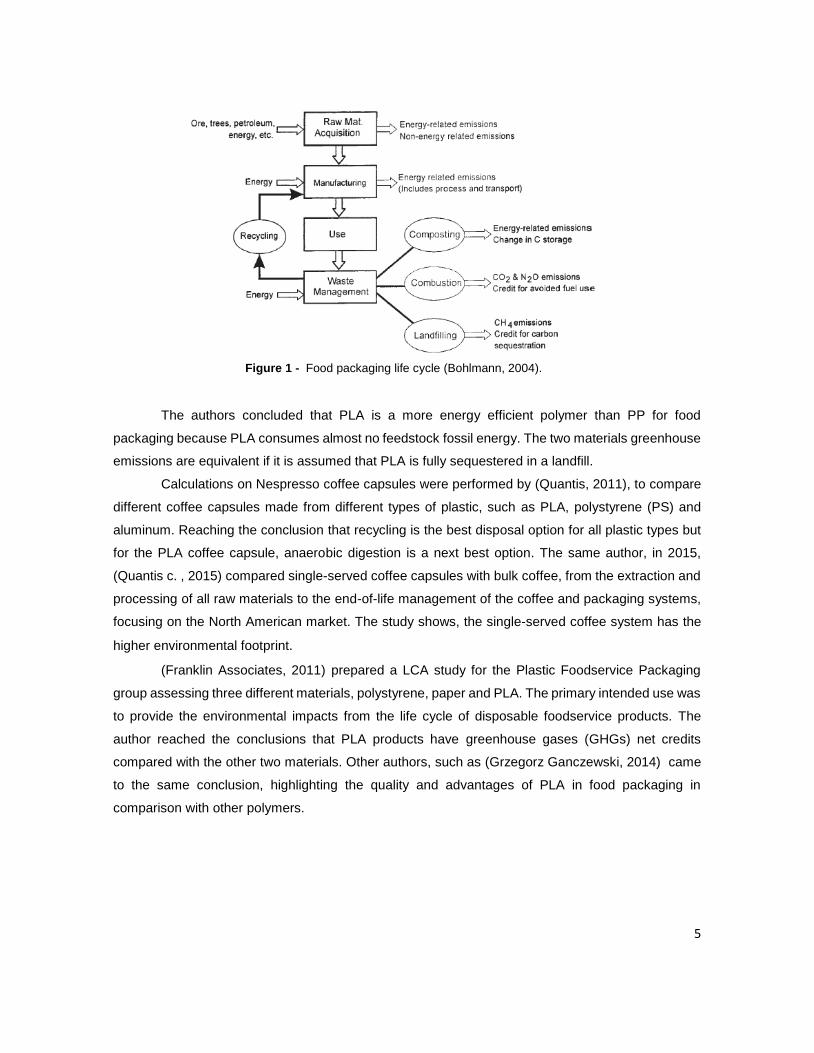
Figure 1 represents the system boundaries of the study, and the waste management
representation is acceptable because a combination of source reduction, recycling, incineration, and
composting is being developed as an alternative to landfilling packaging waste.
5
The authors concluded that PLA is a more energy efficient polymer than PP for food
packaging because PLA consumes almost no feedstock fossil energy. The two materials greenhouse
emissions are equivalent if it is assumed that PLA is fully sequestered in a landfill.
Calculations on Nespresso coffee capsules were performed by (Quantis, 2011), to compare
different coffee capsules made from different types of plastic, such as PLA, polystyrene (PS) and
aluminum. Reaching the conclusion that recycling is the best disposal option for all plastic types but
for the PLA coffee capsule, anaerobic digestion is a next best option. The same author, in 2015,
(Quantis c. , 2015) compared single-served coffee capsules with bulk coffee, from the extraction and
processing of all raw materials to the end-of-life management of the coffee and packaging systems,
focusing on the North American market. The study shows, the single-served coffee system has the
higher environmental footprint.
(Franklin Associates, 2011) prepared a LCA study for the Plastic Foodservice Packaging
group assessing three different materials, polystyrene, paper and PLA. The primary intended use was
to provide the environmental impacts from the life cycle of disposable foodservice products. The
author reached the conclusions that PLA products have greenhouse gases (GHGs) net credits
compared with the other two materials. Other authors, such as (Grzegorz Ganczewski, 2014) came
to the same conclusion, highlighting the quality and advantages of PLA in food packaging in
comparison with other polymers.
Figure 1 - Food packaging life cycle (Bohlmann, 2004).
6
2.2 Waste management life cycle assessment
Numerous studies have also taken place trying to determine the optimal disposal method for
plastic waste. They have compared different disposal scenarios of landfilling, incineration, recycling
or a combination of the above by using the LCA tool.
(V. Rossi, 2015) compared the environmental impacts coming from the disposal of two
different biodegradable plastics, PLA and thermoplastic elastomers (TPS). Among the possible
treatment alternatives, six end-of-life options were selected and evaluated. The study concluded that
mechanical recycling and incineration with energy recovery has the smallest environmental impact
while industrial composting has the largest environmental impact. (Turconi, 2011) compared waste
incineration with energy recovery of municipal solid waste in two European countries, Italy and
Denmark. This study concluded that the Danish system was better than the Italian system, mainly
because of higher heat recovery. (Piemonte, 2011) assessed the environmental impacts of the best
final disposition of bioplastic wastes in order to maximize the energy savings. This study
demonstrates how incineration, composting and anaerobic digestion processes are clearly under-
performing, from an environmental point of view, with respect to the mechanical recycling process.
(Lasse Tobiasen, 2014), assessed incineration and anaerobic digestion, two thermal
treatment options. Reaching the conclusion that for an energy system with district heating as an
option, the energy recovery from incineration is much higher than anaerobic digestion. (Max J.Krause,
2016) performed a study based on PLA landfilling and reached the conclusion that PLA under certain
temperatures becomes a carbon sink in landfills and doesn’t biodegrade.
2.3 Directives of plastic packaging waste
Despite the high environmental impacts caused by the disposal of plastic waste, there is no
actual legislation about the waste treatment of plastic in Europe. However, there are EU directives
framing the policy that member countries must adopt (Biener, 2013).
The European Packaging and Packaging Waste Directive 94/62/EC was established to deal
with packaging waste issues, obliging member states to meet targets for the recovery and recycling
of packaging waste. Those targets are related to the use of recycled packaging materials in the
manufacturing of packaging and other products, the reuse of products already purchased and also
require for the manufacturing companies to design packaging that can be recovered or recycled
(European Union, 1994). The European Bioplastics association wants to improve this directive, to
clarify the definition of biodegradable and compostable plastics and to allow bio-based plastic to enter
all waste collection and treatment systems, including mechanical recycling and energetic recovery
(Bioplastics, European Bioplastics, 2017).
7
2.4 Directives of bio-waste management
The Waste Framework Directive (2008/98/EC) established a target for biological treatment, that
in the future, must go hand-in-hand with enhanced separate collection to ensure good quality of
compost and digestate. To achieve that target, on 2 July of 2014, the European Commission came
up with a proposal relating to bio-waste, which included: 1) Recycling and preparing for re-use of
municipal waste (including bio-waste) to be increased to 70 % by 2030; 2) Phasing out landfilling by
2025 for recyclable items (including plastics, paper, and bio-waste); 3) Measures aimed at reducing
food waste generation by 30 % by 2025 and 4) Introduction of separate collection of bio-waste (EU
Comission, 2016).
8
Chapter 3
Scientific background and methodology
This section gives a brief overview of the concept Biogenic Carbon Cycle and outlines the
theoretical framework of the LCA study.
3.1 Biogenic carbon cycle
Carbon is ubiquitous in Earth’s system and is in continuous and rapid circulation among carbon
reservoirs on land, in the ocean, and in the atmosphere. Carbon resides in the atmosphere mostly as
carbon dioxide (CO2), but also as methane (CH4), carbon monoxide (CO), and a variety of minor
compounds. Through photosynthesis, plants take up carbon from the atmosphere to produce wood,
sugars, carbohydrates, and other plant products that are, in turn, consumed by animals for food,
shelter, and energy (IPCC, 2007c; King et al., 2007).
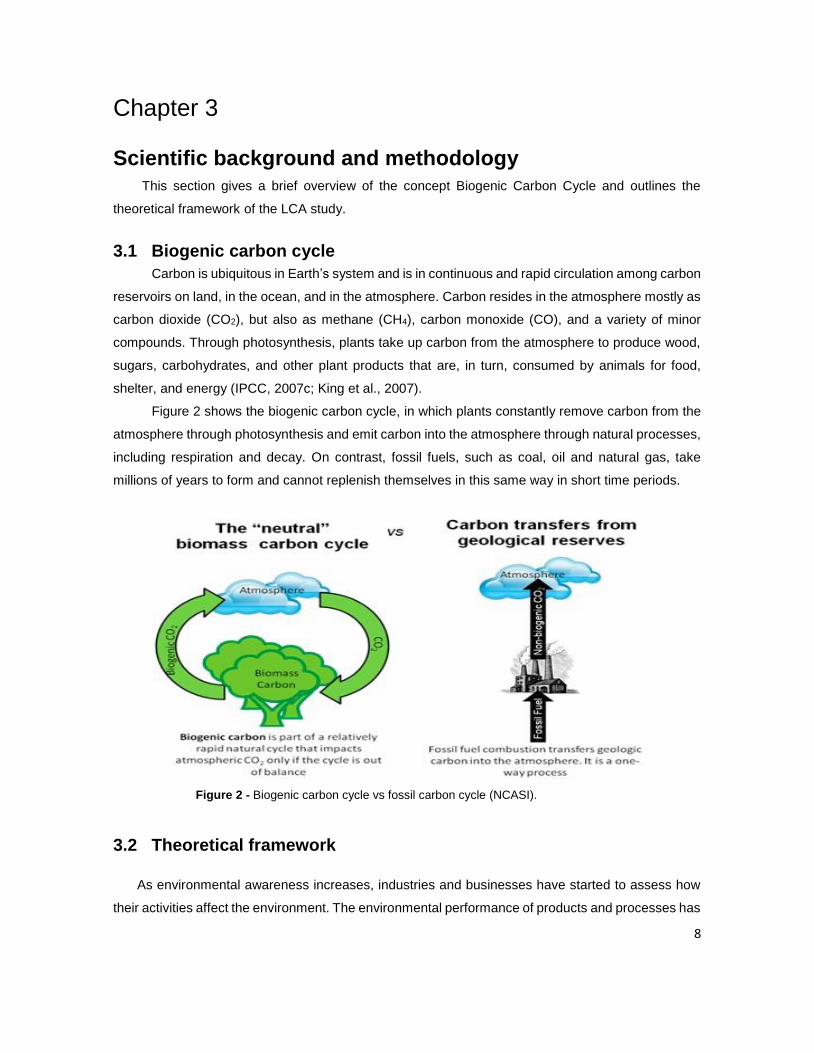
Figure 2 shows the biogenic carbon cycle, in which plants constantly remove carbon from the
atmosphere through photosynthesis and emit carbon into the atmosphere through natural processes,
including respiration and decay. On contrast, fossil fuels, such as coal, oil and natural gas, take
millions of years to form and cannot replenish themselves in this same way in short time periods.
3.2 Theoretical framework
As environmental awareness increases, industries and businesses have started to assess how
their activities affect the environment. The environmental performance of products and processes has
Figure 2 - Biogenic carbon cycle vs fossil carbon cycle (NCASI).
9
become a key issue, which is why some companies are investigating ways to minimize their effects
on the environment. Many companies have found it advantageous to explore ways of moving beyond
compliance using pollution prevention strategies and environmental management systems to improve
their environmental performance. An LCA, a concept that considers the entire life cycle of a product
help companies to achieve this. A life cycle assessment is a cradle-to-grave approach for assessing
industrial systems. Cradle-to-grave begins with the gathering of raw materials from the earth to create
the product and ends at the point when all materials are returned to the earth. LCA evaluates all
stages of a product's life from the perspective that they are interdependent, meaning that one
operation leads to the next (United States Environmental Protection Agency, 2001).
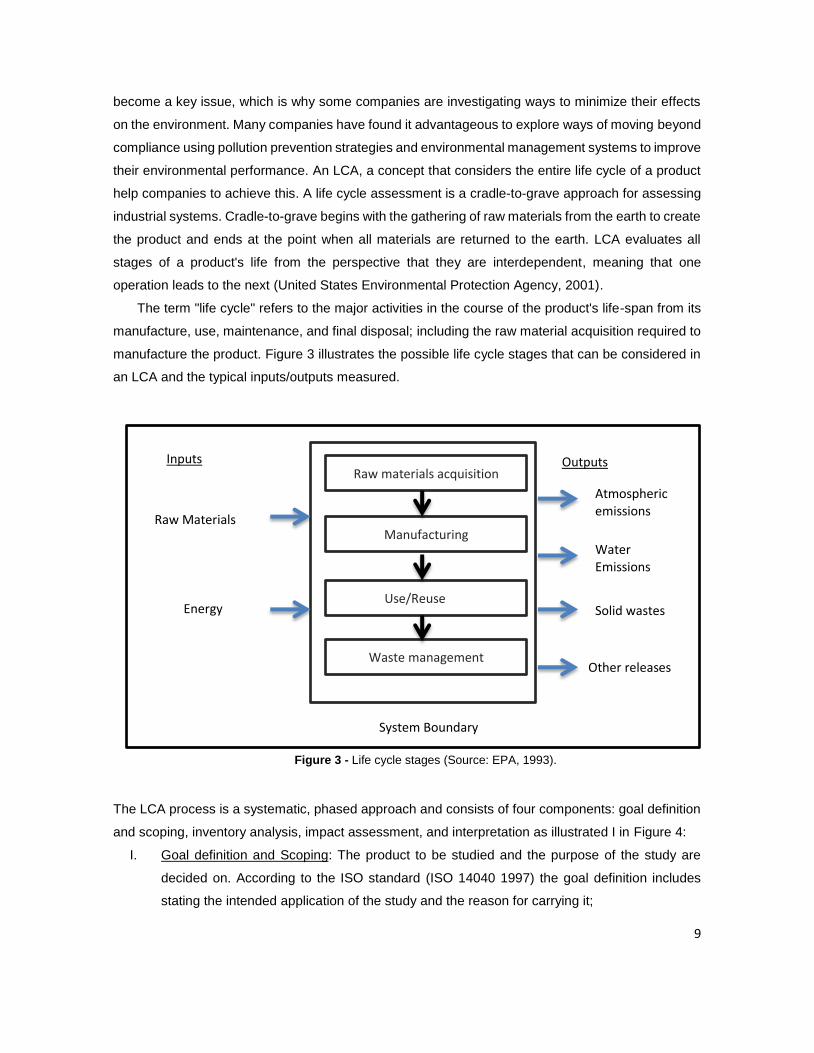
The term "life cycle" refers to the major activities in the course of the product's life-span from its
manufacture, use, maintenance, and final disposal; including the raw material acquisition required to
manufacture the product. Figure 3 illustrates the possible life cycle stages that can be considered in
an LCA and the typical inputs/outputs measured.
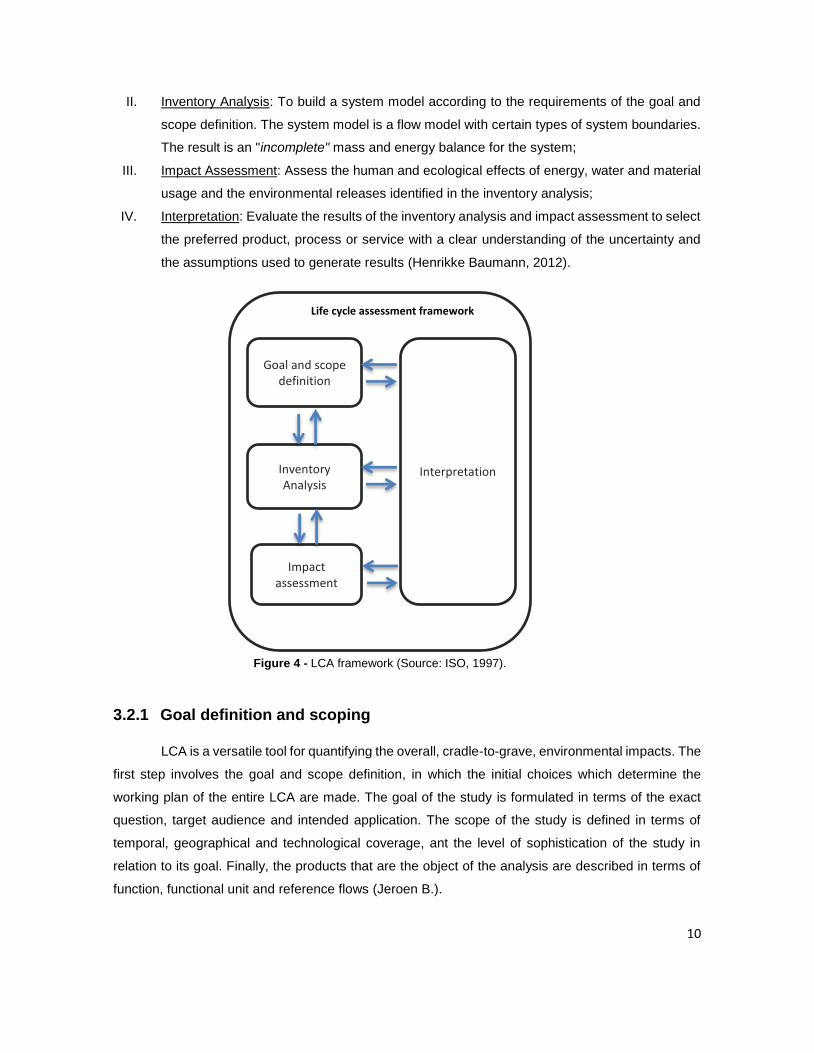
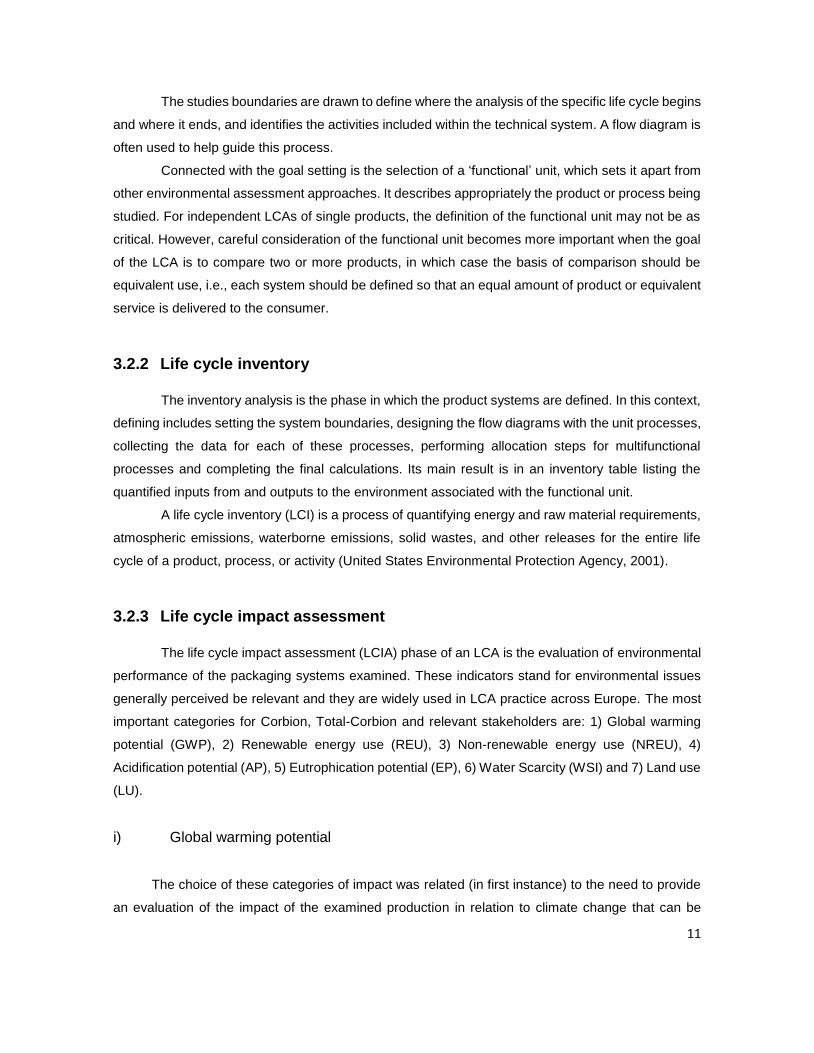
The LCA process is a systematic, phased approach and consists of four components: goal definition
and scoping, inventory analysis, impact assessment, and interpretation as illustrated I in Figure 4:
I. Goal definition and Scoping: The product to be studied and the purpose of the study are
decided on. According to the ISO standard (ISO 14040 1997) the goal definition includes
stating the intended application of the study and the reason for carrying it;
Inputs Outputs
Raw Materials
Energy
Atmospheric emissions
Water Emissions
Solid wastes
Other releases
Raw materials acquisition
Manufacturing
Use/Reuse
Waste management
System Boundary
Figure 3 - Life cycle stages (Source: EPA, 1993).
10
II. Inventory Analysis: To build a system model according to the requirements of the goal and
scope definition. The system model is a flow model with certain types of system boundaries.
The result is an "incomplete" mass and energy balance for the system;
III. Impact Assessment: Assess the human and ecological effects of energy, water and material
usage and the environmental releases identified in the inventory analysis;
IV. Interpretation: Evaluate the results of the inventory analysis and impact assessment to select
the preferred product, process or service with a clear understanding of the uncertainty and
the assumptions used to generate results (Henrikke Baumann, 2012).
3.2.1 Goal definition and scoping
LCA is a versatile tool for quantifying the overall, cradle-to-grave, environmental impacts. The
first step involves the goal and scope definition, in which the initial choices which determine the
working plan of the entire LCA are made. The goal of the study is formulated in terms of the exact
question, target audience and intended application. The scope of the study is defined in terms of
temporal, geographical and technological coverage, ant the level of sophistication of the study in
relation to its goal. Finally, the products that are the object of the analysis are described in terms of
function, functional unit and reference flows (Jeroen B.).
Life cycle assessment framework
Goal and scope definition
Inventory Analysis
Impact assessment
Interpretation
Figure 4 - LCA framework (Source: ISO, 1997).
11
The studies boundaries are drawn to define where the analysis of the specific life cycle begins
and where it ends, and identifies the activities included within the technical system. A flow diagram is
often used to help guide this process.
Connected with the goal setting is the selection of a ‘functional’ unit, which sets it apart from
other environmental assessment approaches. It describes appropriately the product or process being
studied. For independent LCAs of single products, the definition of the functional unit may not be as
critical. However, careful consideration of the functional unit becomes more important when the goal
of the LCA is to compare two or more products, in which case the basis of comparison should be
equivalent use, i.e., each system should be defined so that an equal amount of product or equivalent
service is delivered to the consumer.
3.2.2 Life cycle inventory
The inventory analysis is the phase in which the product systems are defined. In this context,
defining includes setting the system boundaries, designing the flow diagrams with the unit processes,
collecting the data for each of these processes, performing allocation steps for multifunctional
processes and completing the final calculations. Its main result is in an inventory table listing the
quantified inputs from and outputs to the environment associated with the functional unit.
A life cycle inventory (LCI) is a process of quantifying energy and raw material requirements,
atmospheric emissions, waterborne emissions, solid wastes, and other releases for the entire life
cycle of a product, process, or activity (United States Environmental Protection Agency, 2001).
3.2.3 Life cycle impact assessment
The life cycle impact assessment (LCIA) phase of an LCA is the evaluation of environmental
performance of the packaging systems examined. These indicators stand for environmental issues
generally perceived be relevant and they are widely used in LCA practice across Europe. The most
important categories for Corbion, Total-Corbion and relevant stakeholders are: 1) Global warming
potential (GWP), 2) Renewable energy use (REU), 3) Non-renewable energy use (NREU), 4)
Acidification potential (AP), 5) Eutrophication potential (EP), 6) Water Scarcity (WSI) and 7) Land use
(LU).
i) Global warming potential
The choice of these categories of impact was related (in first instance) to the need to provide
an evaluation of the impact of the examined production in relation to climate change that can be
12
readily communicated to and understood by the consumer, by GWP. Global warming potential
measures contribution to the “greenhouse effect”. The greenhouse effect refers to the ability of some
atmospheric gases to retain heat that is radiating from the earth.
ii) Renewable and non-renewable energy consumption
The non-renewable energy source category was selected to provide a view of the impacts of
the consumption, which is considered one of the most critical issues in the primary sector, because
reveals how much energy is required to produce a product or service throughout its life cycle.
iii) Acidification potential
Acidification potential is regarded as a regional effect, and it’s caused by releases of protons
in the terrestrial or aquatic ecosystems. Acidifying pollutants have a wide variety of impacts on soil,
groundwater, surface waters, biological organisms, ecosystems and materials. The major acidifying
pollutants are sulfur dioxide (SO2), nitrogen oxides (NOx) and nitrogen hydroxides (NHx).
iv) Eutrophication potential
Eutrophication potential covers all potential impacts of excessively high environmental levels
of macronutrients, the most important of which are nitrogen and phosphorus. Nutrient enrichment
may cause an undesirable shift in species composition and elevated biomass production in both
aquatic and terrestrial ecosystems. In aquatic ecosystems increased biomass production may lead
to a depressed oxygen levels, because of the additional consumption of oxygen in biomass
decomposition. As emissions of degradable organic matter have a similar impact, such emissions are
also treated under the impact category “eutrophication”.
v) Water scarcity
The water footprint (WF) has been developed within the water resources research community
as a volumetric measure of freshwater appropriation. With the purpose of integrating the WF in life
cycle assessment of products, LCA scholars have proposed to weight the original volumetric WF by
the water scarcity in the catchment where the WF is located, thus obtaining a water-scarcity weighted
WF that reflects the potential local environmental impact of water consumption (Hoekstra, 2016).
13
vi) Land use
The impact category land use reflects the damage to ecosystems due to the effects of
occupation and transformation of land. Examples of land use are agricultural production, mineral
extraction and human settlement. Occupation of land can be defined as the maintenance of an area
in a particular state over a particular time period. Transformation is the conversion of land from one
state to another state, e.g. from its original state to an altered state or from an altered state to another
altered state. Often transformation is followed by occupation, or occupation takes place in an area
that has previously been transformed.
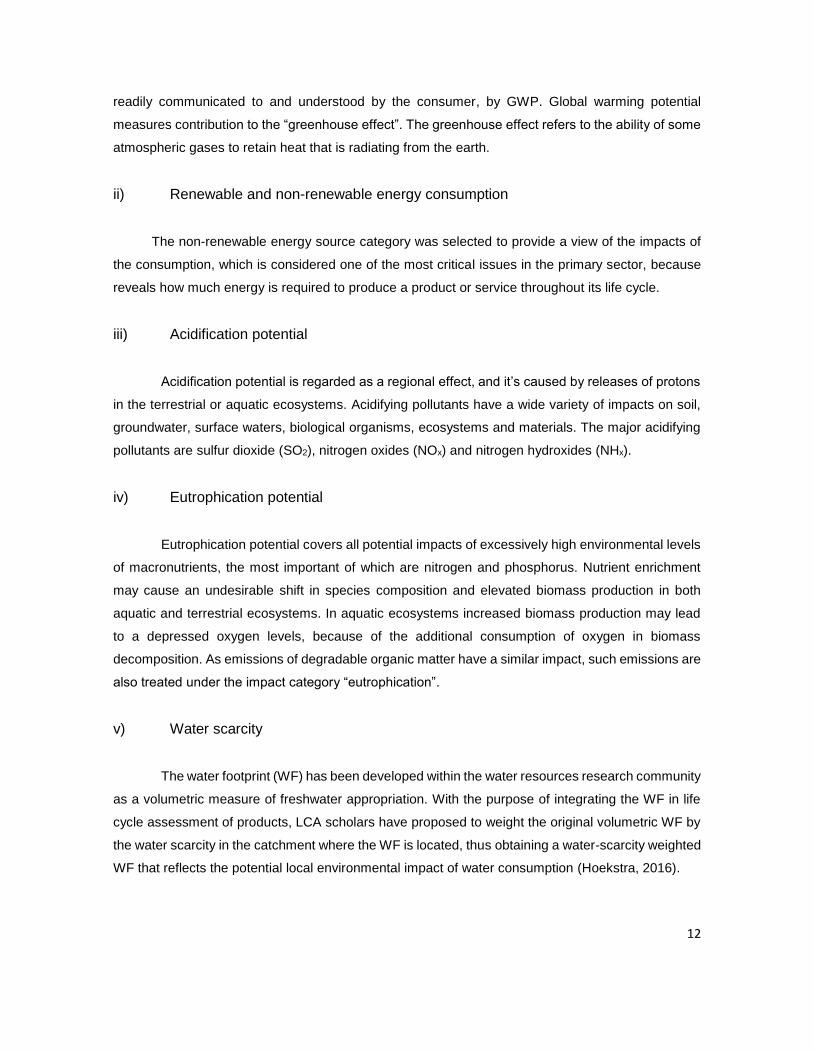
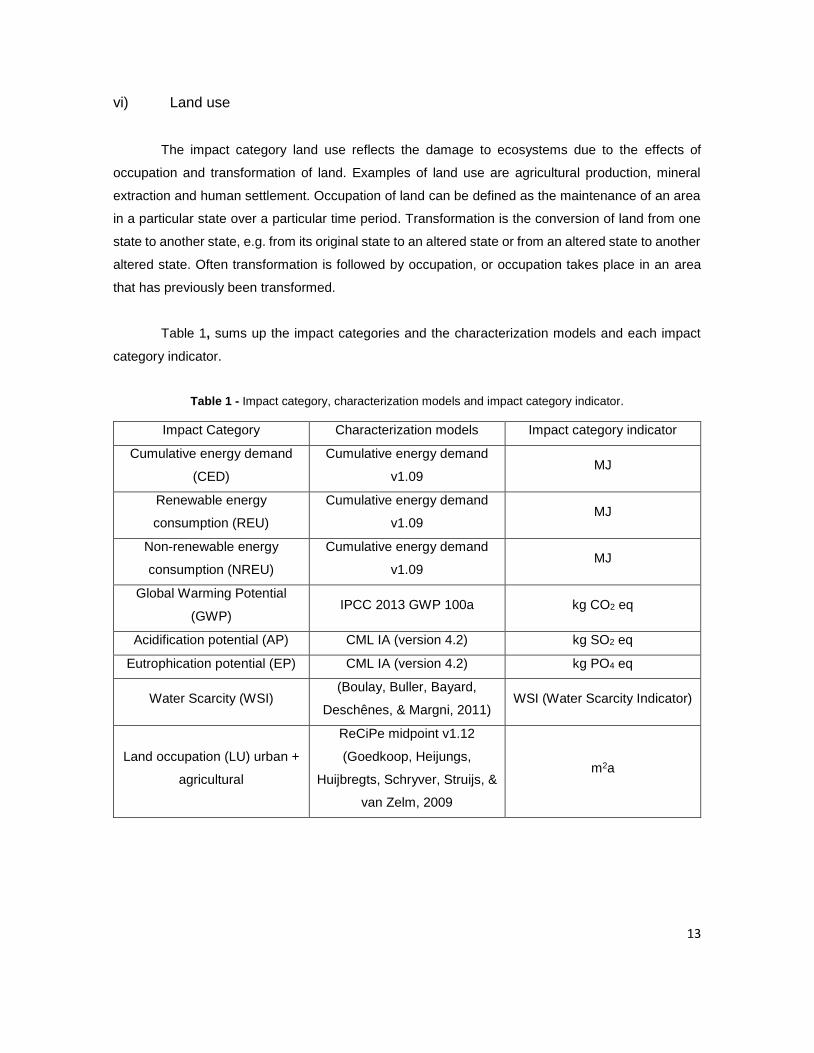
Table 1, sums up the impact categories and the characterization models and each impact
category indicator.
Table 1 - Impact category, characterization models and impact category indicator.
Impact Category Characterization models Impact category indicator
Cumulative energy demand
(CED)
Cumulative energy demand
v1.09 MJ
Renewable energy
consumption (REU)
Cumulative energy demand
v1.09 MJ
Non-renewable energy
consumption (NREU)
Cumulative energy demand
v1.09 MJ
Global Warming Potential
(GWP) IPCC 2013 GWP 100a kg CO2 eq
Acidification potential (AP) CML IA (version 4.2) kg SO2 eq
Eutrophication potential (EP) CML IA (version 4.2) kg PO4 eq
Water Scarcity (WSI) (Boulay, Buller, Bayard,
Deschênes, & Margni, 2011) WSI (Water Scarcity Indicator)
Land occupation (LU) urban +
agricultural
ReCiPe midpoint v1.12
(Goedkoop, Heijungs,
Huijbregts, Schryver, Struijs, &
van Zelm, 2009
m2a
14
3.2.4 Life cycle interpretation
Life cycle interpretation is a systematic technique to identify, quantify, check, and evaluate
information from the results of the LCI and the LCIA, and communicate them effectively. Life cycle
interpretation is the last phase of the LCA process. The International Organization for Standardization
has defined the following two objectives of the life cycle interpretation:
1. Analyze results, reach conclusions, explain limitations and provide recommendations based
on the findings of the preceding phases of the LCA and to report the results of the life cycle
interpretation in a transparent manner;
2. Provide a readily understandable, complete and consistent presentation of the results of an
LCA study, in accordance with the goal and scope of the study (ISO 1998b).
3.2.5 Implementation
The LCA analysis was performed by using the SimaPro 8.4 software that implements several
LCA methodologies. In particular, the Intergovernmental Panel on Climate Change (IPCC) is used for
the assessment of global warming, which is a “mid-point” method. (Levenmore, 2008). The “end-point”
method used was LCA Lactide 2016 V1.01, which includes the most important impact categories of
the mid-point level, such as GWP, non-renewable and renewable energy, eutrophication, acidification,
water scarcity and land use. The development of the life cycle inventories has been carried out by
using, petroleum-based plastics, bio-waste and agricultural data included in the Ecoinvent v3.3
database. This database includes information on the production of energy, extraction and processing
of raw materials, transportation and production processes (Frischknocht R, 2007).
3.2.6 Identification of key concepts
i) Multifunctionality and allocation
A multifunctionality problem occurs in an LCA when a process fulfils one or more functions for
the investigated product’s life cycle, and a different function (or functions) for other products (Ekvall,
2001). To solve a multifunctionality problem, ISO 14044:2006 (International Standard ISO 14044,
2006) suggests a three-step procedure. The distribution of impacts between a product and coproduct
based on a specific criterion (i.e. allocation) should be avoided “wherever possible”, either by dividing
multifunctional processes into sub-processes or by expanding the product system to include the
additional functions related to the by-products.
Weidema and Schmidt (Weidema, 2010) state that system expansion always respects the mass
and energy conservation laws, while allocation nearly always fails to do so. According to those
15
authors, since allocation breaks the original system into two or more artificial systems according to
the allocation criterion adopted, the only balance observed is given by that criterion, i.e. when mass
regulates allocation, only mass conservation is respected.
Allocation is the partitioning of the input and output flows (emissions/resource use) to the
products of a unit process. The system of waste incineration is a multi-input/multi-output problem
because various waste fractions enter the system and various outputs (the service waste treatment,
energy, and recycling products) leave it. Therefore, an allocation is necessary.
16
Chapter 4
Life cycle assessment of PLA food packaging
This chapter begins by defining the goal and scope of the project, followed by a life cycle inventory
analysis and ends up with results and their discussion.
4.1 Goal and scope definition
This section describes the goal and scope of the LCA. It includes the objectives, a description of
the product function and product system.
4.1.1 Goal
The general goal of the project is to quantify the environmental footprint of different PLA food
packaging products including the organic waste through an LCA, focusing on the end-of-life options.
The study analyses different alternatives, such as incineration with energy recovery, composting,
anaerobic digestion and landfill.
4.1.2 Objectives
This project compares packaging systems with specific designs, such as coffee cups, coffee
capsules, tea bags, yogurt cups and cucumber wraps.
The specific objectives of this study are to:
I. Establish credible and transparent profiles of the potential life cycle environmental impacts of
different systems;
II. Evaluate and compare environmental impacts of food packaging (including food waste) waste
management systems including incineration, industrial composting, landfilling and anaerobic
digestion;
III. Identify the contribution of the different life cycle stages to the overall impact.
17
4.1.3 Scope
i) Functional unit
A life cycle assessment relies on a functional unit as a reference to evaluate the components
within a single system and or among multiple systems on a common basis. It is therefore critical that
this parameter be clearly defined and measurable.
The functional unit (FU) – the quantitative reference used for all inventory calculations and impact
evaluations – is:
" 1 kg of PLA food packaging including food waste from households"
ii) General description of the studied product systems
The use of PLA in packaging has largely increased over the last few years. Research is being
performed by both academia and industry with collaborative works between the two to strengthen the
green-packaging market to meet consumer demands for packaging derived from renewable
resources (S.Obuchi, 2010).
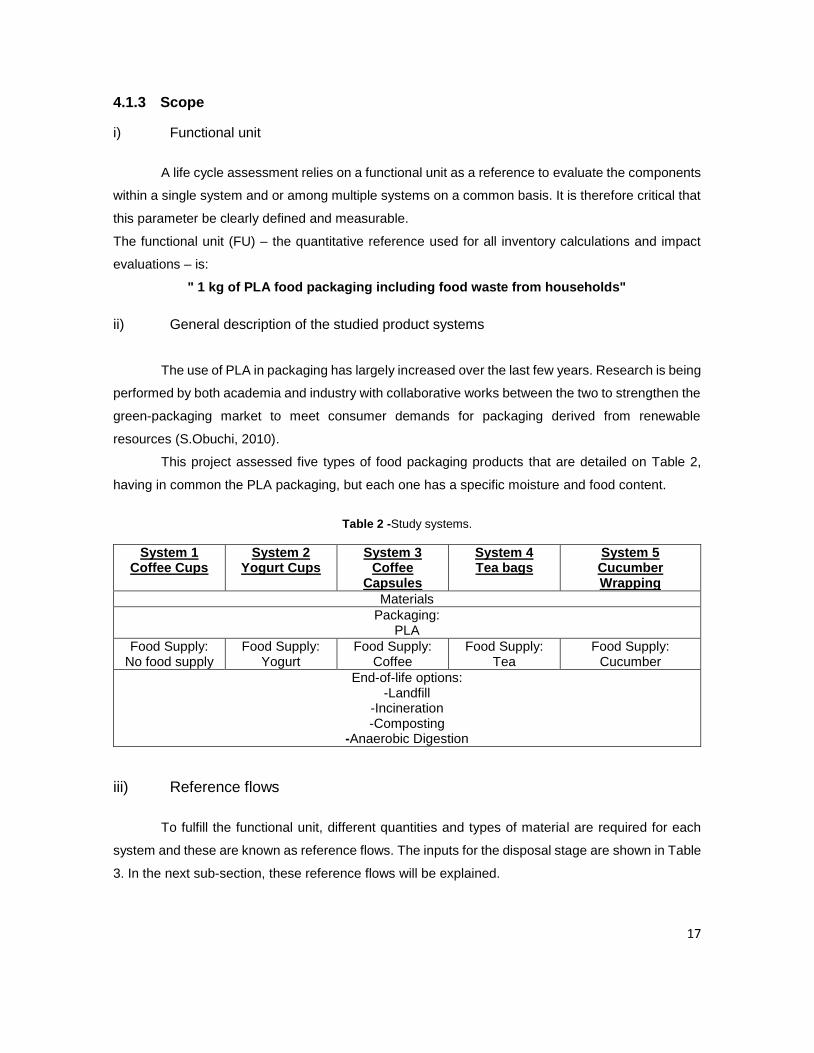
This project assessed five types of food packaging products that are detailed on Table 2,
having in common the PLA packaging, but each one has a specific moisture and food content.
Table 2 -Study systems.
System 1 Coffee Cups
System 2 Yogurt Cups
System 3 Coffee
Capsules
System 4 Tea bags
System 5 Cucumber Wrapping
Materials
Packaging: PLA
Food Supply: No food supply
Food Supply: Yogurt
Food Supply: Coffee
Food Supply: Tea
Food Supply: Cucumber
End-of-life options: -Landfill
-Incineration -Composting
-Anaerobic Digestion
iii) Reference flows
To fulfill the functional unit, different quantities and types of material are required for each
system and these are known as reference flows. The inputs for the disposal stage are shown in Table
3. In the next sub-section, these reference flows will be explained.
18
Table 3 - Reference flows after consumer's use.
Material per FU Coffee Cups
Yogurt Cups
Coffee Capsules
Tea bags
Cucumber Wrapping
PLA Packaging (kg/FU) 1 1 1 1 1
Dry organic matter (kg/FU)
0 0.1 3.4 5.7 1.4
Moisture content (kg/FU) 0 0.6 7.4 30.3 36.2
Total (kg/FU) 1 1.7 11.8 37 38.6
iv) Description of the system
This study assesses the life cycle of food packaging using single-serve products, from the
extraction and processing of all raw materials to the end-of-life of the food matter and its packaging
system. The five different systems were chosen on account of the fact that this project seeks to
address a wide range of products with different moisture and organic contents. In the case of the
coffee cup, it was modeled to represent the dry biodegradable packaging without food contamination.
The system boundaries identify the life cycle stages, processes, and flows considered in the
LCA and should include all activities relevant to attaining the above-mentioned study objectives.
Figure 5, describes the total amount of waste and the contribution of the packaging, food
waste and water to each system. The tea bag, for example, has a light pouch, which means that for
1 kg of PLA, there will be almost 6 kg of food matter. That is why there is a higher peak on the green
line for the tea bag.
Figure 5 - Description of five different food packaging systems.
0
5
10
15
20
25
30
35
40
45
Coffee cups Yogurt cups Coffee capsules Tea bags Cucumberwrapping
kg w
aste
(kg
)
Food matter PLA Water Food matter + PLA Total amount waste
1 kg PLA
19
All the systems covered the full packaging life cycle, including primary material production,
transformation into polymer resin, packaging manufacturing as well as end-of-life treatment. The
waste management alternatives assessed in the systems are anaerobic digestion, industrial
composting, incineration and landfill.
As illustrated in the next figures, the flow diagrams provide an outline of all the major unit
processes to be modeled, including the following inter-relationships: 1) Food supply; 2) Materials and
production; 3) Distribution; 4) Use and 5) End-of-life.
20
End-of-life
Anaerobic digestion
Composting
Incineration
Landfilling
Avoided electricity and heat production
Avoided soil conditioners
Avoided electricity and heat production and fertilizers
T
Waste management and emissions
Legend:
Supply and Resources
Material and Manufacturing
T Sugar Cane Agriculture -Sugar Cane -Fertilizers
T Lactic Acid production
PLA production
T Compounding PLA -PLA & Mineral fillers
T Sheet Formation & Thermoforming
Coffee Cups
T
Distribution
Supermarket
Regional storage
T
T
T
T
T
Coffee Cups
Use
T
Raw material Process Excluded process/stage T T
Transport
Excluded
Figure 6 - Life cycle of coffee cups.
21
Use
Supply and Resources
Yogurt Supply
Milk production
Yogurt production
T
Material and Production
Production center - Assembly of packaging with yogurt
T Yogurt cup primary packaging material
- PLA
T
Distribution
T Supermarket
Regional storage
T
T
Yogurt Cup
End-of-life
Anaerobic digestion
Composting Incineration Landfilling
Avoided electricity and heat production
Avoided soil conditioners
Avoided electricity and heat production and fertilizers
T T T T
Waste management and emissions
Legend:
Spoon Refrigerator
Figure 7 - Life cycle of yogurt cups.
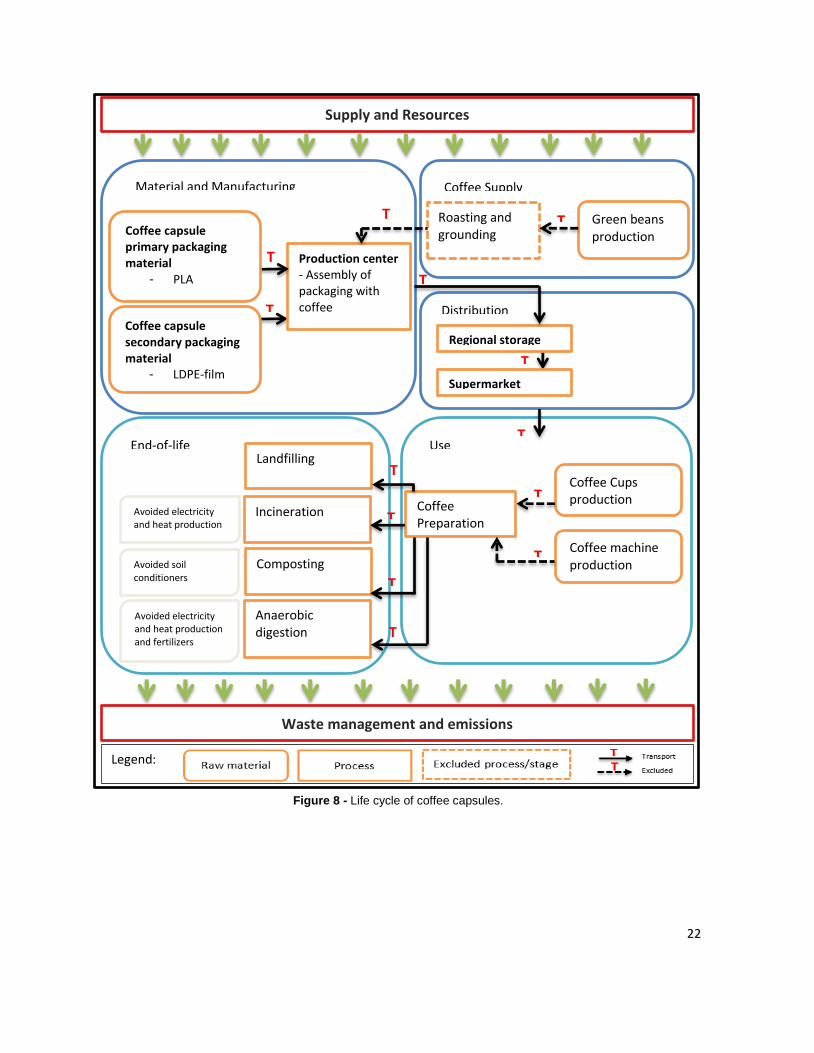
22
Use
Supply and Resources
Coffee Supply
Green beans production
Roasting and grounding
T
Material and Manufacturing
T
Production center - Assembly of packaging with coffee
Coffee capsule secondary packaging material
- LDPE-film
T
Coffee capsule primary packaging material
- PLA - Nitrogen
T
Distribution
T
Supermarket
Regional storage
T
T
Coffee Cups production
Coffee machine production
T Coffee Preparation
T
End-of-life
Anaerobic digestion
Composting
Incineration
Landfilling
Avoided electricity and heat production
Avoided soil conditioners
Avoided electricity and heat production and fertilizers
T
T
T
T
Waste management and emissions
Legend:
Figure 8 - Life cycle of coffee capsules.
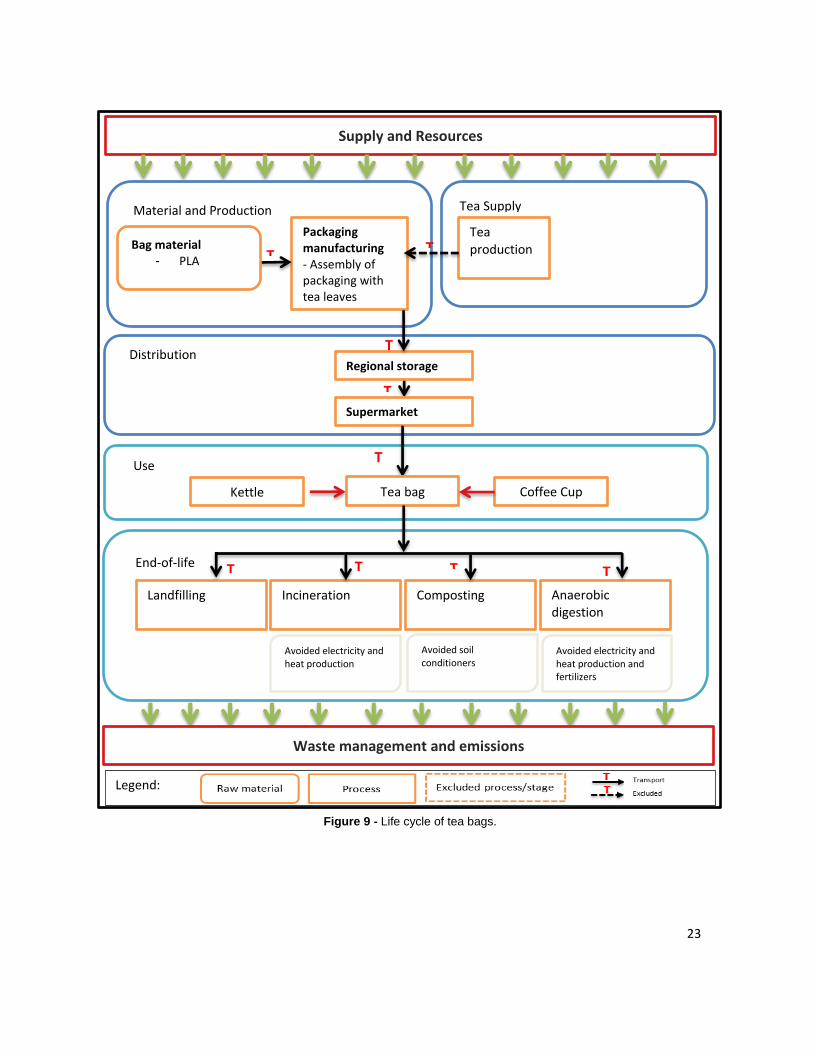
23
Use
Supply and Resources
Tea Supply
Tea production
Material and Production
Packaging manufacturing - Assembly of packaging with tea leaves
T Bag material
- PLA
T
Distribution
T Supermarket
Regional storage
T
T
Tea bag
End-of-life
Anaerobic digestion
Composting Incineration Landfilling
Avoided electricity and heat production
Avoided soil conditioners
Avoided electricity and heat production and fertilizers
T T T T
Waste management and emissions
Legend:
Coffee Cup Kettle
Figure 9 - Life cycle of tea bags.
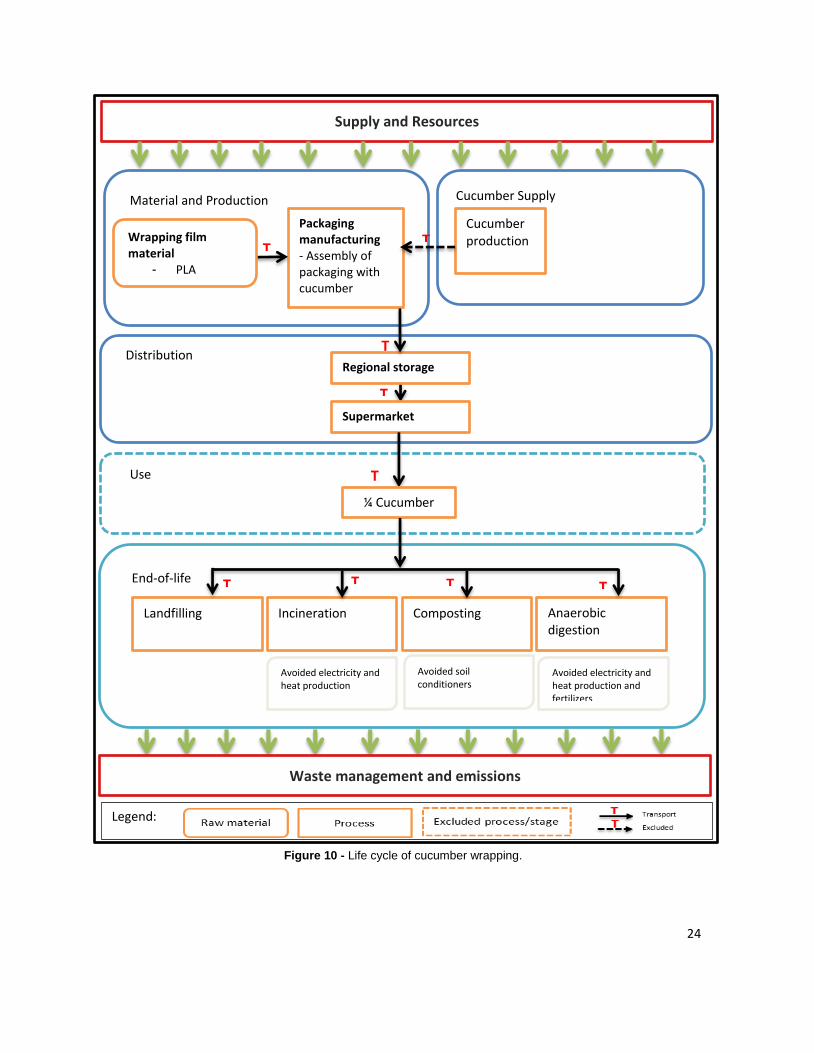
24
Use
Supply and Resources
Cucumber Supply
Cucumber production
Material and Production
Packaging manufacturing - Assembly of packaging with cucumber
T Wrapping film material
- PLA
T
Distribution
T
Supermarket
Regional storage
T
T
¼ Cucumber
End-of-life
Anaerobic digestion
Composting Incineration Landfilling
Avoided electricity and heat production
Avoided soil conditioners
Avoided electricity and heat production and fertilizers
T T T T
Waste management and emissions
Legend:
Figure 10 - Life cycle of cucumber wrapping.
25
v) Temporal and geographic boundaries
This LCA is representative of the waste treatment industry in Europe at the time the study is
conducted (2017). It should be noted, however, that certain processes within the system boundaries
may take place anywhere. Europe has been chosen as the region of disposal. These are "average"
scenarios which could be representative for Europe but that could vary from country to country.
4.2 Life cycle inventory analysis
The quality of the LCA results depends on the quality of the data used in the evaluation. Every
effort was made to rely on the most credible and representative information available in this study.
An inventory analysis produces a list containing the quantities of pollutants released to the
environment and the amount of energy and material consumed. The results can be segregated by
life cycle stage, by media (air, water, land), by specific processes, or any combination thereof. Primary
data was collected directly from Corbion on PLA production and from direct measurements and
calculations from the primary materials and material weights.
Additional information describing the remaining aspects of life cycle was collected from a
variety of scientific articles published by different journals and from Quantis LCA publications and
from the Ecoinvent database, which is the main source for secondary LCA data.
4.2.1 Food supply
As mention before, there are five different systems with different specifications, but only four
have food content. The dataset used for the four models were taken from the Ecoinvent database
and its described in Table 4.
Table 4 - Food supply.
Type of food Ecoinvent v3.3 model Country
Yogurt Yogurt, from cow milk {RoW}|production Canada
Coffee Coffee, green bean {IN}| coffee green bean production,
robusta India
Tea Leaves Tea, dried {KE}| tea production, dried Kenya
Cucumber Cucumber {GLO}|production Switzerland
4.2.2 Material and manufacturing
26
i) PLA feedstock
PLA is a thermoplastic material with rigidity and clarity similar to PS or poly(ethylene
terephthalate) (PET). End uses of PLA are in rigid packaging, flexible film packaging, hot drink cups,
apparel and staple fiber, injection moulded products and so on (Wim Groot, 2010). PLA can be
produced by open ring polymerization directly from its basic building block lactic acid, which is derived
by fermentation of sugars from carbohydrate sources such as corn, sugarcane or tapioca.
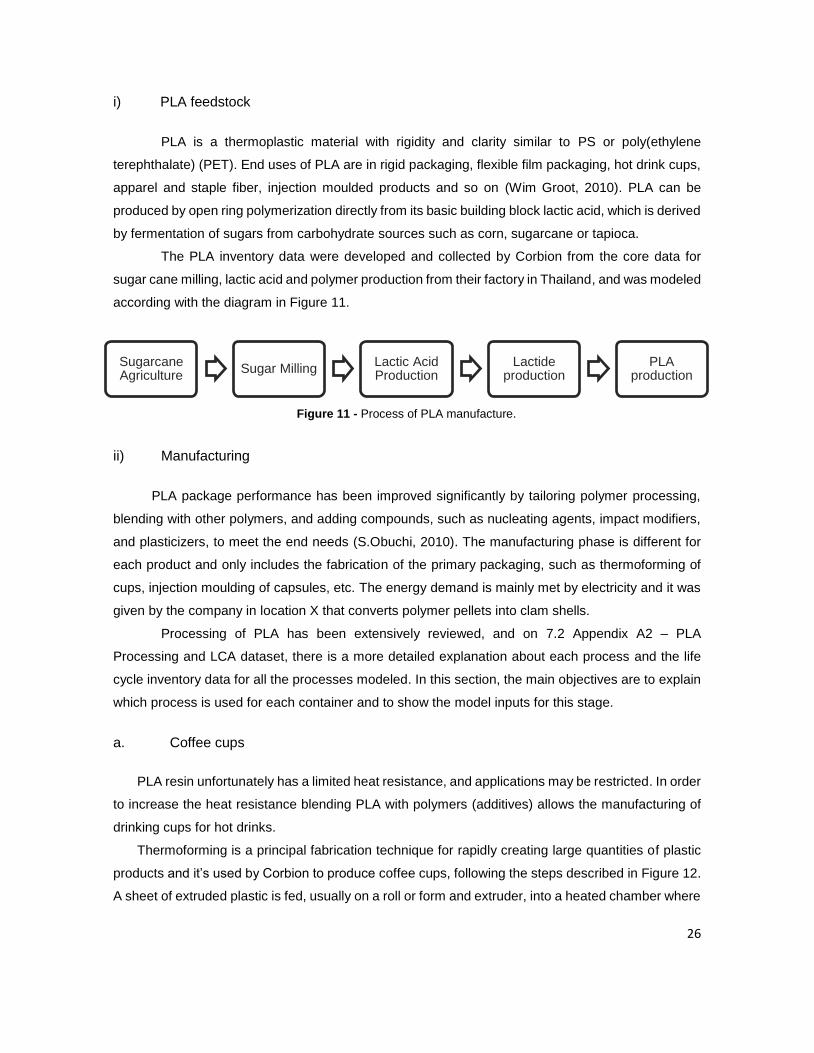
The PLA inventory data were developed and collected by Corbion from the core data for
sugar cane milling, lactic acid and polymer production from their factory in Thailand, and was modeled
according with the diagram in Figure 11.
ii) Manufacturing
PLA package performance has been improved significantly by tailoring polymer processing,
blending with other polymers, and adding compounds, such as nucleating agents, impact modifiers,
and plasticizers, to meet the end needs (S.Obuchi, 2010). The manufacturing phase is different for
each product and only includes the fabrication of the primary packaging, such as thermoforming of
cups, injection moulding of capsules, etc. The energy demand is mainly met by electricity and it was
given by the company in location X that converts polymer pellets into clam shells.
Processing of PLA has been extensively reviewed, and on 7.2 Appendix A2 – PLA
Processing and LCA dataset, there is a more detailed explanation about each process and the life
cycle inventory data for all the processes modeled. In this section, the main objectives are to explain
which process is used for each container and to show the model inputs for this stage.
a. Coffee cups
PLA resin unfortunately has a limited heat resistance, and applications may be restricted. In order
to increase the heat resistance blending PLA with polymers (additives) allows the manufacturing of
drinking cups for hot drinks.
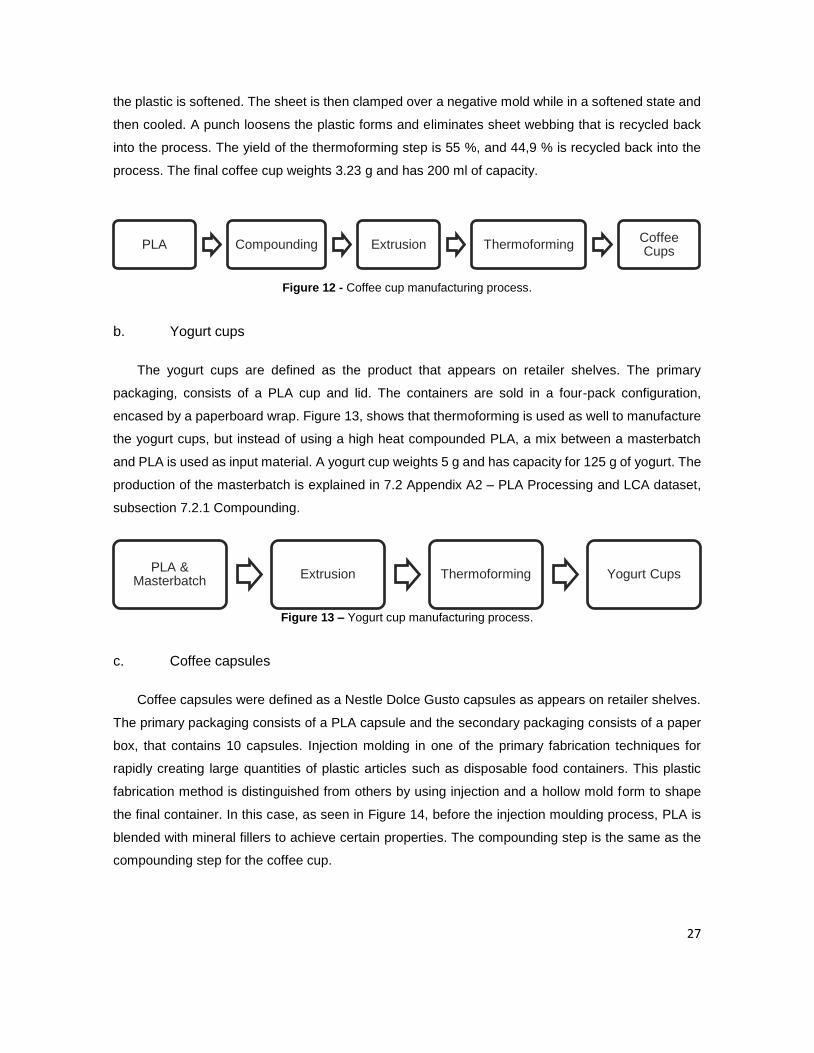
Thermoforming is a principal fabrication technique for rapidly creating large quantities of plastic
products and it’s used by Corbion to produce coffee cups, following the steps described in Figure 12.
A sheet of extruded plastic is fed, usually on a roll or form and extruder, into a heated chamber where
Sugarcane Agriculture
Sugar MillingLactic Acid Production
Lactide production
PLA production
Figure 11 - Process of PLA manufacture.
27
the plastic is softened. The sheet is then clamped over a negative mold while in a softened state and
then cooled. A punch loosens the plastic forms and eliminates sheet webbing that is recycled back
into the process. The yield of the thermoforming step is 55 %, and 44,9 % is recycled back into the
process. The final coffee cup weights 3.23 g and has 200 ml of capacity.
Figure 12 - Coffee cup manufacturing process.
b. Yogurt cups
The yogurt cups are defined as the product that appears on retailer shelves. The primary
packaging, consists of a PLA cup and lid. The containers are sold in a four-pack configuration,
encased by a paperboard wrap. Figure 13, shows that thermoforming is used as well to manufacture
the yogurt cups, but instead of using a high heat compounded PLA, a mix between a masterbatch
and PLA is used as input material. A yogurt cup weights 5 g and has capacity for 125 g of yogurt. The
production of the masterbatch is explained in 7.2 Appendix A2 – PLA Processing and LCA dataset,
subsection 7.2.1 Compounding.
Figure 13 – Yogurt cup manufacturing process.
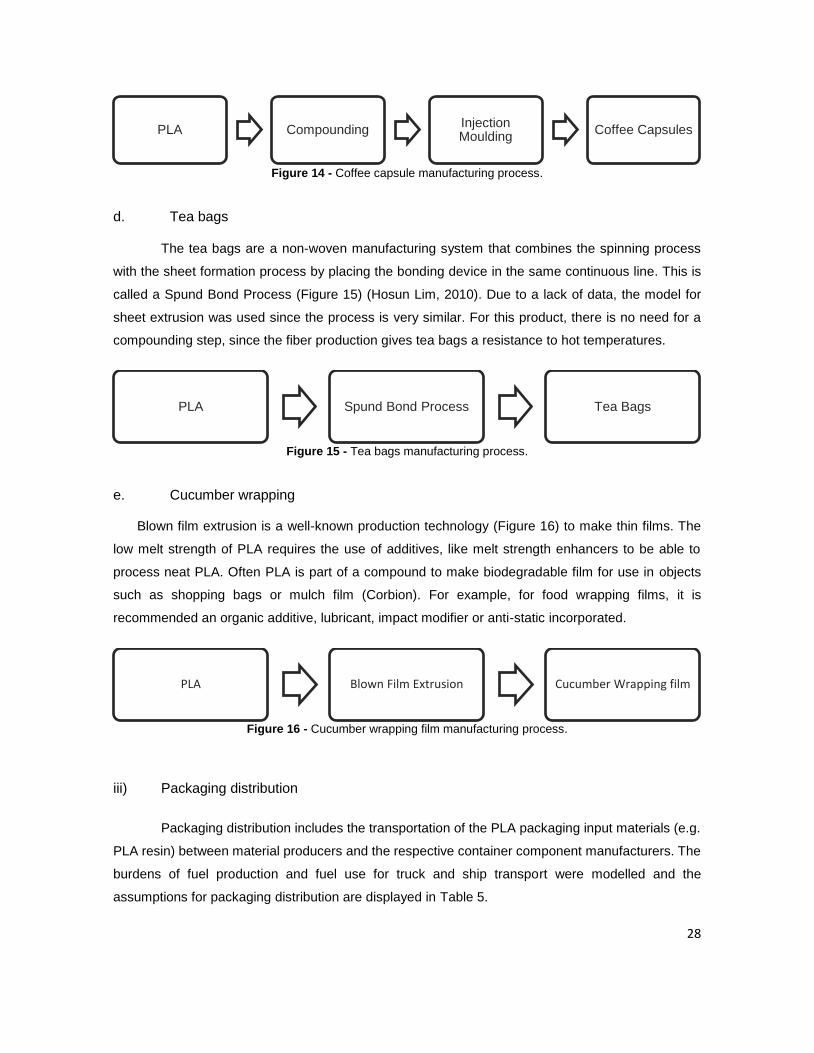
c. Coffee capsules
Coffee capsules were defined as a Nestle Dolce Gusto capsules as appears on retailer shelves.
The primary packaging consists of a PLA capsule and the secondary packaging consists of a paper
box, that contains 10 capsules. Injection molding in one of the primary fabrication techniques for
rapidly creating large quantities of plastic articles such as disposable food containers. This plastic
fabrication method is distinguished from others by using injection and a hollow mold form to shape
the final container. In this case, as seen in Figure 14, before the injection moulding process, PLA is
blended with mineral fillers to achieve certain properties. The compounding step is the same as the
compounding step for the coffee cup.
PLA Compounding Extrusion ThermoformingCoffee Cups
PLA & Masterbatch
Extrusion Thermoforming Yogurt Cups
28
Figure 14 - Coffee capsule manufacturing process.
d. Tea bags
The tea bags are a non-woven manufacturing system that combines the spinning process
with the sheet formation process by placing the bonding device in the same continuous line. This is
called a Spund Bond Process (Figure 15) (Hosun Lim, 2010). Due to a lack of data, the model for
sheet extrusion was used since the process is very similar. For this product, there is no need for a
compounding step, since the fiber production gives tea bags a resistance to hot temperatures.
Figure 15 - Tea bags manufacturing process.
e. Cucumber wrapping Blown film extrusion is a well-known production technology (Figure 16) to make thin films. The
low melt strength of PLA requires the use of additives, like melt strength enhancers to be able to
process neat PLA. Often PLA is part of a compound to make biodegradable film for use in objects
such as shopping bags or mulch film (Corbion). For example, for food wrapping films, it is
recommended an organic additive, lubricant, impact modifier or anti-static incorporated.
Figure 16 - Cucumber wrapping film manufacturing process.
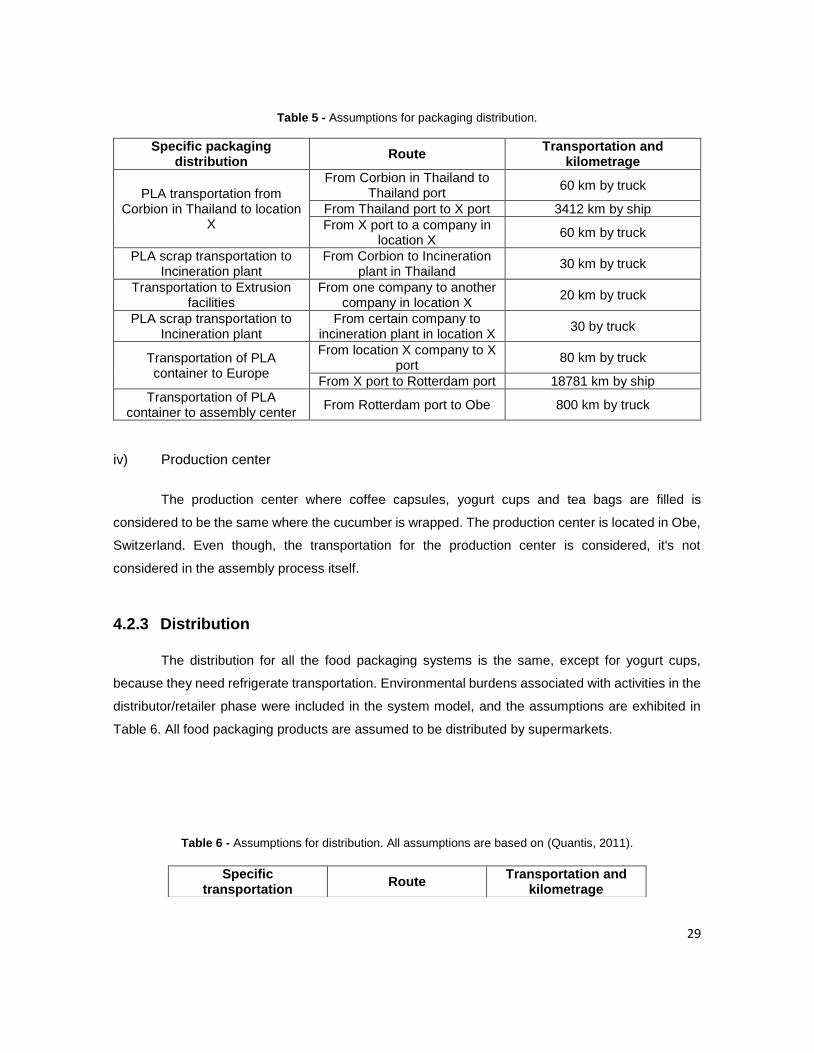
iii) Packaging distribution
Packaging distribution includes the transportation of the PLA packaging input materials (e.g.
PLA resin) between material producers and the respective container component manufacturers. The
burdens of fuel production and fuel use for truck and ship transport were modelled and the
assumptions for packaging distribution are displayed in Table 5.
PLA CompoundingInjection Moulding
Coffee Capsules
PLA Spund Bond Process Tea Bags
PLA Blown Film Extrusion Cucumber Wrapping film
29
Table 5 - Assumptions for packaging distribution.
Specific packaging distribution
Route Transportation and
kilometrage
PLA transportation from Corbion in Thailand to location
X
From Corbion in Thailand to Thailand port
60 km by truck
From Thailand port to X port 3412 km by ship
From X port to a company in location X
60 km by truck
PLA scrap transportation to Incineration plant
From Corbion to Incineration plant in Thailand
30 km by truck
Transportation to Extrusion facilities
From one company to another company in location X
20 km by truck
PLA scrap transportation to Incineration plant
From certain company to incineration plant in location X
30 by truck
Transportation of PLA container to Europe
From location X company to X port
80 km by truck
From X port to Rotterdam port 18781 km by ship
Transportation of PLA container to assembly center
From Rotterdam port to Obe 800 km by truck
iv) Production center
The production center where coffee capsules, yogurt cups and tea bags are filled is
considered to be the same where the cucumber is wrapped. The production center is located in Obe,
Switzerland. Even though, the transportation for the production center is considered, it's not
considered in the assembly process itself.
4.2.3 Distribution
The distribution for all the food packaging systems is the same, except for yogurt cups,
because they need refrigerate transportation. Environmental burdens associated with activities in the
distributor/retailer phase were included in the system model, and the assumptions are exhibited in
Table 6. All food packaging products are assumed to be distributed by supermarkets.
Table 6 - Assumptions for distribution. All assumptions are based on (Quantis, 2011).
Specific transportation
Route Transportation and
kilometrage
30
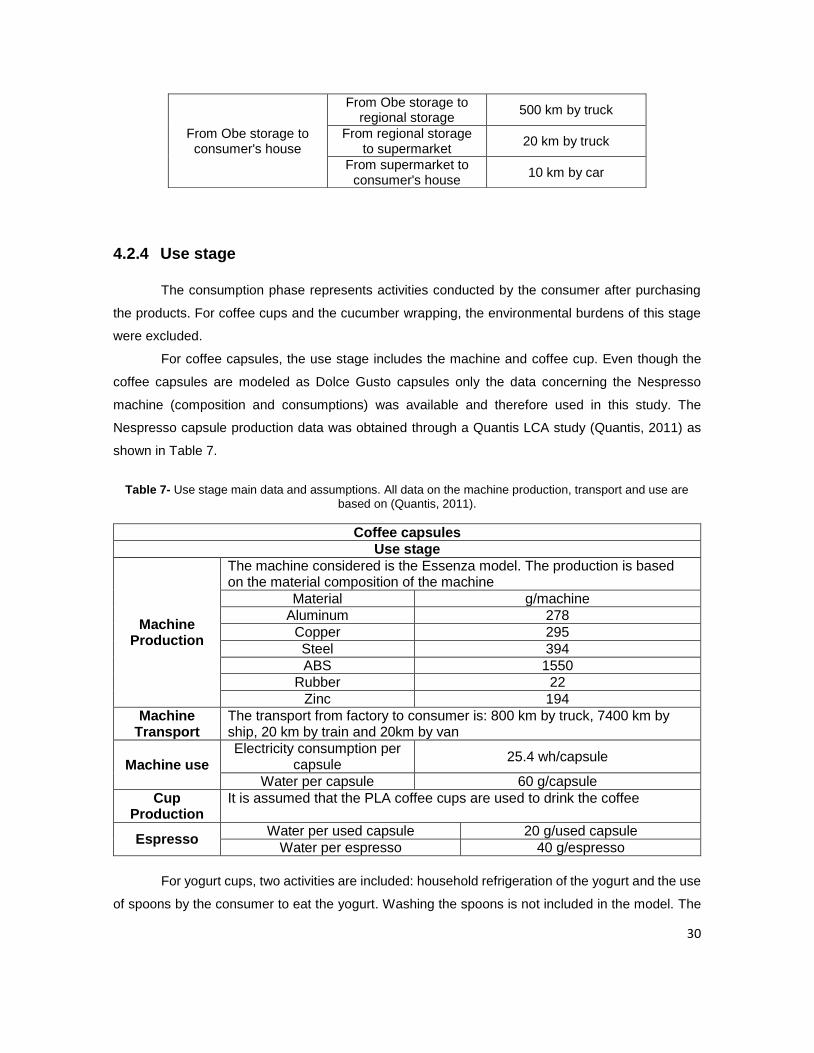
4.2.4 Use stage
The consumption phase represents activities conducted by the consumer after purchasing
the products. For coffee cups and the cucumber wrapping, the environmental burdens of this stage
were excluded.
For coffee capsules, the use stage includes the machine and coffee cup. Even though the
coffee capsules are modeled as Dolce Gusto capsules only the data concerning the Nespresso
machine (composition and consumptions) was available and therefore used in this study. The
Nespresso capsule production data was obtained through a Quantis LCA study (Quantis, 2011) as
shown in Table 7.
Table 7- Use stage main data and assumptions. All data on the machine production, transport and use are
based on (Quantis, 2011).
Coffee capsules
Use stage
Machine Production
The machine considered is the Essenza model. The production is based on the material composition of the machine
Material g/machine
Aluminum 278
Copper 295
Steel 394
ABS 1550
Rubber 22
Zinc 194
Machine Transport
The transport from factory to consumer is: 800 km by truck, 7400 km by ship, 20 km by train and 20km by van
Machine use Electricity consumption per
capsule 25.4 wh/capsule
Water per capsule 60 g/capsule
Cup Production
It is assumed that the PLA coffee cups are used to drink the coffee
Espresso Water per used capsule 20 g/used capsule
Water per espresso 40 g/espresso
For yogurt cups, two activities are included: household refrigeration of the yogurt and the use
of spoons by the consumer to eat the yogurt. Washing the spoons is not included in the model. The
From Obe storage to consumer's house
From Obe storage to regional storage
500 km by truck
From regional storage to supermarket
20 km by truck
From supermarket to consumer's house
10 km by car
31
amount of energy used to keep yogurt chilled will vary depending on the size of the yogurt container,
the length of time it is refrigerated and the energy efficiency of the refrigerator. A survey of currently
available refrigerators showed that the most efficient, widely available models use only 0.054
kWh/ft3/day (Gregory A. Keoleian, 2004). After collecting all the data needed and assuming 4 days of
refrigeration, which is based on the consumer eating one yogurt per day and purchasing a four-pack
once per week, the energy burdens are calculated.
For tea bags, the use stage includes the kettle used to warm up the water and the production
of coffee cups, to drink the hot beverage. In order to prepare a cup of tea, 250 ml of water is needed.
After 4 minutes of infusion, the tea bag is removed from the cup, and approximately 10 g of waster
remain in the leaves. To boil the water with a kettle 49.5 MJ of electricity per kg tea is needed (Jefferies,
2012).
For cucumber wrapping, its assumed that the wrapping film is peeled like a banana, and the
consumer throws a quarter of the cucumber with the entire packaging into the waste bin. No
refrigeration is needed.
4.2.5 End-of-life
End-of-life process modelling accounted for the environmental burdens that stemmed from
waste management of used food packaging, including the transportation from the consumer to the
disposal location. There is no separation of the food matter from the packaging, the entire product
with food contamination is transported to waste management to be incinerated, landfilled, composted
or anaerobically digested.
4.2.5.1 Incineration
The primary objective of municipal solid waste incineration (MSWI) is to treat waste by
reducing the solid waste mass and allowing energy recovery. For this reason, the original designation
of “incinerator” was dropped, and today it is known as energy from waste (or waste to energy, WtE)
(Margallo M, 2014). Nevertheless, regarding operational conditions, the high combustion temperature
makes necessary the employment of very specific materials, increasing the installation and
maintenance costs. Likewise, additional fuel is required when waste does not reach the required low
heating value (LHV), for example when it has high water content (Rodríguez JJ and Irabien, 2013).
Incineration is a direct combustion technology in which the feedstock is directly transformed
into energy, which can be used for district heating and district electricity production. Biogenic carbon
dioxide and water vapor are the major compounds emitted through the incineration of bio-waste.
Additionally, the incombustible ash usually constitutes a concentrated inorganic waste that must be
32
disposed properly. On chapter 7.3 Appendix A3 – Waste treatment options, subsection 7.3.1
Incineration, is displayed a more extensive explanation about incineration process.
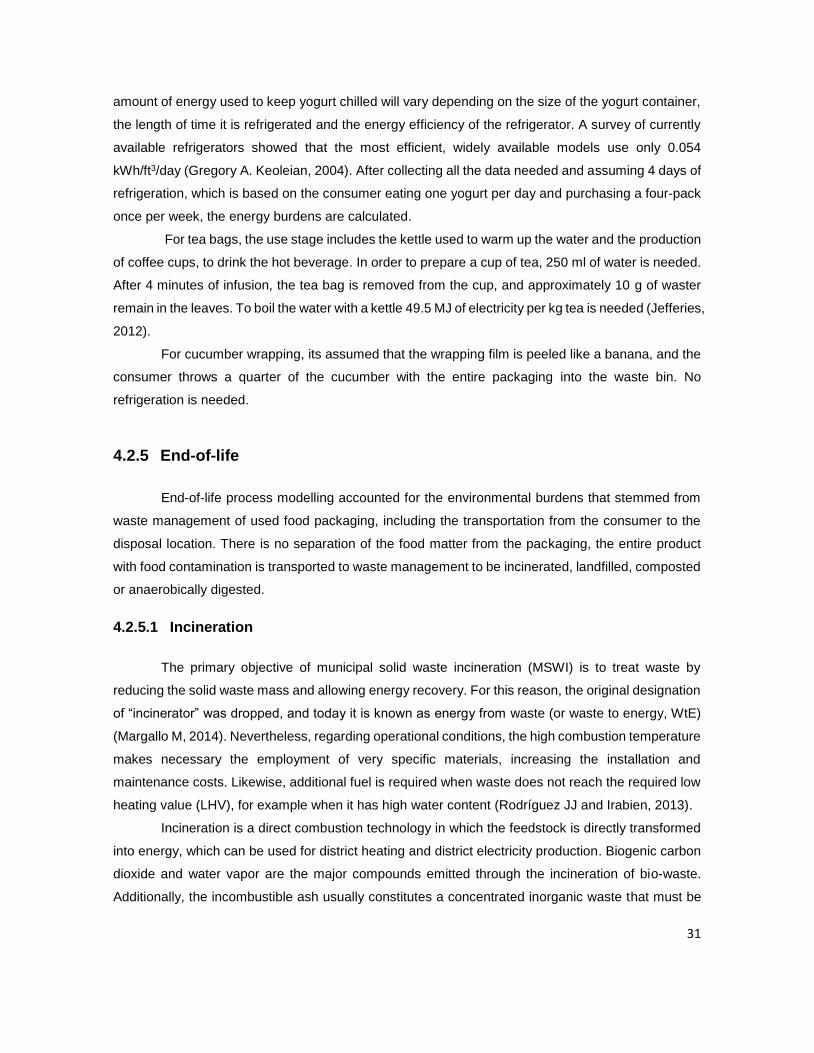
i) Process model of waste incineration
The incineration model is based on Ecoinvent v3.3 process of MSWI for PET in Switzerland.
The model includes combustion with a grate incinerator, an electrostatic precipitator, a wet flue gas
scrubber system, electricity and heat production from waste heat recovery and landfilling of residues
as shown in Figure 17.
Some changes were made to the model, in terms of:
1) Air emissions
a. Oxygen input;
2) Energy replacing;
3) Ashes disposal.
These changes are described in the next sections.
Figure 17- Process model of waste incineration and technologies.
Incineration -Combustion -Electrostatic precipitator -Scrubber
system -Steam turbine
Heat Heat
Electricity
Solidification with cement Landfilling
Flue gas
Slag
Fly Ash
𝐶𝑂2
𝑁𝑂2
𝐻2𝑂
Biowaste
33
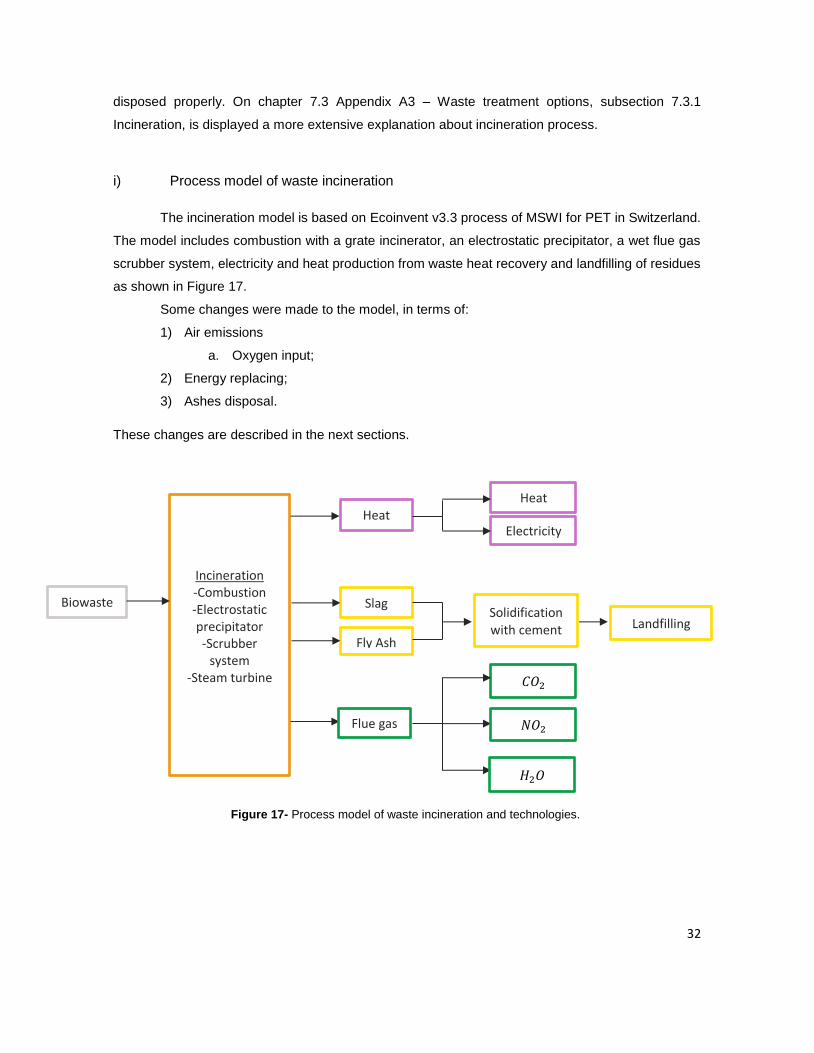
ii) Ancillary materials
Several ancillary materials are used in the model for the flue gas scrubber system and the
waste water treatment, as shown in Table 8. No changes were made to the PET model (Ecoinvent
v3.3) regarding the input of these materials.
Table 8 - Ancillary materials and respective functions (Doka G., 2003).
Ancillary materials Function
Sodium Hydroxide (NaOH) An aqueous solution of NaOH is used in the alkaline stage of the
wet scrubber to transfer 𝑆𝑂2 to the scrubber liquid.
Quicklime The scrubber liquids are transferred to a waste water treatment
facility. Acids present in the scrubber liquids must be neutralized.
An 95% aqueous solution of burnt lime (CaO) and water.
Hydrochloric acid Small amounts of hydrochloric acid are used in the wastewater
treatment for pH control.
Iron Chloride Used to precipitate heavy metals during wastewater treatment.
Only small amounts are used.
Polyelectrolyte solution Aqueous solution of inorganic salts is used for flocculation in the
wastewater treatment.
Ammonia Used for reduction of NOx.
Cement The boiler ash and precipitator ash are solidified with cement
before being landfilled in a residual material landfill.
Selective Catalytic reduction (SCR) catalyst material
Reduce NOx levels in the flue gas.
iii) Air emissions
Emissions were calculated based on waste composition. To estimate the output flows from
the incinerator it is necessary to assign chemical substances to each air emission. And these are
shown in Table A- 9 present on chapter 7.4 Appendix A4 – Incineration dataset.
a) Main assumptions
A fair assumption is that the hydrogen in the waste stream is converted to water (𝐻2𝑂),
nitrogen to nitrogen dioxide (𝑁𝑂2 ) and carbon to 𝐶𝑂2 . This assumption primarily assumes that
combustion is complete, which is reasonable given the fact that the furnace operates with an excess
of oxygen supply, and the amount of CO produced is very small. Even though, the amount of CO was
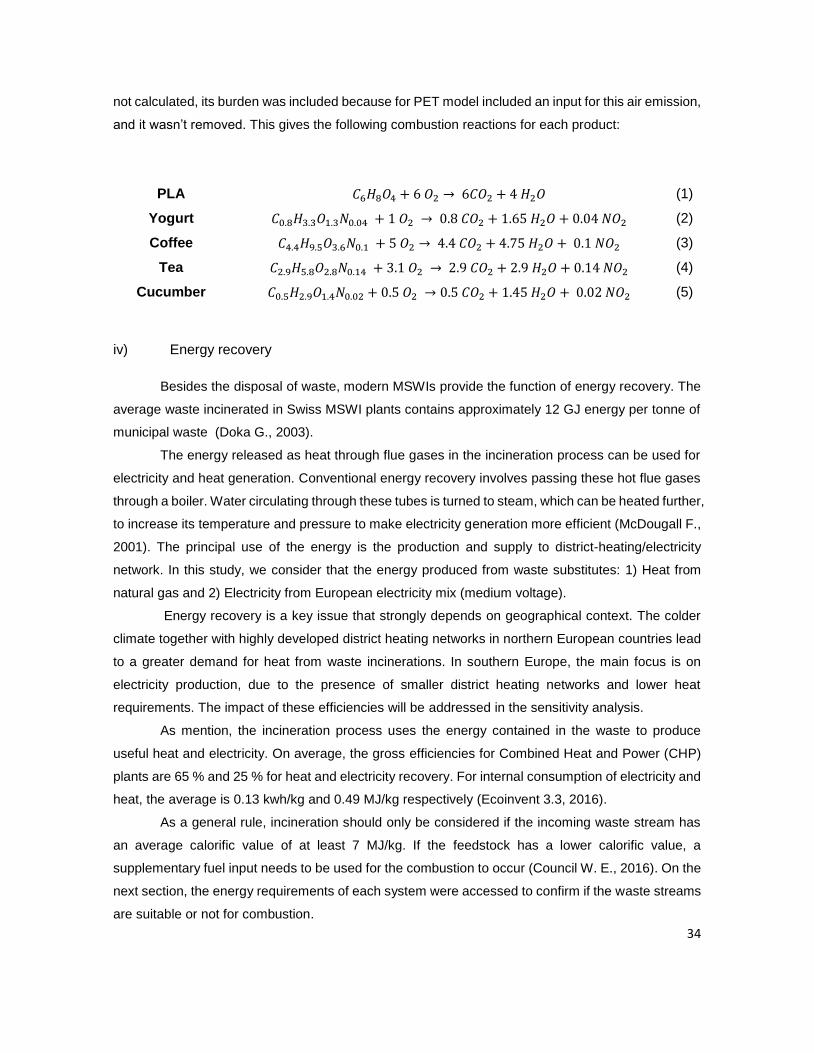
34
not calculated, its burden was included because for PET model included an input for this air emission,
and it wasn’t removed. This gives the following combustion reactions for each product:
PLA 𝐶6𝐻8𝑂4 + 6 𝑂2 → 6𝐶𝑂2 + 4 𝐻2𝑂 (1)
Yogurt 𝐶0.8𝐻3.3𝑂1.3𝑁0.04 + 1 𝑂2 → 0.8 𝐶𝑂2 + 1.65 𝐻2𝑂 + 0.04 𝑁𝑂2 (2)
Coffee 𝐶4.4𝐻9.5𝑂3.6𝑁0.1 + 5 𝑂2 → 4.4 𝐶𝑂2 + 4.75 𝐻2𝑂 + 0.1 𝑁𝑂2 (3)
Tea 𝐶2.9𝐻5.8𝑂2.8𝑁0.14 + 3.1 𝑂2 → 2.9 𝐶𝑂2 + 2.9 𝐻2𝑂 + 0.14 𝑁𝑂2 (4)
Cucumber 𝐶0.5𝐻2.9𝑂1.4𝑁0.02 + 0.5 𝑂2 → 0.5 𝐶𝑂2 + 1.45 𝐻2𝑂 + 0.02 𝑁𝑂2 (5)
iv) Energy recovery
Besides the disposal of waste, modern MSWIs provide the function of energy recovery. The
average waste incinerated in Swiss MSWI plants contains approximately 12 GJ energy per tonne of
municipal waste (Doka G., 2003).
The energy released as heat through flue gases in the incineration process can be used for
electricity and heat generation. Conventional energy recovery involves passing these hot flue gases
through a boiler. Water circulating through these tubes is turned to steam, which can be heated further,
to increase its temperature and pressure to make electricity generation more efficient (McDougall F.,
2001). The principal use of the energy is the production and supply to district-heating/electricity
network. In this study, we consider that the energy produced from waste substitutes: 1) Heat from
natural gas and 2) Electricity from European electricity mix (medium voltage).
Energy recovery is a key issue that strongly depends on geographical context. The colder
climate together with highly developed district heating networks in northern European countries lead
to a greater demand for heat from waste incinerations. In southern Europe, the main focus is on
electricity production, due to the presence of smaller district heating networks and lower heat
requirements. The impact of these efficiencies will be addressed in the sensitivity analysis.
As mention, the incineration process uses the energy contained in the waste to produce
useful heat and electricity. On average, the gross efficiencies for Combined Heat and Power (CHP)
plants are 65 % and 25 % for heat and electricity recovery. For internal consumption of electricity and
heat, the average is 0.13 kwh/kg and 0.49 MJ/kg respectively (Ecoinvent 3.3, 2016).
As a general rule, incineration should only be considered if the incoming waste stream has
an average calorific value of at least 7 MJ/kg. If the feedstock has a lower calorific value, a
supplementary fuel input needs to be used for the combustion to occur (Council W. E., 2016). On the
next section, the energy requirements of each system were accessed to confirm if the waste streams
are suitable or not for combustion.
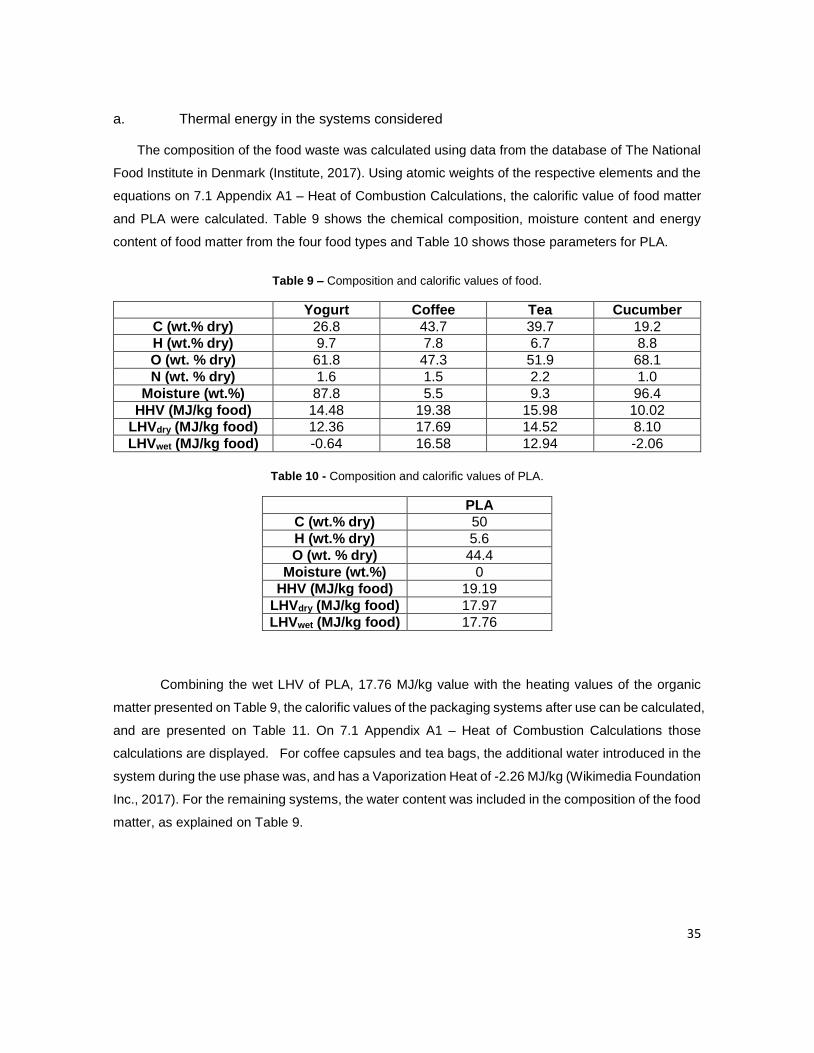
35
a. Thermal energy in the systems considered
The composition of the food waste was calculated using data from the database of The National
Food Institute in Denmark (Institute, 2017). Using atomic weights of the respective elements and the
equations on 7.1 Appendix A1 – Heat of Combustion Calculations, the calorific value of food matter
and PLA were calculated. Table 9 shows the chemical composition, moisture content and energy
content of food matter from the four food types and Table 10 shows those parameters for PLA.
Table 9 – Composition and calorific values of food.
Yogurt Coffee Tea Cucumber
C (wt.% dry) 26.8 43.7 39.7 19.2
H (wt.% dry) 9.7 7.8 6.7 8.8
O (wt. % dry) 61.8 47.3 51.9 68.1
N (wt. % dry) 1.6 1.5 2.2 1.0
Moisture (wt.%) 87.8 5.5 9.3 96.4
HHV (MJ/kg food) 14.48 19.38 15.98 10.02
LHVdry (MJ/kg food) 12.36 17.69 14.52 8.10
LHVwet (MJ/kg food) -0.64 16.58 12.94 -2.06
Table 10 - Composition and calorific values of PLA.
PLA
C (wt.% dry) 50
H (wt.% dry) 5.6
O (wt. % dry) 44.4
Moisture (wt.%) 0
HHV (MJ/kg food) 19.19
LHVdry (MJ/kg food) 17.97
LHVwet (MJ/kg food) 17.76
Combining the wet LHV of PLA, 17.76 MJ/kg value with the heating values of the organic
matter presented on Table 9, the calorific values of the packaging systems after use can be calculated,
and are presented on Table 11. On 7.1 Appendix A1 – Heat of Combustion Calculations those
calculations are displayed. For coffee capsules and tea bags, the additional water introduced in the
system during the use phase was, and has a Vaporization Heat of -2.26 MJ/kg (Wikimedia Foundation
Inc., 2017). For the remaining systems, the water content was included in the composition of the food
matter, as explained on Table 9.
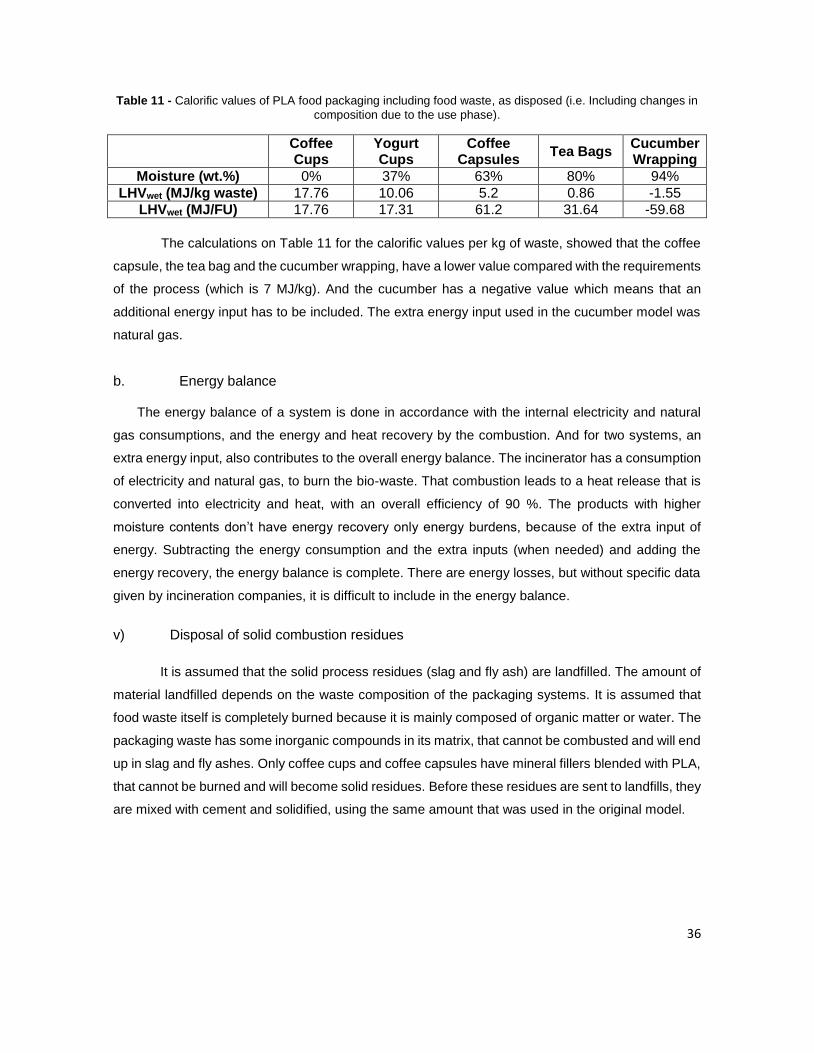
36
Table 11 - Calorific values of PLA food packaging including food waste, as disposed (i.e. Including changes in
composition due to the use phase).
Coffee Cups
Yogurt Cups
Coffee Capsules
Tea Bags Cucumber Wrapping
Moisture (wt.%) 0% 37% 63% 80% 94%
LHVwet (MJ/kg waste) 17.76 10.06 5.2 0.86 -1.55
LHVwet (MJ/FU) 17.76 17.31 61.2 31.64 -59.68
The calculations on Table 11 for the calorific values per kg of waste, showed that the coffee
capsule, the tea bag and the cucumber wrapping, have a lower value compared with the requirements
of the process (which is 7 MJ/kg). And the cucumber has a negative value which means that an
additional energy input has to be included. The extra energy input used in the cucumber model was
natural gas.
b. Energy balance The energy balance of a system is done in accordance with the internal electricity and natural
gas consumptions, and the energy and heat recovery by the combustion. And for two systems, an
extra energy input, also contributes to the overall energy balance. The incinerator has a consumption
of electricity and natural gas, to burn the bio-waste. That combustion leads to a heat release that is
converted into electricity and heat, with an overall efficiency of 90 %. The products with higher
moisture contents don’t have energy recovery only energy burdens, because of the extra input of
energy. Subtracting the energy consumption and the extra inputs (when needed) and adding the
energy recovery, the energy balance is complete. There are energy losses, but without specific data
given by incineration companies, it is difficult to include in the energy balance.
v) Disposal of solid combustion residues
It is assumed that the solid process residues (slag and fly ash) are landfilled. The amount of
material landfilled depends on the waste composition of the packaging systems. It is assumed that
food waste itself is completely burned because it is mainly composed of organic matter or water. The
packaging waste has some inorganic compounds in its matrix, that cannot be combusted and will end
up in slag and fly ashes. Only coffee cups and coffee capsules have mineral fillers blended with PLA,
that cannot be burned and will become solid residues. Before these residues are sent to landfills, they
are mixed with cement and solidified, using the same amount that was used in the original model.
37
4.2.5.2 Industrial Composting
Industrial composting is a natural process by which organic material is decomposed into a
soil-like substance, called compost which is used as soil conditioner. Decomposition is mainly
performed by microorganisms (mesophilic and thermophilic), including bacteria, fungi, and
actinomycetes. These microorganisms use organic matter as their food source, generate CO2, and
produce compost (organic matter) as an end product. This natural process requires availability of
carbon, nitrogen, water, and oxygen (Gaurav Kale, 2007).
Industrial composting has two mainly factors affecting the rate of biodegradation: 1)
Temperature and 2) Moisture content. A moisture content of 50-60 % is generally considered optimum
for composting. Microbially induced decomposition occurs most rapidly in the thin liquid films found
on the surfaces of the organic particles. Whereas too little moisture (<30 %) inhibits bacterial activity,
too much moisture (>65 %) results in slow decomposition, odor production in anaerobic pockets, and
nutrient leaching. PLA is biodegradable under industrial composting conditions, in which ultimate PLA
degradation results from the action of naturally occurring microorganisms under thermophilic
conditions, which means at a high temperature (58ºC) (T. Kijchavengkul, 2008). A study performed
by Cargill Dow LLC showed that the hydrolysis rate of PLA increased dramatically above the glass
transition temperature.
i) Process model of industrial composting
The composition and characteristics of the feedstock are very important for both designing
and operating the composting plant and for the final quality of the compost (Haug, 1993). When the
feedstock contains food waste and packaging waste, and the most widely used technology for food
waste is an Enclosed Technology according to (Boldrin A., 2009). In enclosed systems, the
composting process takes place in an enclosed building, which allows the possibility of controlling the
exhaust gases and a common treatment is filtration of the air in bio filters. The diagram in Figure 18
explains how the model was built.
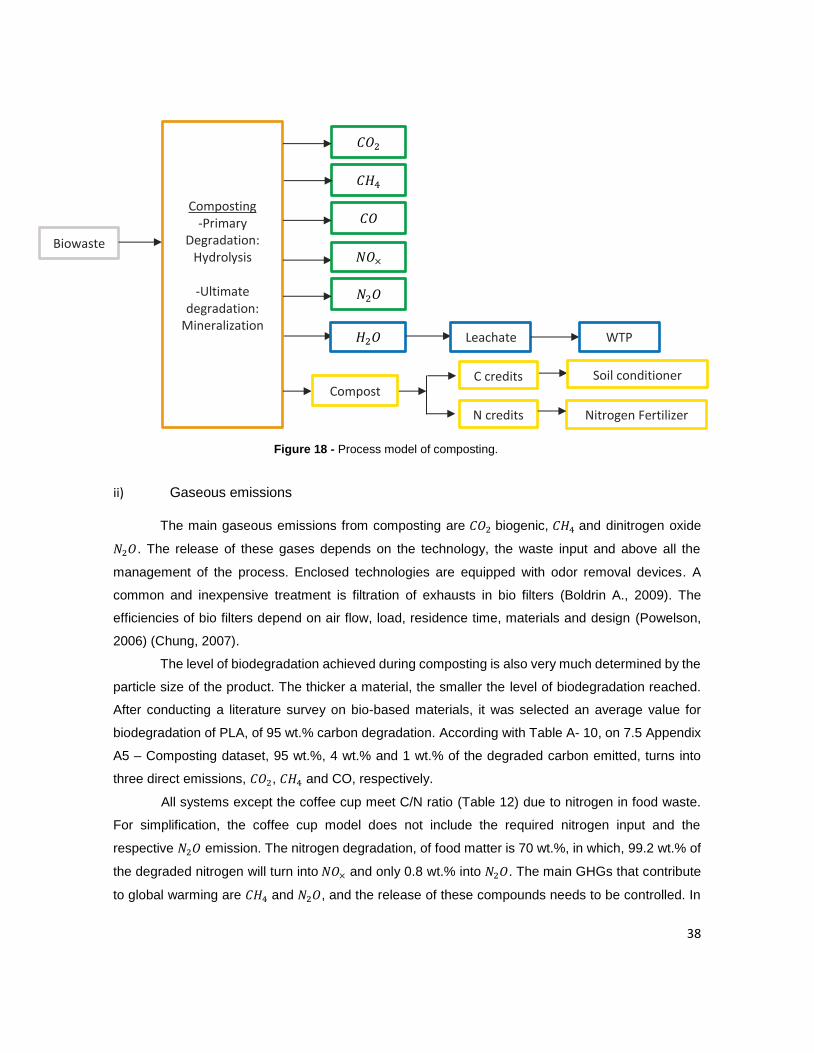
38
ii) Gaseous emissions
The main gaseous emissions from composting are 𝐶𝑂2 biogenic, 𝐶𝐻4 and dinitrogen oxide
𝑁2𝑂. The release of these gases depends on the technology, the waste input and above all the
management of the process. Enclosed technologies are equipped with odor removal devices. A
common and inexpensive treatment is filtration of exhausts in bio filters (Boldrin A., 2009). The
efficiencies of bio filters depend on air flow, load, residence time, materials and design (Powelson,
2006) (Chung, 2007).
The level of biodegradation achieved during composting is also very much determined by the
particle size of the product. The thicker a material, the smaller the level of biodegradation reached.
After conducting a literature survey on bio-based materials, it was selected an average value for
biodegradation of PLA, of 95 wt.% carbon degradation. According with Table A- 10, on 7.5 Appendix
A5 – Composting dataset, 95 wt.%, 4 wt.% and 1 wt.% of the degraded carbon emitted, turns into
three direct emissions, 𝐶𝑂2, 𝐶𝐻4 and CO, respectively.
All systems except the coffee cup meet C/N ratio (Table 12) due to nitrogen in food waste.
For simplification, the coffee cup model does not include the required nitrogen input and the
respective 𝑁2𝑂 emission. The nitrogen degradation, of food matter is 70 wt.%, in which, 99.2 wt.% of
the degraded nitrogen will turn into 𝑁𝑂× and only 0.8 wt.% into 𝑁2𝑂. The main GHGs that contribute
to global warming are 𝐶𝐻4 and 𝑁2𝑂, and the release of these compounds needs to be controlled. In
Figure 18 - Process model of composting.
Composting -Primary
Degradation: Hydrolysis
-Ultimate
degradation: Mineralization
𝐶𝑂2
𝐻2𝑂
𝑁𝑂×
𝑁2𝑂
𝐶𝐻4
𝐶𝑂
N credits
Compost
Nitrogen Fertilizer
C credits Soil conditioner
Leachate
WTP
Biowaste
39
order to control those emissions, biofilters are installed with different efficiencies, for each gas. For
methane, the efficiency can be between 47-100% and for 𝑁2𝑂, 90% (Boldrin A., 2009).
Table 12 - C/N mass ratio of feedstock.
Systems C/N mass ratio
Yogurt Cups 20
Coffee Capsules 44
Tea bags 21
Cucumber wrapping 25
iii) Carbon and nitrogen credits of compost
According to Table A- 10, in section 7.5 Appendix A5 – Composting dataset, part of the
carbon remains stored in the form of compost. Two specific benefits are considered in this analysis:
I) carbon contained in compost is used as soil conditioner replacement and II) nitrogen contained in
compost is used as an organic fertilizer replacement. (B.G Hermann, 2011) used a factor of 79 % to
replace a synthetic fertilizer, which means that 1 kg of compost can replace 0.79 kg of peat.
This compost degrades further over time, on the field, but at a smaller rate than during the
biological treatment. In order to correctly quantify the credits assigned to compost, those air emissions
are considered and 40 wt.% of organic carbon present in the compost becomes biogenic carbon
dioxide.
iv) Leachate
After, the primary degradation of the polymer, the short polymer chains suffer the ultimate
degradation called mineralization, in which the feedstock breaks down into water. A moisture content
of 50-60 % is generally considered optimum for composting. Whereas too little moisture (<30 %)
inhibits bacterial activity, too much moisture (>65 %) results in slow decomposition, odour production
in anaerobic pockets, and nutrient leaching.
4.2.5.3 Anaerobic Digestion
Anaerobic digestion (AD) is a waste management process for organic waste materials
producing biogas and a stabilized residue, called digestate, that can be used on agricultural land
(MØller, 2009). AD contributes to greenhouse emissions, mainly from fugitive emissions released
from bioreactors, the combustion of biogas, and emissions from the digestate when applied to soil.
This process has a large potential for global warming savings through substitution of fossil fuel by
40
biogas and from carbon storage in soil and nitrogen fertilizer. Anaerobic digester systems have been
used for decades at municipal wastewater facilities, and more recently, have been used to process
industrial and agricultural wastes. These systems are designed to optimize the growth of the
methane-forming (methanogenic) bacteria that generate 𝐶𝐻4. Typically, using organic wastes as the
major input, the systems produce biogas that contains 55 % to 70 % 𝐶𝐻4 and 30 % to 45 % 𝐶𝑂2
(Burke, 2001).
The biodegradation of PLA, requires a lengthy time for complete mineralization to𝐶𝑂2 or 𝐶𝐻4
because the microorganisms need to adapt and induce metabolic activity for polymer degradation.
This process is particularly suited for PLA food packaging waste, because usually it has a high energy
potential due to its high amount of kitchen waste or food scraps with high moisture contents and
compostable plastics. (Bioplastics, European Bioplastics, 2017).
So far, little information on anaerobic biodegradation of bioplastics is known, and further research
is welcome to assess the potential biogas (energy) production due to bioplastics.
i) Process model of anaerobic digestion
The AD of bio-waste was modelled by assuming that PLA is biologically degraded under
thermophilic conditions in an anaerobic manner with a biodegradation degree equal to 60 wt.% (Jae
Choon Lee, 2016) and food is biologically degraded in an anaerobic manner with a biodegradation
degree equal to 70 wt.%. The biogenic gas produced is recovered with an efficiency of 95 %.
The C/N ratio is an important factor for production of biogas from food waste. The presence
of nitrogen is important to build up bacterial communities which are essential for fermentation. A C/N
mass ratio of 20-30 is optimum, if this ratio is high it will affect microorganisms. As shown in Table 12
food packaging waste has an optima C/N ratio.
The diagram of Figure 19 explains how the model was built, specially the gaseous emissions,
the energy recovery and the carbon and nitrogen credits of compost. The presence of water inside
the digester is crucial to hydrolyze the bio-waste, but a significant amount of leachate is produced
and a small part needs to be removed and treated in a water treatment plant. Compost credits were
modelled in AD as they were modelled in industrial composting.
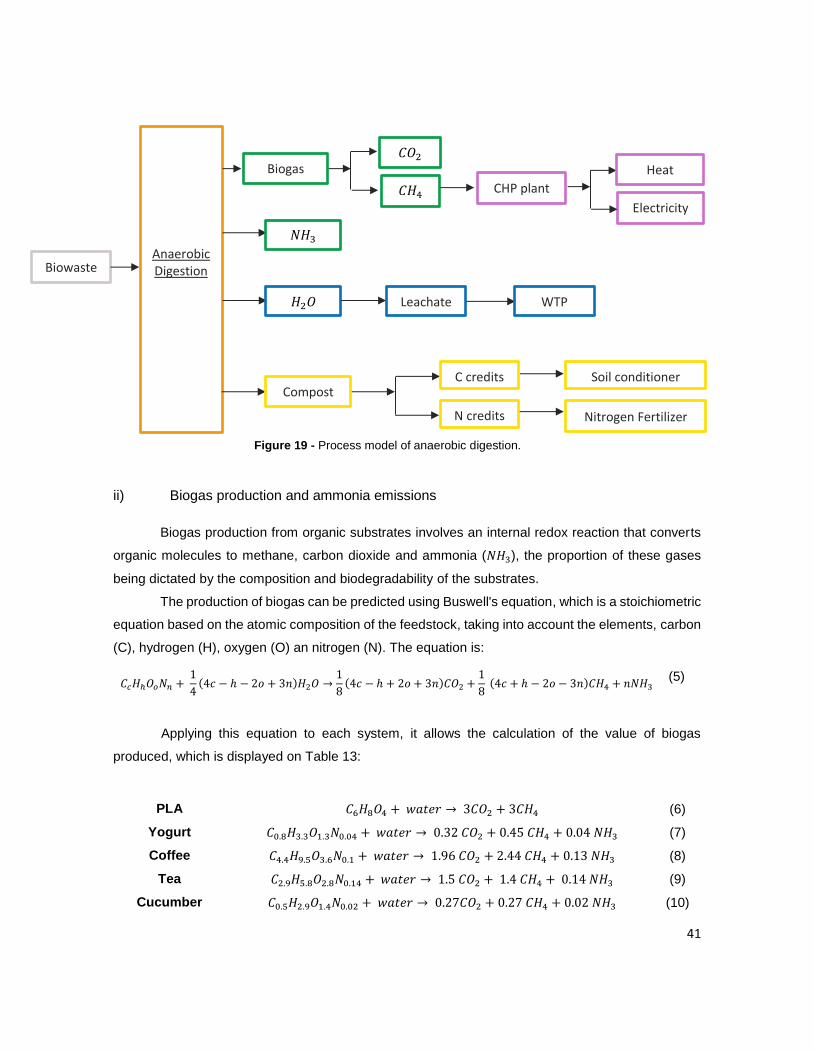
41
ii) Biogas production and ammonia emissions
Biogas production from organic substrates involves an internal redox reaction that converts
organic molecules to methane, carbon dioxide and ammonia (𝑁𝐻3), the proportion of these gases
being dictated by the composition and biodegradability of the substrates.
The production of biogas can be predicted using Buswell's equation, which is a stoichiometric
equation based on the atomic composition of the feedstock, taking into account the elements, carbon
(C), hydrogen (H), oxygen (O) an nitrogen (N). The equation is:
Applying this equation to each system, it allows the calculation of the value of biogas
produced, which is displayed on Table 13:
𝐶𝑐𝐻ℎ𝑂𝑜𝑁𝑛 + 1
4(4𝑐 − ℎ − 2𝑜 + 3𝑛)𝐻2𝑂 →
1
8(4𝑐 − ℎ + 2𝑜 + 3𝑛)𝐶𝑂2 +
1
8 (4𝑐 + ℎ − 2𝑜 − 3𝑛)𝐶𝐻4 + 𝑛𝑁𝐻3
(5)
PLA 𝐶6𝐻8𝑂4 + 𝑤𝑎𝑡𝑒𝑟 → 3𝐶𝑂2 + 3𝐶𝐻4 (6)
Yogurt 𝐶0.8𝐻3.3𝑂1.3𝑁0.04 + 𝑤𝑎𝑡𝑒𝑟 → 0.32 𝐶𝑂2 + 0.45 𝐶𝐻4 + 0.04 𝑁𝐻3 (7)
Coffee 𝐶4.4𝐻9.5𝑂3.6𝑁0.1 + 𝑤𝑎𝑡𝑒𝑟 → 1.96 𝐶𝑂2 + 2.44 𝐶𝐻4 + 0.13 𝑁𝐻3 (8)
Tea 𝐶2.9𝐻5.8𝑂2.8𝑁0.14 + 𝑤𝑎𝑡𝑒𝑟 → 1.5 𝐶𝑂2 + 1.4 𝐶𝐻4 + 0.14 𝑁𝐻3 (9)
Cucumber 𝐶0.5𝐻2.9𝑂1.4𝑁0.02 + 𝑤𝑎𝑡𝑒𝑟 → 0.27𝐶𝑂2 + 0.27 𝐶𝐻4 + 0.02 𝑁𝐻3 (10)
Figure 19 - Process model of anaerobic digestion.
Anaerobic Digestion
𝑁𝐻3
𝐻2𝑂
Leachate
WTP
N credits
Compost
Nitrogen Fertilizer
C credits Soil conditioner
𝐶𝐻4
Biogas 𝐶𝑂2
CHP plant
Electricity
Heat
Biowaste
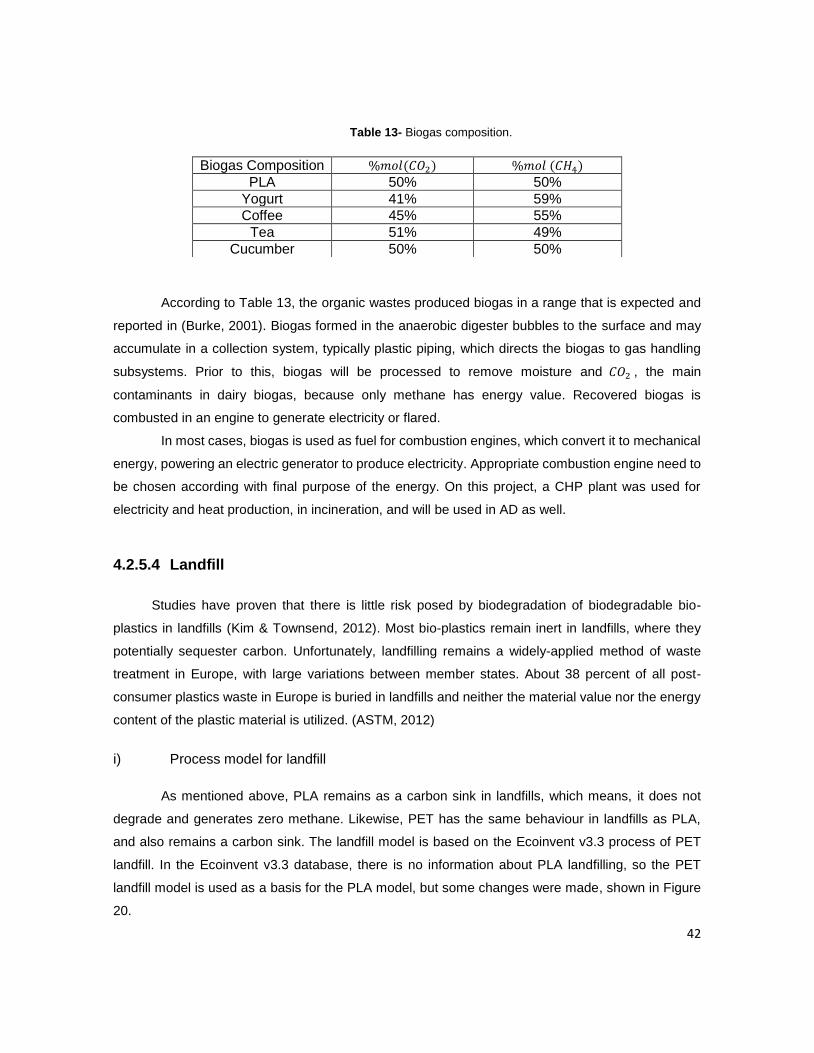
42
Table 13- Biogas composition.
According to Table 13, the organic wastes produced biogas in a range that is expected and
reported in (Burke, 2001). Biogas formed in the anaerobic digester bubbles to the surface and may
accumulate in a collection system, typically plastic piping, which directs the biogas to gas handling
subsystems. Prior to this, biogas will be processed to remove moisture and 𝐶𝑂2 , the main
contaminants in dairy biogas, because only methane has energy value. Recovered biogas is
combusted in an engine to generate electricity or flared.
In most cases, biogas is used as fuel for combustion engines, which convert it to mechanical
energy, powering an electric generator to produce electricity. Appropriate combustion engine need to
be chosen according with final purpose of the energy. On this project, a CHP plant was used for
electricity and heat production, in incineration, and will be used in AD as well.
4.2.5.4 Landfill
Studies have proven that there is little risk posed by biodegradation of biodegradable bio-
plastics in landfills (Kim & Townsend, 2012). Most bio-plastics remain inert in landfills, where they
potentially sequester carbon. Unfortunately, landfilling remains a widely-applied method of waste
treatment in Europe, with large variations between member states. About 38 percent of all post-
consumer plastics waste in Europe is buried in landfills and neither the material value nor the energy
content of the plastic material is utilized. (ASTM, 2012)
i) Process model for landfill
As mentioned above, PLA remains as a carbon sink in landfills, which means, it does not
degrade and generates zero methane. Likewise, PET has the same behaviour in landfills as PLA,
and also remains a carbon sink. The landfill model is based on the Ecoinvent v3.3 process of PET
landfill. In the Ecoinvent v3.3 database, there is no information about PLA landfilling, so the PET
landfill model is used as a basis for the PLA model, but some changes were made, shown in Figure
20.
Biogas Composition %𝑚𝑜𝑙(𝐶𝑂2) %𝑚𝑜𝑙 (𝐶𝐻4)
PLA 50% 50%
Yogurt 41% 59%
Coffee 45% 55%
Tea 51% 49%
Cucumber 50% 50%
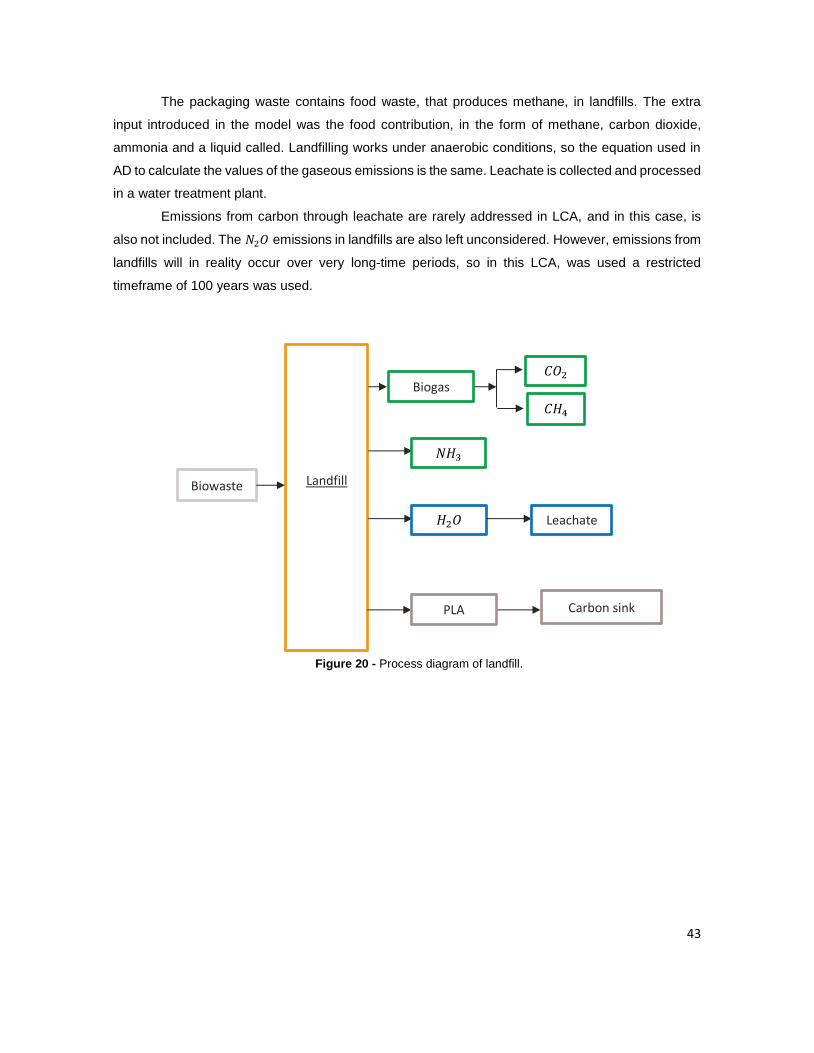
43
The packaging waste contains food waste, that produces methane, in landfills. The extra
input introduced in the model was the food contribution, in the form of methane, carbon dioxide,
ammonia and a liquid called. Landfilling works under anaerobic conditions, so the equation used in
AD to calculate the values of the gaseous emissions is the same. Leachate is collected and processed
in a water treatment plant.
Emissions from carbon through leachate are rarely addressed in LCA, and in this case, is
also not included. The 𝑁2𝑂 emissions in landfills are also left unconsidered. However, emissions from
landfills will in reality occur over very long-time periods, so in this LCA, was used a restricted
timeframe of 100 years was used.
Landfill
𝑁𝐻3
𝐻2𝑂
Leachate
PLA Carbon sink
𝐶𝐻4
Biogas 𝐶𝑂2
Biowaste
Figure 20 - Process diagram of landfill.
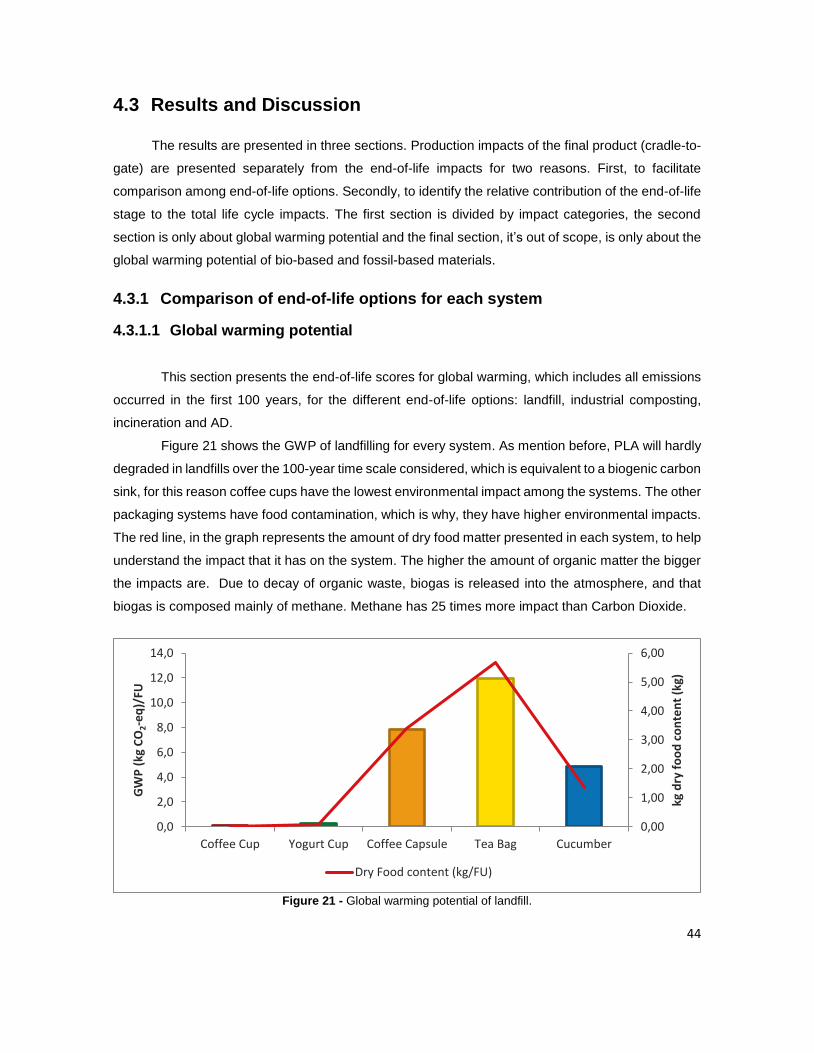
44
4.3 Results and Discussion
The results are presented in three sections. Production impacts of the final product (cradle-to-
gate) are presented separately from the end-of-life impacts for two reasons. First, to facilitate
comparison among end-of-life options. Secondly, to identify the relative contribution of the end-of-life
stage to the total life cycle impacts. The first section is divided by impact categories, the second
section is only about global warming potential and the final section, it’s out of scope, is only about the
global warming potential of bio-based and fossil-based materials.
4.3.1 Comparison of end-of-life options for each system
4.3.1.1 Global warming potential
This section presents the end-of-life scores for global warming, which includes all emissions
occurred in the first 100 years, for the different end-of-life options: landfill, industrial composting,
incineration and AD.
Figure 21 shows the GWP of landfilling for every system. As mention before, PLA will hardly
degraded in landfills over the 100-year time scale considered, which is equivalent to a biogenic carbon
sink, for this reason coffee cups have the lowest environmental impact among the systems. The other
packaging systems have food contamination, which is why, they have higher environmental impacts.
The red line, in the graph represents the amount of dry food matter presented in each system, to help
understand the impact that it has on the system. The higher the amount of organic matter the bigger
the impacts are. Due to decay of organic waste, biogas is released into the atmosphere, and that
biogas is composed mainly of methane. Methane has 25 times more impact than Carbon Dioxide.
Figure 21 - Global warming potential of landfill.
0,00
1,00
2,00
3,00
4,00
5,00
6,00
0,0
2,0
4,0
6,0
8,0
10,0
12,0
14,0
Coffee Cup Yogurt Cup Coffee Capsule Tea Bag Cucumber
kg d
ry f
oo
d c
on
ten
t (k
g)
GW
P (
kg C
O2-e
q)/
FU
Dry Food content (kg/FU)
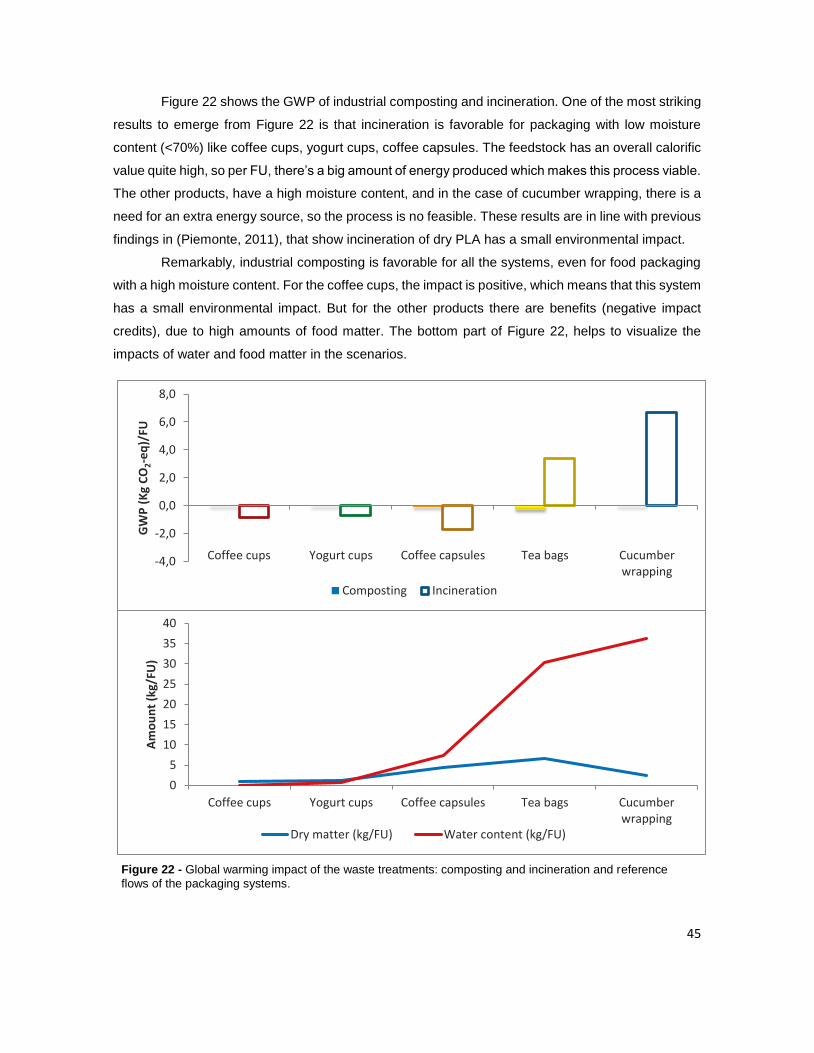
45
Figure 22 shows the GWP of industrial composting and incineration. One of the most striking
results to emerge from Figure 22 is that incineration is favorable for packaging with low moisture
content (<70%) like coffee cups, yogurt cups, coffee capsules. The feedstock has an overall calorific
value quite high, so per FU, there’s a big amount of energy produced which makes this process viable.
The other products, have a high moisture content, and in the case of cucumber wrapping, there is a
need for an extra energy source, so the process is no feasible. These results are in line with previous
findings in (Piemonte, 2011), that show incineration of dry PLA has a small environmental impact.
Remarkably, industrial composting is favorable for all the systems, even for food packaging
with a high moisture content. For the coffee cups, the impact is positive, which means that this system
has a small environmental impact. But for the other products there are benefits (negative impact
credits), due to high amounts of food matter. The bottom part of Figure 22, helps to visualize the
impacts of water and food matter in the scenarios.
Figure 22 - Global warming impact of the waste treatments: composting and incineration and reference
flows of the packaging systems.
0
5
10
15
20
25
30
35
40
Coffee cups Yogurt cups Coffee capsules Tea bags Cucumberwrapping
Am
ou
nt
(kg/
FU)
Dry matter (kg/FU) Water content (kg/FU)
-4,0
-2,0
0,0
2,0
4,0
6,0
8,0
Coffee cups Yogurt cups Coffee capsules Tea bags Cucumberwrapping
GW
P (
Kg
CO
2-e
q)/
FU
Composting Incineration
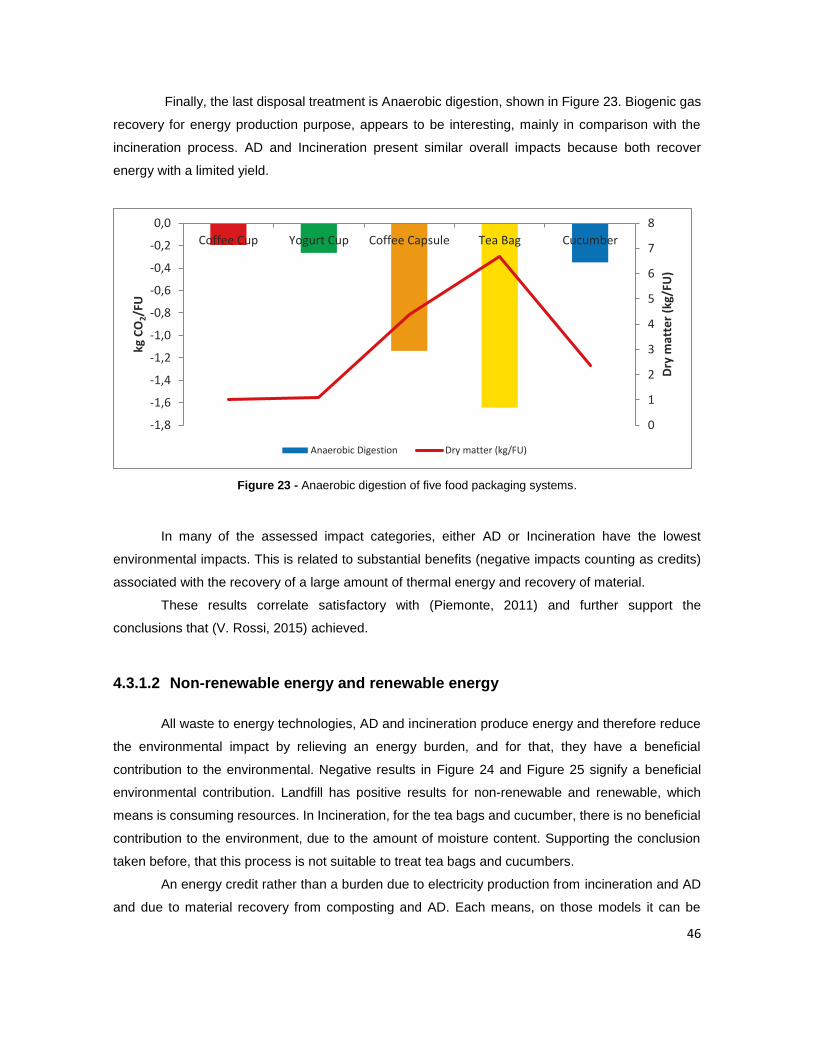
46
Finally, the last disposal treatment is Anaerobic digestion, shown in Figure 23. Biogenic gas
recovery for energy production purpose, appears to be interesting, mainly in comparison with the
incineration process. AD and Incineration present similar overall impacts because both recover
energy with a limited yield.
Figure 23 - Anaerobic digestion of five food packaging systems.
In many of the assessed impact categories, either AD or Incineration have the lowest
environmental impacts. This is related to substantial benefits (negative impacts counting as credits)
associated with the recovery of a large amount of thermal energy and recovery of material.
These results correlate satisfactory with (Piemonte, 2011) and further support the
conclusions that (V. Rossi, 2015) achieved.
4.3.1.2 Non-renewable energy and renewable energy
All waste to energy technologies, AD and incineration produce energy and therefore reduce
the environmental impact by relieving an energy burden, and for that, they have a beneficial
contribution to the environmental. Negative results in Figure 24 and Figure 25 signify a beneficial
environmental contribution. Landfill has positive results for non-renewable and renewable, which
means is consuming resources. In Incineration, for the tea bags and cucumber, there is no beneficial
contribution to the environment, due to the amount of moisture content. Supporting the conclusion
taken before, that this process is not suitable to treat tea bags and cucumbers.
An energy credit rather than a burden due to electricity production from incineration and AD
and due to material recovery from composting and AD. Each means, on those models it can be
0
1
2
3
4
5
6
7
8
-1,8
-1,6
-1,4
-1,2
-1,0
-0,8
-0,6
-0,4
-0,2
0,0
Coffee Cup Yogurt Cup Coffee Capsule Tea Bag Cucumber
Dry
mat
ter
(kg/
FU)
kg C
O2/F
U
Anaerobic Digestion Dry matter (kg/FU)
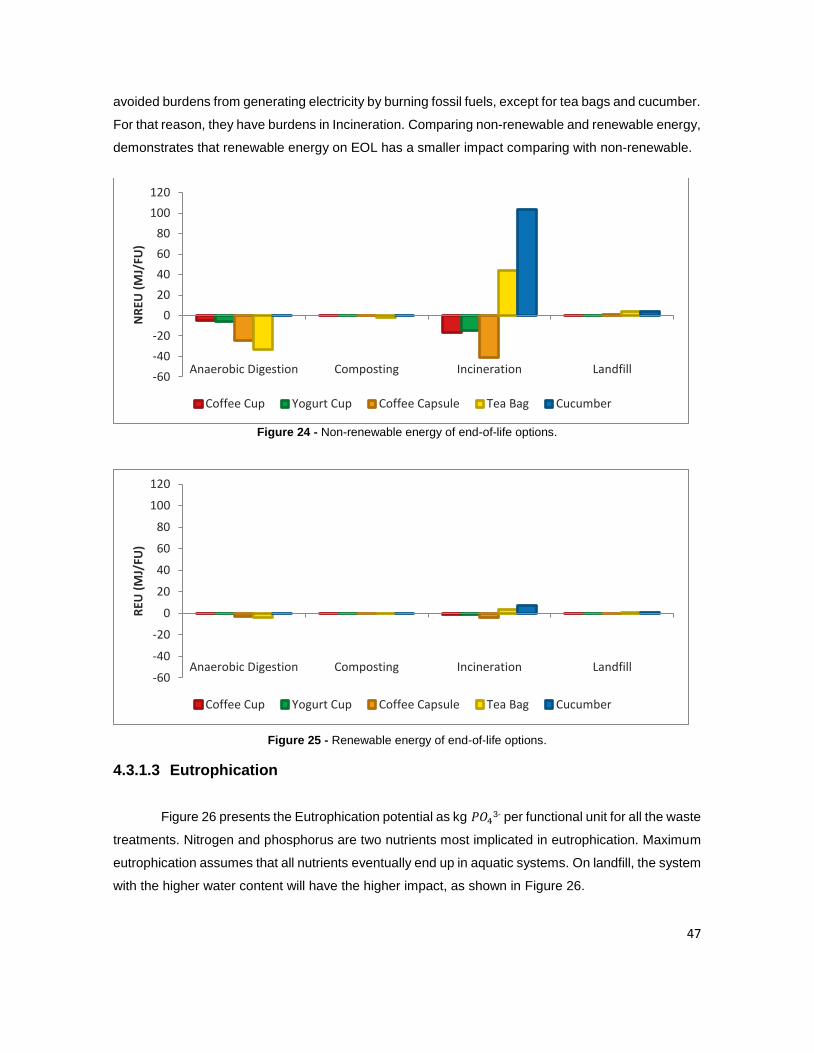
47
avoided burdens from generating electricity by burning fossil fuels, except for tea bags and cucumber.
For that reason, they have burdens in Incineration. Comparing non-renewable and renewable energy,
demonstrates that renewable energy on EOL has a smaller impact comparing with non-renewable.
Figure 24 - Non-renewable energy of end-of-life options.
Figure 25 - Renewable energy of end-of-life options.
4.3.1.3 Eutrophication
Figure 26 presents the Eutrophication potential as kg 𝑃𝑂43- per functional unit for all the waste
treatments. Nitrogen and phosphorus are two nutrients most implicated in eutrophication. Maximum
eutrophication assumes that all nutrients eventually end up in aquatic systems. On landfill, the system
with the higher water content will have the higher impact, as shown in Figure 26.
-60
-40
-20
0
20
40
60
80
100
120
Anaerobic Digestion Composting Incineration Landfill
NR
EU (
MJ/
FU)
Coffee Cup Yogurt Cup Coffee Capsule Tea Bag Cucumber
-60
-40
-20
0
20
40
60
80
100
120
Anaerobic Digestion Composting Incineration Landfill
REU
(M
J/FU
)
Coffee Cup Yogurt Cup Coffee Capsule Tea Bag Cucumber
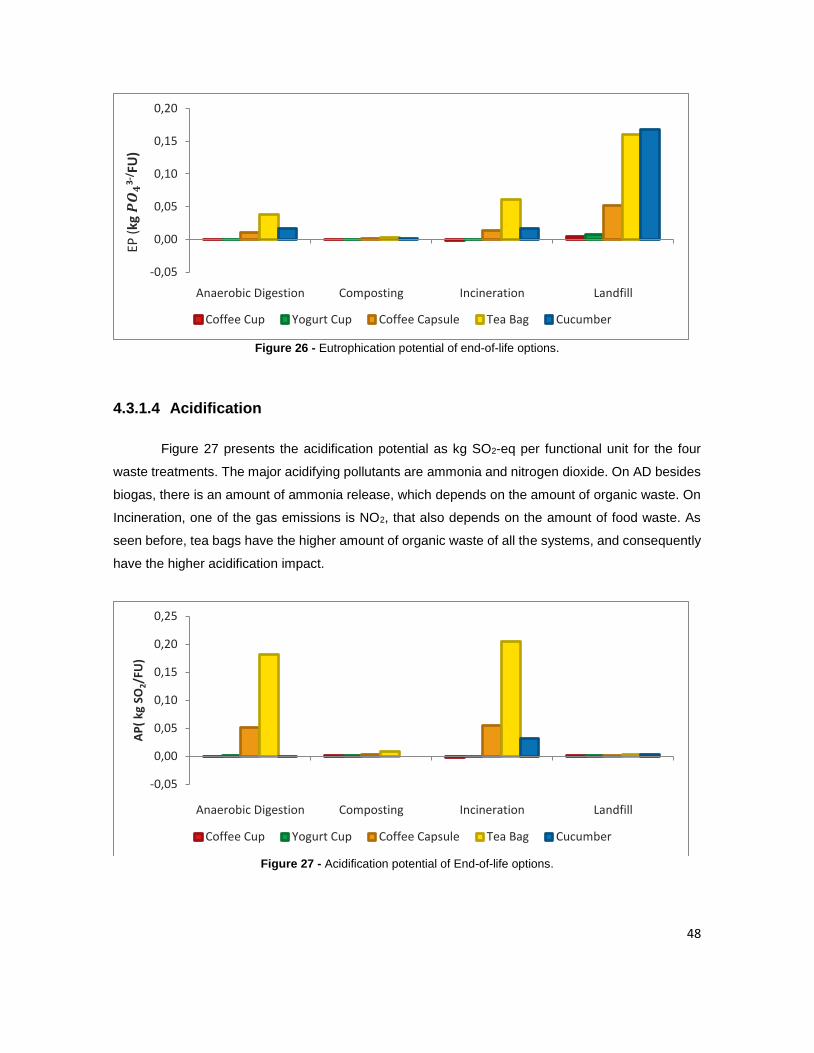
48
Figure 26 - Eutrophication potential of end-of-life options.
4.3.1.4 Acidification
Figure 27 presents the acidification potential as kg SO2-eq per functional unit for the four
waste treatments. The major acidifying pollutants are ammonia and nitrogen dioxide. On AD besides
biogas, there is an amount of ammonia release, which depends on the amount of organic waste. On
Incineration, one of the gas emissions is NO2, that also depends on the amount of food waste. As
seen before, tea bags have the higher amount of organic waste of all the systems, and consequently
have the higher acidification impact.
Figure 27 - Acidification potential of End-of-life options.
-0,05
0,00
0,05
0,10
0,15
0,20
Anaerobic Digestion Composting Incineration Landfill
Coffee Cup Yogurt Cup Coffee Capsule Tea Bag Cucumber
EP (
kg𝑷
𝑶𝟒
3-/
FU)
-0,05
0,00
0,05
0,10
0,15
0,20
0,25
Anaerobic Digestion Composting Incineration Landfill
AP
( kg
SO
2/FU
)
Coffee Cup Yogurt Cup Coffee Capsule Tea Bag Cucumber
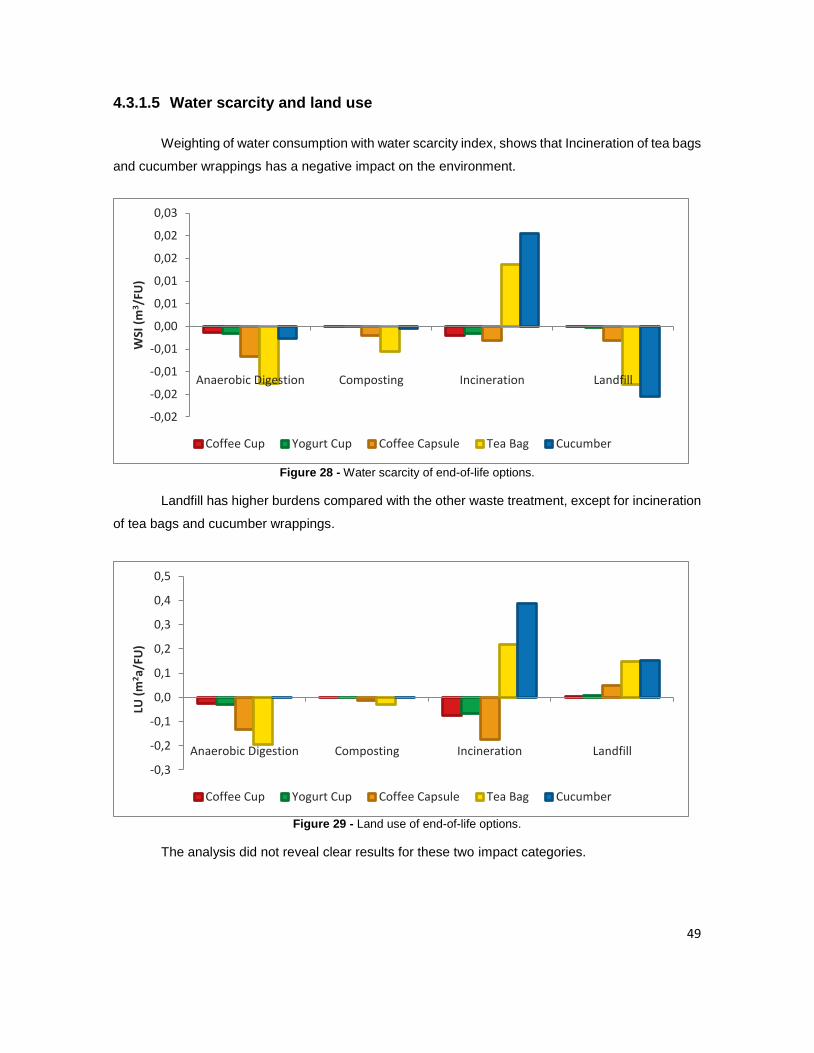
49
4.3.1.5 Water scarcity and land use
Weighting of water consumption with water scarcity index, shows that Incineration of tea bags
and cucumber wrappings has a negative impact on the environment.
Figure 28 - Water scarcity of end-of-life options.
Landfill has higher burdens compared with the other waste treatment, except for incineration
of tea bags and cucumber wrappings.
Figure 29 - Land use of end-of-life options.
The analysis did not reveal clear results for these two impact categories.
-0,02
-0,02
-0,01
-0,01
0,00
0,01
0,01
0,02
0,02
0,03
Anaerobic Digestion Composting Incineration Landfill
WSI
(m
3 /FU
)
Coffee Cup Yogurt Cup Coffee Capsule Tea Bag Cucumber
-0,3
-0,2
-0,1
0,0
0,1
0,2
0,3
0,4
0,5
Anaerobic Digestion Composting Incineration Landfill
LU (
m2a/
FU)
Coffee Cup Yogurt Cup Coffee Capsule Tea Bag Cucumber
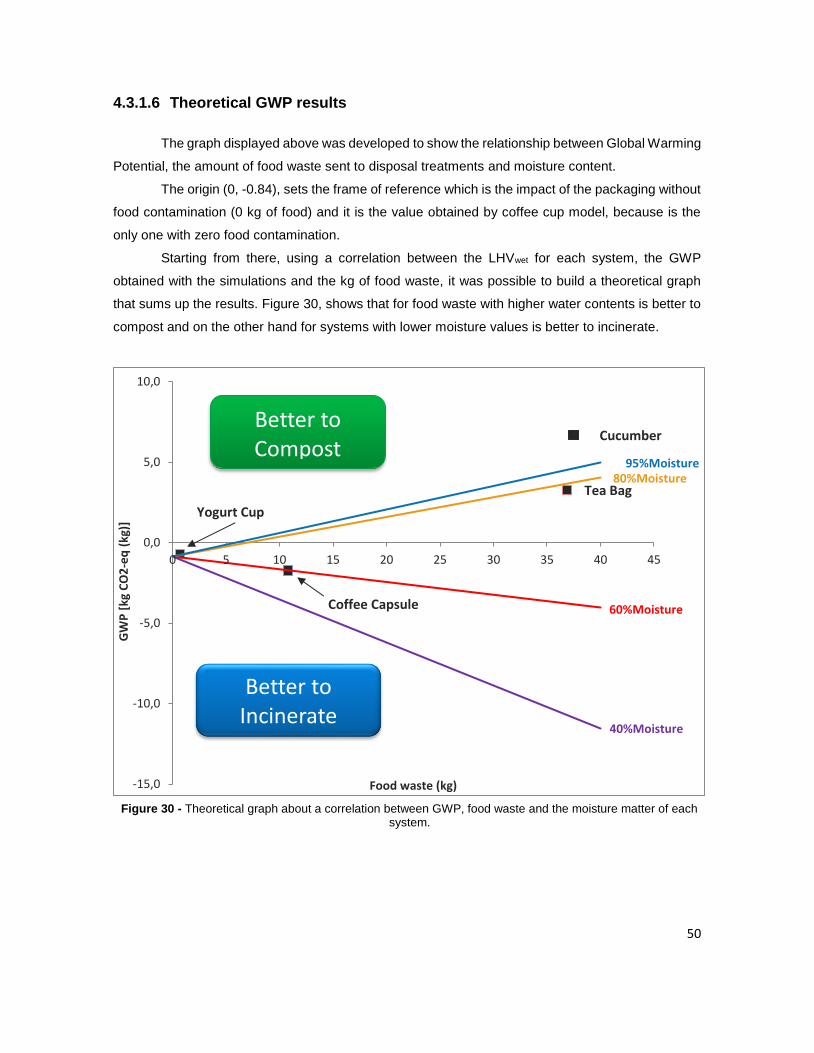
50
4.3.1.6 Theoretical GWP results
The graph displayed above was developed to show the relationship between Global Warming
Potential, the amount of food waste sent to disposal treatments and moisture content.
The origin (0, -0.84), sets the frame of reference which is the impact of the packaging without
food contamination (0 kg of food) and it is the value obtained by coffee cup model, because is the
only one with zero food contamination.
Starting from there, using a correlation between the LHVwet for each system, the GWP
obtained with the simulations and the kg of food waste, it was possible to build a theoretical graph
that sums up the results. Figure 30, shows that for food waste with higher water contents is better to
compost and on the other hand for systems with lower moisture values is better to incinerate.
Yogurt Cup
Coffee Capsule
Tea Bag
Cucumber
-15,0
-10,0
-5,0
0,0
5,0
10,0
0 5 10 15 20 25 30 35 40 45
GW
P [
kg C
O2
-eq
(kg
)]
Food waste (kg)
40%Moisture
60%Moisture
80%Moisture
Better to Incinerate
95%Moisture
Better to Compost
Figure 30 - Theoretical graph about a correlation between GWP, food waste and the moisture matter of each system.
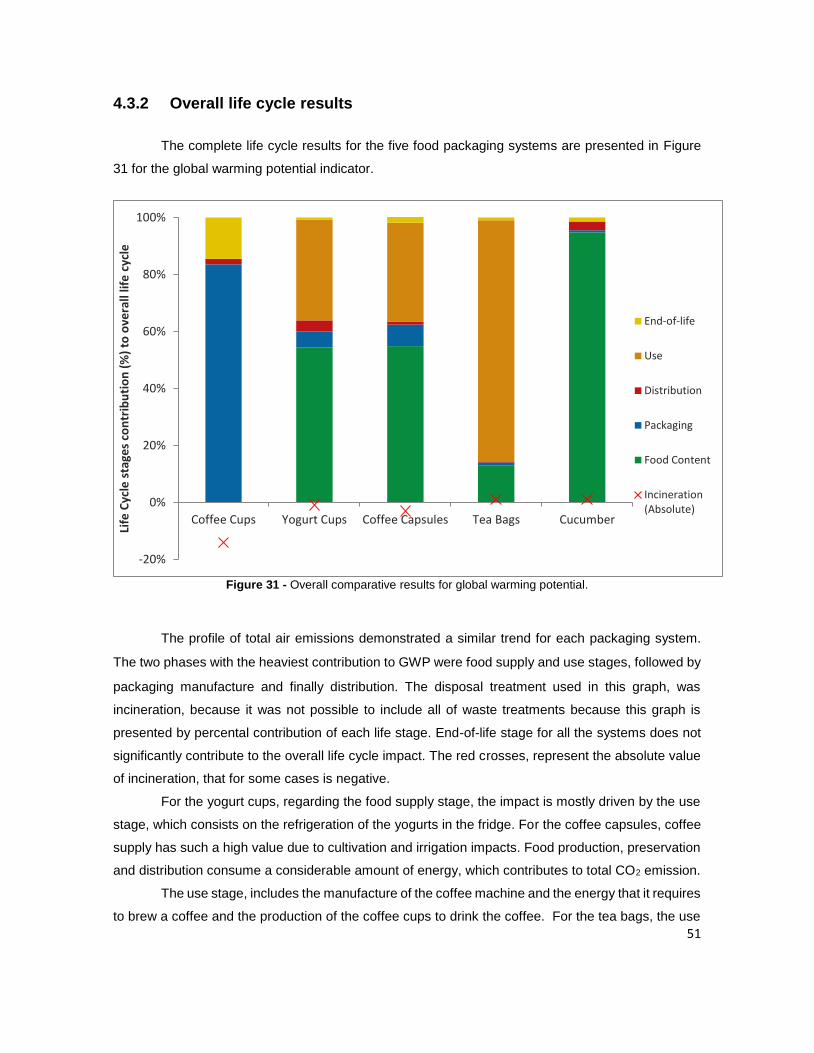
51
4.3.2 Overall life cycle results
The complete life cycle results for the five food packaging systems are presented in Figure
31 for the global warming potential indicator.
Figure 31 - Overall comparative results for global warming potential.
The profile of total air emissions demonstrated a similar trend for each packaging system.
The two phases with the heaviest contribution to GWP were food supply and use stages, followed by
packaging manufacture and finally distribution. The disposal treatment used in this graph, was
incineration, because it was not possible to include all of waste treatments because this graph is
presented by percental contribution of each life stage. End-of-life stage for all the systems does not
significantly contribute to the overall life cycle impact. The red crosses, represent the absolute value
of incineration, that for some cases is negative.
For the yogurt cups, regarding the food supply stage, the impact is mostly driven by the use
stage, which consists on the refrigeration of the yogurts in the fridge. For the coffee capsules, coffee
supply has such a high value due to cultivation and irrigation impacts. Food production, preservation
and distribution consume a considerable amount of energy, which contributes to total CO2 emission.
The use stage, includes the manufacture of the coffee machine and the energy that it requires
to brew a coffee and the production of the coffee cups to drink the coffee. For the tea bags, the use
-20%
0%
20%
40%
60%
80%
100%
Coffee Cups Yogurt Cups Coffee Capsules Tea Bags Cucumber
Life
Cyc
le s
tage
s co
ntr
ibu
tio
n (
%)
to o
vera
ll lif
e c
ycle
End-of-life
Use
Distribution
Packaging
Food Content
Incineration(Absolute)
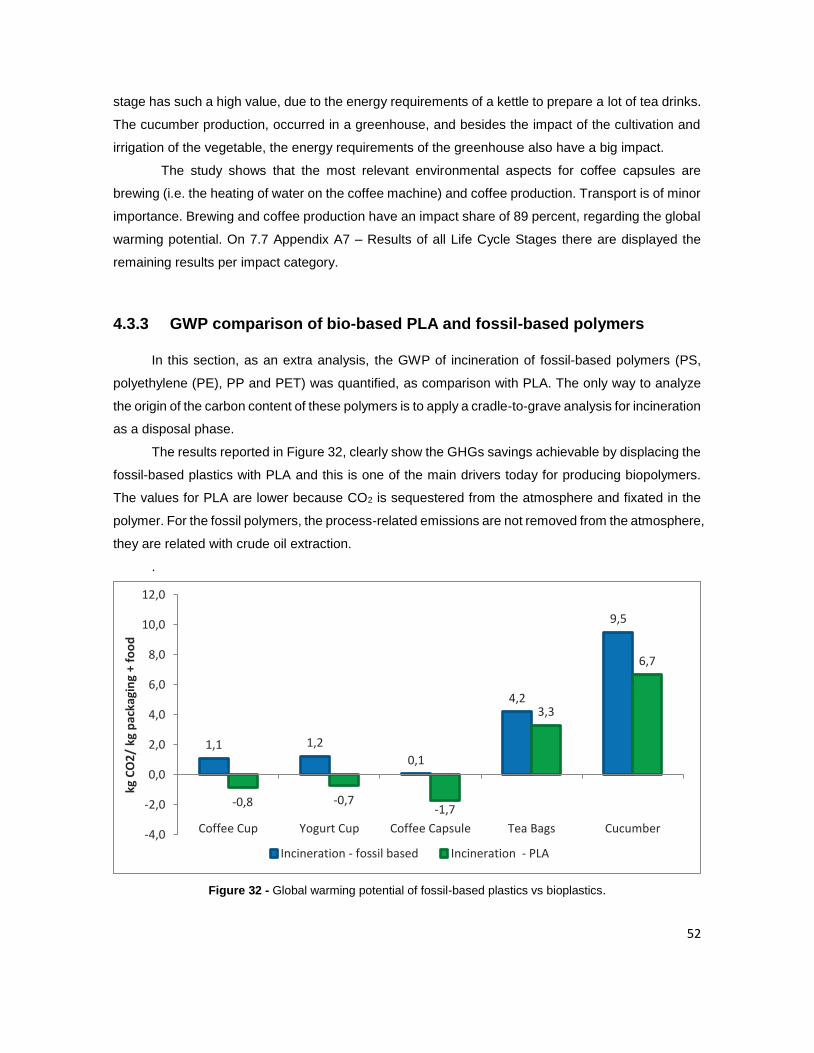
52
stage has such a high value, due to the energy requirements of a kettle to prepare a lot of tea drinks.
The cucumber production, occurred in a greenhouse, and besides the impact of the cultivation and
irrigation of the vegetable, the energy requirements of the greenhouse also have a big impact.
The study shows that the most relevant environmental aspects for coffee capsules are
brewing (i.e. the heating of water on the coffee machine) and coffee production. Transport is of minor
importance. Brewing and coffee production have an impact share of 89 percent, regarding the global
warming potential. On 7.7 Appendix A7 – Results of all Life Cycle Stages there are displayed the
remaining results per impact category.
4.3.3 GWP comparison of bio-based PLA and fossil-based polymers
In this section, as an extra analysis, the GWP of incineration of fossil-based polymers (PS,
polyethylene (PE), PP and PET) was quantified, as comparison with PLA. The only way to analyze
the origin of the carbon content of these polymers is to apply a cradle-to-grave analysis for incineration
as a disposal phase.
The results reported in Figure 32, clearly show the GHGs savings achievable by displacing the
fossil-based plastics with PLA and this is one of the main drivers today for producing biopolymers.
The values for PLA are lower because CO2 is sequestered from the atmosphere and fixated in the
polymer. For the fossil polymers, the process-related emissions are not removed from the atmosphere,
they are related with crude oil extraction.
.
Figure 32 - Global warming potential of fossil-based plastics vs bioplastics.
1,1 1,2
0,1
4,2
9,5
-0,8 -0,7-1,7
3,3
6,7
-4,0
-2,0
0,0
2,0
4,0
6,0
8,0
10,0
12,0
Coffee Cup Yogurt Cup Coffee Capsule Tea Bags Cucumber
kg C
O2
/ kg
pac
kagi
ng
+ fo
od
Incineration - fossil based Incineration - PLA
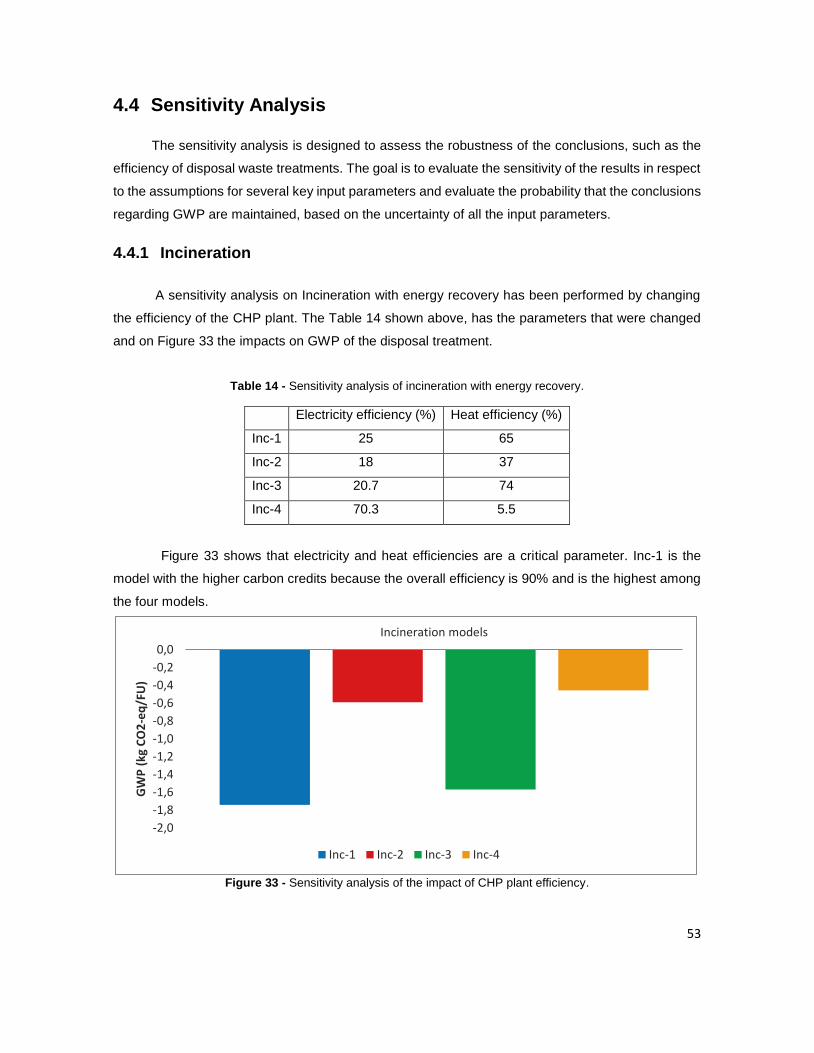
53
4.4 Sensitivity Analysis
The sensitivity analysis is designed to assess the robustness of the conclusions, such as the
efficiency of disposal waste treatments. The goal is to evaluate the sensitivity of the results in respect
to the assumptions for several key input parameters and evaluate the probability that the conclusions
regarding GWP are maintained, based on the uncertainty of all the input parameters.
4.4.1 Incineration
A sensitivity analysis on Incineration with energy recovery has been performed by changing
the efficiency of the CHP plant. The Table 14 shown above, has the parameters that were changed
and on Figure 33 the impacts on GWP of the disposal treatment.
Table 14 - Sensitivity analysis of incineration with energy recovery.
Electricity efficiency (%) Heat efficiency (%)
Inc-1 25 65
Inc-2 18 37
Inc-3 20.7 74
Inc-4 70.3 5.5
Figure 33 shows that electricity and heat efficiencies are a critical parameter. Inc-1 is the
model with the higher carbon credits because the overall efficiency is 90% and is the highest among
the four models.
Figure 33 - Sensitivity analysis of the impact of CHP plant efficiency.
-2,0
-1,8
-1,6
-1,4
-1,2
-1,0
-0,8
-0,6
-0,4
-0,2
0,0
Incineration models
GW
P (
kg C
O2
-eq
/FU
)
Inc-1 Inc-2 Inc-3 Inc-4
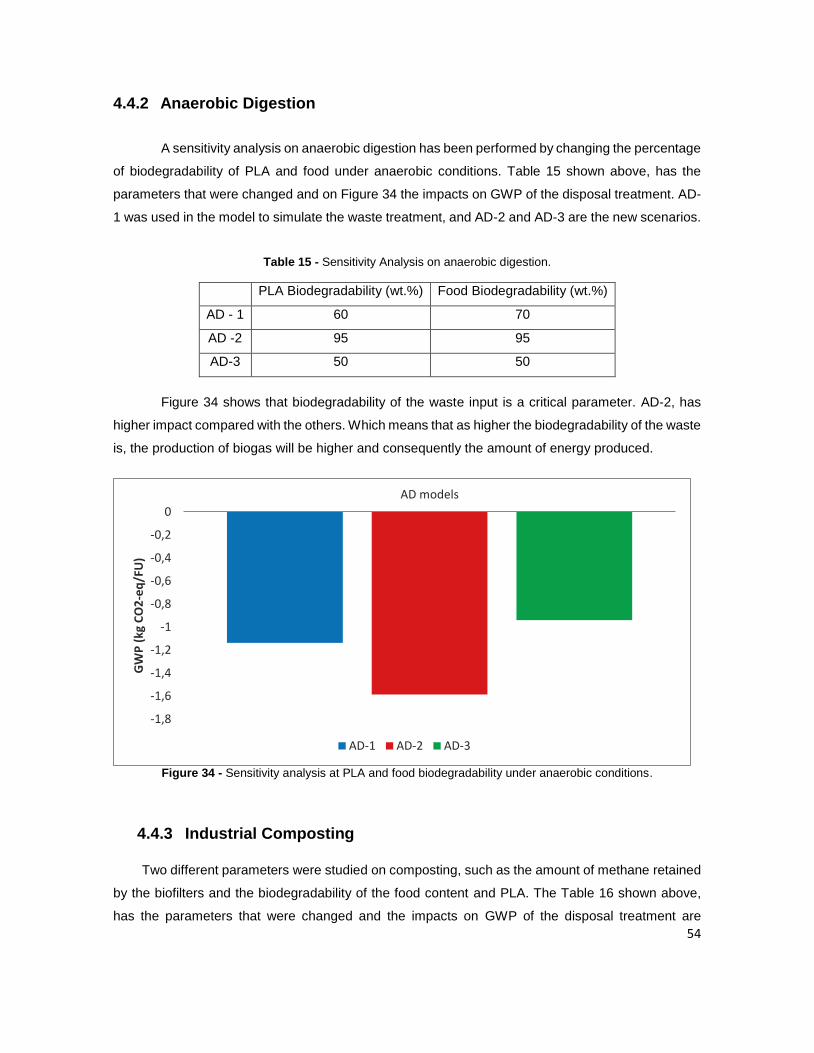
54
4.4.2 Anaerobic Digestion
A sensitivity analysis on anaerobic digestion has been performed by changing the percentage
of biodegradability of PLA and food under anaerobic conditions. Table 15 shown above, has the
parameters that were changed and on Figure 34 the impacts on GWP of the disposal treatment. AD-
1 was used in the model to simulate the waste treatment, and AD-2 and AD-3 are the new scenarios.
Table 15 - Sensitivity Analysis on anaerobic digestion.
PLA Biodegradability (wt.%) Food Biodegradability (wt.%)
AD - 1 60 70
AD -2 95 95
AD-3 50 50
Figure 34 shows that biodegradability of the waste input is a critical parameter. AD-2, has
higher impact compared with the others. Which means that as higher the biodegradability of the waste
is, the production of biogas will be higher and consequently the amount of energy produced.
Figure 34 - Sensitivity analysis at PLA and food biodegradability under anaerobic conditions.
4.4.3 Industrial Composting
Two different parameters were studied on composting, such as the amount of methane retained
by the biofilters and the biodegradability of the food content and PLA. The Table 16 shown above,
has the parameters that were changed and the impacts on GWP of the disposal treatment are
-1,8
-1,6
-1,4
-1,2
-1
-0,8
-0,6
-0,4
-0,2
0
AD models
GW
P (
kg C
O2
-eq
/FU
)
AD-1 AD-2 AD-3
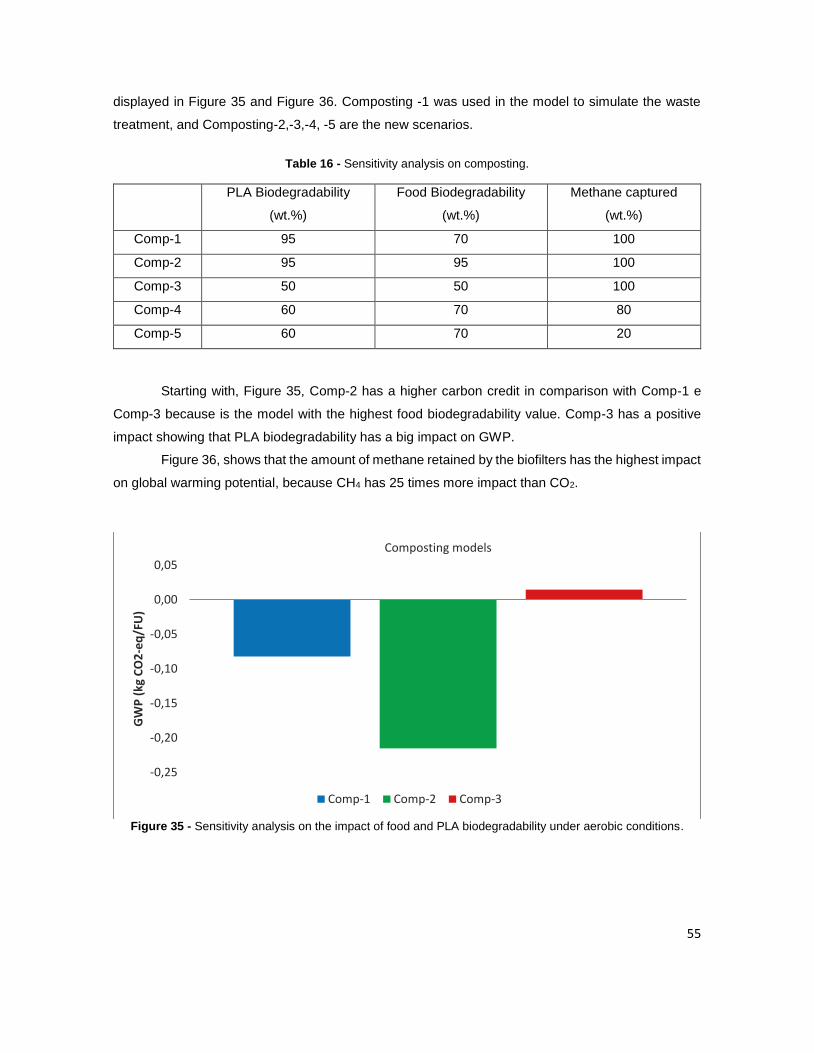
55
displayed in Figure 35 and Figure 36. Composting -1 was used in the model to simulate the waste
treatment, and Composting-2,-3,-4, -5 are the new scenarios.
Table 16 - Sensitivity analysis on composting.
PLA Biodegradability
(wt.%)
Food Biodegradability
(wt.%)
Methane captured
(wt.%)
Comp-1 95 70 100
Comp-2 95 95 100
Comp-3 50 50 100
Comp-4 60 70 80
Comp-5 60 70 20
Starting with, Figure 35, Comp-2 has a higher carbon credit in comparison with Comp-1 e
Comp-3 because is the model with the highest food biodegradability value. Comp-3 has a positive
impact showing that PLA biodegradability has a big impact on GWP.
Figure 36, shows that the amount of methane retained by the biofilters has the highest impact
on global warming potential, because CH4 has 25 times more impact than CO2.
Figure 35 - Sensitivity analysis on the impact of food and PLA biodegradability under aerobic conditions.
-0,25
-0,20
-0,15
-0,10
-0,05
0,00
0,05
Composting models
GW
P (
kg C
O2
-eq
/FU
)
Comp-1 Comp-2 Comp-3
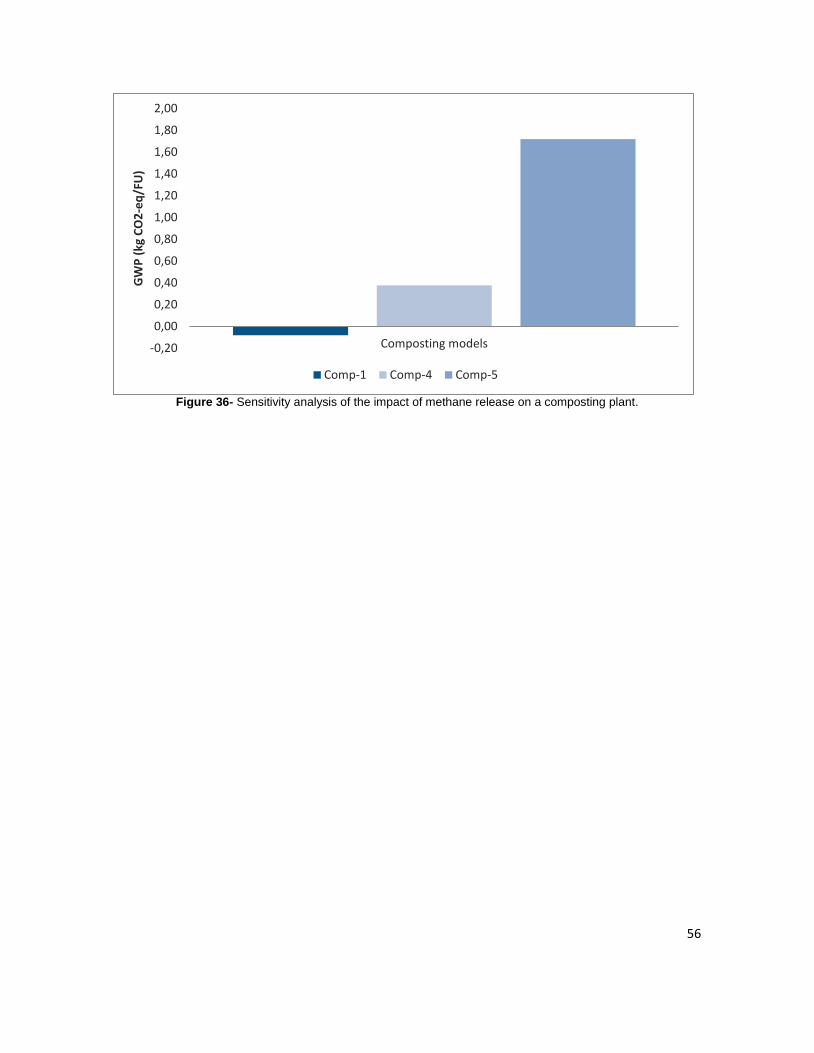
56
Figure 36- Sensitivity analysis of the impact of methane release on a composting plant.
-0,20
0,00
0,20
0,40
0,60
0,80
1,00
1,20
1,40
1,60
1,80
2,00
Composting models
GW
P (
kg C
O2
-eq
/FU
)
Comp-1 Comp-4 Comp-5
57
Chapter 5
Conclusions
For all three systems, the ranking observed never matches the ranking suggested by an
interpretation of the EU waste hierarchy. This is mostly because composting impacts are higher than
energy recovery by incineration. Unquestionably, landfilling is the worst waste management option
for bio-waste. However, for the management of biodegradable waste diverted from landfills, there
seems to be several environmentally favorable options. Incineration with energy recovery appears to
be the best solution for coffee cups, yogurts cups and coffee capsules. For tea bags and cucumbers,
incineration is not suitable due to the high amount of moisture content, and because of that
composting is the best solution.
Taking the entire production chain into account, the LCA results show that the most significant
impacts are related to the use phase, especially if a heating device is used, such as a kettle, coffee
machine or refrigerator. Finally, the influence of packaging disposal is very small in comparison with
the rest of the life cycles.
Recovering the energy from bio-based packages is far more favorable than burning synthetic
plastics because the carbon content of bio-based plastics does not stem from fossil sources. The
bioplastics production for the replacement of a part of fossil-based plastics seems to be a real and
effective strategy towards sustainable development. In fact, the displacing of conventional plastics
with bioplastics can lead to considerable energy and GHGs emissions savings.
The AD of organic waste is clearly on the rise within the EU because its main advantages lies in
converting organic waste into biogas, a renewable energy source. The next decade is likely to witness
a considerable rise in research regarding anaerobic digestion of PLA.
Sensitivity analysis, show that some assumptions for several key input parameters are very
important due to the uncertainty of all the input parameters.
5.1 Future work suggestions and study improvement
For future work, a mechanical and chemical recycling model should be done to make this analysis
even more complete. A landfill model including methane capture is also something that should be
addressed. Since the conclusions about land use and water scarcity were inconclusive, a new project
focusing on them could be interesting. A cost analysis should be done, to complete the study.
58
Chapter 6
Bibliography
A.Damgaard, C. T. (2010). Life-cycle-assessment of the historical development of air pollution control
and energy recovery in waste incineration. Waste Manag. 30, 1244-1250.
Andersen, J. (2010). Composting of organic waste:quantification and assessment of greenhouse gas
emissions. Lyngby, Denmark.
ASTM, I. D.-1. (2012). Standard Test Method for Determining Anerobic Biodegradation of Plastic
Materials Under Accelerated Landfill Conditions.
B.G Hermann, L. D. (2011). To compost or not to compost: Carbon and energy footprints of
biodegradable materials' waste treatment. Polymer Degradation and Stability 96 , 1159-1171.
Biener, J. J. (2013). Enhancing plastic recycling from danish households.
Bioplastics, E. (2017, August 17). European Bioplastics. Retrieved from Fact Sheet - April 2015 -
Anaerobic Digestion: http://docs.european-
bioplastics.org/publications/bp/EUBP_BP_Anaerobic_digestion.pdf
Bioplastics, E. (2017). European Bioplastics. Retrieved from European Bioplastics:
http://www.european-bioplastics.org
Bohlmann, G. M. (2004, November 29). Biodegradable Packaging Life-Cycle Assessment. Retrieved
from Wiley InterScience.
Boldrin A., M. J. (2009). Composting and compost utilization: Accounting of greenhouse gases and
global warming contributions. Waste Management & Research vol 27, 800-812.
Burke, D. (2001). Dairy Waste Anaerobic Digestion Handbook. In D. Burke, Dairy Waste Anaerobic
Digestion Handbook (pp. 1-57). Olympia.
C. Laußmann, U. L.-J.-S. (2010). Disposal of bio-polymers via energy recovery. Bioplastics Magazine,
42-43.
Chivrac, F. J. (2014). International Publication Patent No. WO 2014/068348 A1.
Chung, Y. (2007). Evaluation of gas removal and bacterial community diversity in a biofilter developed
to treat composting exhaust gases. Journal of Hazardous Materials vol 144, 377-385.
Corbion. (n.d.). Sheet/Film extrusion - Processing Guide. Gorinchem: Corbion.
Council, T. E. (2008). Directive 2008/98/EC on Waste.
Council, W. E. (2016). World Energy Resources - Waste to Energy.
De La Cruz FB, B. M. (2010). Estimation of waste component-specific landfill. Environmental Science
& Technology: 44(12), 4722-8.
59
De Wilde B, B. J. (1998). Prerequisites for biodegradable plastic materials for acceptance in real-life
composting plants and technical aspects. Polymer Degradation and Sustainability , 59(1-3):7-
12.
Doka G., D. L. (2003). Life Cycle Inventories of Waste Treatment Services, report No. 13. Dubendorf:
Swiss Centre for Life Cycle Inventories.
Ecoinvent 3.3. (2016). Ecoinvent 3.3 dataset documentation - Polyethylene Terephthalate
incineration. Ecoinvent.
Ekvall, T. (2001). Allocation in ISO 14041 - a critical review. Journal of Cleaner Production 9, 197-
208.
EU Comission, E. (2016). European Comission. Retrieved from Biodegradable Waste:
http://ec.europa.eu/environment/waste/compost/developments.htm
European Union, T. E. (1994). EUROPEAN PARLIAMENT AND COUNCIL DIRECTIVE 94/62/EC.
Official Journal of the European Communities.
Franklin Associates. (2011). Life Cycle Inventory of foam polystyrene, paper-based and PLA
foodservice products. Kansas: The Plastic foodservice packaging group.
Franziska Stoessel, R. J. (2012). Life Cycle Inventory and Carbon and Water FoodPrint of Fruits and
Vegetables: Application to a Swiss Retailer. Environmental Science & Technology 6(46) ,
3253-3262.
Frischknocht R, J. N. (2007). Ecoinvent v.2 report: overview and methodology.
Gaurav Kale, T. K. (2007). Compostability of Bioplastic Packaging Materials: An overview.
Macromolecular Bioscience vol.7, 255-277.
Gentil, E. D. (2010). Models for waste life cyle assessment: Review of technical assumptions. In O.
T. Eriksson, Waste Management vol.30 (pp. 2636-2648). Eds.
Goedkoop, M., Heijungs, R., Huijbregts, M., Schryver, A., Struijs, J., & van Zelm, R. (2009). ReCiPe
2008 - A life cycle impact assessment method which comprises harmonised category
indicators at the midpoint and the endpoint level, Report I - characterisation, First edition .
Gopferich, A. (1997). Mechanisms of polymer degradation and elimination. In A. K. A.J. Domb,
Handbook of Biodegradable Polymers (pp. 451-471). Montreux: Hardwood Academic.
Gregory A. Keoleian, A. W. (2004). Life Cycle Environmental Performance and Improvement of a
Yogurt Product Delivery system. Packaging Technology and science, vol.17, 85-103.
Grzegorz Ganczewski, K. N. (2014). Life cycle assessment (LCA) of selected tomato packaging.
Warsaw,Poland: CHEMIK.
Günter Müller, E. H. (2014). End-of-life Solutions for Fibre and Bio-based Packaging Materials in
Europe. Packaging Technology and Science, vol. 27, 1-15.
60
Hampton, M. (2017, July 23). Food Waste Composting. Retrieved from University of Florida:
http://www.cra-recycle.org/CCC/education-
training/2Day%20Presentations/7_Ozores_Food%20Waste%20Composting.pdf
Haug, R. (1993). The Practical Handbook of Compost Engineering. USA: CRC Press.
Henrikke Baumann, A.-M. T. (2012). The Hitch Hiker's Guide to LCA - An orientation in life cycle
assessment methodology and application. Lund: Studenlitteratur.
Hischier, R. E. (2007). Part II - Plastics. Dubendorf: Life Cycle Inventories of Packaging and Graphical
Papers - ecoinvent report no. 11.
Hoekstra, A. Y. (2016). A critique on the water-scarcity weighted water footprint in LCA. Ecological
Indicators 66, 564-573.
Hosun Lim, P. (2010). A Review of Spun Bond Process. Journal of Textile and Apparel Technology
and Management vol.6 .
Huijbregts MAJ, R. L. (2006). Is cumulative fossil energy demand a useful indicator for the
environmental performance of products? Environmental Science & Technology , 40(3):641-
8.
IEA, I. E. (2017, July 4). International Energy Agency Task 37: Energy from biogas and landfill gas.
Retrieved from International Energy Agency: http://www.iea-biogas.net
Institute, T. N. (2017, July 15). Fooddata+. Retrieved from Danish Fooddata:
http://frida.fooddata.dk/?lang=en
International Standard ISO 14044, I. (2006). Environmental management - life cycle assessment -
requeriments and guidelines.
ISHIGAKI T., S. W. (2004). The degradability of biodegradable plastics in aerobic and anaerobic
waste landfill model reactors. Chemosphere 54, 225.
Jae Choon Lee, J. H.-H.-C.-S. (2016). Biodegradability of Poly(lactic acid) (PLA)/Lactic Acid (LA)
Blends Using Anaerobic Digester Sludge. Macromolecular Research.
Jefferies, D. (2012). Water Footprint and Life Cycle Assessment as approaches to assess potential
impacts of products on water consumption. Key learning points from pilot studies on tea and
margarine. Journal of Cleaner Production 33, 155-166.
Jeroen B., G. (n.d.). Handbook on Life Cycle Assessment: Operational Guide to the ISO Standards.
Kluwer Academic Publishers.
Kim, H., & Townsend, T. (2012). Wet Landfill Decompostion Rate Determination Using Methane Yield
Resuts for Excavated Waste Samples. Waste Management, vol. 32, 1427-1433.
Kleis, H. &. (2007). 100 Years of waste incineration in Denmark - From Refuse Destruction Plants to
High-Technology Energy Work.
Krueger M, K. B. (2006). Life Cycle Assessment of food packaging made of Ingeo biopolymer and (r)
PET. Heidelberg: IFEU report.
61
L.-T.-Lim, R. A. (2008). Processing technologies for poly(lactic acid). Prog. Polym. Sci. vol.33, 820-
852.
Lasse Tobiasen, K. K. (2014). Waste to Energy - Energy Recovery of Green Bin Waste:
Incineration/Biogas Comparison. Curr Sustainable Renewable Energy Rep vol.1, 136-149.
Levenmore, G. (2008). A review of the IPCC assessment report four, part 1: the IPCC process and
greenhouse gas emission trends from builidngs worldwide. Build Serv Eng Res Technology,
vol. 29, 349-361.
M.Grosso, A. L. (2010). Efficiency of energy recovery from waste incineration, in the light of the new
Waste Framework Directive. Waste Manag. 30, 1238-1243.
Margallo M, H. A. (2014). Sustainability evaluation of municipal solid waste incineration using a life
cycle assessment approach. 13 MCCE.
Max J.Krause, T. G. (2016). Life Cycle Assumptions of Landfilled Polylactic Acid Underpredict
Methane Generation. Environmental Sicence & Technology Letters, 166-169.
McDougall F., W. P. (2001). Integrated Solid Waste Management: A Life-Cycle Inventory. Blackwell
Science, second edition.
MØller, J. B. (2009). Anaerobic digestion and digestate use: Accounting of greenhouse gases and
global warming contribution. Waste Management & Research Journal vol 27, 813-824.
Phyllis2. (2012). Database for biomass and waste. Retrieved August 17, 2017, from Energy research
Centre of the Netherlands: https://www.ecn.nl/phyllis2
Piemonte, V. (2011). Bioplastic Wastes: The Best Final Disposition for Energy Saving. J. Polym.
Environmental vol. 19 , 988-994.
Plastic Zero. (2017, May 6). Retrieved from Plastic Zero: ttp://www.plastic-
zero.com/media/4186/short_project_description.pdf
Powelson, D. C. (2006). Methane Oxidation in water-spreading and compost biofilters. Waste
Management & Research, 528-536.
Purac, C. (n.d.). Processing guide - Compounding high heat PLA/PDLA. Gorinchem: Corbion.
Quantis. (2011). Comparative full life cycle assessment of B2C cup of espresso made using a
packaging and distribution system from Nespresso Espresso and three generic products.
Lausanne: Swiss office of Quantis.
Quantis, c. (2015). Life Cycle Assessment of coffee consumption: comparison of single-serve coffee
and bulk coffee brewing.
R.C. Thompson, C. M. (2009). Plastics, the environment and human health: current consensus and
future trends. 2009: Philos. Trans. R. Soc.
Rodríguez JJ and Irabien, A. (2013). Gestión sostenible de los residuos sólidos peligrosos. Madrid,
Spain: Síntesis S.A.
Roland Hischier, E. S. (2007). Part II - Plastics. Dubendorf.
62
Rudnik, E. (2010). Compostable Polymer Materials. Elsevier.
S.Obuchi, S. (2010). Packaging and other commercial applications. In L. L. R.Auras, Poly(Lactic Acid):
Synthesis, Structures, Properties, Processing, and Applications (pp. 457-467). New Jersey:
John Wiley & Sons.
Solomon S, Q. D. (2007). IPCC Climate Change 2007-. the physical science basis. Cambridge.
T. Kijchavengkul, R. A. (2008). Compostability of polymers. Polym. Int. 57, 793-804.
Trautmann, N. (2017, July 27). Cornell Composting - Science & Engineering. Retrieved from Cornell
Composting - Science & Engineering: http://compost.css.cornell.edu/physics.html
Turconi, R. B. (2011). Life cycle assessment of waste incineration in Denmark and Italy using two
LCA models. Waste Management, vol.29, 78-90.
United States Environmental Protection Agency. (2001). Retrieved April 3, 2017, from
http://www.epa.gov/ORD/NRMRL/lcaccess/lca101.htm.
V. Rossi, N. C.-E. (2015). Life cycle assessment of end-of-life options for two biodegradable
packaging materials: sound application of the European waste hierarchy. J. Clean. Prod. 86,
132-145.
Walter R. Niessen, P. B. (2010). Combustion and Incineration Processes - Applications in
environmental engineering. Massachusetts, USA: CRC Press.
WARM, U. E. (2016). U.S. EPA. Documentation for Greenhouse Gas Emission and Energy Factors
Used in the Waste Reduction Model (WARM). Retrieved July 23, 2017, from
http://www3.epa.gov/warm/pdfs/WARM_Documentation.pdf
Weidema, B. S. (2010). Avoiding allocation in life cycle assessment revisited. Journal of Industrial
Ecology 14(2), 195.
Wikimedia Foundation Inc. (2017, March 15). Enthalpy of vaporization. Retrieved from Wikipedia:
https://en.wikipedia.org/wiki/Enthalpy_of_vaporization
Wim Groot, J. V. (2010). PRODUCTION AND PURIFICATION OF LACTIC ACID AND LACTIDE. In
L.-T. L. R. Auras, Poly(lactic acid): Synthesis, Structures, Properties, Processing, and
Applications. John Wiley & Sons, Inc.
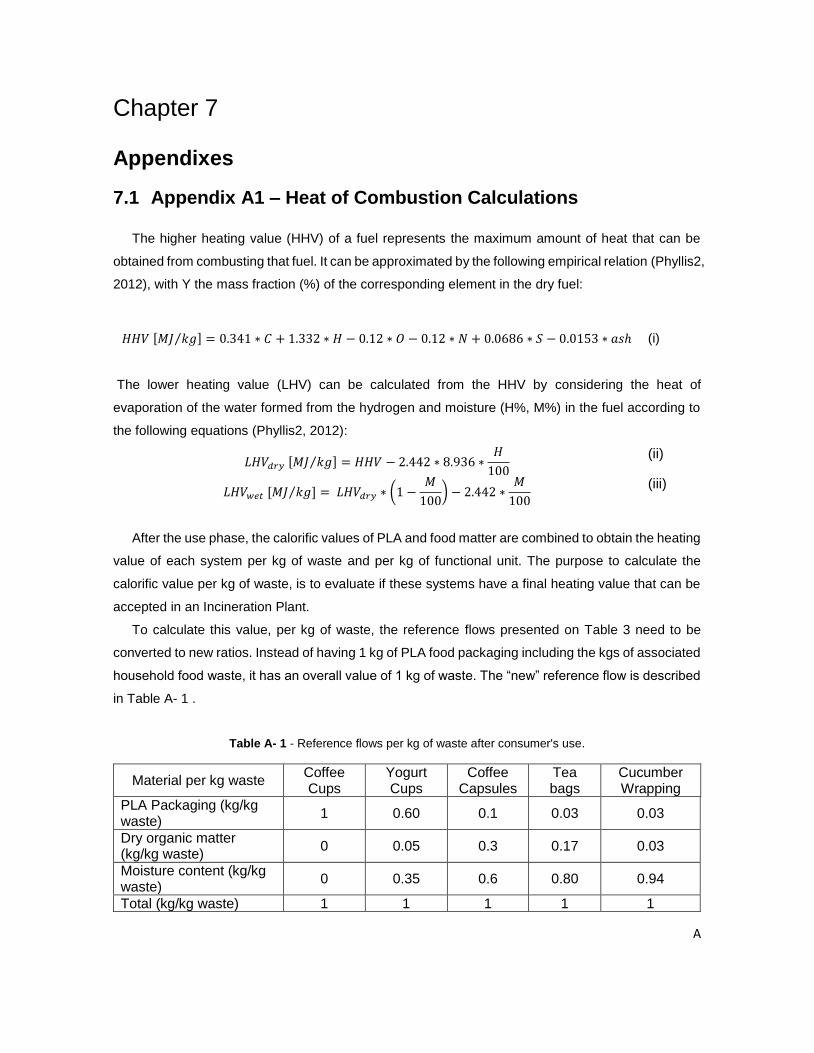
A
Chapter 7
Appendixes
7.1 Appendix A1 – Heat of Combustion Calculations
The higher heating value (HHV) of a fuel represents the maximum amount of heat that can be
obtained from combusting that fuel. It can be approximated by the following empirical relation (Phyllis2,
2012), with Y the mass fraction (%) of the corresponding element in the dry fuel:
𝐻𝐻𝑉 [𝑀𝐽 𝑘𝑔⁄ ] = 0.341 ∗ 𝐶 + 1.332 ∗ 𝐻 − 0.12 ∗ 𝑂 − 0.12 ∗ 𝑁 + 0.0686 ∗ 𝑆 − 0.0153 ∗ 𝑎𝑠ℎ (i)
The lower heating value (LHV) can be calculated from the HHV by considering the heat of
evaporation of the water formed from the hydrogen and moisture (H%, M%) in the fuel according to
the following equations (Phyllis2, 2012):
𝐿𝐻𝑉𝑑𝑟𝑦 [𝑀𝐽 𝑘𝑔⁄ ] = 𝐻𝐻𝑉 − 2.442 ∗ 8.936 ∗𝐻
100
(ii)
𝐿𝐻𝑉𝑤𝑒𝑡 [𝑀𝐽 𝑘𝑔]⁄ = 𝐿𝐻𝑉𝑑𝑟𝑦 ∗ (1 −𝑀
100) − 2.442 ∗
𝑀
100
(iii)
After the use phase, the calorific values of PLA and food matter are combined to obtain the heating
value of each system per kg of waste and per kg of functional unit. The purpose to calculate the
calorific value per kg of waste, is to evaluate if these systems have a final heating value that can be
accepted in an Incineration Plant.
To calculate this value, per kg of waste, the reference flows presented on Table 3 need to be
converted to new ratios. Instead of having 1 kg of PLA food packaging including the kgs of associated
household food waste, it has an overall value of 1 kg of waste. The “new” reference flow is described
in Table A- 1 .
Table A- 1 - Reference flows per kg of waste after consumer's use.
Material per kg waste Coffee Cups
Yogurt Cups
Coffee Capsules
Tea bags
Cucumber Wrapping
PLA Packaging (kg/kg waste)
1 0.60 0.1 0.03 0.03
Dry organic matter (kg/kg waste)
0 0.05 0.3 0.17 0.03
Moisture content (kg/kg waste)
0 0.35 0.6 0.80 0.94
Total (kg/kg waste) 1 1 1 1 1
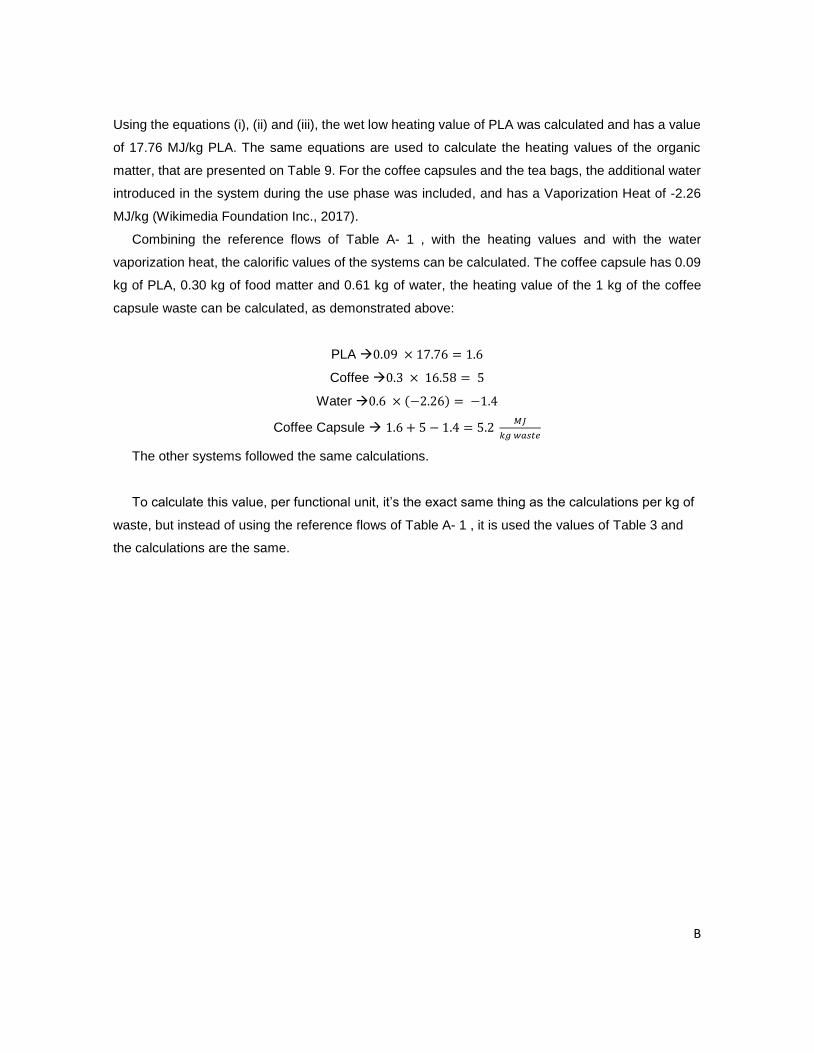
B
Using the equations (i), (ii) and (iii), the wet low heating value of PLA was calculated and has a value
of 17.76 MJ/kg PLA. The same equations are used to calculate the heating values of the organic
matter, that are presented on Table 9. For the coffee capsules and the tea bags, the additional water
introduced in the system during the use phase was included, and has a Vaporization Heat of -2.26
MJ/kg (Wikimedia Foundation Inc., 2017).
Combining the reference flows of Table A- 1 , with the heating values and with the water
vaporization heat, the calorific values of the systems can be calculated. The coffee capsule has 0.09
kg of PLA, 0.30 kg of food matter and 0.61 kg of water, the heating value of the 1 kg of the coffee
capsule waste can be calculated, as demonstrated above:
PLA 0.09 × 17.76 = 1.6
Coffee 0.3 × 16.58 = 5
Water 0.6 × (−2.26) = −1.4
Coffee Capsule 1.6 + 5 − 1.4 = 5.2 𝑀𝐽
𝑘𝑔 𝑤𝑎𝑠𝑡𝑒
The other systems followed the same calculations.
To calculate this value, per functional unit, it’s the exact same thing as the calculations per kg of
waste, but instead of using the reference flows of Table A- 1 , it is used the values of Table 3 and
the calculations are the same.
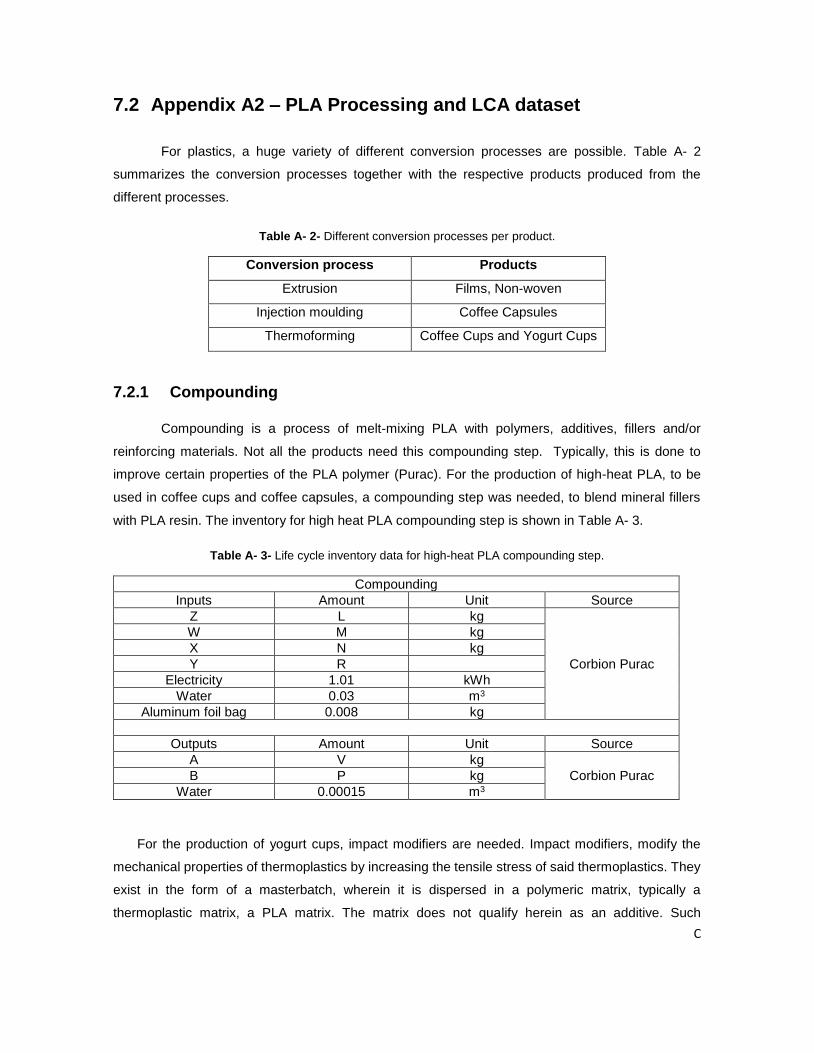
C
7.2 Appendix A2 – PLA Processing and LCA dataset
For plastics, a huge variety of different conversion processes are possible. Table A- 2
summarizes the conversion processes together with the respective products produced from the
different processes.
Table A- 2- Different conversion processes per product.
Conversion process Products
Extrusion Films, Non-woven
Injection moulding Coffee Capsules
Thermoforming Coffee Cups and Yogurt Cups
7.2.1 Compounding
Compounding is a process of melt-mixing PLA with polymers, additives, fillers and/or
reinforcing materials. Not all the products need this compounding step. Typically, this is done to
improve certain properties of the PLA polymer (Purac). For the production of high-heat PLA, to be
used in coffee cups and coffee capsules, a compounding step was needed, to blend mineral fillers
with PLA resin. The inventory for high heat PLA compounding step is shown in Table A- 3.
Table A- 3- Life cycle inventory data for high-heat PLA compounding step.
Compounding
Inputs Amount Unit Source
Z L kg
Corbion Purac
W M kg
X N kg
Y R
Electricity 1.01 kWh
Water 0.03 m3
Aluminum foil bag 0.008 kg
Outputs Amount Unit Source
A V kg
Corbion Purac B P kg
Water 0.00015 m3
For the production of yogurt cups, impact modifiers are needed. Impact modifiers, modify the
mechanical properties of thermoplastics by increasing the tensile stress of said thermoplastics. They
exist in the form of a masterbatch, wherein it is dispersed in a polymeric matrix, typically a
thermoplastic matrix, a PLA matrix. The matrix does not qualify herein as an additive. Such
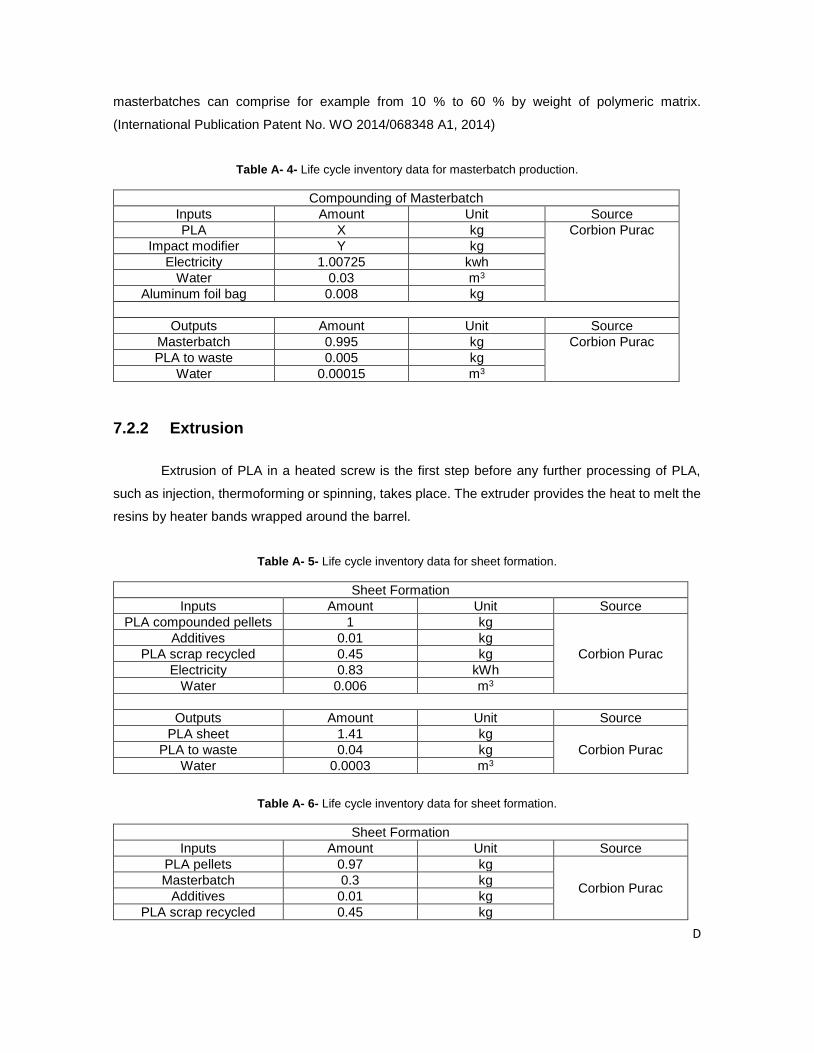
D
masterbatches can comprise for example from 10 % to 60 % by weight of polymeric matrix.
(International Publication Patent No. WO 2014/068348 A1, 2014)
Table A- 4- Life cycle inventory data for masterbatch production.
Compounding of Masterbatch
Inputs Amount Unit Source
PLA X kg Corbion Purac
Impact modifier Y kg
Electricity 1.00725 kwh
Water 0.03 m3
Aluminum foil bag 0.008 kg
Outputs Amount Unit Source
Masterbatch 0.995 kg Corbion Purac
PLA to waste 0.005 kg
Water 0.00015 m3
7.2.2 Extrusion
Extrusion of PLA in a heated screw is the first step before any further processing of PLA,
such as injection, thermoforming or spinning, takes place. The extruder provides the heat to melt the
resins by heater bands wrapped around the barrel.
Table A- 5- Life cycle inventory data for sheet formation.
Sheet Formation
Inputs Amount Unit Source
PLA compounded pellets 1 kg
Corbion Purac
Additives 0.01 kg
PLA scrap recycled 0.45 kg
Electricity 0.83 kWh
Water 0.006 m3
Outputs Amount Unit Source
PLA sheet 1.41 kg
Corbion Purac PLA to waste 0.04 kg
Water 0.0003 m3
Table A- 6- Life cycle inventory data for sheet formation.
Sheet Formation
Inputs Amount Unit Source
PLA pellets 0.97 kg
Corbion Purac Masterbatch 0.3 kg
Additives 0.01 kg
PLA scrap recycled 0.45 kg
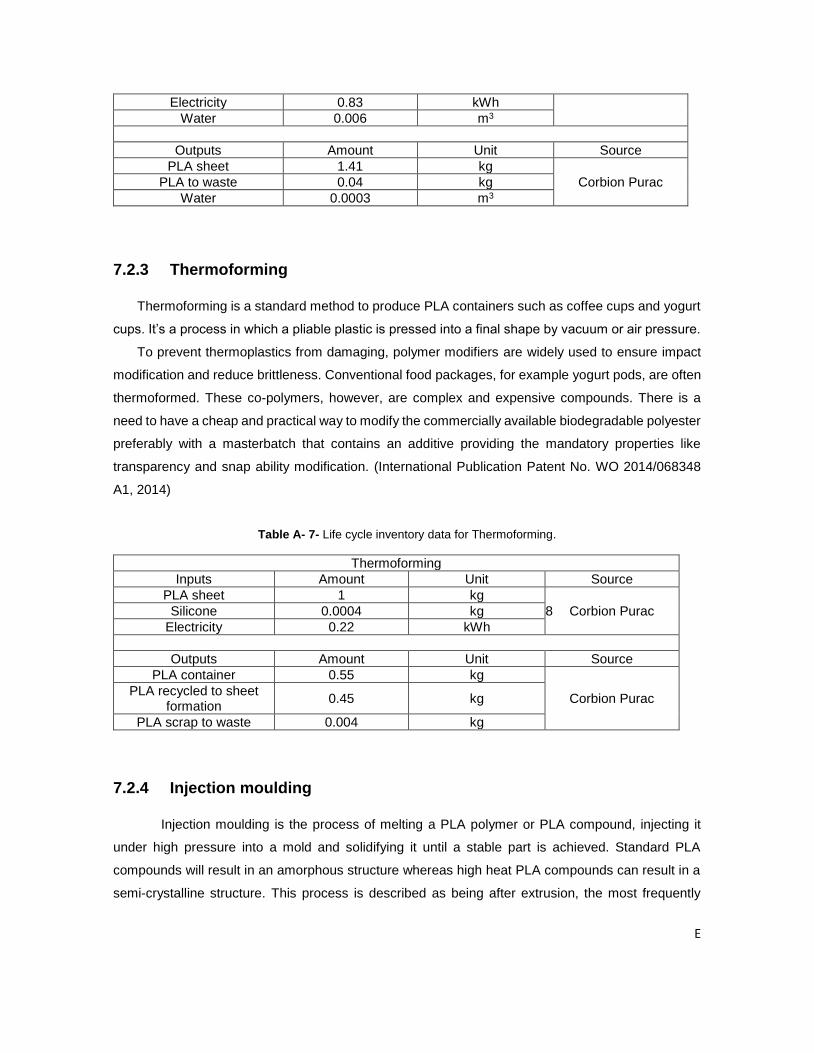
E
Electricity 0.83 kWh
Water 0.006 m3
Outputs Amount Unit Source
PLA sheet 1.41 kg
Corbion Purac PLA to waste 0.04 kg
Water 0.0003 m3
7.2.3 Thermoforming
Thermoforming is a standard method to produce PLA containers such as coffee cups and yogurt
cups. It’s a process in which a pliable plastic is pressed into a final shape by vacuum or air pressure.
To prevent thermoplastics from damaging, polymer modifiers are widely used to ensure impact
modification and reduce brittleness. Conventional food packages, for example yogurt pods, are often
thermoformed. These co-polymers, however, are complex and expensive compounds. There is a
need to have a cheap and practical way to modify the commercially available biodegradable polyester
preferably with a masterbatch that contains an additive providing the mandatory properties like
transparency and snap ability modification. (International Publication Patent No. WO 2014/068348
A1, 2014)
Table A- 7- Life cycle inventory data for Thermoforming.
Thermoforming
Inputs Amount Unit Source
PLA sheet 1 kg
8 Corbion Purac Silicone 0.0004 kg
Electricity 0.22 kWh
Outputs Amount Unit Source
PLA container 0.55 kg
Corbion Purac PLA recycled to sheet
formation 0.45 kg
PLA scrap to waste 0.004 kg
7.2.4 Injection moulding
Injection moulding is the process of melting a PLA polymer or PLA compound, injecting it
under high pressure into a mold and solidifying it until a stable part is achieved. Standard PLA
compounds will result in an amorphous structure whereas high heat PLA compounds can result in a
semi-crystalline structure. This process is described as being after extrusion, the most frequently
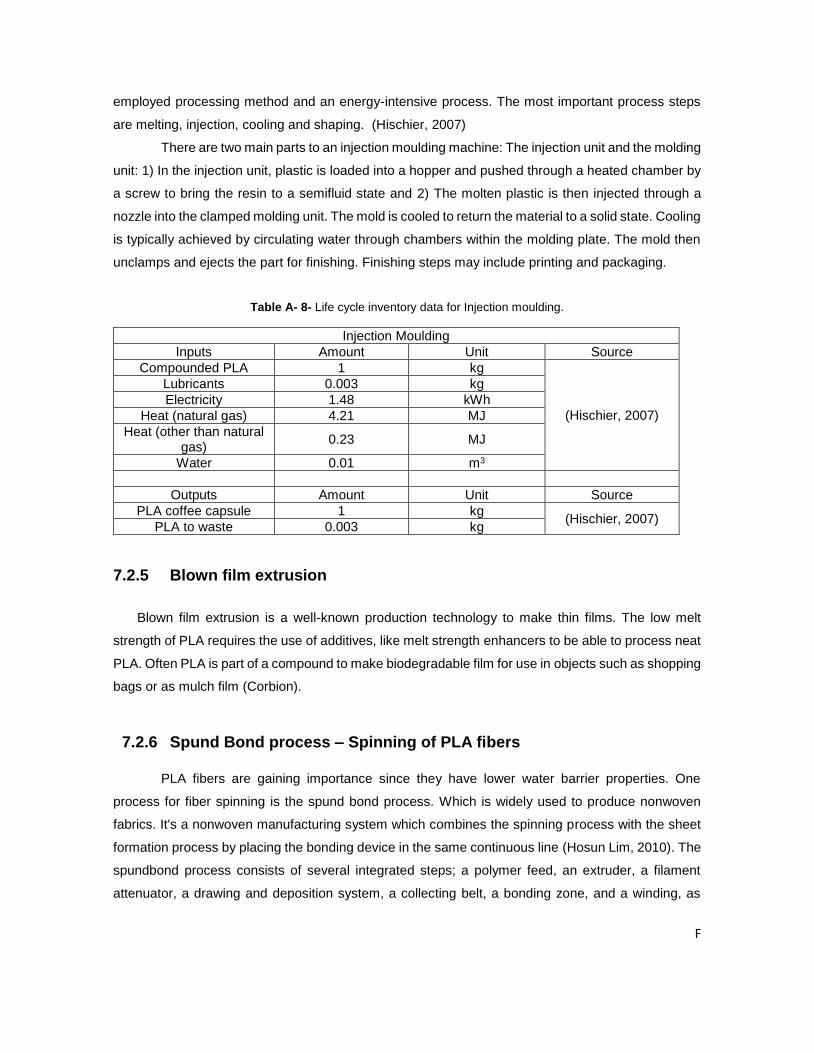
F
employed processing method and an energy-intensive process. The most important process steps
are melting, injection, cooling and shaping. (Hischier, 2007)
There are two main parts to an injection moulding machine: The injection unit and the molding
unit: 1) In the injection unit, plastic is loaded into a hopper and pushed through a heated chamber by
a screw to bring the resin to a semifluid state and 2) The molten plastic is then injected through a
nozzle into the clamped molding unit. The mold is cooled to return the material to a solid state. Cooling
is typically achieved by circulating water through chambers within the molding plate. The mold then
unclamps and ejects the part for finishing. Finishing steps may include printing and packaging.
Table A- 8- Life cycle inventory data for Injection moulding.
Injection Moulding
Inputs Amount Unit Source
Compounded PLA 1 kg
8 (Hischier, 2007)
Lubricants 0.003 kg
Electricity 1.48 kWh
Heat (natural gas) 4.21 MJ
Heat (other than natural gas)
0.23 MJ
Water 0.01 m3
Outputs Amount Unit Source
PLA coffee capsule 1 kg (Hischier, 2007)
PLA to waste 0.003 kg
7.2.5 Blown film extrusion
Blown film extrusion is a well-known production technology to make thin films. The low melt
strength of PLA requires the use of additives, like melt strength enhancers to be able to process neat
PLA. Often PLA is part of a compound to make biodegradable film for use in objects such as shopping
bags or as mulch film (Corbion).
7.2.6 Spund Bond process – Spinning of PLA fibers
PLA fibers are gaining importance since they have lower water barrier properties. One
process for fiber spinning is the spund bond process. Which is widely used to produce nonwoven
fabrics. It's a nonwoven manufacturing system which combines the spinning process with the sheet
formation process by placing the bonding device in the same continuous line (Hosun Lim, 2010). The
spundbond process consists of several integrated steps; a polymer feed, an extruder, a filament
attenuator, a drawing and deposition system, a collecting belt, a bonding zone, and a winding, as
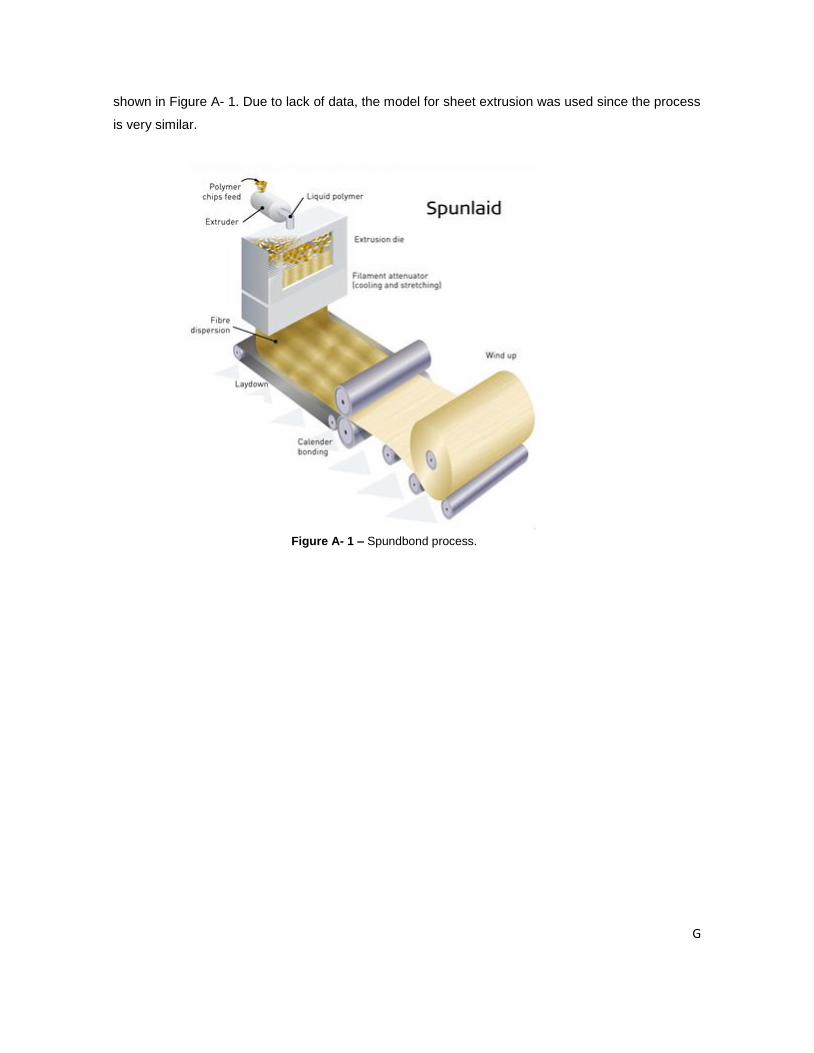
G
shown in Figure A- 1. Due to lack of data, the model for sheet extrusion was used since the process
is very similar.
Figure A- 1 – Spundbond process.
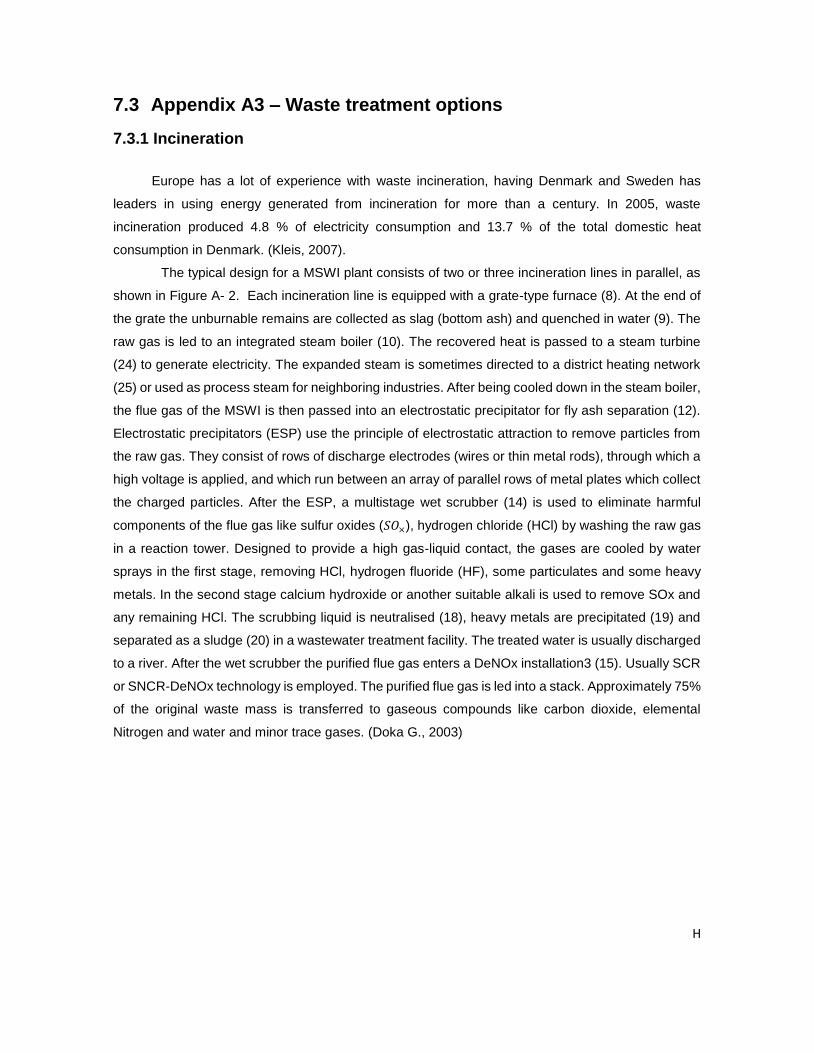
H
7.3 Appendix A3 – Waste treatment options
7.3.1 Incineration
Europe has a lot of experience with waste incineration, having Denmark and Sweden has
leaders in using energy generated from incineration for more than a century. In 2005, waste
incineration produced 4.8 % of electricity consumption and 13.7 % of the total domestic heat
consumption in Denmark. (Kleis, 2007).
The typical design for a MSWI plant consists of two or three incineration lines in parallel, as
shown in Figure A- 2. Each incineration line is equipped with a grate-type furnace (8). At the end of
the grate the unburnable remains are collected as slag (bottom ash) and quenched in water (9). The
raw gas is led to an integrated steam boiler (10). The recovered heat is passed to a steam turbine
(24) to generate electricity. The expanded steam is sometimes directed to a district heating network
(25) or used as process steam for neighboring industries. After being cooled down in the steam boiler,
the flue gas of the MSWI is then passed into an electrostatic precipitator for fly ash separation (12).
Electrostatic precipitators (ESP) use the principle of electrostatic attraction to remove particles from
the raw gas. They consist of rows of discharge electrodes (wires or thin metal rods), through which a
high voltage is applied, and which run between an array of parallel rows of metal plates which collect
the charged particles. After the ESP, a multistage wet scrubber (14) is used to eliminate harmful
components of the flue gas like sulfur oxides (𝑆𝑂×), hydrogen chloride (HCl) by washing the raw gas
in a reaction tower. Designed to provide a high gas-liquid contact, the gases are cooled by water
sprays in the first stage, removing HCl, hydrogen fluoride (HF), some particulates and some heavy
metals. In the second stage calcium hydroxide or another suitable alkali is used to remove SOx and
any remaining HCl. The scrubbing liquid is neutralised (18), heavy metals are precipitated (19) and
separated as a sludge (20) in a wastewater treatment facility. The treated water is usually discharged
to a river. After the wet scrubber the purified flue gas enters a DeNOx installation3 (15). Usually SCR
or SNCR-DeNOx technology is employed. The purified flue gas is led into a stack. Approximately 75%
of the original waste mass is transferred to gaseous compounds like carbon dioxide, elemental
Nitrogen and water and minor trace gases. (Doka G., 2003)
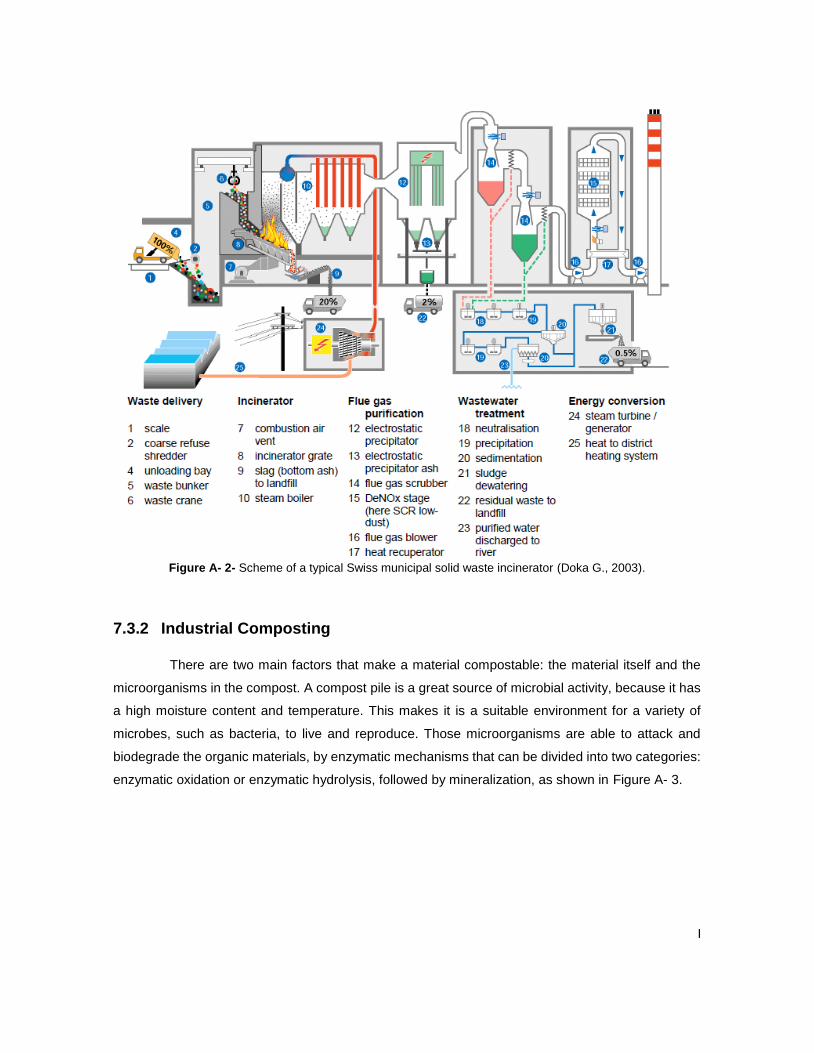
I
Figure A- 2- Scheme of a typical Swiss municipal solid waste incinerator (Doka G., 2003).
7.3.2 Industrial Composting
There are two main factors that make a material compostable: the material itself and the
microorganisms in the compost. A compost pile is a great source of microbial activity, because it has
a high moisture content and temperature. This makes it is a suitable environment for a variety of
microbes, such as bacteria, to live and reproduce. Those microorganisms are able to attack and
biodegrade the organic materials, by enzymatic mechanisms that can be divided into two categories:
enzymatic oxidation or enzymatic hydrolysis, followed by mineralization, as shown in Figure A- 3.
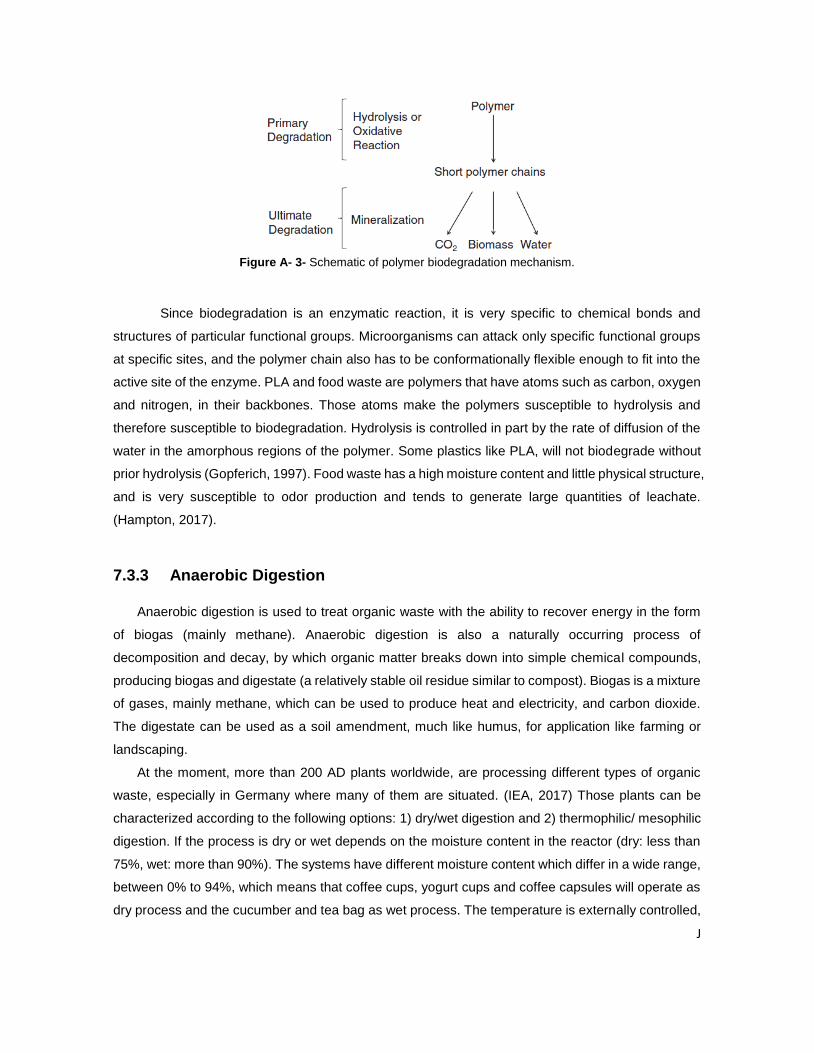
J
Figure A- 3- Schematic of polymer biodegradation mechanism.
Since biodegradation is an enzymatic reaction, it is very specific to chemical bonds and
structures of particular functional groups. Microorganisms can attack only specific functional groups
at specific sites, and the polymer chain also has to be conformationally flexible enough to fit into the
active site of the enzyme. PLA and food waste are polymers that have atoms such as carbon, oxygen
and nitrogen, in their backbones. Those atoms make the polymers susceptible to hydrolysis and
therefore susceptible to biodegradation. Hydrolysis is controlled in part by the rate of diffusion of the
water in the amorphous regions of the polymer. Some plastics like PLA, will not biodegrade without
prior hydrolysis (Gopferich, 1997). Food waste has a high moisture content and little physical structure,
and is very susceptible to odor production and tends to generate large quantities of leachate.
(Hampton, 2017).
7.3.3 Anaerobic Digestion
Anaerobic digestion is used to treat organic waste with the ability to recover energy in the form
of biogas (mainly methane). Anaerobic digestion is also a naturally occurring process of
decomposition and decay, by which organic matter breaks down into simple chemical compounds,
producing biogas and digestate (a relatively stable oil residue similar to compost). Biogas is a mixture
of gases, mainly methane, which can be used to produce heat and electricity, and carbon dioxide.
The digestate can be used as a soil amendment, much like humus, for application like farming or
landscaping.
At the moment, more than 200 AD plants worldwide, are processing different types of organic
waste, especially in Germany where many of them are situated. (IEA, 2017) Those plants can be
characterized according to the following options: 1) dry/wet digestion and 2) thermophilic/ mesophilic
digestion. If the process is dry or wet depends on the moisture content in the reactor (dry: less than
75%, wet: more than 90%). The systems have different moisture content which differ in a wide range,
between 0% to 94%, which means that coffee cups, yogurt cups and coffee capsules will operate as
dry process and the cucumber and tea bag as wet process. The temperature is externally controlled,
K
and digesters are run either at mesophilic temperatures (35-40°C), or at thermophilic temperatures
(50-55°C). In these two temperature zones, different types of anaerobic bacteria show maximum
activity (mesophilic and thermophilic bacteria respectively). The rate of activity is higher at
thermophilic temperature.
7.3.4 Landfill
A landfill is a site dedicated for the disposal of waste materials by burial. A sanitary landfill is
isolated from the environment by measures to control the leachate and gas emissions. For this
purpose, the landfill is equipped with a bottom liner and a surface seal. The bottom line consists of
several layers. As leachate forms and passes through the waste, organic and inorganic compounds
become dissolved and suspended in the leachate potentially contaminating groundwater and surface
water. For this purpose, landfills are equipped with drainage systems and usually also with waste
water treatment installations.
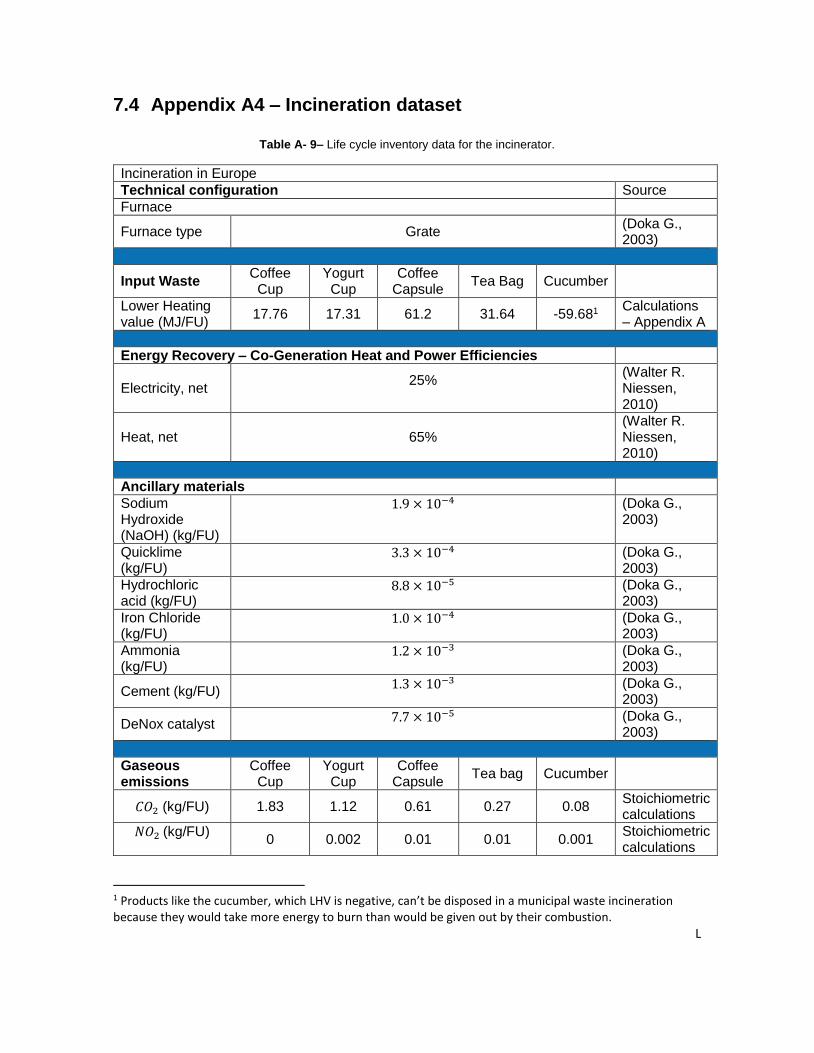
L
7.4 Appendix A4 – Incineration dataset
Table A- 9– Life cycle inventory data for the incinerator.
Incineration in Europe
Technical configuration Source
Furnace
Furnace type Grate (Doka G., 2003)
Input Waste Coffee
Cup Yogurt
Cup Coffee
Capsule Tea Bag Cucumber
Lower Heating value (MJ/FU)
17.76 17.31 61.2 31.64 -59.681 Calculations – Appendix A
Energy Recovery – Co-Generation Heat and Power Efficiencies
Electricity, net 25%
(Walter R. Niessen, 2010)
Heat, net 65% (Walter R. Niessen, 2010)
Ancillary materials
Sodium Hydroxide (NaOH) (kg/FU)
1.9 × 10⁻⁴ (Doka G., 2003)
Quicklime (kg/FU)
3.3 × 10⁻⁴ (Doka G., 2003)
Hydrochloric acid (kg/FU)
8.8 × 10⁻⁵ (Doka G., 2003)
Iron Chloride (kg/FU)
1.0 × 10⁻⁴ (Doka G., 2003)
Ammonia (kg/FU)
1.2 × 10⁻³ (Doka G., 2003)
Cement (kg/FU) 1.3 × 10⁻³ (Doka G.,
2003)
DeNox catalyst 7.7 × 10⁻⁵ (Doka G.,
2003)
Gaseous emissions
Coffee Cup
Yogurt Cup
Coffee Capsule
Tea bag Cucumber
𝐶𝑂2 (kg/FU) 1.83 1.12 0.61 0.27 0.08 Stoichiometric calculations
𝑁𝑂2 (kg/FU)
0 0.002 0.01 0.01 0.001 Stoichiometric calculations
1 Products like the cucumber, which LHV is negative, can’t be disposed in a municipal waste incineration because they would take more energy to burn than would be given out by their combustion.
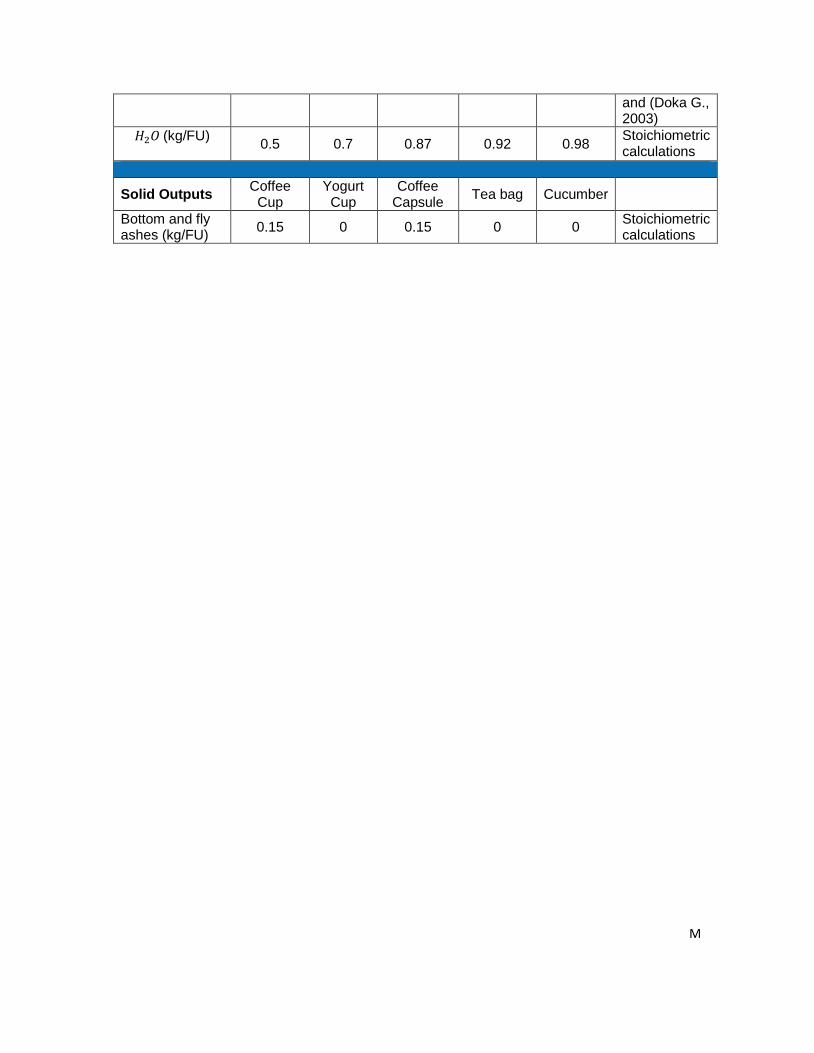
M
and (Doka G., 2003)
𝐻2𝑂 (kg/FU)
0.5 0.7 0.87 0.92 0.98 Stoichiometric calculations
Solid Outputs Coffee
Cup Yogurt
Cup Coffee
Capsule Tea bag Cucumber
Bottom and fly ashes (kg/FU)
0.15 0 0.15 0 0 Stoichiometric calculations
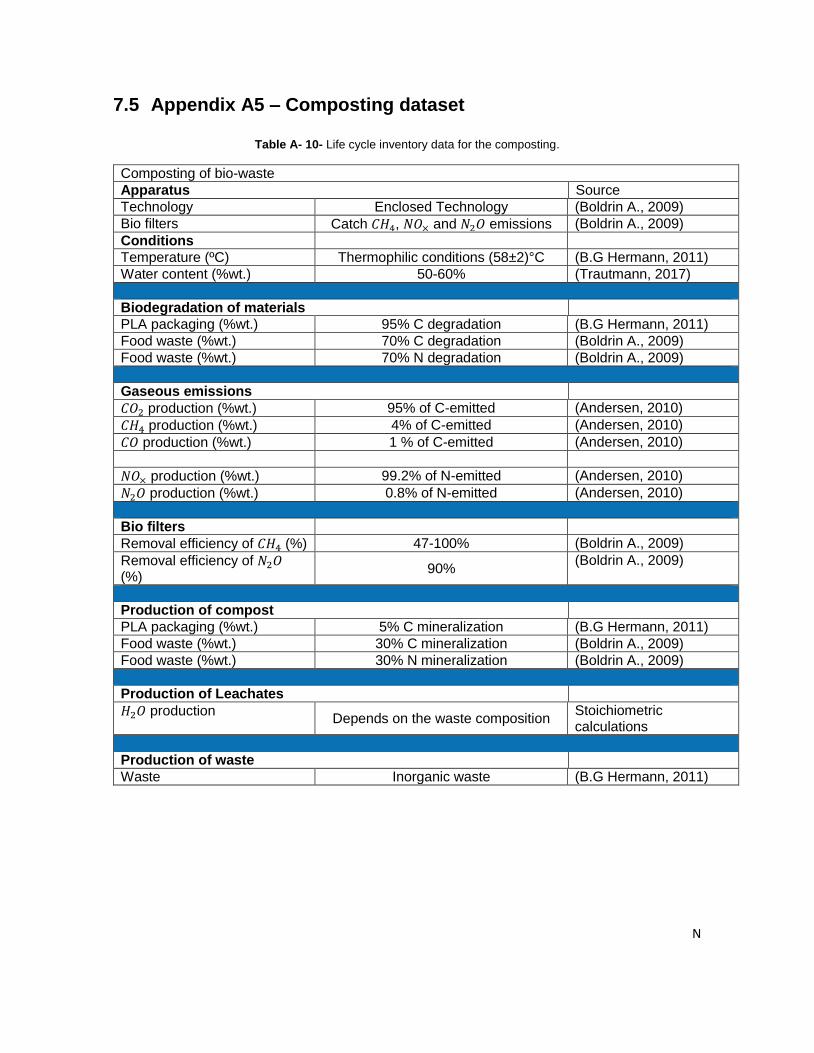
N
7.5 Appendix A5 – Composting dataset
Table A- 10- Life cycle inventory data for the composting.
Composting of bio-waste
Apparatus Source
Technology Enclosed Technology (Boldrin A., 2009)
Bio filters Catch 𝐶𝐻4, 𝑁𝑂× and 𝑁2𝑂 emissions (Boldrin A., 2009)
Conditions
Temperature (ºC) Thermophilic conditions (58±2)°C (B.G Hermann, 2011)
Water content (%wt.) 50-60% (Trautmann, 2017)
Biodegradation of materials
PLA packaging (%wt.) 95% C degradation (B.G Hermann, 2011)
Food waste (%wt.) 70% C degradation (Boldrin A., 2009)
Food waste (%wt.) 70% N degradation (Boldrin A., 2009)
Gaseous emissions
𝐶𝑂2 production (%wt.) 95% of C-emitted (Andersen, 2010)
𝐶𝐻4 production (%wt.) 4% of C-emitted (Andersen, 2010)
𝐶𝑂 production (%wt.) 1 % of C-emitted (Andersen, 2010)
𝑁𝑂× production (%wt.) 99.2% of N-emitted (Andersen, 2010)
𝑁2𝑂 production (%wt.) 0.8% of N-emitted (Andersen, 2010)
Bio filters
Removal efficiency of 𝐶𝐻4 (%) 47-100% (Boldrin A., 2009)
Removal efficiency of 𝑁2𝑂 (%)
90% (Boldrin A., 2009)
Production of compost
PLA packaging (%wt.) 5% C mineralization (B.G Hermann, 2011)
Food waste (%wt.) 30% C mineralization (Boldrin A., 2009)
Food waste (%wt.) 30% N mineralization (Boldrin A., 2009)
Production of Leachates
𝐻2𝑂 production Depends on the waste composition
Stoichiometric calculations
Production of waste
Waste Inorganic waste (B.G Hermann, 2011)
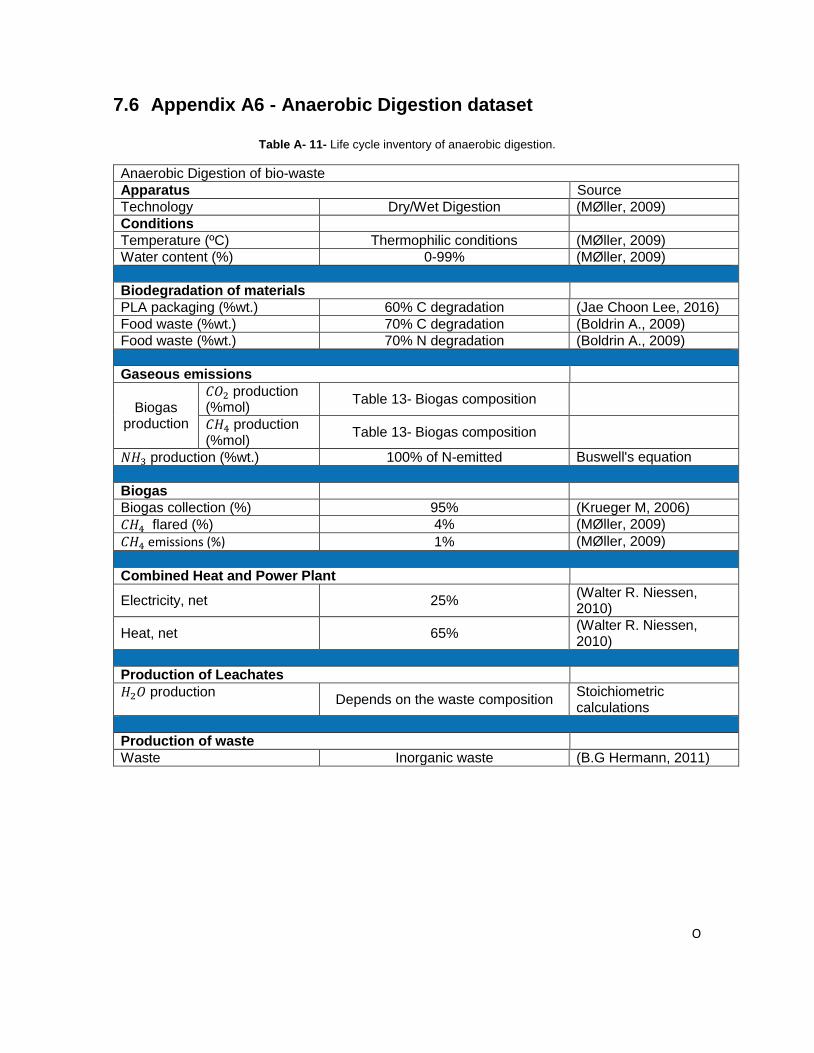
O
7.6 Appendix A6 - Anaerobic Digestion dataset
Table A- 11- Life cycle inventory of anaerobic digestion.
Anaerobic Digestion of bio-waste
Apparatus Source
Technology Dry/Wet Digestion (MØller, 2009)
Conditions
Temperature (ºC) Thermophilic conditions (MØller, 2009)
Water content (%) 0-99% (MØller, 2009)
Biodegradation of materials
PLA packaging (%wt.) 60% C degradation (Jae Choon Lee, 2016)
Food waste (%wt.) 70% C degradation (Boldrin A., 2009)
Food waste (%wt.) 70% N degradation (Boldrin A., 2009)
Gaseous emissions
Biogas production
𝐶𝑂2 production (%mol)
Table 13- Biogas composition
𝐶𝐻4 production (%mol)
Table 13- Biogas composition
𝑁𝐻3 production (%wt.) 100% of N-emitted Buswell's equation
Biogas
Biogas collection (%) 95% (Krueger M, 2006)
𝐶𝐻4 flared (%) 4% (MØller, 2009)
𝐶𝐻4 emissions (%) 1% (MØller, 2009)
Combined Heat and Power Plant
Electricity, net 25% (Walter R. Niessen, 2010)
Heat, net 65% (Walter R. Niessen, 2010)
Production of Leachates
𝐻2𝑂 production Depends on the waste composition
Stoichiometric calculations
Production of waste
Waste Inorganic waste (B.G Hermann, 2011)
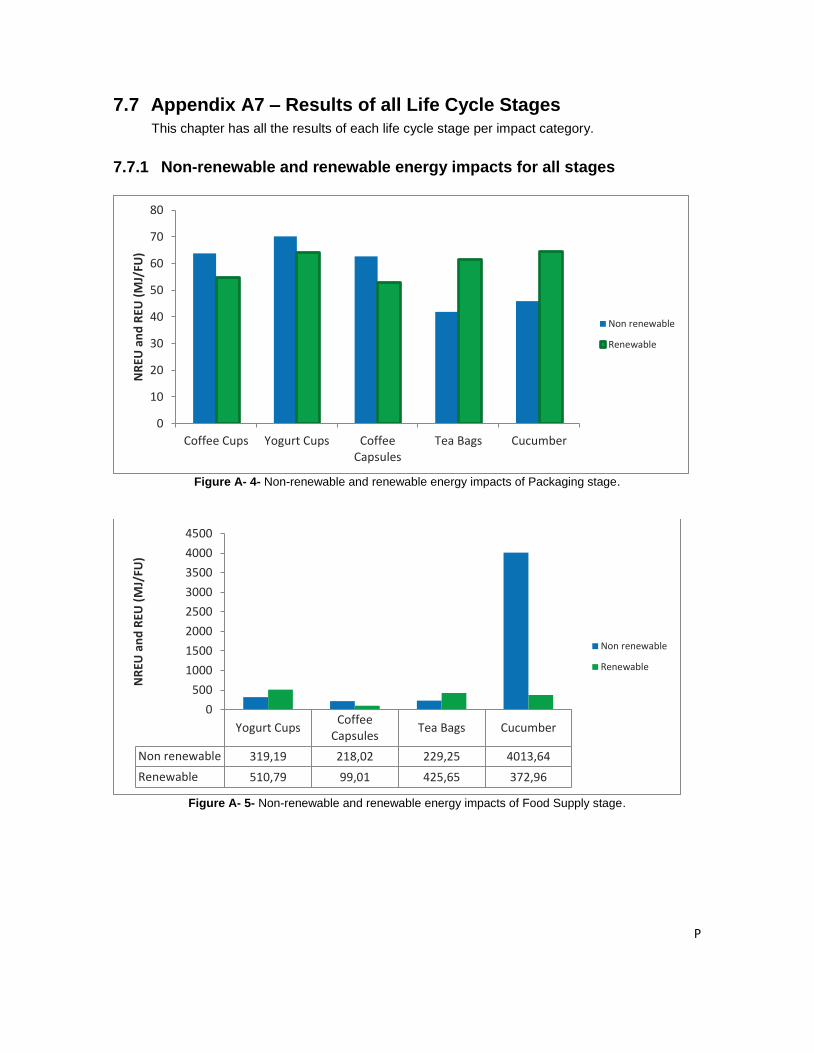
P
7.7 Appendix A7 – Results of all Life Cycle Stages This chapter has all the results of each life cycle stage per impact category.
7.7.1 Non-renewable and renewable energy impacts for all stages
Figure A- 4- Non-renewable and renewable energy impacts of Packaging stage.
Figure A- 5- Non-renewable and renewable energy impacts of Food Supply stage.
0
10
20
30
40
50
60
70
80
Coffee Cups Yogurt Cups CoffeeCapsules
Tea Bags Cucumber
NR
EU a
nd
REU
(M
J/FU
)
Non renewable
Renewable
Yogurt CupsCoffee
CapsulesTea Bags Cucumber
Non renewable 319,19 218,02 229,25 4013,64
Renewable 510,79 99,01 425,65 372,96
0
500
1000
1500
2000
2500
3000
3500
4000
4500
NR
EU a
nd
REU
(M
J/FU
)
Non renewable
Renewable
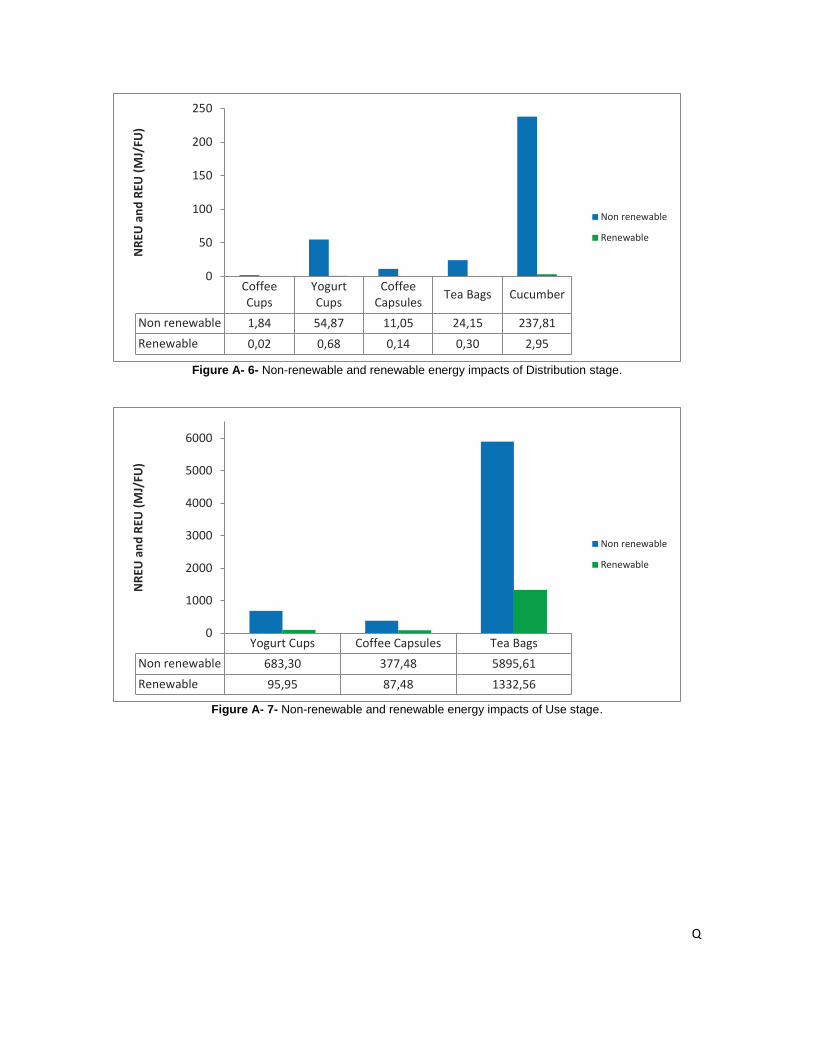
Q
Figure A- 6- Non-renewable and renewable energy impacts of Distribution stage.
Figure A- 7- Non-renewable and renewable energy impacts of Use stage.
CoffeeCups
YogurtCups
CoffeeCapsules
Tea Bags Cucumber
Non renewable 1,84 54,87 11,05 24,15 237,81
Renewable 0,02 0,68 0,14 0,30 2,95
0
50
100
150
200
250
NR
EU a
nd
REU
(M
J/FU
)
Non renewable
Renewable
Yogurt Cups Coffee Capsules Tea Bags
Non renewable 683,30 377,48 5895,61
Renewable 95,95 87,48 1332,56
0
1000
2000
3000
4000
5000
6000
NR
EU a
nd
REU
(M
J/FU
)
Non renewable
Renewable
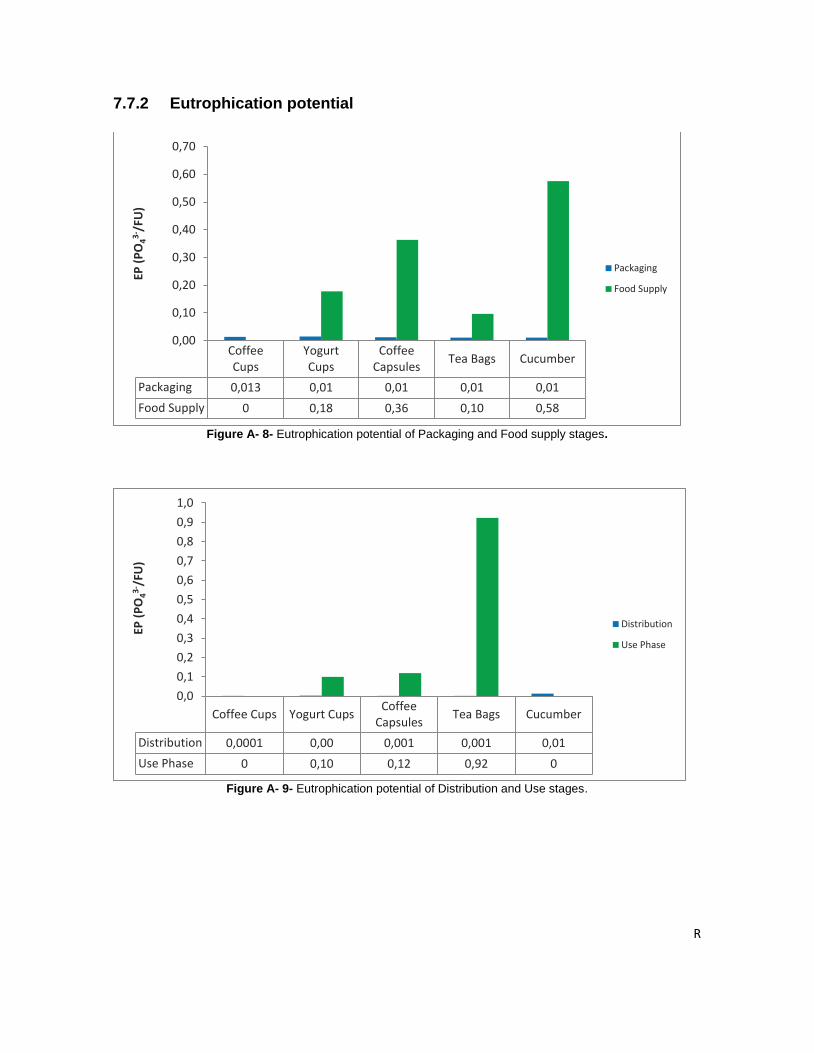
R
7.7.2 Eutrophication potential
Figure A- 8- Eutrophication potential of Packaging and Food supply stages.
Figure A- 9- Eutrophication potential of Distribution and Use stages.
CoffeeCups
YogurtCups
CoffeeCapsules
Tea Bags Cucumber
Packaging 0,013 0,01 0,01 0,01 0,01
Food Supply 0 0,18 0,36 0,10 0,58
0,00
0,10
0,20
0,30
0,40
0,50
0,60
0,70EP
(P
O43-
/FU
)
Packaging
Food Supply
Coffee Cups Yogurt CupsCoffee
CapsulesTea Bags Cucumber
Distribution 0,0001 0,00 0,001 0,001 0,01
Use Phase 0 0,10 0,12 0,92 0
0,0
0,1
0,2
0,3
0,4
0,5
0,6
0,7
0,8
0,9
1,0
EP (
PO
43-/F
U)
Distribution
Use Phase
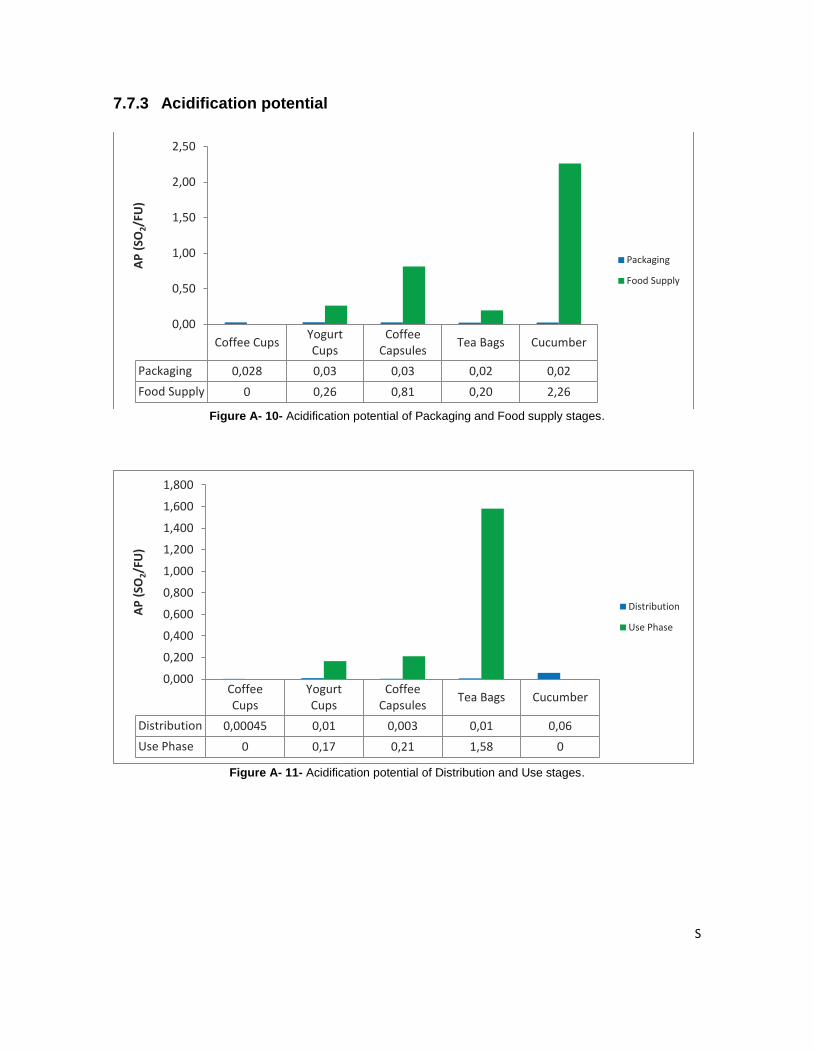
S
7.7.3 Acidification potential
Figure A- 10- Acidification potential of Packaging and Food supply stages.
Figure A- 11- Acidification potential of Distribution and Use stages.
Coffee CupsYogurtCups
CoffeeCapsules
Tea Bags Cucumber
Packaging 0,028 0,03 0,03 0,02 0,02
Food Supply 0 0,26 0,81 0,20 2,26
0,00
0,50
1,00
1,50
2,00
2,50A
P (
SO2/
FU)
Packaging
Food Supply
CoffeeCups
YogurtCups
CoffeeCapsules
Tea Bags Cucumber
Distribution 0,00045 0,01 0,003 0,01 0,06
Use Phase 0 0,17 0,21 1,58 0
0,000
0,200
0,400
0,600
0,800
1,000
1,200
1,400
1,600
1,800
AP
(SO
2/FU
)
Distribution
Use Phase
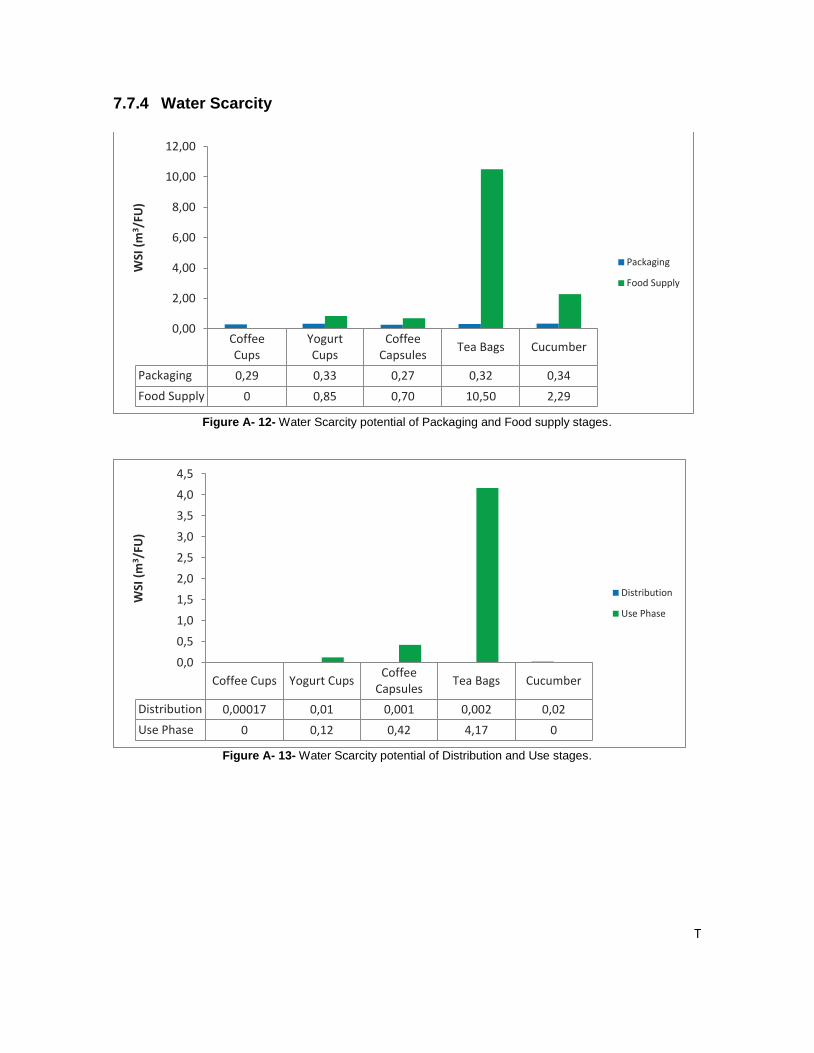
T
7.7.4 Water Scarcity
Figure A- 12- Water Scarcity potential of Packaging and Food supply stages.
Figure A- 13- Water Scarcity potential of Distribution and Use stages.
CoffeeCups
YogurtCups
CoffeeCapsules
Tea Bags Cucumber
Packaging 0,29 0,33 0,27 0,32 0,34
Food Supply 0 0,85 0,70 10,50 2,29
0,00
2,00
4,00
6,00
8,00
10,00
12,00W
SI (
m3/F
U)
Packaging
Food Supply
Coffee Cups Yogurt CupsCoffee
CapsulesTea Bags Cucumber
Distribution 0,00017 0,01 0,001 0,002 0,02
Use Phase 0 0,12 0,42 4,17 0
0,0
0,5
1,0
1,5
2,0
2,5
3,0
3,5
4,0
4,5
WSI
(m
3 /FU
)
Distribution
Use Phase
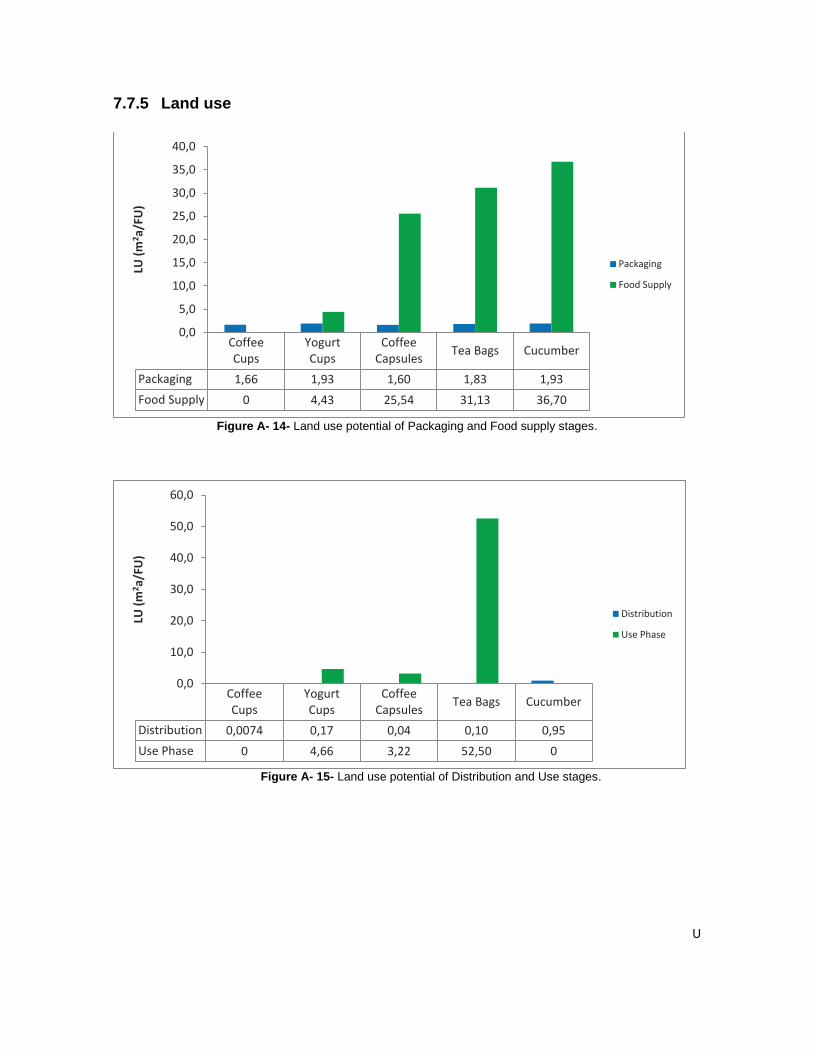
U
7.7.5 Land use
Figure A- 14- Land use potential of Packaging and Food supply stages.
Figure A- 15- Land use potential of Distribution and Use stages.
CoffeeCups
YogurtCups
CoffeeCapsules
Tea Bags Cucumber
Packaging 1,66 1,93 1,60 1,83 1,93
Food Supply 0 4,43 25,54 31,13 36,70
0,0
5,0
10,0
15,0
20,0
25,0
30,0
35,0
40,0LU
(m
2a/
FU)
Packaging
Food Supply
CoffeeCups
YogurtCups
CoffeeCapsules
Tea Bags Cucumber
Distribution 0,0074 0,17 0,04 0,10 0,95
Use Phase 0 4,66 3,22 52,50 0
0,0
10,0
20,0
30,0
40,0
50,0
60,0
LU (
m2 a
/FU
)
Distribution
Use Phase