Embed Size (px)
Citation preview
Journal of Sustainable Development of Energy, Water and Environment Systems
Year 2016 Volume 4, Issue 3, pp 216-233
216
Life Cycle Assessment of Wastewater Treatment Plants in Ireland
Greg McNamara
*1, Lorna Fitzsimons
2, Matthew Horrigan
3, Thomas Phelan
4,
Yan Delaure5, Brian Corcoran
6, Edelle Doherty
7, Eoghan Clifford
8
1School of Mechanical Engineering,
Dublin City University, Glasnevin, Dublin 9, Ireland
e-mail: [email protected] 2School of Mechanical Engineering,
Dublin City University, Glasnevin, Dublin 9, Ireland
e-mail: [email protected] 3School of Mechanical Engineering,
Dublin City University, Glasnevin, Dublin 9, Ireland
e-mail: [email protected]
4School of Mechanical Engineering,
Dublin City University, Glasnevin, Dublin 9, Ireland
e-mail: [email protected]
5School of Mechanical Engineering,
Dublin City University, Glasnevin, Dublin 9, Ireland
e-mail: [email protected]
6School of Mechanical Engineering,
Dublin City University, Glasnevin, Dublin 9, Ireland
e-mail: [email protected]
7Civil Engineering, College of Engineering and Informatics, National University of Ireland Galway
University Road, Galway, Ireland
e-mail: [email protected]
8Civil Engineering, College of Engineering and Informatics, National University of Ireland Galway
University Road, Galway, Ireland
e-mail: [email protected]
Cite as: McNamara, G., Fitzsimons, L., Horrigan, M., Phelan, T., Delaure, Y., Corcoran, B., Doherty E., Clifford, E., Life Cycle Assessment of Wastewater Treatment Plants in Ireland, J. sustain. dev. energy water environ. syst., 4(3),
pp 216-233, 2016, DOI: http://dx.doi.org/10.13044/j.sdewes.2016.04.0018
ABSTRACT
The Urban Wastewater Treatment Directive 91/271/EEC introduced a series of measures
for the purpose of protecting the environment from the adverse effects of effluent
discharge from wastewater treatment plants. There are environmental costs associated
with attaining the required level of water quality set out in the directive such as
greenhouse gas emissions due to energy production, and ecotoxicity from sludge
application to land. The goal of this study is to assess the environmental costs in an Irish
context, focusing specifically on the effects of variation in scale and discharge limitation.
Life cycle assessment is the analytical tool used to evaluate the environmental impact.
The life cycle impact assessment methodology developed by the Centre of
Environmental Science, Leiden University (2010) has been adopted and implemented
using GaBi 6.0 life cycle assessment software. Two plants of varying size and location
were chosen for the study. The study found that energy consumption and sludge
application to land are the largest contributors to the overall environmental impact
associated with the treatment process at both plants. Economies of scale were observed in
energy usage during secondary aeration.
KEYWORDS
Wastewater treatment, Life cycle assessment, Energy, Sludge disposal, Anaerobic
digestion, Discharge limitations.
* Corresponding author
Journal of Sustainable Development of Energy, Water and Environment Systems
Year 2016 Volume 4, Issue 3, pp 216-233
217
INTRODUCTION
On the 21st of May 1991 the then European Economic Community (EEC) issued the
91/271/EEC Urban Wastewater Treatment Directive (UWWTD) that would set in motion
a series of reforms to protect the environment from the adverse effects of effluent being
discharged from Wastewater Treatment Plants (WWTPs) [1]. The directive made
recommendations on the collection, treatment, and discharge of urban waste water. One
of the key recommendations made in the directive is that WWTPs serving
agglomerations greater than 2,000 PE† discharging final effluent into freshwater and
estuaries, and all other agglomerations greater than 10,000 PE are to employ secondary
treatment‡. This requirement presented local and national authorities with the challenge
of firstly assessing the state of their respective sewage systems, before bringing standards
to required levels.
In Ireland it is the responsibility of the Environmental Protection Agency (EPA) to
enforce the measures outlined in 91/271/EEC. In 2013 the EPA initiated a research
project to benchmark the energy and resource efficiency of WWTPs in Ireland. The
project involved four different approaches: development of a benchmarking tool, process
auditing and optimization, exergy analysis and environmental performance assessment.
It is the findings from the latter of these four approaches that is the subject of this study.
The advancement of environmental awareness at both societal and policy-making
level over the last two decades has brought with it the need for appropriate tools to
analyse products and systems for sustainability and environmental impact. A range of
tools have been developed for this purpose such as:
Environmental Risk Assessment (ERA) [3];
Environmental Impact Assessment (EIA);
Ecological footprint [4];
Exergy Analysis (EA) [5].
It should be noted that the application of exergy analysis to assess environmental
impact of a product or system is a relatively new concept and is currently the subject of
much debate between those that advocate its use in this context [6], and those who do not
[7]. Life Cycle Assessment (LCA) is an analytical tool that allows for a holistic approach
to assessing the environmental performance of a product or system from cradle to grave
[8]. It has been widely accepted as a decision support tool for government bodies,
environmental authorities, and areas of the private sector [9]. The use of LCA is
particularly suited to WWTP analyses due to the nature of the relationship between a
plant’s technosphere and the surrounding ecosphere. Indeed, there has already been a
variety of LCA studies carried out on WWTPs, each with their own unique set of
objectives, but with the common underlying theme of seeking to quantitatively and
qualitatively assess environmental impact.
The application of LCA to a wastewater treatment plant or system was first reported
in The Netherlands in 1997. The study carried out by Roeleveld et al. [10] examined the
environmental sustainability of wastewater treatment. The study concluded that
improvements in the environmental performance of wastewater treatment should focus
on minimizing effluent discharge pollutants, and sludge production. Since then, there
have been over forty studies published in peer reviewed journals [11]. Much of the earlier
† 1 PE (person equivalent) is estimated to be 0.2 m
3 of waste water influent and 60 g of BOD (bio-
logical oxygen demand) [2] ‡ “Secondary treatment means treatment of urban waste water by a process generally involving
biological treatment with a secondary settlement.”
Journal of Sustainable Development of Energy, Water and Environment Systems
Year 2016 Volume 4, Issue 3, pp 216-233
218
work that was carried out involved assessing the environmental impact of variations in
system parameters such as:
System configuration [12];
System boundaries and scale [13];
Structural changes [14];
Competing technologies for large [15] and small scale plants [16].
Other LCA studies examined wastewater reclamation and reuse alternatives [17].
As the body of work in this area increased some common findings began to emerge.
Firstly, the environmental loading associated with energy production for use in the
treatment process was found to be one of the main contributors to the overall
environmental profile of treatment plants and systems [16], with particular emphasis on
global impact categories such as global warming and acidification. This is contrary to the
findings in the earlier work by Roeleveld et al. [18] who concluded that electricity use
had a negligible impact. However, the results of the study were normalised with Dutch
normalization factors that output the electricity use as a percentage of the overall
electricity use of The Netherlands. It is not a surprise that the environmental impact from
energy use can vary between studies. The magnitude of impact is not only dependant on
the amount of energy used, but also on the way the energy is generated. For example, the
impact from electricity generation in Norway where over 90% is hydro-electric power
will be much less than that of Italy where over 60% of electricity is generated from fossil
fuels [19].
The second significant finding was the impact resulting from sludge disposal. Much
like the impact from energy generation, it is the mode of sludge disposal that dictates both
the magnitude and the type of impact incurred. Traditionally, methods of sludge disposal
in Europe have been either by application to agricultural farmland, incineration, or by
landfill. In relation to the latter, the EU Directive on the landfill of waste (1991/31/EEC)
recommends a reduction in the quantities of sewage sludge going to landfills [20], and in
some countries such as Sweden the practice has been banned completely since 2005 [21].
The LCA study carried out by Pasqualino et al. [22] that examined several sludge
disposal options concluded that land fill was the worst scenario. This finding was echoed
by Houillon and Jolliet [23] who also include agricultural application as one of the least
desirable methods of sludge disposal from a global warming perspective, and claim that
incineration in cement kilns is preferable. Conversely, Lundin et al. [24] expanded the
impact assessment of sludge disposal options to include more impact categories than just
global warming and found that incineration had environmental restrictions. The debate
on sludge disposal is ongoing.
Quite often the metric used to assess the performance of a WWTP is the percentage
reduction of influent pollutants such as:
Biochemical Oxygen Demand (BOD);
Chemical Oxygen Demand (COD);
Total Suspended Solids (TSS);
Total Nitrogen (TN);
Total Phosphorus (TP).
While control of these parameters is necessary for compliance with the regulations, it
affects only eutrophication and aquatic toxicity, and there are many other environmental
factors involved that must be taken into account such as global warming resulting from
energy production and toxicity resulting from sludge disposal. In more recent times there
has been a paradigm shift from considering not only water quality and human health, but
also energy and resource recovery during wastewater treatment [11]. A common finding
throughout many of the published LCA studies of wastewater treatment plants and
Journal of Sustainable Development of Energy, Water and Environment Systems
Year 2016 Volume 4, Issue 3, pp 216-233
219
systems is that there are trade-offs, where reducing the load in one impact category
increases the loading in another.
This paper seeks to further expand the knowledge of WWTP analysis by examining
the environmental loadings of two WWTPs in Ireland and add to the body of work that
has been carried out around the rest of the Europe. To the best of the author’s knowledge,
this is the first study of this type on the island of Ireland.
GOAL AND SCOPE DEFINITION
This study is part of a larger project that aims to assess the energy and resource
efficiency of WWTPs in Ireland. The main goal of the LCA component of the project is
to quantify the environmental loading that results from reaching the effluent quality
standards set out in 91/271/EEC. The specific goal of this paper is to assess the
environmental costs or gains associated with variations in plant size and location. It has
been reported in previous studies by Tillman et al. [12] and Lundin et al. [13] that there
are economies of scale to be achieved in terms of environmental impact, however, this
claim has never been investigated from an Irish perspective. The variation in plant
location focuses mainly on the effects of differences in discharge limitations.
Functional unit
The choice of functional unit is one of the most critical aspects of an LCA. Baumann
and Tillman [8] define the functional unit as corresponding to a reference flow to which
all other flows of a system are related. There is some variance of opinion in the literature
as to what the most suitable functional unit for this type of study should be: m3 of
influent, PE or volume of sludge produced. Volume of treated wastewater per unit time
has been suggested by Suh and Rousseaux [25] to be the most appropriate choice as it is
based on realistic data. However, Corominas et al. [11] argue that this is not always
representative, because it may not give a true indication of the pollutant removal
efficiency of a WWTP. Volume of sludge produced has also been suggested [26],
although it could be argued that this metric is secondary to the primary function of a
WWTP. Population equivalence has been chosen as the function unit by several LCA
practitioners [12, 13, 16], the rationale being that it allows comparisons between plants.
However, care must be taken when defining PE as there are two quantities being referred
to: volume of influent and mass of organic loading. In this study PE refers to the
hydraulic definition of 0.2 m3 of wastewater.
Boundaries
It has been documented by other LCA practitioners that the construction phase of a
WWTP’s life cycle is negligible compared to the operation and maintenance phase [12,
13], and as such has been omitted from the analysis. The delivery of influent has not been
included in the analysis as delivery systems can vary, thus leading to unfair comparisons
of plant efficiency, and therefore the “gate-to-grave” practice has been adopted for the
delivery of the influent, whereby the “gate” is deemed to begin where the influent
physically enters the WWTP domain. Many LCA studies extend the boundaries of their
systems to include the production of mineral fertilizers so as to include nitrogen and
phosphorus in the sludge applied to land as avoided products [27, 28]. However, in a
study carried out by Renou et al. [29], it is stated that mineral fertilizers are spread on
growing crops, and that due to safety concerns sludge is applied to the land before crop
growth. Therefore, the sludge cannot be deemed to have the same fertilizing effect.
Consequently, nitrogen and phosphorous in sludge outputs have not been included as
avoided products.
Journal of Sustainable Development of Energy, Water and Environment Systems
Year 2016 Volume 4, Issue 3, pp 216-233
220
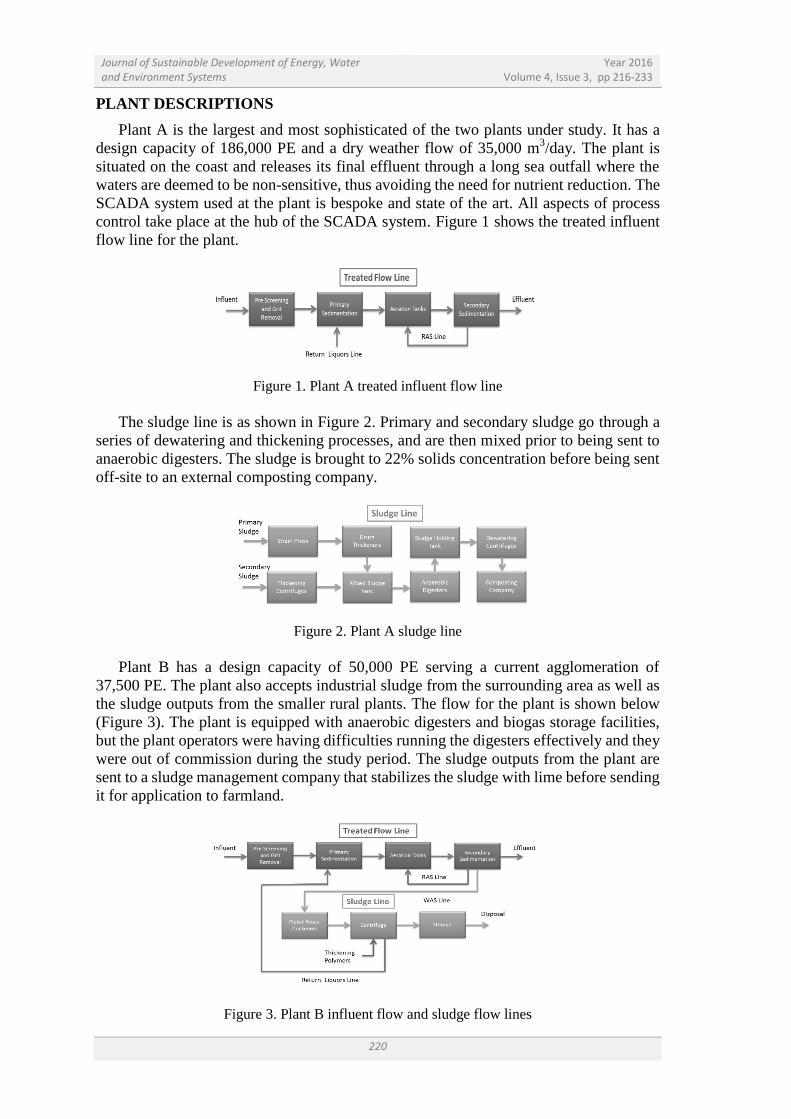
PLANT DESCRIPTIONS
Plant A is the largest and most sophisticated of the two plants under study. It has a
design capacity of 186,000 PE and a dry weather flow of 35,000 m3/day. The plant is
situated on the coast and releases its final effluent through a long sea outfall where the
waters are deemed to be non-sensitive, thus avoiding the need for nutrient reduction. The
SCADA system used at the plant is bespoke and state of the art. All aspects of process
control take place at the hub of the SCADA system. Figure 1 shows the treated influent
flow line for the plant.
Figure 1. Plant A treated influent flow line
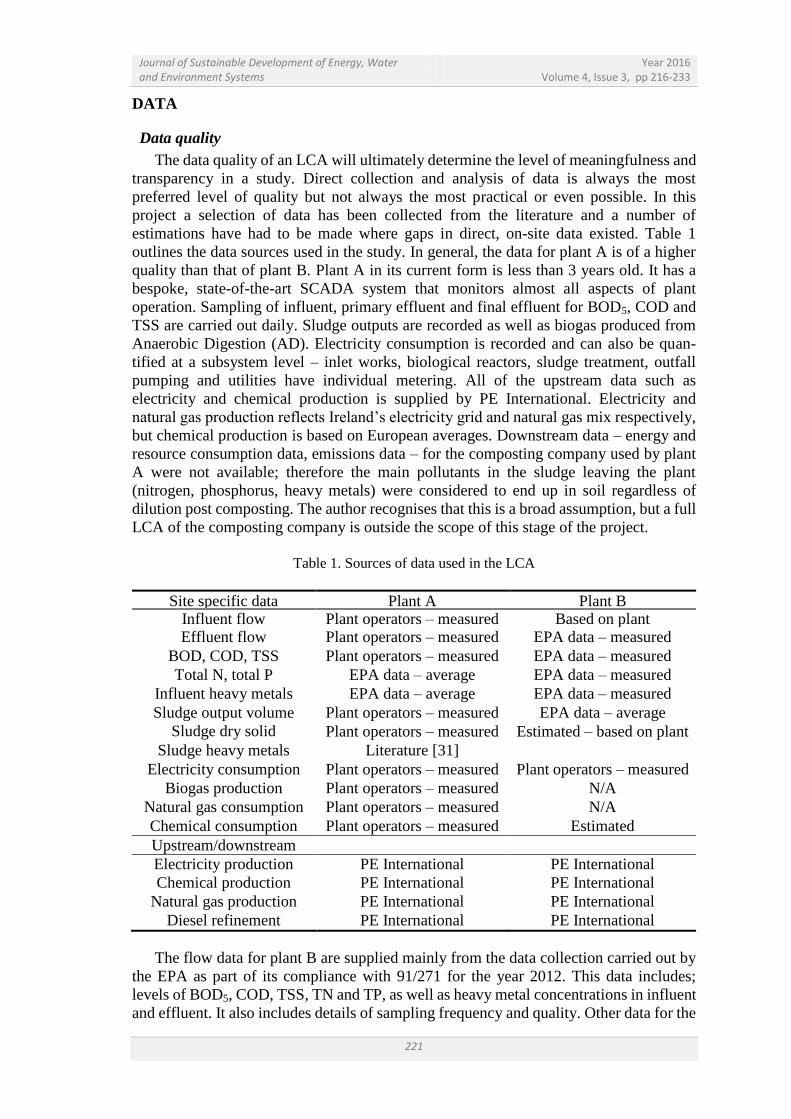
The sludge line is as shown in Figure 2. Primary and secondary sludge go through a
series of dewatering and thickening processes, and are then mixed prior to being sent to
anaerobic digesters. The sludge is brought to 22% solids concentration before being sent
off-site to an external composting company.
Figure 2. Plant A sludge line
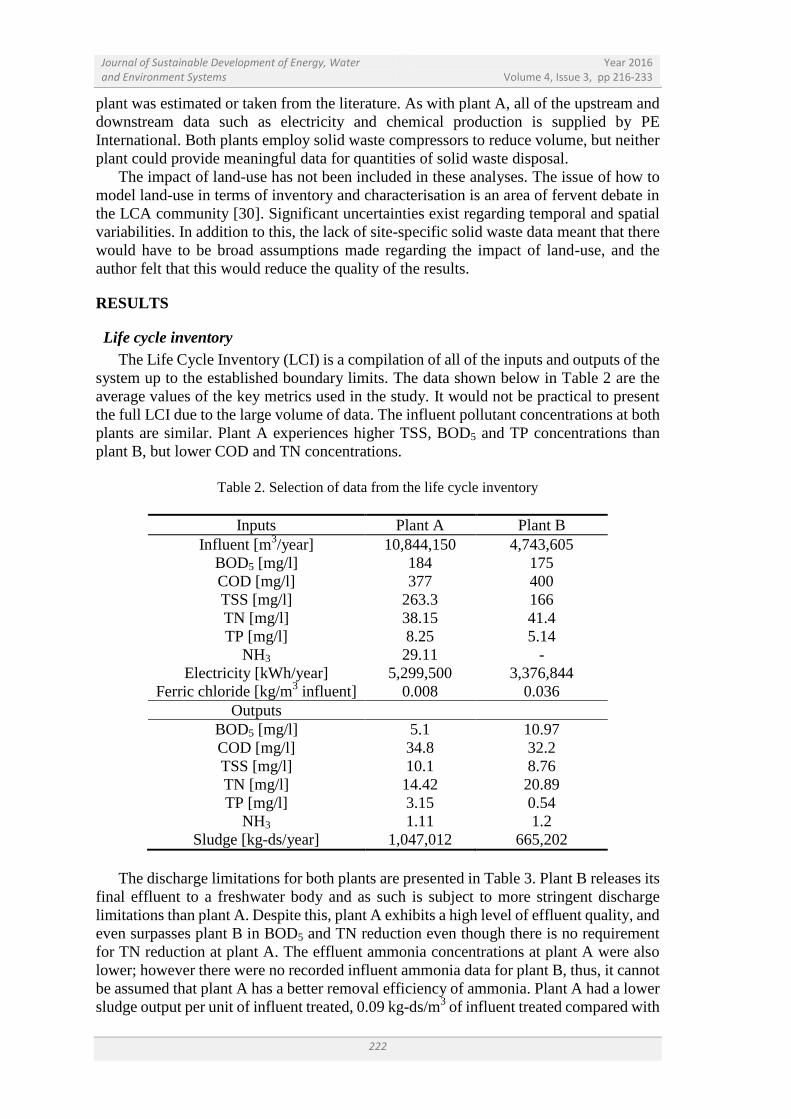
Plant B has a design capacity of 50,000 PE serving a current agglomeration of
37,500 PE. The plant also accepts industrial sludge from the surrounding area as well as
the sludge outputs from the smaller rural plants. The flow for the plant is shown below
(Figure 3). The plant is equipped with anaerobic digesters and biogas storage facilities,
but the plant operators were having difficulties running the digesters effectively and they
were out of commission during the study period. The sludge outputs from the plant are
sent to a sludge management company that stabilizes the sludge with lime before sending
it for application to farmland.
Figure 3. Plant B influent flow and sludge flow lines
Journal of Sustainable Development of Energy, Water and Environment Systems
Year 2016 Volume 4, Issue 3, pp 216-233
221
DATA
Data quality
The data quality of an LCA will ultimately determine the level of meaningfulness and
transparency in a study. Direct collection and analysis of data is always the most
preferred level of quality but not always the most practical or even possible. In this
project a selection of data has been collected from the literature and a number of
estimations have had to be made where gaps in direct, on-site data existed. Table 1
outlines the data sources used in the study. In general, the data for plant A is of a higher
quality than that of plant B. Plant A in its current form is less than 3 years old. It has a
bespoke, state-of-the-art SCADA system that monitors almost all aspects of plant
operation. Sampling of influent, primary effluent and final effluent for BOD5, COD and
TSS are carried out daily. Sludge outputs are recorded as well as biogas produced from
Anaerobic Digestion (AD). Electricity consumption is recorded and can also be quan-
tified at a subsystem level – inlet works, biological reactors, sludge treatment, outfall
pumping and utilities have individual metering. All of the upstream data such as
electricity and chemical production is supplied by PE International. Electricity and
natural gas production reflects Ireland’s electricity grid and natural gas mix respectively,
but chemical production is based on European averages. Downstream data – energy and
resource consumption data, emissions data – for the composting company used by plant
A were not available; therefore the main pollutants in the sludge leaving the plant
(nitrogen, phosphorus, heavy metals) were considered to end up in soil regardless of
dilution post composting. The author recognises that this is a broad assumption, but a full
LCA of the composting company is outside the scope of this stage of the project.
Table 1. Sources of data used in the LCA
Site specific data Plant A Plant B Influent flow Plant operators – measured Based on plant
agglomeration Effluent flow Plant operators – measured EPA data – measured
BOD, COD, TSS Plant operators – measured EPA data – measured
Total N, total P EPA data – average EPA data – measured
Influent heavy metals EPA data – average EPA data – measured
Sludge output volume Plant operators – measured EPA data – average
Sludge dry solid
concentration Plant operators – measured Estimated – based on plant
Sludge heavy metals Literature [31]
Electricity consumption Plant operators – measured Plant operators – measured
Biogas production Plant operators – measured N/A
Natural gas consumption Plant operators – measured N/A
Chemical consumption Plant operators – measured Estimated
Upstream/downstream
data
Electricity production PE International PE International
Chemical production PE International PE International
Natural gas production PE International PE International
Diesel refinement PE International PE International
The flow data for plant B are supplied mainly from the data collection carried out by
the EPA as part of its compliance with 91/271 for the year 2012. This data includes;
levels of BOD5, COD, TSS, TN and TP, as well as heavy metal concentrations in influent
and effluent. It also includes details of sampling frequency and quality. Other data for the
Journal of Sustainable Development of Energy, Water and Environment Systems
Year 2016 Volume 4, Issue 3, pp 216-233
222
plant was estimated or taken from the literature. As with plant A, all of the upstream and
downstream data such as electricity and chemical production is supplied by PE
International. Both plants employ solid waste compressors to reduce volume, but neither
plant could provide meaningful data for quantities of solid waste disposal.
The impact of land-use has not been included in these analyses. The issue of how to
model land-use in terms of inventory and characterisation is an area of fervent debate in
the LCA community [30]. Significant uncertainties exist regarding temporal and spatial
variabilities. In addition to this, the lack of site-specific solid waste data meant that there
would have to be broad assumptions made regarding the impact of land-use, and the
author felt that this would reduce the quality of the results.
RESULTS
Life cycle inventory
The Life Cycle Inventory (LCI) is a compilation of all of the inputs and outputs of the
system up to the established boundary limits. The data shown below in Table 2 are the
average values of the key metrics used in the study. It would not be practical to present
the full LCI due to the large volume of data. The influent pollutant concentrations at both
plants are similar. Plant A experiences higher TSS, BOD5 and TP concentrations than
plant B, but lower COD and TN concentrations.
Table 2. Selection of data from the life cycle inventory
Inputs Plant A Plant B
Influent [m3/year] 10,844,150 4,743,605
BOD5 [mg/l] 184 175
COD [mg/l] 377 400
TSS [mg/l] 263.3 166
TN [mg/l] 38.15 41.4
TP [mg/l] 8.25 5.14
NH3 29.11 -
Electricity [kWh/year] 5,299,500 3,376,844
Ferric chloride [kg/m3 influent] 0.008 0.036
Outputs
BOD5 [mg/l] 5.1 10.97
COD [mg/l] 34.8 32.2
TSS [mg/l] 10.1 8.76
TN [mg/l] 14.42 20.89
TP [mg/l] 3.15 0.54
NH3 1.11 1.2
Sludge [kg-ds/year] 1,047,012 665,202
The discharge limitations for both plants are presented in Table 3. Plant B releases its
final effluent to a freshwater body and as such is subject to more stringent discharge
limitations than plant A. Despite this, plant A exhibits a high level of effluent quality, and
even surpasses plant B in BOD5 and TN reduction even though there is no requirement
for TN reduction at plant A. The effluent ammonia concentrations at plant A were also
lower; however there were no recorded influent ammonia data for plant B, thus, it cannot
be assumed that plant A has a better removal efficiency of ammonia. Plant A had a lower
sludge output per unit of influent treated, 0.09 kg-ds/m3 of influent treated compared with
Journal of Sustainable Development of Energy, Water and Environment Systems
Year 2016 Volume 4, Issue 3, pp 216-233
223
0.14 kg-ds/m3 at plant B. The breakdown of energy use is discussed separately in the
following section.
Table 3. Final effluent discharge limitations for both plants
Discharge parameter Plant A Plant B
pH - 6-9
Temperature - 25 °C (max)
cBOD 25 mg/l 13 mg/l
COD 125 mg/l 100 mg/l
TSS 35 mg/l 35 mg/l
Total Nitrogen (TN) - 15 mg/l
Total Phosphorous (TP) - 1 mg/l
Ammonia - 3 mg/l
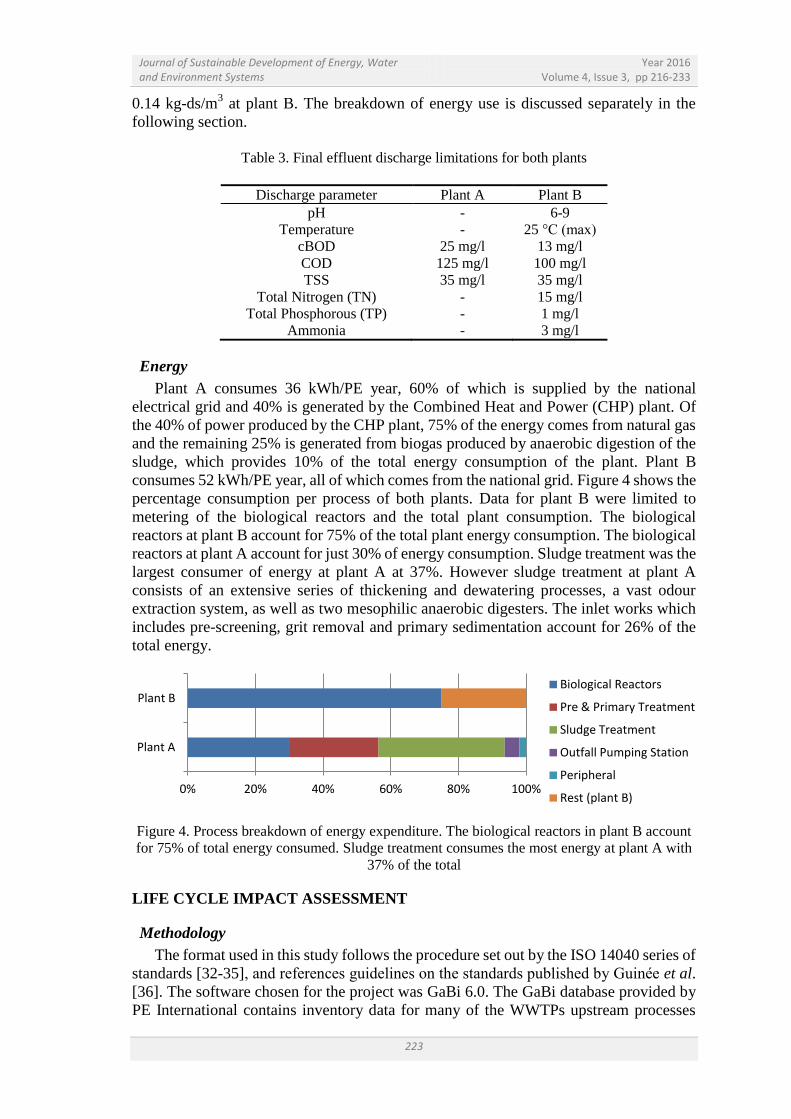
Energy
Plant A consumes 36 kWh/PE year, 60% of which is supplied by the national
electrical grid and 40% is generated by the Combined Heat and Power (CHP) plant. Of
the 40% of power produced by the CHP plant, 75% of the energy comes from natural gas
and the remaining 25% is generated from biogas produced by anaerobic digestion of the
sludge, which provides 10% of the total energy consumption of the plant. Plant B
consumes 52 kWh/PE year, all of which comes from the national grid. Figure 4 shows the
percentage consumption per process of both plants. Data for plant B were limited to
metering of the biological reactors and the total plant consumption. The biological
reactors at plant B account for 75% of the total plant energy consumption. The biological
reactors at plant A account for just 30% of energy consumption. Sludge treatment was the
largest consumer of energy at plant A at 37%. However sludge treatment at plant A
consists of an extensive series of thickening and dewatering processes, a vast odour
extraction system, as well as two mesophilic anaerobic digesters. The inlet works which
includes pre-screening, grit removal and primary sedimentation account for 26% of the
total energy.
Figure 4. Process breakdown of energy expenditure. The biological reactors in plant B account
for 75% of total energy consumed. Sludge treatment consumes the most energy at plant A with
37% of the total
LIFE CYCLE IMPACT ASSESSMENT
Methodology
The format used in this study follows the procedure set out by the ISO 14040 series of
standards [32-35], and references guidelines on the standards published by Guinée et al.
[36]. The software chosen for the project was GaBi 6.0. The GaBi database provided by
PE International contains inventory data for many of the WWTPs upstream processes
0% 20% 40% 60% 80% 100%
Plant A
Plant B Biological Reactors
Pre & Primary Treatment
Sludge Treatment
Outfall Pumping Station
Peripheral
Rest (plant B)
Journal of Sustainable Development of Energy, Water and Environment Systems
Year 2016 Volume 4, Issue 3, pp 216-233
224
such as energy and chemical production. The Life Cycle Impact Assessment (LCIA)
methodology used in the study is the CML (Centre for Environmental Science) 2001
(Nov. 10) which is compliant with the ISO 14040 series, and has been adopted by authors
of similar studies [27]. The impact categories defined in the methodology are presented
in Table 4. Once the impact categories have been defined the next phase of the LCIA is
classification, whereby system inputs and outputs that have been compiled in the LCI are
assigned qualitatively to one or more of the impact categories. Following this, the
characterisation phase calculates the magnitude of a substance in an impact category
based on an equivalency factor relative to a baseline substance for that category. For
example, COD in the final effluent discharge is assigned to eutrophication. The baseline
substance for eutrophication is PO43-
(phosphate) and has a value of 1. The equivalency
factor value of COD is 0.022 [8], therefore, every 1 g of COD is equivalent to 0.022 g of
phosphate in the CML eutrophication impact category.
This method allows for aggregation of all substances in a given category into a single
score or indicator result (eq. 1) [36], where i is the type of substance, is the magnitude
and is the equivalency factor for that substance:
(1)
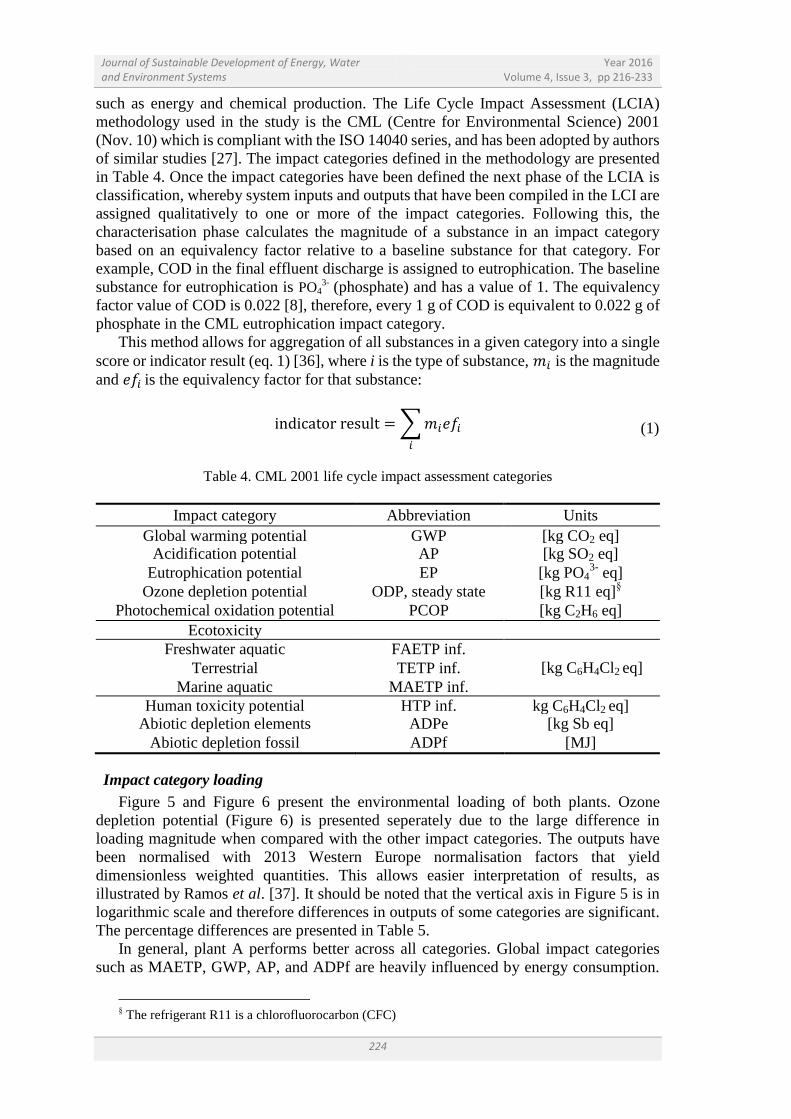
Table 4. CML 2001 life cycle impact assessment categories
Impact category Abbreviation Units
Global warming potential GWP [kg CO2 eq] Acidification potential AP [kg SO2 eq]
Eutrophication potential EP [kg PO43-
eq]
Ozone depletion potential ODP, steady state [kg R11 eq]§
Photochemical oxidation potential PCOP [kg C2H6 eq]
Ecotoxicity
Freshwater aquatic FAETP inf.
[kg C6H4Cl2 eq] Terrestrial TETP inf.
Marine aquatic MAETP inf.
Human toxicity potential HTP inf. kg C6H4Cl2 eq] Abiotic depletion elements ADPe [kg Sb eq]
Abiotic depletion fossil ADPf [MJ]
Impact category loading
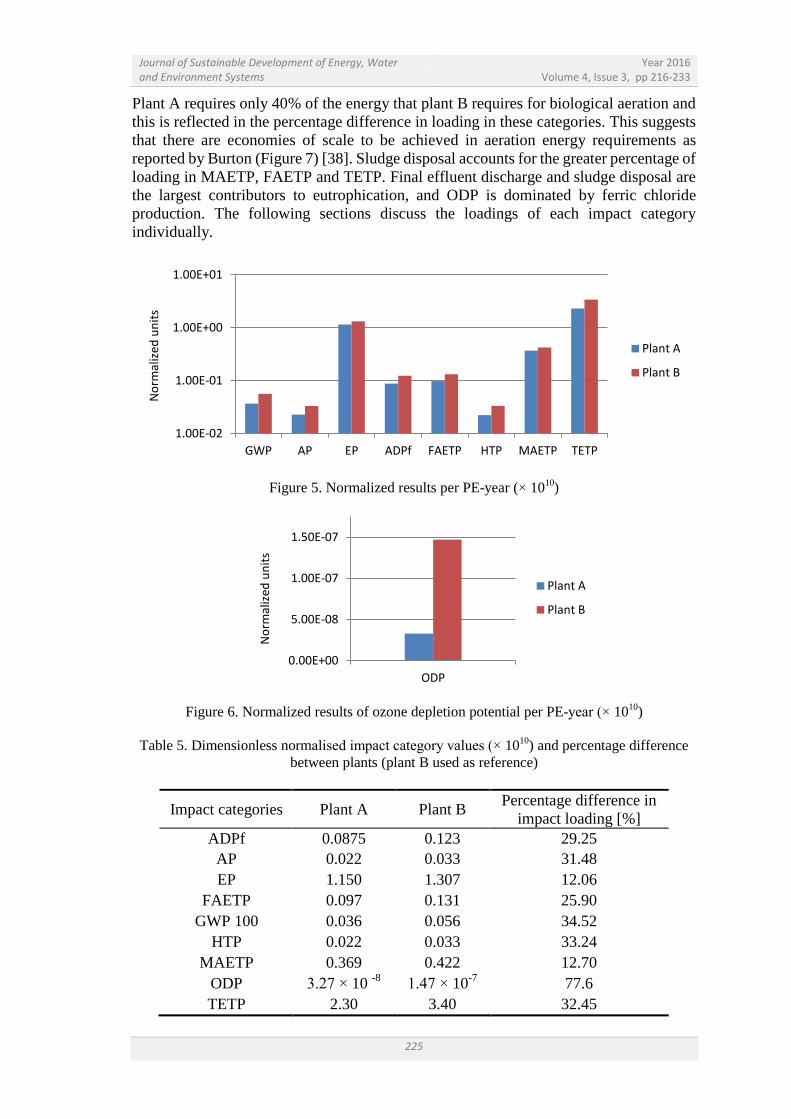
Figure 5 and Figure 6 present the environmental loading of both plants. Ozone
depletion potential (Figure 6) is presented seperately due to the large difference in
loading magnitude when compared with the other impact categories. The outputs have
been normalised with 2013 Western Europe normalisation factors that yield
dimensionless weighted quantities. This allows easier interpretation of results, as
illustrated by Ramos et al. [37]. It should be noted that the vertical axis in Figure 5 is in
logarithmic scale and therefore differences in outputs of some categories are significant.
The percentage differences are presented in Table 5.
In general, plant A performs better across all categories. Global impact categories
such as MAETP, GWP, AP, and ADPf are heavily influenced by energy consumption.
§ The refrigerant R11 is a chlorofluorocarbon (CFC)
Journal of Sustainable Development of Energy, Water and Environment Systems
Year 2016 Volume 4, Issue 3, pp 216-233
225
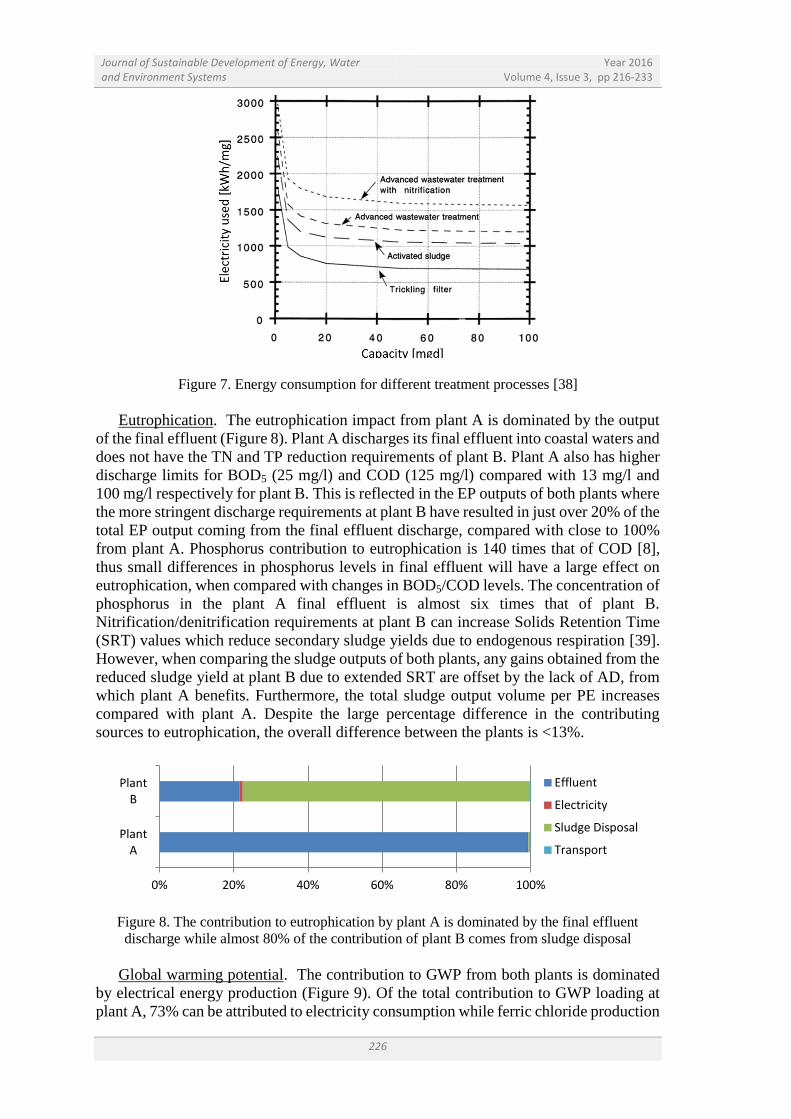
Plant A requires only 40% of the energy that plant B requires for biological aeration and
this is reflected in the percentage difference in loading in these categories. This suggests
that there are economies of scale to be achieved in aeration energy requirements as
reported by Burton (Figure 7) [38]. Sludge disposal accounts for the greater percentage of
loading in MAETP, FAETP and TETP. Final effluent discharge and sludge disposal are
the largest contributors to eutrophication, and ODP is dominated by ferric chloride
production. The following sections discuss the loadings of each impact category
individually.
Figure 5. Normalized results per PE-year (× 1010
)
Figure 6. Normalized results of ozone depletion potential per PE-year (× 1010
)
Table 5. Dimensionless normalised impact category values (× 1010
) and percentage difference
between plants (plant B used as reference)
Impact categories Plant A Plant B Percentage difference in
impact loading [%]
ADPf 0.0875 0.123 29.25
AP 0.022 0.033 31.48
EP 1.150 1.307 12.06
FAETP 0.097 0.131 25.90
GWP 100 0.036 0.056 34.52
HTP 0.022 0.033 33.24
MAETP 0.369 0.422 12.70
ODP 3.27 × 10 -8
1.47 × 10⁻⁷
77.6
TETP 2.30 3.40 32.45
1.00E-02
1.00E-01
1.00E+00
1.00E+01
GWP AP EP ADPf FAETP HTP MAETP TETP
No
rmal
ized
un
its
Plant A
Plant B
0.00E+00
5.00E-08
1.00E-07
1.50E-07
ODP
No
rmal
ized
un
its
Plant A
Plant B
Journal of Sustainable Development of Energy, Water and Environment Systems
Year 2016 Volume 4, Issue 3, pp 216-233
226
Figure 7. Energy consumption for different treatment processes [38]
Eutrophication. The eutrophication impact from plant A is dominated by the output
of the final effluent (Figure 8). Plant A discharges its final effluent into coastal waters and
does not have the TN and TP reduction requirements of plant B. Plant A also has higher
discharge limits for BOD5 (25 mg/l) and COD (125 mg/l) compared with 13 mg/l and
100 mg/l respectively for plant B. This is reflected in the EP outputs of both plants where
the more stringent discharge requirements at plant B have resulted in just over 20% of the
total EP output coming from the final effluent discharge, compared with close to 100%
from plant A. Phosphorus contribution to eutrophication is 140 times that of COD [8],
thus small differences in phosphorus levels in final effluent will have a large effect on
eutrophication, when compared with changes in BOD5/COD levels. The concentration of
phosphorus in the plant A final effluent is almost six times that of plant B.
Nitrification/denitrification requirements at plant B can increase Solids Retention Time
(SRT) values which reduce secondary sludge yields due to endogenous respiration [39].
However, when comparing the sludge outputs of both plants, any gains obtained from the
reduced sludge yield at plant B due to extended SRT are offset by the lack of AD, from
which plant A benefits. Furthermore, the total sludge output volume per PE increases
compared with plant A. Despite the large percentage difference in the contributing
sources to eutrophication, the overall difference between the plants is <13%.
Figure 8. The contribution to eutrophication by plant A is dominated by the final effluent
discharge while almost 80% of the contribution of plant B comes from sludge disposal
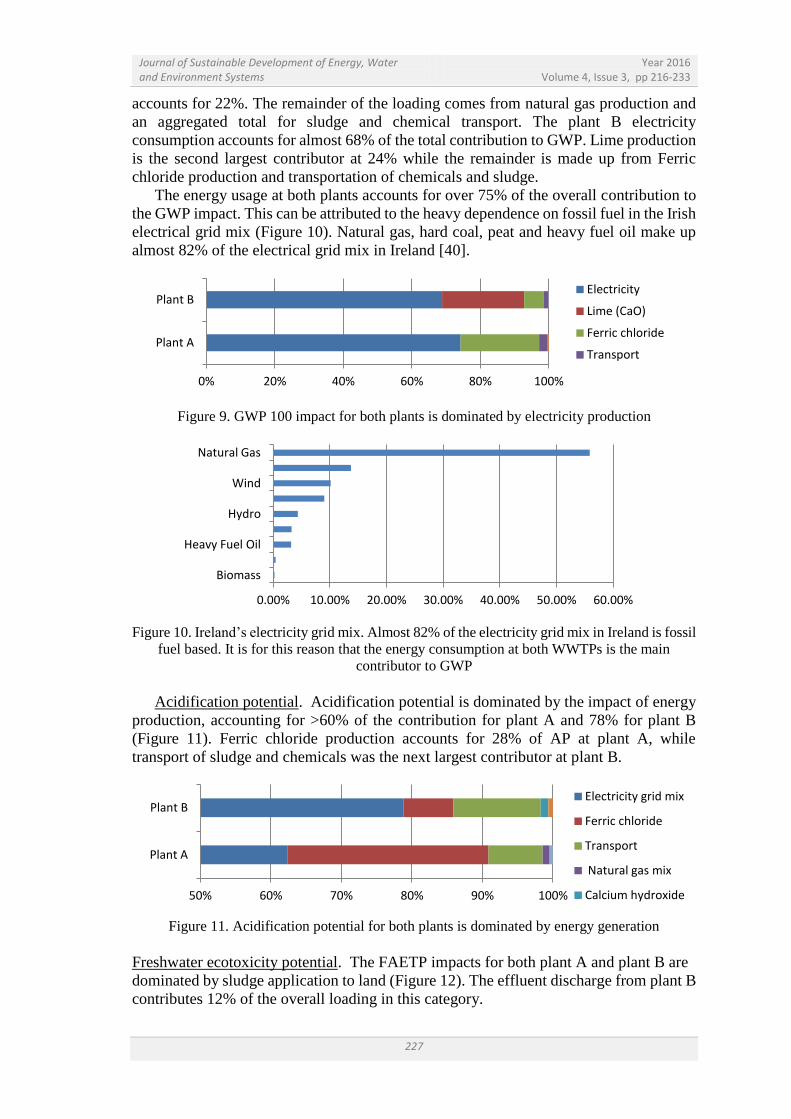
Global warming potential. The contribution to GWP from both plants is dominated
by electrical energy production (Figure 9). Of the total contribution to GWP loading at
plant A, 73% can be attributed to electricity consumption while ferric chloride production
0% 20% 40% 60% 80% 100%
Plant A
Plant B
Effluent
Electricity
Sludge Disposal
Transport
Journal of Sustainable Development of Energy, Water and Environment Systems
Year 2016 Volume 4, Issue 3, pp 216-233
227
accounts for 22%. The remainder of the loading comes from natural gas production and
an aggregated total for sludge and chemical transport. The plant B electricity
consumption accounts for almost 68% of the total contribution to GWP. Lime production
is the second largest contributor at 24% while the remainder is made up from Ferric
chloride production and transportation of chemicals and sludge.
The energy usage at both plants accounts for over 75% of the overall contribution to
the GWP impact. This can be attributed to the heavy dependence on fossil fuel in the Irish
electrical grid mix (Figure 10). Natural gas, hard coal, peat and heavy fuel oil make up
almost 82% of the electrical grid mix in Ireland [40].
Figure 9. GWP 100 impact for both plants is dominated by electricity production
Figure 10. Ireland’s electricity grid mix. Almost 82% of the electricity grid mix in Ireland is fossil
fuel based. It is for this reason that the energy consumption at both WWTPs is the main
contributor to GWP
Acidification potential. Acidification potential is dominated by the impact of energy
production, accounting for >60% of the contribution for plant A and 78% for plant B
(Figure 11). Ferric chloride production accounts for 28% of AP at plant A, while
transport of sludge and chemicals was the next largest contributor at plant B.
Figure 11. Acidification potential for both plants is dominated by energy generation
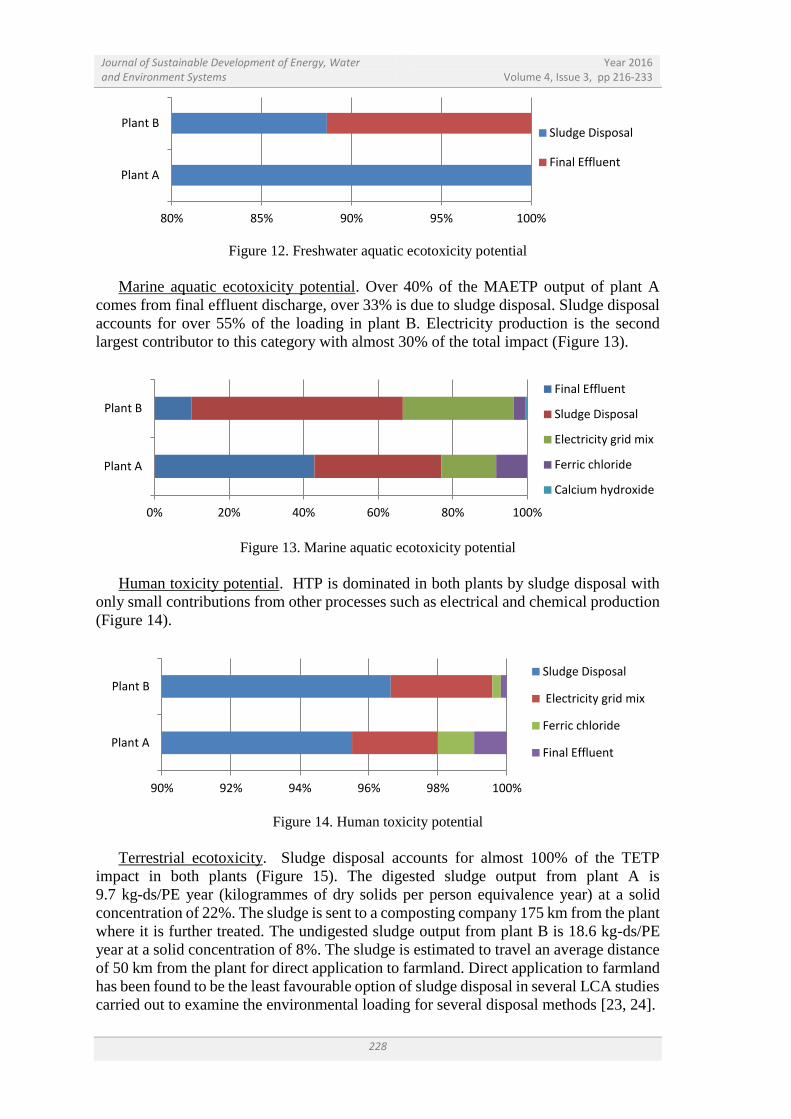
Freshwater ecotoxicity potential. The FAETP impacts for both plant A and plant B are
dominated by sludge application to land (Figure 12). The effluent discharge from plant B
contributes 12% of the overall loading in this category.
0% 20% 40% 60% 80% 100%
Plant A
Plant B Electricity
Lime (CaO)
Ferric chloride
Transport
0.00% 10.00% 20.00% 30.00% 40.00% 50.00% 60.00%
Biomass
Heavy Fuel Oil
Hydro
Wind
Natural Gas
50% 60% 70% 80% 90% 100%
Plant A
Plant B Electricity grid mix
Ferric chloride
Transport
Natural gas mix
Calcium hydroxide
Journal of Sustainable Development of Energy, Water and Environment Systems
Year 2016 Volume 4, Issue 3, pp 216-233
228
Figure 12. Freshwater aquatic ecotoxicity potential
Marine aquatic ecotoxicity potential. Over 40% of the MAETP output of plant A
comes from final effluent discharge, over 33% is due to sludge disposal. Sludge disposal
accounts for over 55% of the loading in plant B. Electricity production is the second
largest contributor to this category with almost 30% of the total impact (Figure 13).
Figure 13. Marine aquatic ecotoxicity potential
Human toxicity potential. HTP is dominated in both plants by sludge disposal with
only small contributions from other processes such as electrical and chemical production
(Figure 14).
Figure 14. Human toxicity potential
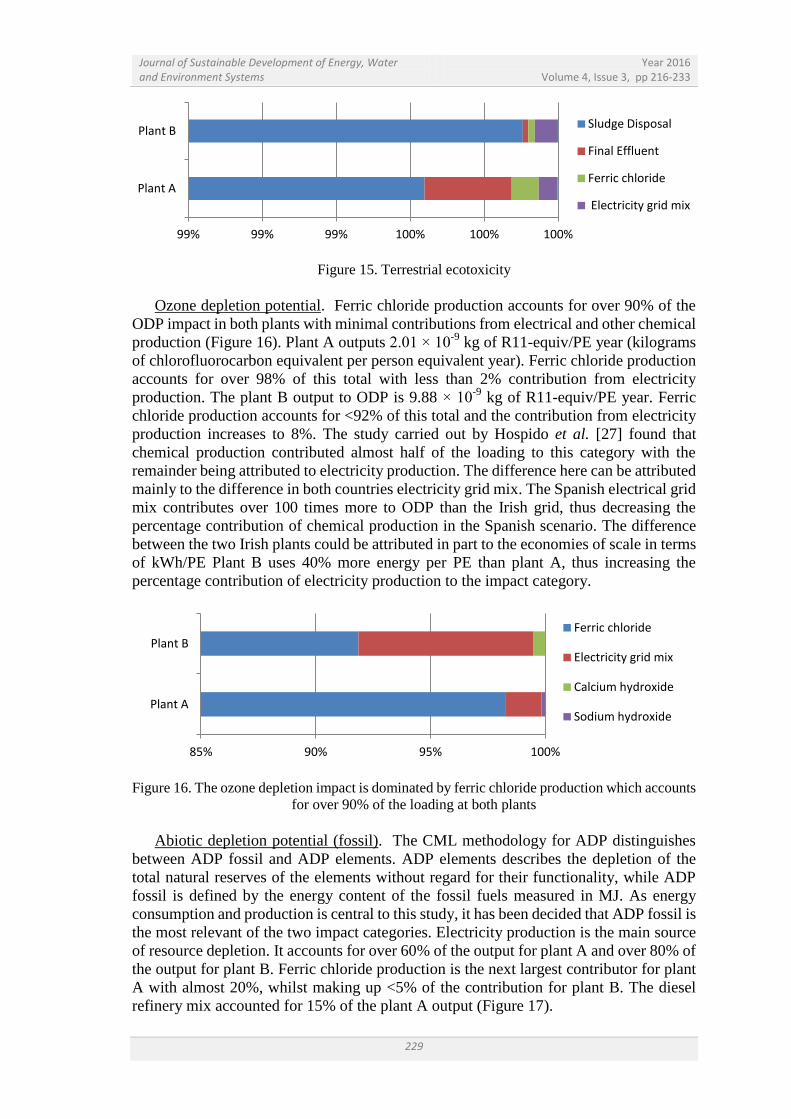
Terrestrial ecotoxicity. Sludge disposal accounts for almost 100% of the TETP
impact in both plants (Figure 15). The digested sludge output from plant A is
9.7 kg-ds/PE year (kilogrammes of dry solids per person equivalence year) at a solid
concentration of 22%. The sludge is sent to a composting company 175 km from the plant
where it is further treated. The undigested sludge output from plant B is 18.6 kg-ds/PE
year at a solid concentration of 8%. The sludge is estimated to travel an average distance
of 50 km from the plant for direct application to farmland. Direct application to farmland
has been found to be the least favourable option of sludge disposal in several LCA studies
carried out to examine the environmental loading for several disposal methods [23, 24].
80% 85% 90% 95% 100%
Plant A
Plant B Sludge Disposal
Final Effluent
0% 20% 40% 60% 80% 100%
Plant A
Plant B
Final Effluent
Sludge Disposal
Electricity grid mix
Ferric chloride
Calcium hydroxide
90% 92% 94% 96% 98% 100%
Plant A
Plant B Sludge Disposal
Electricity grid mix
Ferric chloride
Final Effluent
Journal of Sustainable Development of Energy, Water and Environment Systems
Year 2016 Volume 4, Issue 3, pp 216-233
229
Figure 15. Terrestrial ecotoxicity
Ozone depletion potential. Ferric chloride production accounts for over 90% of the
ODP impact in both plants with minimal contributions from electrical and other chemical
production (Figure 16). Plant A outputs 2.01 × 10⁻⁹
kg of R11-equiv/PE year (kilograms
of chlorofluorocarbon equivalent per person equivalent year). Ferric chloride production
accounts for over 98% of this total with less than 2% contribution from electricity
production. The plant B output to ODP is 9.88 × 10⁻⁹
kg of R11-equiv/PE year. Ferric
chloride production accounts for <92% of this total and the contribution from electricity
production increases to 8%. The study carried out by Hospido et al. [27] found that
chemical production contributed almost half of the loading to this category with the
remainder being attributed to electricity production. The difference here can be attributed
mainly to the difference in both countries electricity grid mix. The Spanish electrical grid
mix contributes over 100 times more to ODP than the Irish grid, thus decreasing the
percentage contribution of chemical production in the Spanish scenario. The difference
between the two Irish plants could be attributed in part to the economies of scale in terms
of kWh/PE Plant B uses 40% more energy per PE than plant A, thus increasing the
percentage contribution of electricity production to the impact category.
Figure 16. The ozone depletion impact is dominated by ferric chloride production which accounts
for over 90% of the loading at both plants
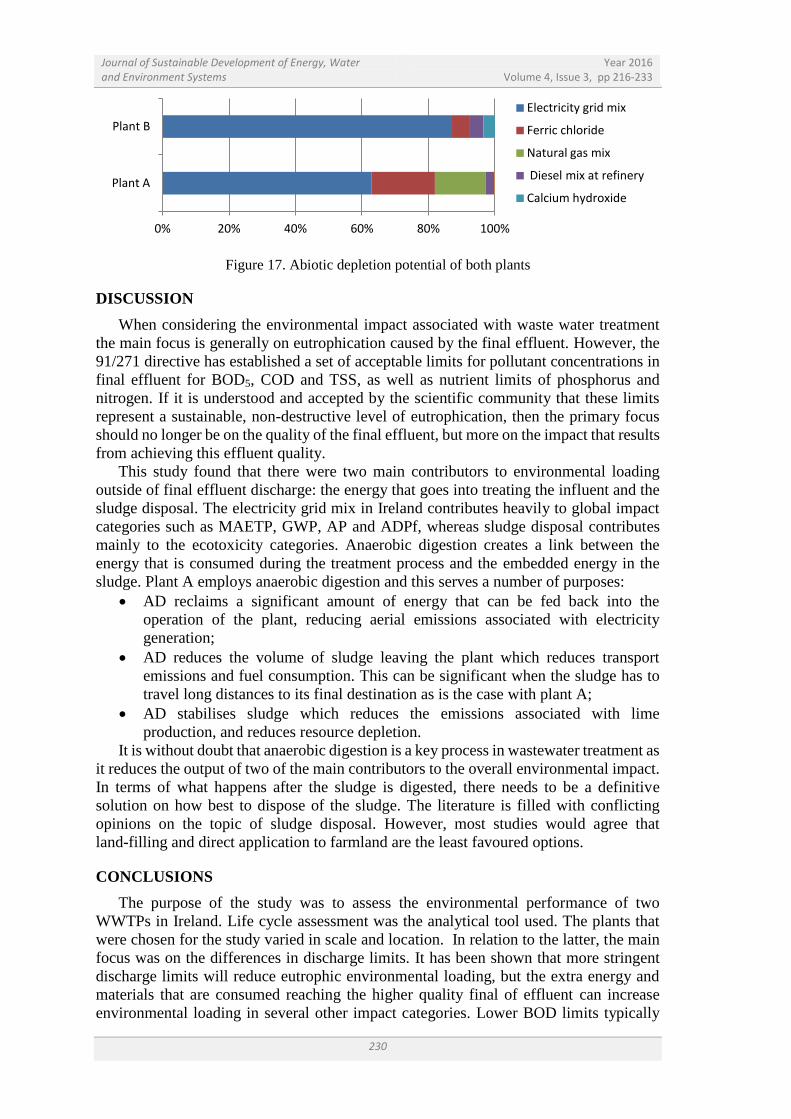
Abiotic depletion potential (fossil). The CML methodology for ADP distinguishes
between ADP fossil and ADP elements. ADP elements describes the depletion of the
total natural reserves of the elements without regard for their functionality, while ADP
fossil is defined by the energy content of the fossil fuels measured in MJ. As energy
consumption and production is central to this study, it has been decided that ADP fossil is
the most relevant of the two impact categories. Electricity production is the main source
of resource depletion. It accounts for over 60% of the output for plant A and over 80% of
the output for plant B. Ferric chloride production is the next largest contributor for plant
A with almost 20%, whilst making up <5% of the contribution for plant B. The diesel
refinery mix accounted for 15% of the plant A output (Figure 17).
99% 99% 99% 100% 100% 100%
Plant A
Plant B Sludge Disposal
Final Effluent
Ferric chloride
Electricity grid mix
85% 90% 95% 100%
Plant A
Plant B Ferric chloride
Electricity grid mix
Calcium hydroxide
Sodium hydroxide
Journal of Sustainable Development of Energy, Water and Environment Systems
Year 2016 Volume 4, Issue 3, pp 216-233
230
Figure 17. Abiotic depletion potential of both plants
DISCUSSION
When considering the environmental impact associated with waste water treatment
the main focus is generally on eutrophication caused by the final effluent. However, the
91/271 directive has established a set of acceptable limits for pollutant concentrations in
final effluent for BOD5, COD and TSS, as well as nutrient limits of phosphorus and
nitrogen. If it is understood and accepted by the scientific community that these limits
represent a sustainable, non-destructive level of eutrophication, then the primary focus
should no longer be on the quality of the final effluent, but more on the impact that results
from achieving this effluent quality.
This study found that there were two main contributors to environmental loading
outside of final effluent discharge: the energy that goes into treating the influent and the
sludge disposal. The electricity grid mix in Ireland contributes heavily to global impact
categories such as MAETP, GWP, AP and ADPf, whereas sludge disposal contributes
mainly to the ecotoxicity categories. Anaerobic digestion creates a link between the
energy that is consumed during the treatment process and the embedded energy in the
sludge. Plant A employs anaerobic digestion and this serves a number of purposes:
AD reclaims a significant amount of energy that can be fed back into the
operation of the plant, reducing aerial emissions associated with electricity
generation;
AD reduces the volume of sludge leaving the plant which reduces transport
emissions and fuel consumption. This can be significant when the sludge has to
travel long distances to its final destination as is the case with plant A;
AD stabilises sludge which reduces the emissions associated with lime
production, and reduces resource depletion.
It is without doubt that anaerobic digestion is a key process in wastewater treatment as
it reduces the output of two of the main contributors to the overall environmental impact.
In terms of what happens after the sludge is digested, there needs to be a definitive
solution on how best to dispose of the sludge. The literature is filled with conflicting
opinions on the topic of sludge disposal. However, most studies would agree that
land-filling and direct application to farmland are the least favoured options.
CONCLUSIONS
The purpose of the study was to assess the environmental performance of two
WWTPs in Ireland. Life cycle assessment was the analytical tool used. The plants that
were chosen for the study varied in scale and location. In relation to the latter, the main
focus was on the differences in discharge limits. It has been shown that more stringent
discharge limits will reduce eutrophic environmental loading, but the extra energy and
materials that are consumed reaching the higher quality final of effluent can increase
environmental loading in several other impact categories. Lower BOD limits typically
0% 20% 40% 60% 80% 100%
Plant A
Plant B
Electricity grid mix
Ferric chloride
Natural gas mix
Diesel mix at refinery
Calcium hydroxide
Journal of Sustainable Development of Energy, Water and Environment Systems
Year 2016 Volume 4, Issue 3, pp 216-233
231
result in an increase in aeration energy requirements and this in turn increases loading in
impact categories that are dominated by contributions from energy production such as
MAETP, ADPf, GWP and AP. Phosphorous reduction requirements increase ferric
chloride consumption, and thus production, which increases environmental loading in a
number of impact categories such as ODP, GWP and MAETP.
Investigations of the effect of variation in scale proved difficult because of
differences in system configuration and the fact that one plant was successfully running
its anaerobic digesters while the other was not. The plant with the functioning digesters
was reclaiming some energy and reducing sludge outputs. This has the effect of reducing
the loading in several impact categories. However, even if the energy reclaimed from
anaerobic digestion were excluded, there would still be a significant difference in energy
consumption between plants. What could be concluded in relation to scale was that there
were significant economies of scale to be achieved in aeration energy consumed during
secondary treatment.
It would be prudent to research further, and in greater detail, the exact sources of any
energy and resource savings that could be made. There are other areas of plants operation
that are also worthy of investigation such as plant management, flow monitoring and
system configuration. Indeed, there is an abundance of research opportunities in this
field. One further point of note in relation to this research is that because the UWWTD is
pan-European legislation, the research could be expanded to compare energy and
resource efficiency of water and wastewater treatment systems across the continent. Life
cycle assessment is growing in popularity, and is seen by many as a suitable analytical
tool for environmental profiling of existing plants, and as a decision support mechanism
for future development of more environmentally sustainable wastewater treatment
systems.
REFERENCES
1. European Commission, Council Directive: Concerning Urban Waste Water
Treatment (91/271/EEC), Brussels, 1991.
2. Henze, M., Wastewater Treatment: Biological and Chemical Processes, 2nd
ed.,
Springer, Berlin, New York, 1997, http://dx.doi.org/10.1007/978-3-662-22605-6
3. Jones, R. N., An Environmental Risk Assessment/management Framework for
Climate Change Impact Assessments, Nat. Hazards, Vol. 23, No. 2-3, pp 197-230,
2001, http://dx.doi.org/10.1023/A:1011148019213
4. Rosen, M. A., Exergy, Can. Cons. Eng., Vol. 46, No. 2, pp 25-28, 2005.
5. Crane, P., Scott, D. S. and Rosen, M. A., Exergy of Emissions as a Measure of
Potential for Environmental Impact (Veziro, T. N., Takahashi, P. K., eds.), Hydrogen
Energy Progress VIII, Proceedings, 8th
World Hydrogen Energy Conf., 2012.
6. Ayres, R. U., Ayres, L. W. and Martinás, K., Exergy, Waste Accounting, and
Life-cycle Analysis, Energy, Vol. 23, No. 5, pp 355-363, 1998, http://dx.doi.org/10.1016/S0360-5442(97)00076-5
7. Gaudreau, K., Fraser, R. A. and Murphy, S., The Characteristics of the Exergy
Reference Environment and its Implications for Sustainability-Based
Decision-Making, Energies, Vol. 5, pp 2197-2213, 2012, http://dx.doi.org/10.3390/en5072197
8. Tillman, A. M. and Baumann, H., The Hitch Hiker's Guide to LCA, 1:7 ed., Vol. 1,
Holmsbergs, Sweden, 543 p, 2004.
9. Jensen, A. A., Hoffman, L., Moller, T. B. and Schmidt, A., Life Cycle Assessment: A
Guide to Approaches, Experiences and Information Sources, Environmental Issue
Series, pp 53-56, 1997.
Journal of Sustainable Development of Energy, Water and Environment Systems
Year 2016 Volume 4, Issue 3, pp 216-233
232
10. Roeleveld, P. J., Klapwijk, A., Eggels, P. G., Rulkens, W. H. and van Starkenburg,
W., Sustainability of Municipal Waste Water Treatment, Advanced Wastewater
Treatment: Nutrient Removal and Anaerobic Processes Selected Proceedings of the
IAWQ International Conference on Advanced Wastewater Treatment: Nutrient
Removal and Anaerobic Processes (AQUATECH 96), Water Science and
Technology, Vol. 35, No. 10, pp 221-228, 1997, http://dx.doi.org/10.1016/S0273-1223(97)00199-6
11. Corominas, L., Foley, J., Guest, J. S., Hospido, A., Larsen, H. F., Morera, S. and
Shaw, A., Life Cycle Assessment Applied to Wastewater Treatment: State of the Art,
Water Res., Vol. 47, No. 15, pp 5480-5492, 2013, http://dx.doi.org/10.1016/j.watres.2013.06.049
12. Tillman, A., Svingby, M. and Lundstrom, H., Life Cycle Assessment of Municipal
Waste Water Systems, The International Journal of Life Cycle Assessment, Vol. 3,
No. 3, pp. 145-157, 1998, http://dx.doi.org/10.1007/BF02978823
13. Lundin, M., Bengtsson, M. and Sverker, M., Life Cycle Assessment of Wastewater
Systems: Influence of System Boundaries and Scale on Calculated Environmental
Loads, Environ. Sci. Technol., Vol. 34, No. 1, pp 180-186, 2000, http://dx.doi.org/10.1021/es990003f
14. Vidal, N., Poch, M., Martí, E. and Rodríguez-Roda, I., Evaluation of the
Environmental Implications to Include Structural Changes in a Wastewater Treatment
Plant, Journal of Chemical Technology & Biotechnology, Vol. 77, No. 11, pp
1206-1211, 2002, http://dx.doi.org/10.1002/jctb.674
15. Kalbar, P. P., Karmakar, S. and Asolekar, S. R., Assessment of Wastewater Treatment
Technologies: Life Cycle Approach, Water and Environment Journal, Vol. 27, No. 2,
pp 261-268, 2013, http://dx.doi.org/10.1111/wej.12006
16. Gallego, A., Hospido, A., Moreira, M. T. and Feijoo, G., Environmental Performance
of Wastewater Treatment Plants for Small Populations, Resour. Conserv. Recycling,
Vol. 52, No. 6, pp 931-940, 2008, http://dx.doi.org/10.1016/j.resconrec.2008.02.001
17. Pasqualino, J. C., Meneses, M. and Castells, F., Life Cycle Assessment of Urban
Wastewater Reclamation and Reuse Alternatives, J. Ind. Ecol., Vol. 15, No. 1, pp
49-63, 2011, http://dx.doi.org/10.1111/j.1530-9290.2010.00293.x
18. Roeleveld, P., Klapwijk, A., Eggels, P., Rulkens, W. and Van Starkenburg, W.,
Sustainability of Municipal Waste Water Treatment, Water Science and Technology,
Vol. 35, No. 10, pp 221-228, 1997, http://dx.doi.org/10.1016/S0273-1223(97)00199-6
19. René Itten, et al., Life Cycle Inventories of Electricity Mixes and Grid,
http://www.esu-services.ch/fileadmin/download/publicLCI/itten-2012-electricity-mi
x.pdf, [Accessed: 03-October-2015]
20. Aubain, P., Gazzo, A., LeMoux, J., Mugnier, E., Brunet, H. and Landrea, B., Disposal
and Recycling Routes for Sewage Sludge, European Commission, Vol. 22, pp 16-17,
2002.
21. Hultman, B., Levlin, E. and Stark, K., Swedish Debate on Sludge Handling,
Proceedings of a Polish – Swedish Seminar on Sustainable Municipal Sludge and
Solid Waste Handling, Krakow, 2000.
22. Pasqualino, J. C., Meneses, M., Abella, M. and Castells, F., LCA as a Decision
Support Tool for the Environmental Improvement of the Operation of a Municipal
Wastewater Treatment Plant, Environ. Sci. Technol., Vol. 43, No. 9, pp 3300-3307,
2009, http://dx.doi.org/10.1021/es802056r
23. Houillon, G. and Jolliet, O., Life Cycle Assessment of Processes for the Treatment of
Wastewater Urban Sludge: Energy and Global Warming Analysis, Environmental
Assessments and Waste Management, J. Clean. Prod., Vol. 13, No. 3, pp 287-299,
2005, http://dx.doi.org/10.1016/j.jclepro.2004.02.022
Journal of Sustainable Development of Energy, Water and Environment Systems
Year 2016 Volume 4, Issue 3, pp 216-233
233
24. Lundin, M., Olofsson, M., Pettersson, G. J. and Zetterlund, H., Environmental and
Economic Assessment of Sewage Sludge Handling Options, Resour. Conserv.
Recycling, Vol. 41, No. 4, pp 255-278, 2004, http://dx.doi.org/10.1016/j.resconrec.2003.10.006
25. Suh, Y. and Rousseaux, P., Considerations in Life Cycle Inventory Analysis of
Municipal Wastewater Treatment Systems, Oral Presentation at COST 624 WG
Meeting, Bologna, Italy, 2001.
26. Kelessidis, A. and Stasinakis, A. S., Comparative Study of the Methods used for
Treatment and Final Disposal of Sewage Sludge in European Countries, Waste Man.,
Vol. 32, No. 6, pp 1186-1195, 2012, http://dx.doi.org/10.1016/j.wasman.2012.01.012
27. Hospido, A., Moreira, M. and Feijoo, G., A Comparison of Municipal Wastewater
Treatment Plants for Big Centres of Population in Galicia (Spain), Int. J. of Life Cycle
Assess., Vol. 13, No. 1, pp 57-64, 2008, http://dx.doi.org/10.1007/s11367-007-0314-8
28. Hospido, A., Moreira, M., Fernandez-Couto, M. and Feijoo, G., Environmental
Performance of a Municipal Wastewater Treatment Plant, Int. J. of Life Cycle Assess.,
Vol. 9, No. 4, pp 261-271, 2004, http://dx.doi.org/10.1007/BF02978602
29. Renou, S., Thomas, J. S., Aoustin, E. and Pons, M. N., Influence of Impact
Assessment Methods in Wastewater Treatment LCA, J. Clean. Prod., Vol. 16, No.
10, pp 1098-1105, 2008, http://dx.doi.org/10.1016/j.jclepro.2007.06.003
30. Heijungs, R., Guinée, J. and Huppes, G., Impact Categories for Natural Resources and
Land Use, CML Report, Vol. 138, 1997.
31. European Commission, Pollutants in Urban Waste Water and Sewage Sludge,
Brussels, 2001.
32. International Standard Organization, ISO 14040: Environmental Management-Life
Cycle Assessment-Principles and Framework, 1997.
33. International Standards Organization, ISO 14041: Environmental Management-Life
Cycle Assessment-Goal and Scope Definition and Inventory Analysis, ISO, 1998.
34. International Standards Organization, 14042: Environmental Management ‒ Life
Cycle Assessment ‒ Life Cycle Impact Assessment, Brussels: International
Organisation for Standardisation, 2000.
35. Lecouls, H., ISO 14043: Environmental Management, Lifecycle Assessment, Life
Cycle Interpretation, Int. J. Life Cycle Assess., 254 p, 1999.
36. Guinée, J. B., Gorrée, M., Huppes, G., Klein, R. and De Koning, A., et al., Handbook
on Life Cycle Assessment ‒ Operational Guide to the ISO Standards, Vol. 7, Kluwer
Academic Publishers, pp 51-55, 2001.
37. Dominguez-Ramos, A., Chavan, K., García, V., Jimeno, G., Albo, J., Marathe, K. V.,
Yadav, G. D. and Irabien, A., Arsenic Removal from Natural Waters by Adsorption
or Ion Exchange: An Environmental Sustainability Assessment, Ind. Eng. Chem.
Res., Vol. 53, No. 49, pp 18920-18927, 2014, http://dx.doi.org/10.1021/ie4044345
38. Burton, F. L., Water and Wastewater Industries: Characteristics and Energy
Management Opportunities, CEC Report 106941, Electrical Power Research
Institute, St. Louis, MO, 1996.
39. Metcalf and Eddy, Wastewater Engineering: Treatment and Reuse, 4th
ed.,
McGraw-Hill, New York, United States, 2002.
40. Howley, M., Dennehy, E., Holland, M. and O Gallachoir, B., Energy in Ireland: Key
Statistics 2012, 2012.
Paper submitted: 04.08.2015
Paper revised: 11.11.2015
Paper accepted: 22.11.2015