Embed Size (px)
Citation preview

Nikola Palanov
Avdelningen för ByggnadsfysikExamensarbete TVBH-5074Lund 2014
ISRN LUTVDG/TVBH--14/5074--SE(149)
Life-cycle assessment ofPhotovaltaic systems
- Analysis of environmental impact from the production of PV system including solar panels produced by Gaia Solar

Life-cycle assessment ofPhotovaltaic systems
- Analysis of environmental impact from the production of PV system including solar panels produced by Gaia Solar
Nikola Palanov

© Nikola Palanov ISRN LUTVDG/TVBH-14/5074--SE(149) Avdelningen för ByggnadsfysikInstitutionen för bygg- och miljöteknologiLunds tekniska högskolaLunds universitet Box 118 22100 LUND

i
Summary
The purpose of this study is to conduct a stand-alone life cycle assessment (LCA) intended for the
solar panel manufacturers Gaia Solar. Even though the LCA is stand-alone, the methodology and
guidelines for performing such a study on a photovoltaic (PV) system are standardized in order to
enable comparison of results with other studies in that field. The life cycle assessment is conducted by
ISO standards and IEA PVPS standards specified for PV systems.
LCA is used for identification of all processes for a product or service throughout their entire lifespan,
from cradle to grave. It includes all production or/and process stages in order to identify and clarify
which contribute to highest environmental impact results.
The goal is to identify which parts and processes of the PV system that contribute to highest
environmental impact. Such results clarify the production impacts and can thus be used to prioritize
eventual improvements correctly. The environmental impact categories are resource consumption,
water use, land use, cumulative energy demand, renewable energy, non-renewable energy, global
warming potential, acidification potential, eutrophication potential, ozone depletion potential, human
toxicity potential and ionizing radiation. Beyond mentioned environmental impact categories, the
study also presents the energy pay-back time, a scenario for extended PV system lifetime, a scenario
with thinner solar cells and CO2 migration potential for Danish electricity mix.
The study is based on data from a LCA database called Ecoinvent. No LCA software was used and all
the data was instead managed in Microsoft EXCEL. Available data in Ecoinvent originated
predominantly from 2005 to 2006 and therefore does not represent top modern PV system production
facilities. This is due to the lack of free new data in an open LCA database.
The functional unit (FU) of the study is 1 kWh produced electricity from converted solar irradiation.
The reference flow, which is the size of the PV system, is 3 000 Wp (watt peak). The study also
presents degradation of the PV system which leads to falling electricity generation with time.
The results show that one part, of many included in a PV system, contributed to the highest extent to
the majority of the impact categories. This part is the solar cells which totally dominated the results for
9 categories out of the 12. The only impact categories that were not dominated by the production
process of solar cells were categories related to resources and toxicity. The weight of the solar cells,
and thus the required raw materials, are very small in comparison to other parts of the PV system and
therefore the solar cells results were not highest in these categories. The results also showed how
energy intensive the solar cell production was, and since many impact categories are correlated with
fossil fuel combustion for energy purposes, they were overwhelmingly represented by the solar cell.
The energy payback time for the PV system was calculated to 2,5 years for Danish conditions
regarding solar irradiation and electricity mix. The case for the extended lifetime of the PV system to
40 years, from previous 30 years, resulted in 23% reduction of all results. The thinner solar cells also
contributed to significant improvements in the results varying from 2-23% depending on the
environmental impact category.
Based on the results, the part contributing to highest overall environmental impact was the solar cell
and this part should be prioritized during potential improvement plans. Every small reduction in the
solar cell production process resulted in significant reduction of the total results for the whole PV
system.

ii

iii
Preface
This is a master thesis in Environmental Engineering, part of the Civil Engineering education at the
Faculty of Engineering, Lund University (LTH), in Lund. This study has been conducted at the
department of Building Physics at the Faculty of Engineering, Lund University. This study is
conducted for Gaia Solar, producers of photovoltaic panels and systems.
Supervisor for this study has been Elisabeth Kjellsson, PhD in engineering at the department of
Building Physics. Representative and supervisor from Gaia Solar was Jesper Frausig. The examiner
was Jesper Arfvidsson, professor and head of department for Building Physics at the Faculty of
Engineering, Lund University.
May-2014
Nikola Palanov

iv
Table of Content 1. Introduction ................................................................................................................................... 1
1.1 Disposition .............................................................................................................................. 1
1.2 Background ............................................................................................................................ 2
1.3 Gaia Solar ............................................................................................................................... 3
1.4 Purpose ................................................................................................................................... 3
1.5 Production at Gaia Solar ...................................................................................................... 4
1.6 LCA methodology .................................................................................................................. 4
1.6.1 IEA-PVPS-TASK 12 Methodology Guidelines on Life Cycle Assessment of
Photovoltaic Electricity ................................................................................................................. 5
1.6.2 Goal and Scope .............................................................................................................. 6
1.6.3 Life cycle inventory (LCI) ............................................................................................. 9
1.6.4 Impact Assessment (Results) ...................................................................................... 10
1.6.5 Interpretation and discussion ..................................................................................... 11
1.7 Manufacturing of crystalline silicon solar panels and parts ............................................ 11
1.7.1 Solar cells ...................................................................................................................... 12
1.7.2 Inverters ....................................................................................................................... 12
1.7.3 Electric installation ...................................................................................................... 12
1.7.4 Slanted roof PV structure installation ....................................................................... 13
1.7.5 Encapsulate .................................................................................................................. 13
1.7.6 Back glass ..................................................................................................................... 13
1.7.7 Front glass .................................................................................................................... 13
1.7.8 Protective back sheet (PBS) ........................................................................................ 14
1.7.9 Anti-reflective coating (AR-coating) .......................................................................... 14
2 Goal and Scope ............................................................................................................................ 17
2.1 Goal ....................................................................................................................................... 17
2.2 Scope ..................................................................................................................................... 17
2.2.1 Description of the system ............................................................................................ 17
2.2.2 Degradation of the system ........................................................................................... 18
2.2.3 Performance ratio (PR) ............................................................................................... 18
2.2.4 Ecoinvent methodology ............................................................................................... 19
2.2.5 System boundaries ....................................................................................................... 20
2.2.5.1 PV system parameters ................................................................................................... 20
2.2.5.2 Technological coverage ................................................................................................ 21
2.2.5.3 Geographical coverage ................................................................................................. 21
2.2.5.4 Time coverage ............................................................................................................... 22

v
2.2.5.5 Upstream processes....................................................................................................... 22
2.2.5.6 Downstream processes .................................................................................................. 22
2.2.5.7 User phase ..................................................................................................................... 22
2.2.5.8 Excluded phases ........................................................................................................... 22
2.3 Function unit (FU) ............................................................................................................... 23
2.4 Reference flow ...................................................................................................................... 23
2.5 Secondary function .............................................................................................................. 23
2.6 Allocation ............................................................................................................................. 23
2.7 Impact categories ................................................................................................................. 24
2.8 Characterization methodology for LCA............................................................................ 24
2.8.1 EDIP (Environmental Design of Industrial Products) ............................................. 25
2.8.2 CED (Cumulative Energy Demand) .......................................................................... 25
2.8.3 Selected LCI results, additional ................................................................................. 26
2.8.4 CML 2001 ..................................................................................................................... 26
2.9 Balance of system (BOS) ..................................................................................................... 26
2.10 Data quality .......................................................................................................................... 27
2.11 Limitations and assumptions .............................................................................................. 27
3 Life cycle inventory (LCI)........................................................................................................... 29
3.1 Parts for PV system ............................................................................................................. 29
3.1.1 Solar cells ...................................................................................................................... 29
3.1.2 Inverters ....................................................................................................................... 33
3.1.3 Electric installation ...................................................................................................... 34
3.1.4 Slanted roof PV structure installation ....................................................................... 37
3.1.5 Encapsulate .................................................................................................................. 38
3.1.6 Back and front glass .................................................................................................... 39
3.1.7 Protective back sheet (PBS) ........................................................................................ 39
3.1.8 Anti-reflecting coating (AR-coating) ......................................................................... 40
3.1.9 Extraction and refining and production .................................................................... 40
3.1.10 Resource consumption ................................................................................................ 41
3.1.11 Energy flow .................................................................................................................. 41
3.2 Degradation .......................................................................................................................... 42
3.3 Energy output from the PV system .................................................................................... 42
3.4 Transport ............................................................................................................................. 43
3.4.1 Ecoinvent transport data ............................................................................................ 43
3.4.2 To and from location ................................................................................................... 44
3.4.3 EURO 5 ........................................................................................................................ 44

vi
3.4.4 Transportation additional information ..................................................................... 45
3.4.5 Transport parameters freight ship ............................................................................ 46
3.4.6 Transport parameters lorry 16-32 tons, EURO 5 .................................................... 47
3.4.7 Transport Parameters lorry 3,5-7,5 tons, EURO 5 .................................................. 48
3.5 Assembly at Gaia Solar ....................................................................................................... 49
3.5.1 Energy at Gaia alone ................................................................................................... 49
3.6 Deposition and recycling ..................................................................................................... 49
3.6.1 Recycling LCA ............................................................................................................. 50
3.6.2 Recalculation for aluminum recycling of roof installation ...................................... 51
3.6.3 Recalculation for energy by recycling of aluminum in roof installation ................ 53
3.6.4 Recalculation of front and back glass with recycling ............................................... 54
3.6.5 Recalculation of energy with recycling of glass ........................................................ 55
4 Results........................................................................................................................................... 57
4.1 Resources .............................................................................................................................. 57
4.1.1 Resource consumption ................................................................................................ 58
4.1.2 Land .............................................................................................................................. 60
4.1.3 Water ............................................................................................................................ 61
4.1.4 Cumulative energy demand ............................................................................................ 62
4.1.5 Renewable energy ........................................................................................................ 63
4.1.6 Non-renewable energy ................................................................................................. 64
4.2 Environmental Impact ........................................................................................................ 64
4.2.1 Global warming potential, 100 years ......................................................................... 65
4.2.2 Acidification Potential ................................................................................................. 66
4.2.3 Eutrophication Potential ............................................................................................. 67
4.2.4 Ozone depletion potential, 10 years ........................................................................... 68
4.3 Human effect ........................................................................................................................ 69
4.3.1 Human toxicity, 100 years .......................................................................................... 69
4.3.2 Ionizing radiation ........................................................................................................ 70
4.4 Cumulative results ............................................................................................................... 71
4.5 Energy Pay-back Time ........................................................................................................ 71
4.6 Spared emissions in Danish electricity mix ....................................................................... 73
4.7 Extended PV system lifetime to 40 years ........................................................................... 75
5 Interpretation and Discussion .................................................................................................... 77
5.1 Technology improvement ................................................................................................... 77
5.2 Resources .............................................................................................................................. 79
5.2.1 Resource consumption ................................................................................................ 79

vii
5.2.2 Water ............................................................................................................................ 80
5.2.3 Land .............................................................................................................................. 81
5.2.4 Cumulative energy demand (CED) ............................................................................ 81
5.2.5 Renewable energy ........................................................................................................ 82
5.2.6 Non-renewable energy ................................................................................................. 82
5.3 Environmental impact ........................................................................................................ 82
5.3.1 Global warming potential ........................................................................................... 82
5.3.2 Acidification potential ................................................................................................. 84
5.3.3 Eutrophication potential ............................................................................................. 84
5.3.4 Ozone Depletion potential ........................................................................................... 85
5.4 Human effect ........................................................................................................................ 86
5.4.1 Human toxicity potential, 100 years .......................................................................... 86
5.4.2 Ionizing radiation ........................................................................................................ 86
5.4.3 Energy pay-back time consistency ............................................................................. 88
6 Conclusions .................................................................................................................................. 89
References ............................................................................................................................................. 91
Appendix 1, Calculations ...................................................................................................................... 99
Appendix 2, Energy comparison between EG and SoG-silicon pathway and inverter data ............... 105
Appendix 3, Unit process raw data ...................................................................................................... 107
Appendix 4, Metadata ......................................................................................................................... 123
Appendix 5, impact categories result, resources, degradation and production data ............................ 143

viii

1
1. Introduction
In today’s world, energy is undeniably one of the key features for our society to function and thrive. It
is included in almost every aspect of everyday events, everything from eating your produced food to
watching TV, from traveling to work to having a comfortable indoor environment. By acknowledging
the great importance on energy in today’s society one cannot help to speculate in how the energy
demand will be like in the near or far future. With highest probability the demand of energy will raise
a lot in our near future although the magnitude of this increase varies slightly depending on the source
one uses to find these prognoses1. Either way, an increase is inevitable according to all trustworthy
sources. The prognoses, based on political decisions and subsidies, will promote the renewable energy
sources so that they can be competitive against fossil fuels leading to a prudential increase of
renewable power generators in the total world energy mix2.
Energy is formed from different kind of sources where many of them are unarguably not sustainable
and contribute to many direct and indirect negative effects on the society such as air pollution, increase
of greenhouse gases and many more will be mentioned further on in this report. Other sources are
more suitable from a pollution and smog point of view but still unsustainable like fossil gases, and
then there are energy sources which are both sustainable and clean. Solar power, wind power and
hydro power are all examples of sustainable and clean energy. By harvesting the free energy that is
surrounding us like the sun’s irradiation, wind, biological and water, the amount of renewable energy
could replace part of the energy from fossil fuels. This doesn’t mean that the environmental impact
from these renewable energy power generators also is harmless and sustainable.
Every product and service is based on actions and in turn on energy and resources. Some may get
confused that wind, solar and hydro power can have negative consequences on the surrounding
ecosystems because of the fact that they are renewable and sustainable, but that is only valid for sun
and wind power in the operation stage. The pre-stage and post-stage, also known as production and
deposition, are rarely taken into consideration. Fortunately there is a suitable tool for measuring and
comparing the effects of products and services from the start to the finish or from cradle to grave in
other words. This tool is called LCA, short for Life-cycle Assessment.
1.1 Disposition
This study begins with basic introduction and description about solar power, Gaia Solar, LCA
methodology and clarification of the studied system. This is intended to familiarize the reader with the
studied subject as well as how LCA is performed.
The next chapter defines the goal and scope of the study and introduces technical aspects most of
which have been described in the previous chapter. The study follows an escalating trend with
repeating titles in different chapters. The difference is that every chapter increases the depth and
complexity of presented information, eventually leading to the results and interpretation before
drawing conclusions at the end.
The study also includes a large Appendix chapter due to large amount of data from Ecoinvent LCA
database along with calculations, tables and metadata.
1 IEA, World Energy Outlook, http://www.iea.org/media/files/WEO2013_factsheets.pdf
2 ibid.

2
1.2 Background
Life-cycle Assessment is relatively new method compared to the total length of the industrialized era.
LCA identifies the environmental impact of different products, processes, services and the key stage
where they occur, for example production, usage or disposal3. The first popular LCA study was
conducted by Coca Cola back in 1969 which aimed to show and identify that all containers contributed
to an impact on the environment but with different magnitude4. By studying the obtained results Coca
Cola could execute an important strategic move and begin to recycle aluminum cans and thereby
lowering the impact of excavating and treating new aluminum compared to treating the used cans. The
Coca Cola LCA surely made and impact of the view on environmental impact assessment and process
identification amongst other companies by the cheer popularity of Coca Cola Company.
At that time and up to 1990, different approaches of identifying and solving problems amongst
companies production stages emerged but they focused and exposed different parts of the prediction
line in combination with having different aims and methods. In 1990 the Society on Environmental
Toxicology and Chemistry (SETAC) first used the term Life-cycle Assessment at a world workshop
and in 1993 the International Organization for Standardization begun working on standardization of
LCA which was complete in 1997 and is known as Life cycle Assessment – Principles and Framework
ISO 14040. Almost one decade later in 2006, another document was released, which was based on
several standardized documents, to result in ISO 14044 Life cycle Assessment – Requirements and
Guidelines5. These guidelines are vital for the correct approach that companies should make when
conducting a LCA in order to obtain a comparative and trustworthy study.
Many companies today are interested in conducting their own LCA’s and also demand that their
providers downstream do the same6. At the same time many customers upstream desire LCA results.
Not having a LCA could be a deal breaker for some customers depending on their niche. According to
EEA, Life cycle Assessment is not only a tool for minimizing the impact on the environment but also
for business to cut costs and become more compatible7.
LCA is not the only useful tool for making decisions regarding a product, service or process. There are
also economic and social analyses8 that need to be considered in order to whey all categories and make
a reasonable decision. Lowering the environmental impact as much as possible is perhaps possible for
a given product, service or process but the cost for such accomplishment can be great and irrational for
a company.
3Ecomii, Coca-Cola dilemma, 2014, retrieved 14 May 2014, <http://www.ecomii.com/building/coca-cola-
dilemma> 4 PE International Sustainability Performance, A brief history of life cycle assessment (LCA), 2014, retrieved 14
May 2014, <http://www.pe-international.com/company/newsroom/news-detail/article/a-brief-history-of-life-
cycle-assessment-lca/> 5 ibid.
6 EEA, Life cycle assessment – a guide to approaches, experiences and information sources, 2014, retrieved 14
May 2014, <http://www.epa.gov/nrmrl/std/lca/pdfs/Issue20report20No206.pdf> 7 Ibid., p. 9-11,
8 ISO 14 040, Environmental management - Life cycle assessment - Principles and framework, 2006, p. 9
3
1.3 Gaia Solar
Gaia Solar is a company located in Copenhagen, Denmark and was established in 19969. Gaia solar
produces several different solar panels but are famous for their flexibility and creativity when it comes
to satisfying customers. The company specifies in producing aesthetic solar panels that attract and
open opportunities for new and more attractive solutions. Highly customized aesthetical solar panels
can outcompete ordinary solar panels in many situations where aesthetics is of importance such as
urban buildings, hotels, offices, museums, schools and more. Gaia Solar have successfully overcome
the obstacle of dull and boring standard solar panels by offering the customer a wide variety of
modules with different shapes, colors other features.
Their products can also be installed in many ways enhancing the practical and aesthetical features.
Solar panels can be installed on façade or in facades, on roofs or integrated in the roofs, they can be
made for shading on windows and buss stations for example, and the solar panels can be ground
mounted as well.
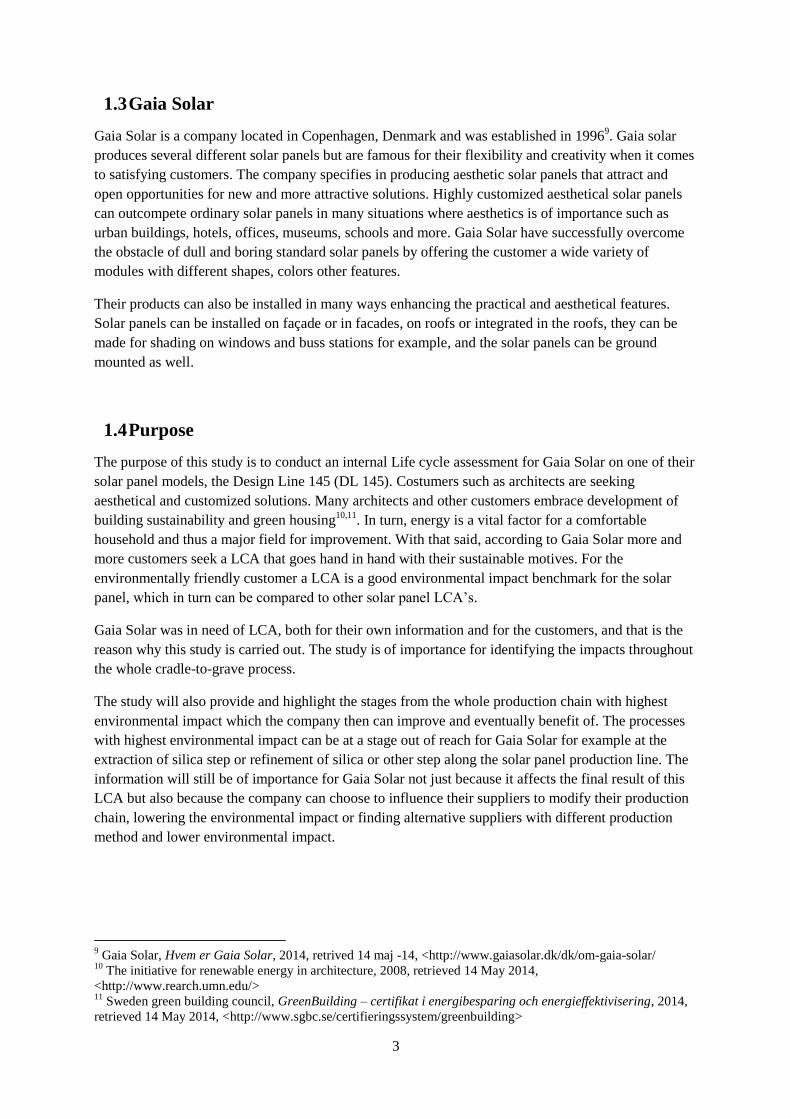
1.4 Purpose
The purpose of this study is to conduct an internal Life cycle assessment for Gaia Solar on one of their
solar panel models, the Design Line 145 (DL 145). Costumers such as architects are seeking
aesthetical and customized solutions. Many architects and other customers embrace development of
building sustainability and green housing10,11
. In turn, energy is a vital factor for a comfortable
household and thus a major field for improvement. With that said, according to Gaia Solar more and
more customers seek a LCA that goes hand in hand with their sustainable motives. For the
environmentally friendly customer a LCA is a good environmental impact benchmark for the solar
panel, which in turn can be compared to other solar panel LCA’s.
Gaia Solar was in need of LCA, both for their own information and for the customers, and that is the
reason why this study is carried out. The study is of importance for identifying the impacts throughout
the whole cradle-to-grave process.
The study will also provide and highlight the stages from the whole production chain with highest
environmental impact which the company then can improve and eventually benefit of. The processes
with highest environmental impact can be at a stage out of reach for Gaia Solar for example at the
extraction of silica step or refinement of silica or other step along the solar panel production line. The
information will still be of importance for Gaia Solar not just because it affects the final result of this
LCA but also because the company can choose to influence their suppliers to modify their production
chain, lowering the environmental impact or finding alternative suppliers with different production
method and lower environmental impact.
9 Gaia Solar, Hvem er Gaia Solar, 2014, retrived 14 maj -14, <http://www.gaiasolar.dk/dk/om-gaia-solar/
10 The initiative for renewable energy in architecture, 2008, retrieved 14 May 2014,
<http://www.rearch.umn.edu/> 11
Sweden green building council, GreenBuilding – certifikat i energibesparing och energieffektivisering, 2014,
retrieved 14 May 2014, <http://www.sgbc.se/certifieringssystem/greenbuilding>
4
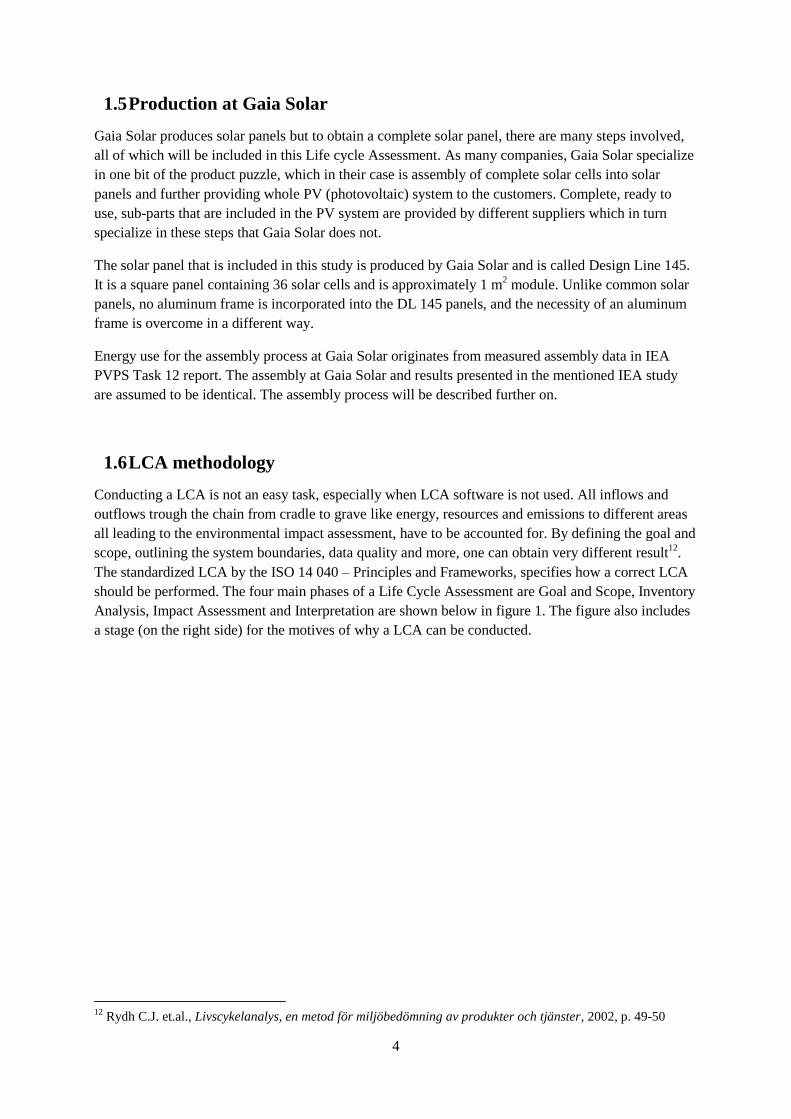
1.5 Production at Gaia Solar
Gaia Solar produces solar panels but to obtain a complete solar panel, there are many steps involved,
all of which will be included in this Life cycle Assessment. As many companies, Gaia Solar specialize
in one bit of the product puzzle, which in their case is assembly of complete solar cells into solar
panels and further providing whole PV (photovoltaic) system to the customers. Complete, ready to
use, sub-parts that are included in the PV system are provided by different suppliers which in turn
specialize in these steps that Gaia Solar does not.
The solar panel that is included in this study is produced by Gaia Solar and is called Design Line 145.
It is a square panel containing 36 solar cells and is approximately 1 m2 module. Unlike common solar
panels, no aluminum frame is incorporated into the DL 145 panels, and the necessity of an aluminum
frame is overcome in a different way.
Energy use for the assembly process at Gaia Solar originates from measured assembly data in IEA
PVPS Task 12 report. The assembly at Gaia Solar and results presented in the mentioned IEA study
are assumed to be identical. The assembly process will be described further on.
1.6 LCA methodology
Conducting a LCA is not an easy task, especially when LCA software is not used. All inflows and
outflows trough the chain from cradle to grave like energy, resources and emissions to different areas
all leading to the environmental impact assessment, have to be accounted for. By defining the goal and
scope, outlining the system boundaries, data quality and more, one can obtain very different result12
.
The standardized LCA by the ISO 14 040 – Principles and Frameworks, specifies how a correct LCA
should be performed. The four main phases of a Life Cycle Assessment are Goal and Scope, Inventory
Analysis, Impact Assessment and Interpretation are shown below in figure 1. The figure also includes
a stage (on the right side) for the motives of why a LCA can be conducted.
12
Rydh C.J. et.al., Livscykelanalys, en metod för miljöbedömning av produkter och tjänster, 2002, p. 49-50

5
Figure 1: A chart showing the different stages in a LCA and their interconnection. Source: ISO 14 040 -
Environmental Management - Life Cycle Assessment - Principles and Framework.
When conducting a LCA, specifically about solar power, there is another document of great
importance since it specifies guidelines for LCA for photovoltaic systems. The document is called
Methodology Guidelines on Life Cycle Assessment of Photovoltaic Electricity, Task 12, Subtask 20
Life cycle assessment, and is produced by IEA (International Energy Agency) PVPS (Photovoltaic
Power System Programme).
The following section, 1.6.1 – 1.6.5, only describes typical aspects and chapters that are often included
in a LCA. It also describes the methodology of these aspects but does not actually present them. Goal
and Scope methodology is presented in section 1.6.2 but the actual Goal and Scope definition for this
study is presented in section 2. The same is valid for the remaining sections, 1.6.3 – 1.6.5, but their
respective actual definition and presentation sections are chapter 3, 4 and 5.
1.6.1 IEA-PVPS-TASK 12 Methodology Guidelines on Life Cycle Assessment of
Photovoltaic Electricity
The PVPS (Photovoltaic Power System Programme) is a part of IEA (International Energy Agency)13
.
PVPS is included in various projects concerning the conversion of solar energy to electricity. Their
main purpose is as quoted:
“to enhance the international collaboration efforts which accelerate the development and deployment
of photovoltaic solar energy as a significant and sustainable renewable energy option”.
It contains methodology guidelines for conducting a Life Cycle Inventory (LCI) and Life Cycle
Assessment (LCA) for grid-connected photovoltaic systems, which is exactly what this study for Gaia
13
Fthenakis, V. et. al., IEA – PVPS – Task 12, Methodology Guidelines on Life Cycle Assessment of
Photovoltaic Electricity, 2011, p. i

6
Solar is about. The document clearly states that it is based on ISO 14 040 and ISO 14 044 guidelines
which still apply to LCA concerning photovoltaic electricity. The document contains specific
recommendations for PV, which otherwise conducted only by ISO 14 040 and ISO 14 044 would give
the author of the LCA large room for own assumptions and system boundaries and this in turn will
lead to widely varying results. It can be said that IEA PVPS is a harmonization PV LCA where the
result of various LCA studies can be reasonably compared with each other. The report presents
guidelines for the following aspects14
:
life time of a PV module
structure
cables
invertors
irradiation
performance ratio
degradation
system boundaries
function unit
impact categories
energy pay-back time
CO2 migration
Energy mix
All the recommendations will be considered in this study as far as it is possible. Assumptions stated in
the document Task 12, Subtask 20 will also be taken into account unless real data is available.
1.6.2 Goal and Scope
This section only describes typical aspects that are often included in the Goal and Sope of a LCA. The
actual definition of Goal and Scope is presented further on in section 2.
The goal should describe the following15
:
why the study is carried out
what the results will be used for
for whom the results are intended
There can be for several reasons for conducting a LCA like strategic planning for product
development, necessity for different labeling, satisfying customers and comparison of products. The
definition of the goal also affects the depth and width of the scope meaning, which steps need to be
included to fulfill the goal of the study16
.
The scope is clarification of what is included in the study to fulfill the goal and what is not. It
describes the width and depth of the study. The scope includes titles like:
14
ibid., chapter 3 15
Rydh, J.C. et.al., op.cit. p 49-50 16
ISO 14 044, Environmental management – Life cycle assessment – requirements and guidelines, 2006, p. 11

7
Initial flowchart is a helpful way to visualize the simplified system that is studied.
Options to model defines whish product or products are studied and if the LCA is a stand-alone (no
comparison intended) or a comparative system. The later requires technical data and methodology to
ensure that a comparison can be made or even a framework for common products17
.
Function Unit (FU) is the reference unit that enables studies to be compared. The unit is a quantified
measure of the system’s performance or service. All flows in the flowchart, which in turn represent the
stages of production that the system requires in order to produce the product or service, are also
quantified and presented in that unit. The function unit is also of importance when preforming a
comparative LCA18
. Paint, for example, has a covering function which can be compared with other
alternative methods to achieve the same service, to cover. These can be spray, sticker, metal sheet and
more, which all have the same function and can thus be compared. The function unit for such a
purpose is for example 1m2 of covered wall. There can also be a secondary function as well. For
instance paint also result in good aesthetics19
.
The Reference flow in the case of painting can be a house of certain dimensions. For PV studies,
reference flows refer to the size of the system that quantifies the functional unit20
.
Impact Categories describe what environment impact sectors should be studied in the LCA.
According to the ISO standardized documents, it should include:
human health
resource use
ecological consequences
These are in turn more specialized and contain many more subcategories. The subcategories are for
instance acidification, eutrophication, toxic compounds, ozone depletion, resource depletion and
more21
. The categories will be fully reported further in the section 2, Goal and Scope.
Elementary Flows describes the flows within the system based on the different impact categories. For
example one should be able to see what amount of CO2-equivalent is released between two steps in
the process in order to understand the contribution to Global Warming Potential (GWP) from that step
and also the lifetime of the gases in the atmosphere. Obviously there are several compounds that
contribute to the category GWP like methane, carbon dioxide, carbon monoxide, nitrous oxide and
chlorofluorocarbon (CH4, CO2, CO, N2O, CFC). All of these are converted to one main compound that
represents the specific impact category, in this case Global Warming Potential. In another impact
category like acidification there are other contributing compounds that are in turn converted to the
representative compound for that category. The conversion step is based on the effect of one
compound on the category in relation to the reference compound, also called equivalent22
. CH4 is thus
converted to CO2-equivalents and to account for its greater effect on the environment it is multiplied
by 25. Scientific experiments determine that CH4 is 25 times stronger greenhouse gas than CO2 and
17
Baumann, H. et.al., The Hitch Hikers Guide to LCA, an orientation in life cycle assessment methodology and
application, 2004, p.75 18
ibid., p. 33 19
Prof. Joillet, O., et.al., Science network, Life cycle assessment – lecture 2,
www.sciencenetwork.com/lca/lesson_2.pps 20
Jungbluth, N., et.al., Ecoinvent- report No.6, part XII, Swiss center for Life Cycle Inventories, Dübendorf,
CH, 2009, p. 48 21
Baumann, H. et.al., op.cit., p.139 22
ibid., p. 140

8
there are likewise conversion numbers for all other compounds related to their respective
representative compound of a certain category23
.
System Boundaries determines the processes that should be included in the studied system. The
boundaries are for practical reason so that the project doesn’t get carried away in calculating infinitive
amount of processes, but only the relevant ones with highest importance to the product. The most
correct LCA will be the one which includes all steps and processes of the product and thus do not have
boundaries at all, but that is impossible to conduct24
. System boundaries need to be described in
different levels such as25
:
Boundaries to natural systems
Boundaries to geographical systems
Time boundaries
Boundaries relative to other products
Cut-off Criteria describes rules and assumptions that could be made when dealing with the inflows to
the system and what and how much can be cut off from the system. EPD (Environmental Product
Declaration) states that most often all flow-data are included if information is available but if
necessary (no available data) there are small margins to cut but the excluded parts still need to be
reported and clearly stated that they are cut-off. Generally 1% of the total environmental impact, mass
or energy can be cut off. The cut-off should also be motivated with expertise judgment and be
justified. This means that the results must first be obtained and then to apply cut-off method26
.
Data Quality is according to ISO 14 044 meant to be specified so that the goal and scope are met. It
also states that data quality requirements in a LCA aimed to the public should be of greatest quality
and include every step stated by ISO 14 044 section 4.2.3.6.227
. The table below presents and
categorizes these steps.
Table 1: Data quality requirement steps presented by categories. Source: Rhyd, C.J, et.at., 2002
Relevance Reliability Accessibility
Time-related coverage Precision Reproducibility
Geographical coverage Consistency Consistency
Technology coverage
Completeness
Representativeness
Furthermore the documentation of both qualitative and quantitative data in the inventory is vital for
the assessment of the data quality28
. For further description of the presented steps in the table above,
see the ISO-document, ISO 14 044, 2006 environmental management – life cycle assessment –
requirements and guidelines, section 4.2.3.6.2.
23
Climate change connection, CO2-equivalents, 2009, retrieved 14 May 2014,
<http://www.climatechangeconnection.org/emissions/CO2_equivalents.htm> 24
Rydh, C.J., et.al., op.cit., p 53 25
Baumann, H. et.al., op.cit., p. 79 26
EPD, supporting annexes for environmental product declaration, version 1, 2008, retrieved 14 May 2014,
<http://www.environdec.com/Documents/GPI/EPD_annexes_080229.pdf, sid 7> 27
ISO 14 044, op.cit., p. 9-10 28
Rydh, C.J., et.al., op.cit., p. 62

9
Allocation is also an important step in the LCA and can have big impact on the results29
. When it
comes to determining the environmental impact of a certain product, it is based on all consequences on
material and energy input in all stages of the products lifecycle. It seems quite simple but that is the
case for a product chain that specifically and only produces one product along the entire chain. In most
cases, logically, there are byproduct and/or other products depending on the point of view meaning
that if one produces wine glass, the main product is just that and the left over scraps of the glass
process are the waste or byproduct. That is certainly the case if the byproducts are scraped/deposited
or recycled, but if one would sell the scraps to a company manufacturing fiber glass insulation then the
scrap suddenly is assumed to be another product and function beside the wine glass. In that way the
glass scraps replace the production of glass scraps at some other plant and thus lower the overall
environmental impact30
.
In long production chains of several refining methods, there is high possibility of several products
being formed and here is where allocation is a convenient tool to apportion the environmental burden
of one product amongst the other products from the same chain31
.
There are different types of allocation that can be applied to a LCA study but it all depends on what
type of LCA is conducted and thus links back to the goal of the LCA32
. According to ISO 14 041
allocation should be avoided by increased level of detail of the model or expanding the system to
include all products. Otherwise, if allocation is inevitable, the environmental load should be
apportioned among the systems different functions33
.
Major Assumptions should be described and explained in the Goal and Scope phase and the same
goes to the Limitations. Big assumptions occur when for example system expansions are defined and
limitation are for example if the study is valid for any location on the planet or not, or if the study is
valid for a certain time period34
.
1.6.3 Life cycle inventory (LCI)
During the inventory analysis stage of the LCA, all inflows such as energy, water, material, fuels and
more, are identified for the studied system during its lifetime. All the flows leaving the system such as
exhaust to air, water and land, product and byproducts are also identified35
. These in- and outflows
from every stream of every part along the production chain, within the defined system, are thereby
quantified. The data is vital for the next stage of the LCA which is Impact Assessment36
.
In order to obtain this data, every flow within the system has to be measured, either directly or/and the
use of online LCA databases. There are many databases for LCA and one of these, which is also in
compliance with IEA PVPS Task-12, is Ecoinvent.
29
Baumann H. et al., op.cit., p. 87 30
ibid., p. 86 31
ibid., p. 83 32
ibid., p. 88 33
ISO 14 041, Environmental management- Life cycle assessment- Goal and scope definition and inventory
analysis, p. 11 34
ibid., p. 92 35
STONE, stonecourses, Life cycle inventory analysis, retrieved 14 May 2014,
<http://www.stonecourses.net/environment/invlca.html> 36
ibid.

10
The collected data is then sorted into categories which are at a later stage sorted out as environmental
impact categories37
. The collected data is then calculated per function unit.
1.6.4 Impact Assessment (Results)
This section deals with the data from the inventory in several ways. The raw data is sorted in different
environmental impact categories with the purpose to enable a better oversight and easier assess which
emissions contribute to which environmental categories like acidification, global warming potential,
ozone depletion potential and more38,39
. Often the inventory data parameters can be huge, from 50 to
200 parameters, which make it hard to comprehend all the results. By implementing classification the
raw data form the inventory analysis is sorted out in up to 15 categories enabling a clearer oversight
and easier comprehension of the results40
. Because of the lack of consensus on which categories
should be used, there are no certain mandatory categories but generally the impact assessment includes
categories such as resource consumption, effects on ecology and human health41
. Furthermore these
categories consist of other categories (may be seen as subcategories to the main three categories) that
in turn describe the data in more detailed impacts categories. The process is shown in the image
below!
Figure 2: Description of the process of classifying elementary floes from the system into impact categories.
Source http://www.thefactsabout.co.uk/content.aspx?pageid=200
37
Rydh et.al., op.cit., p. 63 38
Baumann H. et al., op.cit., p. 129 39
STONE, stonecourse, Life cycle impact assessment, retrieved 14 May 2014,
<http://www.stonecourses.net/environment/impactlca.html> 40
Baumann H. et.al., op.cit., p.129 41
STONE, stonecourse, Life cycle impact assessment, retrieved 14 May 2014,
<http://www.stonecourses.net/environment/impactlca.html>

11
It should also be mentioned that an emission compound can be included on several categories because
of its tendency to affect several environmental fields. For example the emission of nitrogen oxides can
affect environmental categories such as acidification, global warming potential and ozone layer
depletion42
.
After the elementary flow data is sorted in different categories, the data is then translated into one
single compound representing the whole impact category. This is called characterisation. This means
that all the compounds have to be adjusted so that they can be presented in the form of the main
characterization factor or equivalents as mentioned earlier. For instance, methane (CH4) which is
included in global warming potential category is converted to the characterization equivalent for this
category carbon dioxide (CO2). Since methane has 21 times stronger global warming potential then
carbon dioxide, it means that the amount of methane must be multiplied by 21 in order to be presented
in carbon dioxide equivalent. The same process is applied to all compounds in all categories.
Weighing is also a method to assess the potential impact. It is meant to aggregate all result into one
final presentable number. This method is subjective and there are no agreements on weighing methods
but there are examples of methods often used. Because weighing is an subjective method it should
only be used in special cases when it has to be43
. Ecoinvent data includes different impact methods,
which will be discussed further on, where data is weighed for certain impact categories. Except
weighing conducted by these methods, no other weighing will be made in this study.
1.6.5 Interpretation and discussion
The interpretation section is meant to analyze the results of the LCA and also to explain the limitations
as well as making conclusions and recommendations44
. The results need to be presented in a complete
and consistent manner based on the goal and scope of the study45
. An important interpretation for PV
systems is energy pay-back time which is included in IEA PVPS Task 12 Subtask 20 guidelines46
.
Further interpretations of the results and their impacts will be presented in section 5. Interpretation
regarding the extended lifetime of the PV system, a scenario for thinner solar cells and the spared
greenhouse gas emission due to installation of a PV system, will also be presented further on.
1.7 Manufacturing of crystalline silicon solar panels and parts
The production of a PV system is quite extensive and consists of many sub-products such as solar
cells, inverters, glass etc. The including parts of a PV system are described in the following sections.
42
Rhyd, C.J., et.al., op.cit., p. 79 43
ibid., p. 80 44
Baumann H. et al., op.cit., p. 175-177 45
World steel association, Interpretations – Objectives, 2012, retrieved 14 May 2014,
<http://www.steeluniversity.org/content/html/eng/default.asp?catid=146&pageid=2081271783> 46
Fthenakis, V. et. al., p. 8

12
1.7.1 Solar cells
Solar cells are the most vital part of a solar panel since they convert the incoming solar irradiance to
electricity. There are two kinds of crystalline silicon cells, mono-crystalline and poly-crystalline also
referred to as single-crystalline (sc-Si) and multi-crystalline (mc-Si), but the one used by Gaia Solar in
the solar panel of interest are mono-crystalline solar cells47
. The process of acquiring a final functional
solar cell is vast and very complicated. A flowchart of this process will be presented further on in the
study.
1.7.2 Inverters
The main purpose of the inverter is to convert incoming direct current (DC) electricity from the solar
panels into the more commonly used alternating current (AC) used in households and the grid48
. The
inverter also synchronizes the voltage and transforms it to a proper amount such as 230 V in
households49
. Another purpose, in more advanced inverters, is to track and utilize the maximum
amount of power from the solar panel by adjusting to the voltage and current input which can vary
with time50
. The power output will thus be optimal. The size of the inverters also depends on the load,
meaning that invertor for 3000Wp solar installation will be smaller than an installation of 50 000Wp.
There are also micro-inverters that are attached on every single PV panel which enables independence
from a whole string of series connected PV panels. This is beneficial because often series connected
panels to a central invertor can be disrupted/cut by partial shading or other external cause, leading to
deactivation of the whole series connected string51
.
1.7.3 Electric installation
The electric installation enables the flow of converted electricity to be utilized and distributed to the
grid. It is included in the panels in form of junction box (connector box output from the solar cells)
which enables easy connection on the back side of the panels, and cables witch are connected to the
junction box in order to connect a solar array52
.
The electric installation also includes meters and cables to the different electronic parts of the PV
system. It also includes a lightning arrester which protects the PV system from lightning53
.
The junction box is a PV connector system that links the cables from one or more PV panels or PV
panel strings, to the invertor. It has both functional and aesthetic properties such as organizing input
47
Jungbluth, N., et.al., op.cit., p. ii. 48
ABB, Solar inverters, 2014, retrieved 14 May 2014, <http://www.abb.com/solarinverters> 49
Jungbluth, N., et.al., op.cit., p. 101 50
ABB, op.cit., 51
Energy Saving Trust, Solar inverters, 2014, retrieved 14 May 2014,
<http://www.energysavingtrust.org.uk/Generating-energy/Choosing-a-renewable-technology/Solar-panels-
PV/Solar-inverters> 52
Jungbluth, N., et.al., op.cit., p. 110 53
ibid.

13
cables from different panels/panel string, enables for an easier PV panel exchange or connection54
. The
junction box also disables the reverse current at dark conditions and thus protects the solar panels55
.
1.7.4 Slanted roof PV structure installation
PV panels can be mounted in different places and the technique for mounting differs. For example a
vertical building integrated PV system is not the same as a ground mounted on and even a roof
mounted one. This LCA study is conducted on the assumption that the PV system is mounted on a
slanted roof56
of a one floor villa.
To be able to attach the PV panels to the roof, there has to be a structure in between to hold them
firmly connected. This structure is composed of aluminum bars and clamps as well as steel screws and
bolts57
.
1.7.5 Encapsulate
Encapsulate for the solar cells, and as a part of the solar panel, contributes to many benefits.
Encapsulate is the layer which laminates the solar cells and prevents current leakage, acts as a buffer
between the front glass and the solar cells and reduces stress from the glass cover to the solar cells.
Not only does it prevent the solar cells from breaking but it also keeps them in place and eliminates
the risk of contact separation between the solar cells58
. Logically an additional layer between the solar
cells and the incoming solar irradiance, results in reduced efficiency, but the properties of the thin
layer of encapsulate materials minimizes that impact.
1.7.6 Back glass
Back glass is used instead of aluminum frame on some panels such as Gaia Solar’s Design Line 145.
The glass is ordinary float glass, not coated, and along with the front glass can enable a sandwich type
layout which is stable and eliminates the necessity of an aluminum frame.
1.7.7 Front glass
Glass covers provide structural and protective properties for the solar cells and the frame itself.
Because the glass is between the electricity producing solar cells and the incoming solar irradiance,
they are designed and manufactured in such a way that as much as possible incoming light is passed
through the glass cover. There are several different types of glass covers, all designed to optimally
contribute to higher electricity production and to suit different customers and different PV
54
ELS Spelsberg, Connecting System For Photovoltaics, 2009/2010. 55
DuPont, Cost-effective photovoltaic junction box housings, 2014, retrieved 14 May 2014,
<http://www.dupont.com/products-and-services/plastics-polymers-resins/thermoplastics/case-studies/pv-
junction-box-housings.html> 56
Jungbluth, N., et.al., op.cit., p. 12 57
Gaia Solar, mounting structure. 58
STR Holdings Inc, STR protected benefits, 2014, retrieved 14 May 2014, < http://www.strsolar.com/str-
protected/benefits/>

14
technologies. Important properties of the glass cover are: high solar energy transmittance and low iron
content in the glass, anti-reflective coating (AR-coating) and other techniques to reduce reflectance,
increase consistency and durability throughout the solar panel lifetime59
. The low iron, highly
transparent front glass is often treated and coated in order to reduce reflectance. The coating is a whole
other process then the front glass, and is presented separately in this study.
Figure 3: Profile illustration how and what parts are combined in a DL 145 crystalline silicon solar panel.
Source: Gaia Solar documents.
1.7.8 Protective back sheet (PBS)
The back sheet of the panel plays a huge role in the long term performance of the solar panel. It
protects the solar panel from harsh environments during its lifetime, moisture and is an electronic
isolator. At the same time the PBS is durable, UV stabile, light and thin60
, all of these properties
contribute to a better solar panel.
1.7.9 Anti-reflective coating (AR-coating)
AR-coating has many applications where reflection is undesirable such as glasses, screens and solar
panels. The coating reduced reflection of sunlight and instead allows it to pass through, resulting in
higher energy output from the solar panel61
. A study by NREL (National Renewable Energy Lab) on
AR-coatings resulted in an overall performance increase, of a PV module, by up to 3,5-5% under STC
(standard testing conditions)62
. It also acts as a protective layer for the frontal glass because of its
properties, allowing the AR-coating to withstand harsh weather and endure during the lifetime of the
PV panel.
59
NSG Group, Pilkington group limited, Solar glass for solar panels, 2013, retrieved 14 May 2014,
<http://www.pilkington.com/products/bp/bybenefit/solarenergy/home.htm> 60
Madico, Quality and the Environment, 2014, retrieved 14 May 2014,
<http://www.madico.com/about/manufacturing/quality/> 61
Vindico, PHOTOVOLTAIC GLASS STUDY, retrieved 14 May 2014,
<http://www.vindico.info/PDF/PP%20Vindico%20PV+(v5).pdf> 62
Bunea, G., et.al., Sunpower, Performance and reliability of modules with anti-reflective coated glass, 2010, p.
10

15
Figure 4: A possible overlay of the PV system mounted on a slanted roof. The image does not represent the
electronic schematics and two cable lines to all components as it should be.

16
17
2 Goal and Scope
The following sections in this chapter present the actual definitions for this study, unlike section 1.6
where only the methodology was presented.
2.1 Goal
The goal of this study is to determine the environmental impact of a PV system, consisting of solar
panels of the model DL 145, and to determine the energy payback time. The reason for conducting this
LCA is to bring awareness and knowledge to the company Gaia Solar, a producer of PV panels, of
which stages along the cradle to grave chain of the studied system has significant environmental
impact and to serve as basis for strategic planning for lowering the environmental impact by making
processes more effective or/and to search for alternative suppliers and processes. The study will also
serve as information to the interested customers but the LCA is not meant to be public.
The study is performed in accordance with International Energy Agency (IEA) Photovoltaic Power
System Programe (PVPS), Task 12, Subtask 20, and will thus be comparable to other LCA with the
same methodology, giving awareness to Gaia Solar how their system preforms compared to others.
This study is also elaborated according to ISO 14 040 and ISO 14 044 as far as possible.
2.2 Scope
The scope section consisted of several different sections which are presented below.
2.2.1 Description of the system
The studied PV system is defined as 3 000 Wp (watt peak) peak power, consisting of monocrystalline
panels with panel efficiency of 14,20 % and system efficiency of 13,28%, installed on a slanted roof in
Copenhagen, Denmark and is connected to the grid during 30 years. Additional results will be
included for a lifetime scenario of 40 years. There will also be comparisons with thinner solar cells.
The span of the whole system is from cradle to grave.
The reason for including 40 years lifetime in the final presentations is due to the estimated lifetime of
the DL 145 solar panel by Gaia Solar. The lifetime of the PV system is stated to be 30-40 years. It is
important to include such results even though they are not in compliance with IEA PVPS, Task 12
standards.
The PV system is assumed to be installed on a single floor house within 50 km from Gaia Solar in
Copenhagen, Denmark. This is of importance for the cable length and the irradiation used in this
study. The irradiation at the location of the house should correspond to irradiation obtained at Gaia

18
Solar in order to be representative. Solar maps of Denmark63
shows the irradiation variation
throughout the country and is the basis for the assumed distance.
This LCA study will use Ecoinvent data as a foundation for the production of the parts and material
included in the studied PV system. Additional data from IEA PVPS Task 12 is used for the assembly
and testing of the PV panels and recycling data is obtained from a LCA of PV panel recycling
compavy. The properties of the solar panel will be customized, compared to Ecoinvent panels, since
the panels, DL 145, used in this study, differ somewhat from ordinary standard metal framed solar
panels. Ecoinvent data will be adjusted in order to represent the real case scenario. This involves,
extrapolation of data in order to represent a 3 000 Wp PV system as close as possible to the real
systems installed by Gaia Solar.
2.2.2 Degradation of the system
Solar panels are not eternal, and when exposed to the elements for long periods of time they perform
more and more poorly and resulting in lower energy output with time. There are many factors
involved in the degradation such as temperature differences and exposure to harsh weather64
of any
kind, which affect many of the components.
Many reports are published on the degradation ratio of different kind of solar panels and for the
monocrystalline solar panels in this study a degradation factor of 0,5% per year is assumed according
to the producers Gaia Solar. This value is general for monocrystalline solar panels and confirmed by
NERL65
in their report Photovoltaic Degradation Rates – An Analytical Review. This is also a standard
value used when actual degradation values are absent66
.
2.2.3 Performance ratio (PR)
The performance ratio determines the percentage of real converted solar energy from the theoretically
possible under standard testing conditions67
. Logically an installed solar panel does not operate in
standard testing conditions like in the laboratory and will thus perform differently. PR is affected by
many factors such as temperature of the PV module, conduction losses, efficiency factor of the PV
module, the measurement gage and more. Below is the formula for calculation of the PR if no official
PR value id available.
(1)
63
European commission, Global irradiation and solar electricity potential, Denmark, retrieved 14 May 2014,
http://re.jrc.ec.europa.eu/pvgis/cmaps/eu_cmsaf_opt/G_opt_DK.pdf 64
Energy informative, The real lifespan of a solar system, 2014, retrieved 14 May 2014,
<http://energyinformative.org/lifespan-solar-panels/> 65
http://www.nrel.gov/docs/fy12osti/51664.pdf 66
Fthenakis, V. et. al., op.cit., p. 4 67
SMA, Performance ration – quality factor for PV plant, 2010, retrieved 14 May 2014,
<http://files.sma.de/dl/7680/Perfratio-UEN100810.pdf>

19
Measured data for the output was supplied by Gaia Solar, corresponding to 925 kWh/Wp and a site
specific irradiation data68
of 1150 kWh result in a performance ratio of 80,4 %. This is for a whole PV
system including losses in the inverter for instance. A PV system will have losses in the inverter
(DC/AC) and a good inverter with efficiency above 90%, as the case in this study (93,5%), will result
in a total PR of 0,8 for the PV system69,70
. Thus an overall PR of 80% is used in this study.
2.2.4 Ecoinvent methodology
Available data on the Ecoinvent database allows for a vast choice between processes and sub
processes. Data for a whole PV system is available if needed but since that PV system differs from the
one used in this LCA, there has to be an alternative choice to just using that data. Otherwise parts and
processes that are not included in this LCA will be presented anyway, neglecting the measures and
parts that differ.
Even though the Ecoinvent data for a whole PV system is not relevant for this study, it can be used for
the processes that make up the system. For instance the glass production, anti-reflective coating,
insulator and monocrystalline solar cells are all relevant for this LCA and by choosing only the
relevant processes combined with additional own data, a new scenario will be obtained reflecting the
conditions for Gaia Solar better.
The assembly and testing of the PV modules are both conducted at Gaia Solar. LCA data is collected
for all steps presented in figure 5 below in order to achieve the goal and scope of the study.
Figure 5: Principle flowchart showing the included processes in this LCA.
68
European commission, op.cit., 69
Renewable energy world, BOS Series: Your new solar array. 2012, retrieved 14 May 2014,
<http://www.renewableenergyworld.com/rea/news/article/2012/04/your-new-solar-array-actual-performance-
may-vary> 70
SMA, op.cit., p. 2
Inverter 2400 W
Encapsulate Solar cells Front glass Back glass
Assembly
Testing
Mounting
Use
Disposal/Recycling
Protective back sheet
AR-coating Electric
installation Mounting
parts

20
2.2.5 System boundaries
Below is a simplified flowchart of the process. Note that the chain in figure 6, from extraction of
resources to deposition/waste, is valid for all resources such as iron, copper, etc., and thus for all sub-
products. It is also valid for all impact categories, trough emissions from every stage.
The final boundary is at the connection point to the local grid. According to IEA PVPS Task 12, the
final boundary should not be any other and must include meters and a full electric system. With that
said, the PV system boundary cannot end at, for instance, the solar panels.
Figure 6: Simplified flowchart of the studied system with included energy-, material- and emission flow
2.2.5.1 PV system parameters
Below are presented few basic parameters used in the calculations of this study. Parameters were
obtained from Gaia Solar documents, IEA PVPS Task 12 directives and own calculations based on
provided parameters.

21
Table 2: PV system parameters.
Installed effect 3 000 Wp
Panel capacity 145 Wp
Panels amount 20,70
Panel efficiency 14,20%
Cells per panel 36
Cells, amount 745,20
Inverter efficiency 93,5%
PV system efficiency 13,28%
Specific annual yield 925 Wh/Wp
Degradation rate 0,5%/year
Lifetime expectancy 30 years
2.2.5.2 Technological coverage
Conclusion, based on PV evolution charts, show that the PV technology is old (>37 years since the
first solar panel71
) but small efficiency advances are made regularly. A solar cell diagram from NREL
(National Renewable Energy Laboratory) shows that the monocrystalline solar cells have not
developed in efficiency more than 4% since 199572
. It is a reasonable conclusion that the
monocrystalline solar cells technology, as it is today, will not increase noticeably in the near future.
Other solar technologies may on the other hand do so.
On the other hand, new factories are constructed to supply the demand for solar cells and they may be
more efficient than the one in Ecoinvent from 2005. Production processes and more efficient plants are
with highest certainty available today, compared to 2005, but unfortunately such data is not available
as a basis for this study. The data will thus be exaggerated compared to a brand new plant and
improved processes but to what degree is uncertain.
Additional information, based on scientific studies, will be included anyway in a comparison diagram
in the result section. Comparison data on the thickness of the solar cells was available and thus own
calculations were applied to Ecoinvent data in order to simulate the new, actual thickness, of the solar
cells. All results, except the comparison chart, will still be based on Ecoinvent data of solar cells, since
it is based on actual measurement and impact results, but the comparison chart will be more
representative for the real case scenario. This will be discussed further on in the study.
2.2.5.3 Geographical coverage
The Ecoinvent data is gathered from different parts of the world where the majority is from European
sites. The study is made according to Danish conditions (local) regarding energy use for assembly and
solar irradiance which is in compliance with the IEA PVPS Task 12. All inputs and outputs to and
from the system are included despite different location. There are thus no geographical boundaries set.
71
exploringgreentechnology.com, History of solar energy, 2014, retrieved 14 May 2014,
<http://exploringgreentechnology.com/solar-energy/history-of-solar-energy/> 72
SolarContact, How to compare solar panels, 2014, retrieved 14 May 2014,
<http://www.solarcontact.com/solar-panels/types/solar-panel-efficiency>

22
2.2.5.4 Time coverage
Data is gathered mostly from the Ecoinvent data base. The age of this data ranges from 2002 to 2008
where the majority of the data is from 2005. See appendix 4 for further information regarding
inventory date.
2.2.5.5 Upstream processes
Upstream data includes processes on a global scale and thus different energy mixes are included in the
inventory73
. Upstream data includes:
Extraction of materials
Refining of material
Production of components
Assembly of PV panels
Transportation for and between all mentioned stages
2.2.5.6 Downstream processes
All processes after the PV system have reached its lifetime end and thus out of service.
Deposition/recycling
Transportation
2.2.5.7 User phase
All the processes between installation and disassembling.
Service and parts exchange
Electricity provided to the household or/and grid
2.2.5.8 Excluded phases
Construction of buildings and machinery used for making the PV system
Deviation from normal operation and extraordinary events
73
Jungbluth, N., et.al., op.cit., p. ii
23
2.3 Function unit (FU)
The function unit is 1 kWh net of electrical energy delivered to the grid, generated from solar power
by the PV system.
2.4 Reference flow
The reference flow is a PV system of 3 000 Wp, from cradle to grave, containing all parts of a
functional PV system and panels of model DL 145 with an effect of 145Wp.
PV system studies are encouraged to use the same reference flow as IEA PVPS Task 12 states. Even
the Ecoinvent data is assumed to have a reference system of 3 000 Wp. The fact that PV systems in
Denmark today have to be under 1 000 Wp, due to legislations, does not conflict with the studies
3 000 Wp system since the data and size are relative.
2.5 Secondary function
Aesthetics is one of the niches of the company Gaia Solar, resulting in outstanding design features of
solar panels. A secondary function of this LCA might thus be to evaluate the aesthetic function gained
by installing this PV system but sense such assumptions and conclusions are subjective to their nature,
it is excluded as a secondary function. There is thus no secondary function.
2.6 Allocation
Because Ecoinvent data is used for whole separate processes such as invertor, low iron glass, wafer
sawing etc. the necessary allocations are already conducted in the sub processes. This is of great
importance since the production of one stage of solar cells is formation of MG-silicone (Metallurgical
Grade silicone). The majority this compound is not used for solar grade silicon but instead for other
processes such as aluminum compounds (50% of total MG-silicone), silicones/plastics (40% of the
total MG-silicone) and only 4% for the next step in the solar cell manufacturing74
.
No further allocation is necessary during the assembly stage at Gaia Solar since the only product is
solar panels.
Allocations are made on the recycling of the glass and aluminum roof installation. This is described
further on in the study and calculations are presented in Appendix 1.
74
Jungbluth, N., et.al., op.cit., p. 16
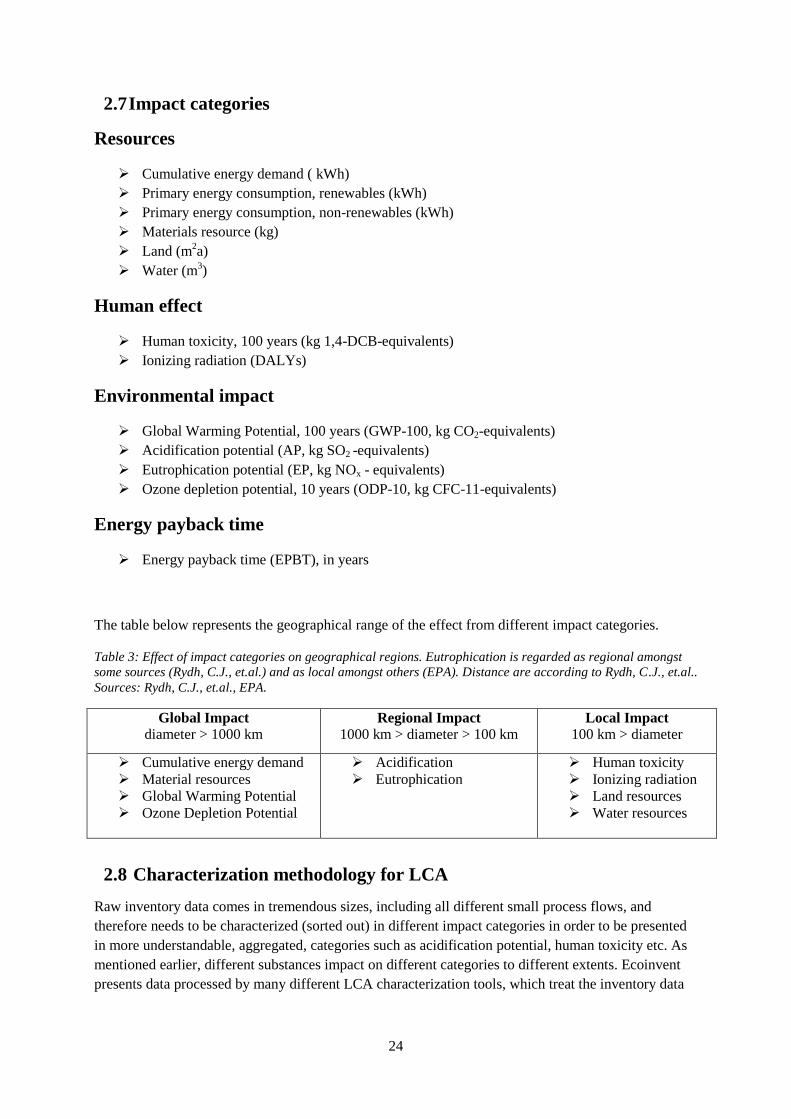
24
2.7 Impact categories
Resources
Cumulative energy demand ( kWh)
Primary energy consumption, renewables (kWh)
Primary energy consumption, non-renewables (kWh)
Materials resource (kg)
Land (m2a)
Water (m3)
Human effect
Human toxicity, 100 years (kg 1,4-DCB-equivalents)
Ionizing radiation (DALYs)
Environmental impact
Global Warming Potential, 100 years (GWP-100, kg CO2-equivalents)
Acidification potential (AP, kg SO2 -equivalents)
Eutrophication potential (EP, kg NOx - equivalents)
Ozone depletion potential, 10 years (ODP-10, kg CFC-11-equivalents)
Energy payback time
Energy payback time (EPBT), in years
The table below represents the geographical range of the effect from different impact categories.
Table 3: Effect of impact categories on geographical regions. Eutrophication is regarded as regional amongst
some sources (Rydh, C.J., et.al.) and as local amongst others (EPA). Distance are according to Rydh, C.J., et.al..
Sources: Rydh, C.J., et.al., EPA.
Global Impact
diameter > 1000 km Regional Impact
1000 km > diameter > 100 km Local Impact
100 km > diameter
Cumulative energy demand
Material resources
Global Warming Potential
Ozone Depletion Potential
Acidification
Eutrophication
Human toxicity
Ionizing radiation
Land resources
Water resources
2.8 Characterization methodology for LCA
Raw inventory data comes in tremendous sizes, including all different small process flows, and
therefore needs to be characterized (sorted out) in different impact categories in order to be presented
in more understandable, aggregated, categories such as acidification potential, human toxicity etc. As
mentioned earlier, different substances impact on different categories to different extents. Ecoinvent
presents data processed by many different LCA characterization tools, which treat the inventory data

25
different, based on the methodology of the LCA tools75
. A few of these LCA characterization tools
that are used in this study are described in the next section.
Often, one impact category is presented in several “time periods” because substances have varying
lifetime in different environments. For instance, if substance A contributes to global warming and has
a lifetime of 50 years it would be unwise and not representative if the category Global Warming
Potential 500 years is chosen, since the substance would be absent. A suitable representation for that
substance would instead be Global Warming Potential 20 years. The same logic is valid for rest of the
impact categories.
In order to be as representative as possible, the time periods of the categories with the highest result
are included in this study. One exception is Global Warming Potential which is 100 years and not the
lowest parameter, 20 years. This is due to directions from IEA PVPS Task 12 which state that global
warming potential should be 100 years.
2.8.1 EDIP (Environmental Design of Industrial Products)
EDIP is a LCA tool determining three impact categories: environmental impact, resource consumption
and working environment. The method was developed in Denmark by the Danish Technical
University, Environmental Protection Agency of Denmark, Confederation of Danish Industry and 5
industrial companies76
.
This study includes one impact category from the EDIP since it was the best represented in highest
detail in Ecoinvent database. The impact category is resource consumption.
EDIP treats the resources as a quota of yearly extracted resources compared to the approximated
global resource reserve77
.
Resources presented by EDIP include materials for production such as aluminum, zinc, copper etc. but
also energy resources such as coal, oil and natural gas. They are only presented as extracted resources
and not presented as energy. Energy is presented from another LCA tool namely cumulative energy
demand.
2.8.2 CED (Cumulative Energy Demand)
CED takes into account the total primary energy input required for producing a product78
. The impact
category; Cumulative Energy Demand and sub impact categories: Primary energy consumption,
renewables and Primary energy consumption, non-renewables presented in this study, originate from
Ecoinvent CED data.
75
Rydh, C.J., et.al., p. 119 76
Rydh, C.J., et.al., p. 126 77
ibid. 78
Röhrlich et al., LCA Case Studies, A method to calculate the cumulative energy demand (CED) of lignite
extraction, 2000, p. 369-370

26
2.8.3 Selected LCI results, additional
Water use is best represented in Ecoinvent by the category: selected LCI results additional.
Selected LCI results, additional is a sub group to selected LCI results. They describe summarized
substance emission to different sub-compartments79
and water is one such substance.
The impact category “Water”, presented in this study originates from Ecoinvent, Selected LCI results,
additional.
2.8.4 CML 2001
CML 2001 (Center for Environmental Science of Leiden University) is a characterization and
normalization tool developed by the Environmental Science University in Leiden in Netherlands80
. It
is widely used in LCA studies and includes many impact categories for over 1 700 flows81
.
This LCA uses CLM 2001 for several impact categories such as GWP 100 (Global Warming Potential,
100 years), AP (Acidification potential, average European), EP (Eutrophication Potential, average
European), ODP 10 (Ozone Depletion Potential 10 years), ionizing radiation and HT 100 (Human
Toxicity, 100 years).
2.9 Balance of system (BOS)
When conducting LCA on PV systems, IEA PVPS together with Ecoinvent report no. XII state that a
balance of system should be included and presented.
Balance of system includes parts of the PV system that are not included in the solar panel. Mounting
frame, electric installation (all components such as cables, junction boxes, meters and lightning
protection) and inverter fall under the title BOS82
. BOS can be seen as a gathering category for
mentioned parts just as a PV module can be seen the same. PV modules themselves include many
parts such as solar cells, encapsulates etc. Different cases of PV systems result in different BOS83
. For
instance a ground mounted PV system and a building integrated PV system (BIPV) require different
amount of the mentioned component in BOS. BOS for large scale PV systems include even facilities,
concrete and grid connectors84
.
All components for BOS in this LCA are presented separately, more detailed, but will be denoted with
BOS in the results.
79
EarthShift, Selected LCI results, 2012, retrieved 14 May 2014,
<http://www.earthshift.com/software/simapro/selectedlci> 80
EarthShift, CML 2001, 2012, retrieved 14 May 2014, <http://www.earthshift.com/software/simapro/clm2001> 81
GaBi Software, CML 2001, 2012, retrieved 14 May 2014, <http://database-documentation.gabi-
software.com/support/gabi/gabi-lcia-documentation/cml-2001/> 82
Fthenakis, V. et. al., IEA – PVPS – Task 12, Life cycle inventories and life cycle assessment for photovoltaic
systems, p. 17 83
Jungbluth, N., et.al., op.cit., p. 89 84
Fthenakis, V. et. al., 17

27
2.10 Data quality
The majority of the data is from Ecoinvent, thoroughly measured and transparent. Newer data is also
used from the report from IEA PVPS Task 12, Life cycle inventories and life cycle assessment for
photovoltaic systems. The majority of the data originates from 2006-2007 although some cases are
newer and older. See metadata in Appendix 4 for further information. The data and additional
information will be presented in the coming sections.
Overall the data is to be considered as reliable based on professional data collection during several
years at different sites. For further information see Appendix 4.
Recycling data is obtained from the recycling company LCA85
from 2012.
2.11 Limitations and assumptions
The main limitation and uncertainty of this study is the lack of LCA data for the real parts, provided to
Gaia Solar by suppliers. Instead measured data from other corresponding processes from Ecoinvent is
used. The age of the data and data obtained at different companies in Ecoinvent is not 100%
representative to the real components produced in different, more modern industries. But there is little
to no possibility to include actual data due to lack of LCA’s. Therefore only the available data from
Ecoinvent will be presented despite the limitations. Additional information on the industrial
production efficiency evolution and material reduction obtained from trustworthy PV studies will be
presented as well and compared to the results obtained from Ecoinvent. One important process that has
been drastically improved is the reduction of the solar cell thickness, leading to more solar cells
produced per raw monocrystalline feedstock and thus lowering the environmental impacts of the solar
cells.
There are limitations regarding the recycling of the used PV panels because of lack of data and
information. Available LCA on recycling enabled the inclusion of some PV system parts, such as the
glass and aluminum roof installation. The other components are not assumed to be recycled and are
instead deposited. This will be discussed further on in the study. Some deposition and recycling of the
production of sub-processes is on the other hand regarded in every step, to some extent. Some raw
materials are treated, disposed and/or recycled, but not the whole sub-products. Therefore the use of
recycling data for the big parts, glass and aluminum roof installation, is convenient in order to present
them as recycled. Further more detailed information can be found in the unit process raw data in
Appendix 3.
Furthermore, performance of the system is assumed to be reduced by 0,5%/year due to degradation.
Two inverters are assumed to be used during the lifetime of the PV system while other the parts are
assumed to endure the whole lifetime.
The irradiation is assumed to be equal each year of the PV system lifespan meaning that the PV
system should output the same amount electricity each year if no degradation occurs.
The Danish electricity mix is assumed to be as it is today, for the duration of the PV system.
85
Fraunhofer IBP, Life cycle assessment (LCA) screening of the Maltha recycling process for PV-modules, 2012,
retrieved 14 May 2014, http://www.pvcycle.org.uk/wp-content/uploads/Exec-Summary-LCA-Screening-of-a-
Recycling-process-of-silicon-based-PV-modules-2012-07.pdf

28
The production of protective back sheet is assumed to the stage where a bulk of finished product is
obtained. The real PBS on the other hand has to be formed into thin films, a process which is not
included in the study due to lack of data. This excluded final process is somewhat irrelevant due to 2
reasons. First, the PBS plays a very small role in the entire PV system, see Appendix, transportation
section and results for data on impact categories and mass of the PBS. Second, the process of
acquiring bulk of the raw materials probably overweighs the single process of sheet production form
bulk material.
A few more assumptions are described and discussed further on in this study.

29
3 Life cycle inventory (LCI)
All upstream steps for all parts included in the PV system are accounted for. Transports between every
sub-process/refinement are included, material and energy supply as well as all emissions and recycling
and deposition materials. Additional transportation to Gaia Solar and to the location for the PV
system is also presented.
The inventory will only present the unit process raw data from Ecoinvent, meaning the main inputs
and outputs for a product. The real inventory data will not be presented due its tremendous size of 45
pages per sub-unit. Although the data will not be presented, its effects will be presented indirectly after
being categorization into the impact categories and the LCIA, since characterization structures all
flows into a few impact categories.
3.1 Parts for PV system
3.1.1 Solar cells
There are several pathways when producing a complete ready to use solar cell. The processes are
intended to purify silicon from the processed quarts sand in order to obtain as high degree of purity as
possible. It starts with the treating the sand to metallurgical grade silicon (MG-silicon)86
. Here is
where the processes split and the processes begin to differ.
The obtained MG-silicon can thereafter be purified yet again if intended to be used as electronic grade
silicone (EG silicone) the next step, or the MG silicone can be used directly to manufacture solar grade
silicone (SoG silicon) intended only for production of solar cells87
. The EG silicone process only
allocates a small fraction of the material for solar cell production, whiles the majority is used for other
products, as mentioned earlier in the study.
86
Fthenakis, V. et. al., p. 4 87
Jungbluth, N., et.al., op.cit., p. 16.

30
Both steps however can result in a polycrystalline and monocrystalline solar cells but by different
pathways. SoG silicon is a newer method since 2005 and requires less electricity for production of
silicon ready for solar cells88
. Figure 8 below presents the electricity demand from only one step of the
whole solar cell process line. While the modified Siemens process requires only one step to produce
solar ready silicon, the other pathway requires two for the same purpose. See figure 7 for clarification.
Solar cells produced from the EG-silicon pathway are much purer than those from the SoG-silicon,
since there are originally intended to be used in other products which require that high purity grade of
silicon89
. Large demand of solar cells has led to the development of processes intended for solar cell
silicon only, like the SoG-silicon process. This process in much cheaper in relation to the output of
electricity, due to the impurity difference between the two processes.
88
Jungbluth, N., et.al., op.cit., p. 26 89
ibid.
Figure 7: Process chart for manufacturing of poly- and monocrystalline solar cells. Modified from source:
Jungbluth, N., et.al., p. 14

31
Figure 8: Electricity required for the purification of MG-silicone to silicon ready solar cells, by the two different
methods. MG-silicon purification and electronic grade silicon are fused into once mutual column since they
correspond to the modefied siemens process as seen in Figure 7. In the end, the comparable columns are the
patterned ones. Data is gathered from Ecoinvent. Note that the unit is in kg and not in the total weight of the
requiered solar cells for 3 000 Wp PV system. The diagram only illustrates the relationship between the
processes regardless of the unit.
This study follows the SoG-silicon (modified Siemens process) only, and therefore there will be no
further description of the MG-silicon purification and EG-silicon production.
The following process, after SoG silicon, is the silicon production mix which is used for both poly-
and monocrystalline cells. The purity is raised above 98% before the material is ready for the next step
which is formation of mono crystalline feedstock by a process called “Czochralski process” (CZ
process)90
. This step is specific for production of monocrystalline solar cells only. After the
Czochralski process, the silicon feedstock is sawn into wafers that are treated before proceeding to the
solar cell production step. All the treatment steps in during different stages can be found in the
metadata in Appendix 4. After the solar cells are produced, different metallization pastes are applied
on the sell such as metallization paste on the front of the cell, on the back of the cell and an aluminum
plate on the back of the cell91
. After this metallization process the cells are ready for ready for use and
thus the production step for solar cells is finished.
Below is a flowchart of the production cycle of solar cells. The mass and energy flow are presented as
well and correspond to a 3 000 Wp PV system.
90
CZ-silicon, Metadata, Appendix 4 91
Jungbluth, N., et.al., op.cit., p. 63
0,00
50,00
100,00
150,00
200,00
250,00
300,00
silicon, electronicgrade, at plant
silicon, solar grade,modified Siemensprocess, at plant
MG-silicon, topurification
Mutual (electronicgrade silicone + MGsilicone purification
kWh
/kg
Electricity demand per kg output treated silicon
electricity, hydropower, at run-of-river power plant
electricity, at cogen 1MWe lean burn, allocation exergy
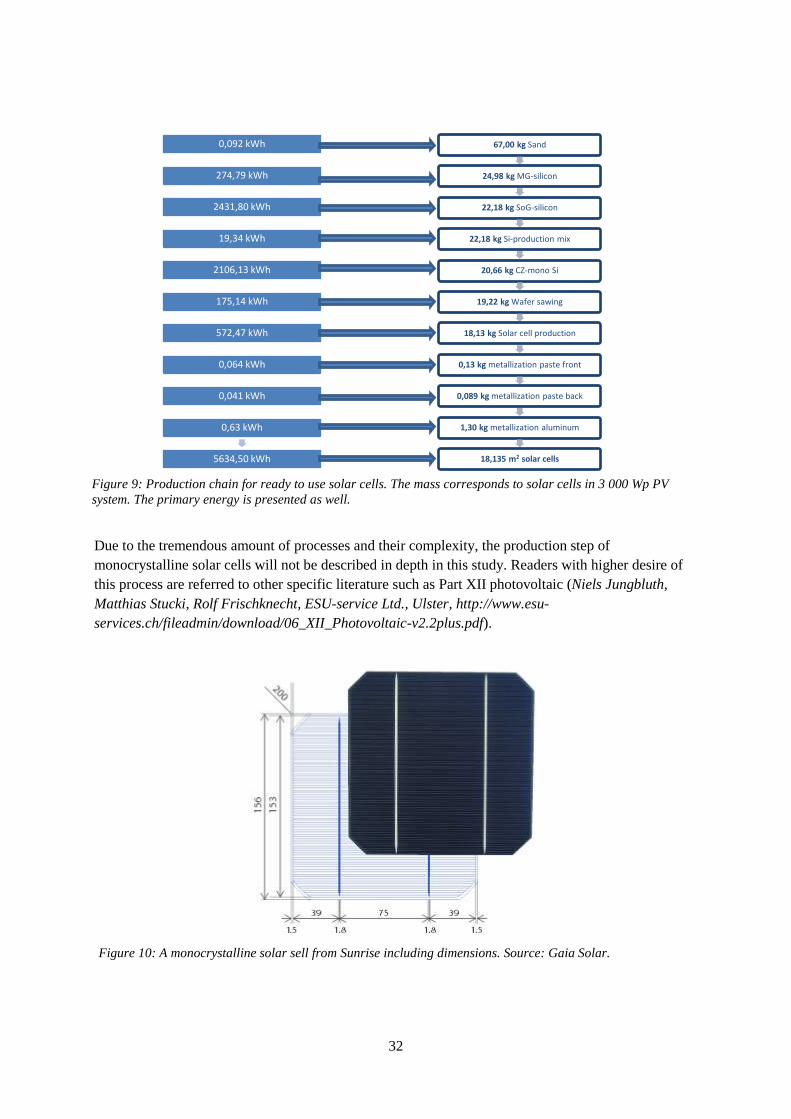
32
Due to the tremendous amount of processes and their complexity, the production step of
monocrystalline solar cells will not be described in depth in this study. Readers with higher desire of
this process are referred to other specific literature such as Part XII photovoltaic (Niels Jungbluth,
Matthias Stucki, Rolf Frischknecht, ESU-service Ltd., Ulster, http://www.esu-
services.ch/fileadmin/download/06_XII_Photovoltaic-v2.2plus.pdf).
67,00 kg Sand
24,98 kg MG-silicon
22,18 kg SoG-silicon
22,18 kg Si-production mix
20,66 kg CZ-mono Si
19,22 kg Wafer sawing
18,13 kg Solar cell production
0,13 kg metallization paste front
0,089 kg metallization paste back
1,30 kg metallization aluminum
18,135 m2 solar cells
0,092 kWh
274,79 kWh
2431,80 kWh
19,34 kWh
2106,13 kWh
175,14 kWh
572,47 kWh
0,064 kWh
0,041 kWh
0,63 kWh
5634,50 kWh
Figure 9: Production chain for ready to use solar cells. The mass corresponds to solar cells in 3 000 Wp PV
system. The primary energy is presented as well.
Figure 10: A monocrystalline solar sell from Sunrise including dimensions. Source: Gaia Solar.
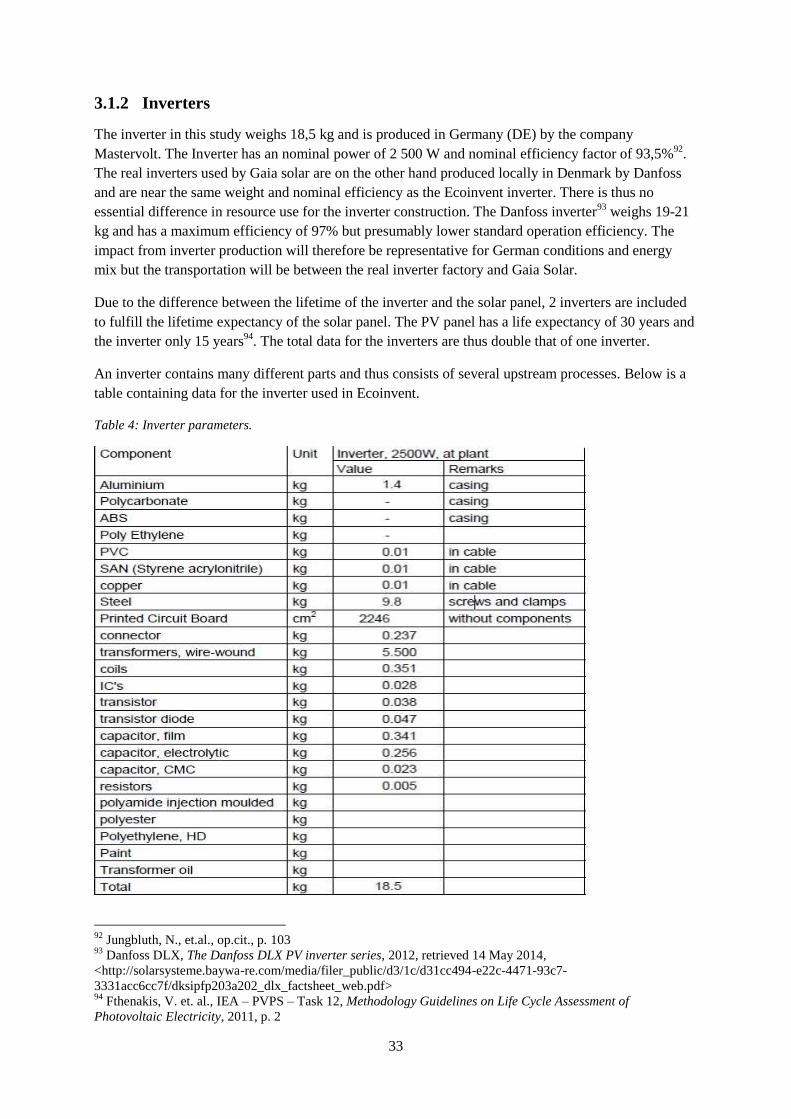
33
3.1.2 Inverters
The inverter in this study weighs 18,5 kg and is produced in Germany (DE) by the company
Mastervolt. The Inverter has an nominal power of 2 500 W and nominal efficiency factor of 93,5%92
.
The real inverters used by Gaia solar are on the other hand produced locally in Denmark by Danfoss
and are near the same weight and nominal efficiency as the Ecoinvent inverter. There is thus no
essential difference in resource use for the inverter construction. The Danfoss inverter93
weighs 19-21
kg and has a maximum efficiency of 97% but presumably lower standard operation efficiency. The
impact from inverter production will therefore be representative for German conditions and energy
mix but the transportation will be between the real inverter factory and Gaia Solar.
Due to the difference between the lifetime of the inverter and the solar panel, 2 inverters are included
to fulfill the lifetime expectancy of the solar panel. The PV panel has a life expectancy of 30 years and
the inverter only 15 years94
. The total data for the inverters are thus double that of one inverter.
An inverter contains many different parts and thus consists of several upstream processes. Below is a
table containing data for the inverter used in Ecoinvent.
Table 4: Inverter parameters.
92
Jungbluth, N., et.al., op.cit., p. 103 93
Danfoss DLX, The Danfoss DLX PV inverter series, 2012, retrieved 14 May 2014,
<http://solarsysteme.baywa-re.com/media/filer_public/d3/1c/d31cc494-e22c-4471-93c7-
3331acc6cc7f/dksipfp203a202_dlx_factsheet_web.pdf> 94
Fthenakis, V. et. al., IEA – PVPS – Task 12, Methodology Guidelines on Life Cycle Assessment of
Photovoltaic Electricity, 2011, p. 2

34
There are no recalculations made in the inverter data except accounting for two whole inverters.
See metadata in Appendix 4 for further detailed information on the inverter.
3.1.3 Electric installation
The electric installation used for this LCA consists of all cables, cable clamps, junction boxes,
electronic meter but not the inverter. The available Ecoinvent data is somewhat old and not really
accurate. For instance, the data includes a fuse box, domestic electricity meter and grid electricity
meter but as mentioned earlier there now exist smart inverters which supply the user with that
information rendering the local meters useless. Of course the new smart inverter can be seen as a
fusion of the local meter and the basic inverter since the new inverter contains the circuits and
electronics that the meter did to some degree. Fusion of the meter and the inverter is instead assumed,
leading to the same result but presented at different process. Instead of being presented for the inverter
data it will be presented in the electric installation section as separate meters.
Another uncertainty is the cabling. According to Jungbluth, N., et.al., the cabling should be between
200 and 400 meter and the cable size is 2,5mm2 copper wire. This is not valid for the cable amount
and dimensions of the present electric system used by Gaia Solar and will therefore be taken into
account by performing a percentage recalculation. Ecoinvent data is found in table 4.
Gaia Solar uses two, 1 m cables for every panel installed but of 4,0 mm2 dimension and since a 3 000
Wp system includes 20,7 panels this results in 41,4 m. Another 20 meter cabling is assumed to connect
the panels to the inverter and to the meters. This results in a total of 61,4 m cabling. The Ecoinvent
data represents a 245m x 2,5mm2 cabling. Recalculation follows, where parameters denoted with 1 are
the ones used in this LCA and parameters denoted with 2 are Ecoinvent data.
Bearing in mind that the cabling is much less in this LCA compared to Ecoinvent data, this results in
less copper and other materials necessary to cable production. Percentage calculation follows:
(3)
(2)

35
The reason why percentage calculation is based upon copper is that it contributes to highest life cycle
impacts assessment according to Ecoinvent database search of copper compared to PVC. Therefore the
percentage of remaining materials necessary to produce a cable will be lowered with the same
magnitude as copper.
Having calculated the total cable mass for the case of this LCA, there now needs to be yet another
percentage calculation preformed, comparing the new mass to the whole electric installation which
will thus result in a final value. Calculation to determine how much the new electric system relates to
the system from Ecoinvent follows:
(4)
Where,
ES1 = Electric System1
ES2 = Electric System2
EI2 = Electric Installation2
The system assumed in this study is 77,55% of the system presented by Ecoinvent and thus all the
results in the LCIA will be recalculated to represent the studied system. The resulting weight of the
electric installation is 25,29 kg.
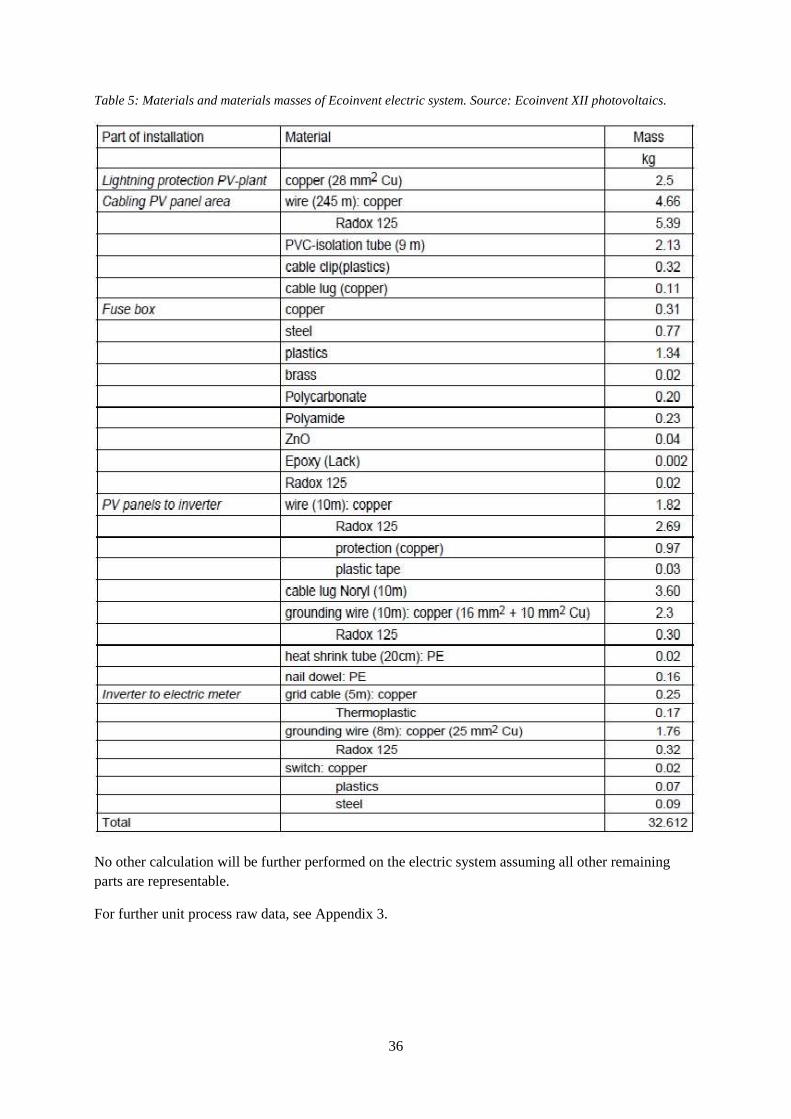
36
Table 5: Materials and materials masses of Ecoinvent electric system. Source: Ecoinvent XII photovoltaics.
No other calculation will be further performed on the electric system assuming all other remaining
parts are representable.
For further unit process raw data, see Appendix 3.

37
Figure 11: Electric installation components included in Ecoinvent data of the studied PV system. Modified from
source: Jungbluth, N., et.al., op.cit., p. 110.
3.1.4 Slanted roof PV structure installation
The slanted roof installation is assumed to differ from the one in Ecoinvent. The structure consists
predominantly of aluminum rails but also include iron screws, bolts and fuses and some plastic parts
as well95
. The purpose of the mounting system is to attach the panels to the roof in a secure and safe
way. Mounting structures should be robust and endure wind and snow. A gap between the roof and the
panels enables wind to pass between and thus cool the PV system which increases the efficiency of the
PV system96
.
Slanted roof installation data was latest updated by Ecoinvent in 2008 and is thus newer than many
other included parts in this LCA. For more detailed information of the roof installation, see Appendix
4 metadata and Appendix 3 for unit process raw data. The table below presents the resources, and their
mass, included in the slanted for the Ecoinvent structure.
Table 6: Material data for the slanted roof installation presented in weight/m2, Source: Ecoinvent report no. 6,
part XII.
Weight (kg/m2)
Aluminum 2,8
Steel 1,5
Rest 0,1
Total weight 4,7
The real structure used by Gaia Solar is slightly different and requires less materials per m2 to fulfill
the same purpose. The table below presents the values for the frame used by Gaia Solar.
95
Jungbluth, N., et.al., op.cit., p. 91 96
ibid., p. 90

38
Table 7: Material data for the actual roof installation measured by Gaia Solar.
Weight, kg/m2
Aluminum clamps and bolts 0,6
Aluminum rails 1,6
Total aluminum 2,2 kg/m2
There is a difference of 0,6 kg/m2 in the aluminum between the two cases. Since the roof installation
data is representative for the Ecoinvent case, a recalculation is required in order to make the real case
data representative. A reduction of 21,4 % of the Ecoinvent aluminum content in the roof installation
corresponds to the real case scenario. All other parts are assumed to be lowered by the same amount.
A total of 78,6% of Ecoinvent data for roof installation is used in this study.
3.1.5 Encapsulate
Gaia Solar uses 2 encapsulate layers in their solar panels. The encapsulate consists mostly of EVA
(ethylvinylacetate) but in this study it is assumed to be solely composed of ethylvinylacetate, since
Ecoinvent data about encapsulate did not exist but there was data about the production of EVA. There
is a difference between the mentioned two, namely the process of producing EVA sheets from the pure
compound. Because of the lack of data regarding the production of the sheet from bulk material, it is
excluded.
Ecoinvent EVA data was presented in 1 kg of produced EVA and not in 1 m2 as needed. A
combination of EVA parameters from Gaia Solar documentation and the density number of EVA
enabled the recalculation from 1 kg to 1 m2. Parameters about EVA are presented below:
Table 8: EVA parameters.
Density97
960 kg/m3
Area 1,032 m2
Thickness 0,000460 m
Volume 0,000473 m2
Sheet weight 0,455 kg
Percentage (actual
data/Ecoinvent data)
45,5%
Total panel area 21,367 m2
All Ecoinvent data for EVA is recalculated to represent 1 m2 of EVA sheet. In total only 45,5% of
Ecoinvent data is considered and used for the impact categories stated in this LCA. Obtained
representative data for the EVA is then extrapolated for a 3 000 Wp system, in this case multiplied by
21,367 m2.
See further unit process raw data in Appendix 3.
97
Fthenakis, V. et. al., IEA – PVPS – Task 12, Methodology Guidelines on Life Cycle Assessment of
Photovoltaic Electricity, 2011, p. 32

39
3.1.6 Back and front glass
The back glass is, as mentioned earlier, a vital component for the stability of the solar panel and an
alternative to aluminum frame. The actual back glass is thus not treated or coated like the more
advanced front glass since there is no need for it. Unfortunately, the back glass is assumed to be of the
same sort, namely low iron and high transparent, because of lack of alternative Ecoinvent glass data.
Glass data in Ecoinvent come in many sorts such as bottles, tubes etc. but the most representative was
data for solar panels, high transparent and low iron content. This means that the impact categories
originating from the back glass will be slightly overrepresented. Since there is nothing to compare
with, the scale of the overrepresentation is unknown. Generally, low iron glass and ordinary glass with
higher iron oxide content, are processed in the same way, the difference being the absence of iron
oxide in some silica sand compared to other98
. The overrepresentation will thus be very small in
comparison to the total impact from glass production.
See Appendix 3 for the unit process raw data.
High transparent low iron glass is used for the panels produced by Gaia Solar. The difference between
the front and the back glass is the thickness. Front and back glass data is presented below.
Table 9: Front and back glass parameters.
Front glass thickness 0,0032 m
Back glass thickness 0,0040 m
Density low iron glass99
2507,60 kg/m3
Panel glass area (one panel, front and back) 2,065 m2
Total glass area (3 000 Wp system) 44,12 m2
Front glass volume 0,0033 m3
Back glass volume 0,0041 m3
Front glass weight 8,28 kg
Back glass weight 10,35 kg
Total glass weight (3 000 Wp system) 385 kg
The density was required to enable recalculation from m2 to kg which was the unit for Ecoinvent data.
Ecoinvent data was then extrapolated by a factor of 385 times to represent the total glass for the PV
system.
See the unit process raw data in Appendix 3 for more information.
3.1.7 Protective back sheet (PBS)
The protective back sheet is a rather thin layer consisting of several different substances in reality but
because Ecoinvent did not have data for PBS, the decision was made to only include the mayor
substance of EVE namely polyethylene. Data for polyethylene was available in Ecoinvent but as in the
case of the encapsulate, the data was presented in kg of bulk material meaning that the process to press
98
SPANCraft Glass, Low iron glass, 2014, retrieved 14 May 2014, <http://www.spancraft.com/low-iron-
glass.shtml> 99
NovoGlass, Noval ultra clear low-iron glass, retrieved 14 May 2014,
<http://www.novalglass.com/DownLoad/Ultra-Clear-Float-Glass.pdf>

40
it into sheets is excluded. The same arguments are valid for PBS as were for the encapsulate. PBS data
is presented below.
Table 10: PBS parameters.
PBS thickness 0,000250 m
Density100
23 kg/m3
PBS area (one panel) 1,032 m2
PBS total area (3 000 Wp system) 21,367 m2
PBS volume 0,000258 m3
PBS total volume 0,00560 m3
PBS total weight 0,12 kg
In the production process of PBS, polyethylene is expanded to form a very light sponge-like sheet. The
density and the weight are thus very low. Only 12% of the Ecoinvent data for PBS is taken into
account.
Appendix 3 lists the unit process raw data for further information.
3.1.8 Anti-reflecting coating (AR-coating)
AR-coating data was available at Ecoinvent which means that no assumptions were made for the AR-
coating process. It was convenient that data was presented in m2 allowing for easy recalculation. AR-
coating data is presented below.
Table 11: AR-coating parameters.
Panel area 1,032 m2
Amount of panels 20,7
Total panel area 21,367 m2
Ecoinvent data was extrapolated by 21,367 times in order to represent the case for a 3 000 Wp system.
Moore data can be found in the unit process raw data in Appendix 3.
3.1.9 Extraction and refining and production
Usually a product undergoes a series of refining steps from extracted resources in order to be
produced. Ecoinvent data was available for whole sub-products to a PV system as shown in Figure 5.
The data is presented for a whole product and includes all process stages and resource extraction
needed for its production. Therefore all process steps for a product are taken into account by Ecoinvent
and are therefore also included in the results of this study. Data for these sub-products is presented in
Appendix 3 along with resource consumption. The production of solar cells was the only process
described in detail with sub-processes as seen in Figure 9. All production and refining steps for the
production of solar cells are presented in this study.
100
DIYTrade, Low density expanded polyethylene foam (EPE) roll, 2008, retrieved 14 May 2014,
<http://www.diytrade.com/china/pd/8559255/Low_density_Expanded_Polyethylene_Foam_EPE_Roll.html>

41
3.1.10 Resource consumption
Resources are represented for every sub-product included in the PV system by the Danish Ecoinvent
data tool EDIP (Environmental Design of Industrial Products). The resources are presented below.
Table 12: Resource flow throughout the studied system based on EPID characterization resources. NRR stands
for Non-Renewable Resource and RR stands for Renewable Resource.
The resource consumption is presented per fiction unit (FU), which is kWh, for a 30 years lifetime of
the PV system. All parts of the PV system are resized/extrapolated to the representative extent for the
studied PV system. Resources for front and back glass, along with the aluminum in roof installation,
are further managed to represent recycling of these parts. Processes which don’t include the use of new
physical resources, such as the assembly, still result in resource consumption. This is due to the
electricity production and the construction, operation and service of power plants.
3.1.11 Energy flow
The energy flow throughout the studied system, from part manufacturing to transportation and
assembly, is presented below. The energy mix for the majority of parts and processes are represented
for European electricity mix except for the assembly stage. The assembly represents the electricity mix
that is used by Gaia Solar. It is a combination of Danish electricity mix with own solar generated
electricity. Approximately 54% of the yearly electricity consumption is generated from solar power.

42
Table 13: Energy flow for the studied system. NRE stands for Non-Renewable Energy and RE stands for
Renewable Energy.
3.2 Degradation
Degradation of the PV panels affects the whole performance of the PV system. Below is a graph of
how the degradation proceeds. After 30 years the installed power has reduced to 2,59 kWp from the
initial 3 kWp. If the PV system reaches a lifetime of 40 years the installed power would correspond to
2,47 kWp. The specific annual yield is constant at 925 kWh/kWp throughout the lifetime of the solar
panel.
Figure 12: Degradation rate of the initially installed 3 kWp PV system.
3.3 Energy output from the PV system
Energy conversion by the PV system is directly linked to the irradiation and the installed power. With
a constant specific annual yield and the degradation presented above, the electricity generation of the
PV system throughout its lifetime is reduced in the same rate. The total energy output after 30 years is
2,30
2,40
2,50
2,60
2,70
2,80
2,90
3,00
3,10
1 2 3 4 5 6 7 8 9 10 11 12 13 14 15 16 17 18 19 20 21 22 23 24 25 26 27 28 29 30
kWp
years
Reduction in peak power (kWp) due to degradation
Power kWp

43
77 487 kWh. This value enables the use of the function unit. All results are divided by the lifetime
energy generation to obtain a final value of kg X-quivalents/kWh, or per FU since they are the same.
In case the PV system endures 40 year with degradation included, the energy output would be 100 832
kWh. That is a huge addition compared to the 30 years case and a good demonstration of the possible
gains by producing more durable PV system.
3.4 Transport
Transportation between different locations during the refining and production of the product are
included within the Ecoinvent data for each sub-product of the PV system. The transportation will thus
be included in the impact categories up to the stage where the sub-products are finished.
Because the sub-products are assembled in Denmark, transportation data form the production plant to
Denmark is not included in Ecoinvent data for sub-products of the PV system. This must be conducted
separately. A lot of assumptions can be made regarding the transportation. Most of the production sites
are in Europe but are not stated specifically where. An assumption is therefore made to represent the
real locations of the suppliers to Gaia Solar. This is after all the most representative way. Google maps
is used in the calculation of distance and supplier locations are provided by Gaia Solar.
The transportation trip is assumed to be one way only. The return of the transportation trucks and ship
are assumed to carry other goods and provide other services. An exception is the transportation from
Gaia Solar to the location of the PV system, where the vehicle is assumed to return empty. This is also
included in the calculations.
3.4.1 Ecoinvent transport data
This additional and separate final transportation data is also gathered from Ecoinvent and specified for
the type of transportation used in this study. This study includes three types of transportation namely
trans-oceanic freight ship, lorry 16-32 tons and EURO 5 standard and lorry 3,5-7 tons and EURO 5
standard. Since the majority of the sub-products to the PV system are produced in Europe the
transportation of choice is assumed to be a heavy-duty lorry, 16-32 tons. The choice for transportation
of the PV system to its location from the assembly site is a smaller lorry with purpose to only deliver
the system to the location.
Presented data in Ecoinvent include aspects such as operation, construction and maintenance of the
transportation vehicle and vessel and also port and road construction101,102
. More about this can be
found in the metadata for the transport in Appendix 4.
101
Ifu Hamburg, Ecoinvent: Transport – what is the difference between operation and transport in the lorry
database, retrieved 15 May 2014, <https://www2.ifu-hh.de/otrs/public.pl?Action=PublicFAQZoom;ItemID=37> 102
Ecoinvent data base, unit process raw data, transport.
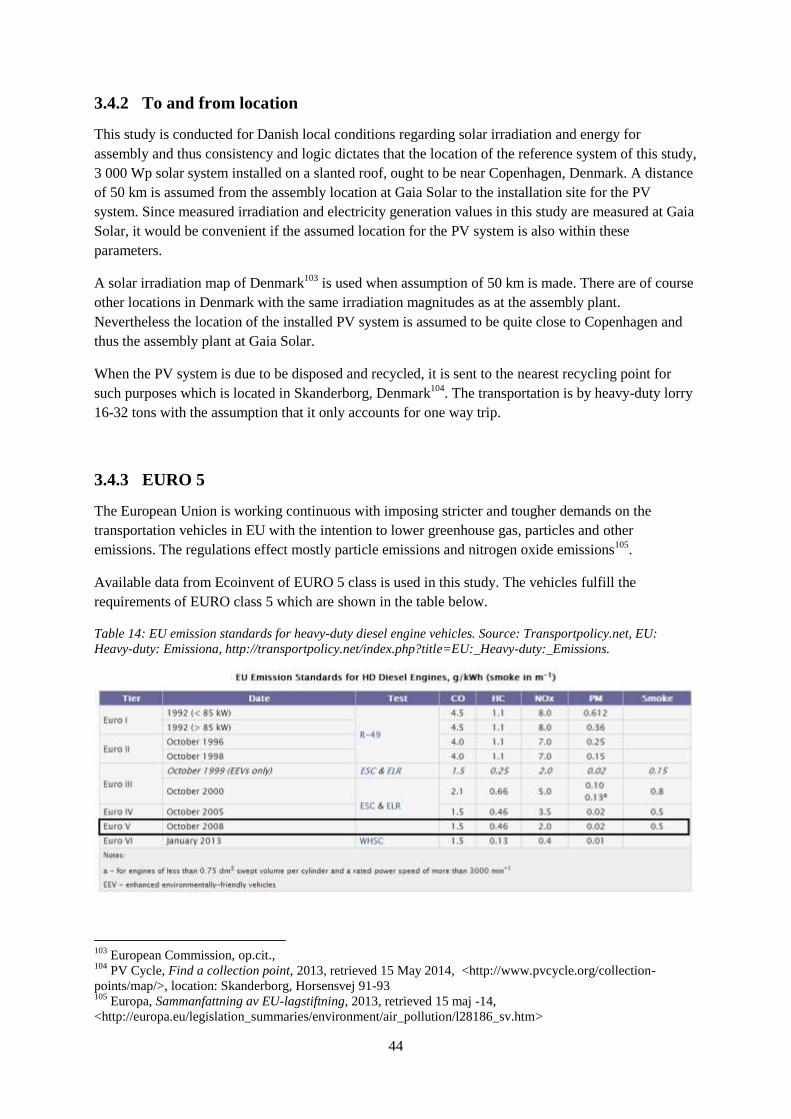
44
3.4.2 To and from location
This study is conducted for Danish local conditions regarding solar irradiation and energy for
assembly and thus consistency and logic dictates that the location of the reference system of this study,
3 000 Wp solar system installed on a slanted roof, ought to be near Copenhagen, Denmark. A distance
of 50 km is assumed from the assembly location at Gaia Solar to the installation site for the PV
system. Since measured irradiation and electricity generation values in this study are measured at Gaia
Solar, it would be convenient if the assumed location for the PV system is also within these
parameters.
A solar irradiation map of Denmark103
is used when assumption of 50 km is made. There are of course
other locations in Denmark with the same irradiation magnitudes as at the assembly plant.
Nevertheless the location of the installed PV system is assumed to be quite close to Copenhagen and
thus the assembly plant at Gaia Solar.
When the PV system is due to be disposed and recycled, it is sent to the nearest recycling point for
such purposes which is located in Skanderborg, Denmark104
. The transportation is by heavy-duty lorry
16-32 tons with the assumption that it only accounts for one way trip.
3.4.3 EURO 5
The European Union is working continuous with imposing stricter and tougher demands on the
transportation vehicles in EU with the intention to lower greenhouse gas, particles and other
emissions. The regulations effect mostly particle emissions and nitrogen oxide emissions105
.
Available data from Ecoinvent of EURO 5 class is used in this study. The vehicles fulfill the
requirements of EURO class 5 which are shown in the table below.
Table 14: EU emission standards for heavy-duty diesel engine vehicles. Source: Transportpolicy.net, EU:
Heavy-duty: Emissiona, http://transportpolicy.net/index.php?title=EU:_Heavy-duty:_Emissions.
103
European Commission, op.cit., 104
PV Cycle, Find a collection point, 2013, retrieved 15 May 2014, <http://www.pvcycle.org/collection-
points/map/>, location: Skanderborg, Horsensvej 91-93 105
Europa, Sammanfattning av EU-lagstiftning, 2013, retrieved 15 maj -14,
<http://europa.eu/legislation_summaries/environment/air_pollution/l28186_sv.htm>
45
3.4.4 Transportation additional information
Following information describes the real supplier locations and not random European location
assumed from Ecoinvent. Transoceanic freight ships are assumed to dock at Hamburg port and the
remaining distance is assumed to be covered by Lorry 16-32 tons.
Solar cells
Solar cells are transported from Taiwan and are assumed to be so by freight ship to Hamburg, and
thereafter with lorry 16-32 tons.
Inverter
The inverter is produced in Nordborg, Denmark.
Front Glass and AR coating
Since AR-coating data in Ecoinvent is from Denmark and the high transparent low iron front glass
suppliers are also from Denmark at a known location, they both are assumed to be delivered from the
same location.
Back glass
Back glass is produced in Lommel, Belgium.
Electric installation
Electric installation contains several different parts such as junction box, cables and meters. Because
Ecoinvent data is presented in a package, including all parts, it is reasonable to assume that all real
parts are shipped from the supplier location of the most dominant part included in electric installation.
For instance, if the cables make up 80% of the electric installation and are produced and shipped from
Berlin, Germany, while the actual meters are produced and shipped from Denamrk, the assumption
dictates that the whole electric system will be shipped from Berlin.
Roof installation
Roof installation also consists of several parts such as screws, fasteners, aluminum rails and more.
Aluminum rails are the dominant on these parts and therefore all other roof installation parts
correspond to a small part of the total roof installation. It is thus assumed that all parts originate from
the location of aluminum rail suppliers. It is assumed to be produced within Denmark.
Encapsulate (EVA)
EVA is produced in Llanera, Spain.
Protective back sheet
The PBS is produced in Boston, USA, and is assumed to be shipped to Hamburg (DE) by freight ship.
From there on PBS will be transported to Copenhagen by lorry 16-32 tons.
PV system
The whole PV system is, as mentioned earlier, transported to a location within Copenhagen.

46
PV system recycling and disposal
The closest collection point for disposal/recycling of the PV system is regarded in this study, which is
Skandeberg, Denmark106
. Transportation from the collection point to a treatment plant is not included
in this LCA. It is regarded as if the PV system is recycled and disposed at the collection point.
3.4.5 Transport parameters freight ship
Table 15: Transport parameters regarding solar cells from Taiwan.
Type Description Trip Weight
(tons)
Distance
(km)
Ton*km (tkm) Extrapolation
factor (times)
Freight
ship
Solar cells Taiwan (CH)-
Hamburg (DE)
0,01 29000 290 290
Freight
ship
Protective
back sheet
Boston (US) –
Hamburg (DE)
0,0002 6000 1,2 1,2
Freight
ship
SUM 291,2
These are the only parts of the PV system, transported by trans-oceanic freight ship. Since Ecoinvent
data is presented in 1 tkm (ton-kilometers) it is extrapolated 291,2 times for this study. The weight of
the transported product is rounded up to include packaging materials.
Unit process raw data from Ecoinvent for the freight ship transportation is presented below in table 14
as well as meta-information from the producer of the data in Ecoinvent, in Appendix 4.
As noted, data such as operation, production and maintenance of the ship, port construction and
maintenance, is included. Separate LCA inventories from cradle-to-grave, about these stages, are the
source for the presented results. Alongside the inventory data, assumptions are made based on
statistics for the operation of one port in Netherlands. Since two ports are needed, to be able to
transport a product, the two ports are assumed to be identical as the one in Netherlands. Vessel
manufacturing LCA results are allocated to the expected distance traveled by a freight ship during its
lifetime, 2 000 000 km. Environmental load is based on a yearly result, then allocated per trip. Further
descriptions are presented in the metadata for freight ship transportation in Appendix 4.
106
PV cycle, collection points, http://www.pvcycle.org/collection-points/map/

47
Table 16: Unit process raw data for freight ship transportation per tkm relative to the total production,
maintenance and operation.
3.4.6 Transport parameters lorry 16-32 tons, EURO 5
Table 17: Parameters for transportations of sub-products for a PV system to the assembly site in Copenhagen.
Type Description Trip Weight
(tons)
Distance
(km)
Ton*km Extrapolation
factor (times)
Lorry
16-32
tons
Solar cells Hamburg (DE) –
Copenhagen
(DK)
0,01 334 3,34 3,34
Lorry
16-32
tons
Inverter x2 Nordborg (DK) –
Copenhagen
(DK)
0,04 350 14 14
Lorry
16-32
tons
Front glass
and AR-
coating
Sorring (DK) –
Copenhagen
(DK)
0,17 304 51,68 51,68
Lorry
16-32
tons
Back glass Lommel (BE) –
Copanhagen
(DK)
0,22 826 181,70 181,70
Lorry
16-32
tons
Electric
installation
Berlin (DE) –
Copanhagen
(DK)
0,03 442 13,26 13,26
Lorry
16-32
tons
Roof
installation
Denmark –
Copenhagen
(DK)
0,1 200 20,09 20,09
Lorry
16-32
tons
Encapsulate
(EVA)
Llanera (ES) –
Copenhagen
(DK)
0,02 2603 52,06 52,06
Lorry
16-32
tons
Protective
back sheet
Hamburg (DE) –
Copenhagen
(DK)
0,0002 334 0,067 0,067
Lorry
16-32
tons
PV system
deposition
and
recycling
Copenhagen
(DK) –
Skanderborg
(DK)
0,50 274 137 137
Lorry
16-32
tons
Sum 473,20

48
The lorry transportation includes similar stages as the freight ship transport did, such as operation,
maintenance, disposal etc. Allocation for a trip, by Ecoinvent, is made based on the estimated distance
during the lifetime of the lorry. For more information see unit process raw data in Appendix 3 and
metadata in Appendix 4.
The total Ecoinvent data for the transportation by lorry 16-32 tons, is extrapolated 473,2 times in order
to represent all transports by this type of vehicle.
3.4.7 Transport Parameters lorry 3,5-7,5 tons, EURO 5
Parameters about the transport with the lorry 3,5-7,5 tons follow below.
Table 18: Transport parameters for the delivery of PV system to installation location.
Type Description Trip Weight
(tons)
Distance
(km)
Ton*km Extrapolation
factor (times)
Lorry
3,5-7,5
tons
Whole PV
system
Copenhagen –
Copenhagen
area
0,5 100 50 50
Since Ecoinvent data for the lorry is presented in tkm, it is extrapolated by 50 times to represent the
transportation of the PV system. Weight is rounded up in order to represent the packaging materials.
The reason for the large distance is because the lorry travels 50 km to the location and then returns. It
is therefore a two way trip.
Unit process raw data from Ecoinvent, representing transport by lorry 3,5-7,5 tons, is presented below
in table 19 and follows the same methodology as previous transport parameters for heavy-duty lorry
and freight ship. There are some differences regarding assumptions of operation, maintenance and
infrastructure. The operation and disposal of the vehicle as well as the infrastructure represent Swiss
conditions. Allocation regarding the production, maintenance and disposal of roads is made by gross
tkm transported on it. The lifetime expectancy of the vehicle is assumed to be 540 000 vkm (vehicle-
kilometers). Further detailed metadata is accessible in Appendix 4.
Table 19: Unit process raw data for Lorry 3,5-7,5 tons transportation per tkm relative to the total production,
maintenance and operation.

49
3.5 Assembly at Gaia Solar
The assembly process begins with quality check of the solar cells by exposing them to a light source in
order to conclude that the output energy is in line with the expected results. When the cells are
approved they are interconnected with a tape string machine before being placed out in the correct
pattern for the soldering. When the cells are aligned correctly and connected, they are laminated by a
lamination machine. While the cells are laminated, the junction box, which is a part of the electric
installation and joins the solar cell connection strings to extern cables, is mounted on the back glass.
The front and back glass are also polished, cleaned and prepared to be combined with the solar cells,
encapsulate and the protective back sheet. After the assembly of the panels, they are tested on a solar
simulator in order to determine that everything is working as expected. That was also the last step of
the panel assembly process before the panels are shipped to the customers.
3.5.1 Energy at Gaia alone
The energy required for the assembly process at Gaia Solar is assumed to be the same as in IEA PVPS
Task 12, which is 10,7 kWh for the amount of panels included in a 3 000 Wp PV system. Due to
several reasons, an actual measurement could not be performed and thus the use of extern assembly
data.
The energy for assembling of the PV panel does not correspond to standard Danish electricity mix.
The reason for that is because Gaia Solar generate own electricity from installed solar panels. The
company produces 54% of the total yearly electricity consumption. The production of electricity is
assumed to be for own use despite the fact that electricity is generated at after work times and exported
to the grid. The remaining 46% of the electricity represents Danish electricity mix. Ecoinvent data was
used for the Danish electricity mix in combination with extended solar power generation in order to
represent the assembly at Gaia Solar. The results for the Danish electricity mix are presented in the
table below.
Table 20: Final results for the electricity mix used by Gaia Solar.
renewable energy resources, biomass 0,26 kWh
non-renewable energy resources, fossil 2,55 kWh
non-renewable energy resources, nuclear 0,03 kWh non-renewable energy resources, primary
forest 0,00 kWh
renewable energy resources, solar, converted
7,86 kWh
renewable energy resources, potential (in barrage water), converted
0,00 kWh
SUM 10,74 kWh
3.6 Deposition and recycling
After thorough examination of Ecoinvent data, it is clear that deposition is assumes after the lifetime
of the parts incorporated in the PV system. This does not correspond to the reality since Gaia Solar
recycles used PV panels to a PV recycling company in Holland. Thus energy and materials are reused
after processing to obtain new products.

50
Such a recycling process relies upon data about what and how much of the panel is recycled and what
and how much is incinerated and/or deposited. Generally a LCA about recycling is needed of that
company in order to be able to include the recycling/waste phase in this LCA study. Fortunately such a
study is available.
By including recycling of materials in the study, the final results will be lower than if no recycling was
carried out. This is due to the fundamental idea behind recycling, namely spearing new extraction of
materials, and even purification of extracted materials, by recycling the used material back in the
production chain. Recycled material replaces the use of new material and thus spearing and lowering
the impact (environmental, energy, economic etc.) of the product, compared to if the product did not
include recycled materials.
3.6.1 Recycling LCA
The recycling company, cooperating with Gaia Solar, is called PV Cycle. PV Cycle in cooperation
with Maltha Glass Recycling has made a LCA regarding recycling of PV modules after user phase.
The data obtained by their research will be used in this LCA study in order to obtain as accurate final
results as possible.
Due to extensive information regarding the recycling LCA, the reader is referred to the web-address of
the study at: http://www.pvcycle.org/wp-content/uploads/Fraunhofer_3rd-RC_2013.pdf. In this study
only brief results and important parameters will be described further. All result about recycling of PV
modules will be included in the final results of this LCA, thus slightly lowering the environmental
burden for the whole PV system.
The process flowchart for the recycling of PV panels is presented in figure below.
Figure 13: Flowchart for the recycling process of PV modules. Source: Executive summery, Life cycle
assessment (LCA) screening of the Maltha recycling process for si-pv modules.
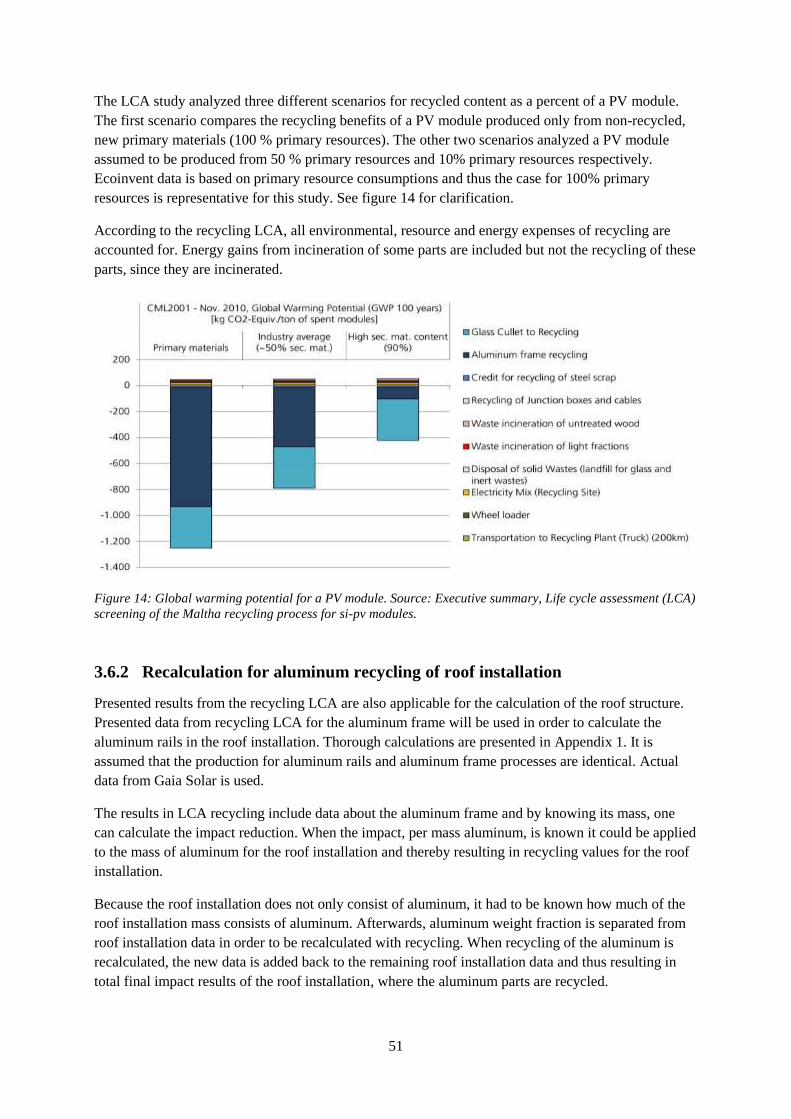
51
The LCA study analyzed three different scenarios for recycled content as a percent of a PV module.
The first scenario compares the recycling benefits of a PV module produced only from non-recycled,
new primary materials (100 % primary resources). The other two scenarios analyzed a PV module
assumed to be produced from 50 % primary resources and 10% primary resources respectively.
Ecoinvent data is based on primary resource consumptions and thus the case for 100% primary
resources is representative for this study. See figure 14 for clarification.
According to the recycling LCA, all environmental, resource and energy expenses of recycling are
accounted for. Energy gains from incineration of some parts are included but not the recycling of these
parts, since they are incinerated.
Figure 14: Global warming potential for a PV module. Source: Executive summary, Life cycle assessment (LCA)
screening of the Maltha recycling process for si-pv modules.
3.6.2 Recalculation for aluminum recycling of roof installation
Presented results from the recycling LCA are also applicable for the calculation of the roof structure.
Presented data from recycling LCA for the aluminum frame will be used in order to calculate the
aluminum rails in the roof installation. Thorough calculations are presented in Appendix 1. It is
assumed that the production for aluminum rails and aluminum frame processes are identical. Actual
data from Gaia Solar is used.
The results in LCA recycling include data about the aluminum frame and by knowing its mass, one
can calculate the impact reduction. When the impact, per mass aluminum, is known it could be applied
to the mass of aluminum for the roof installation and thereby resulting in recycling values for the roof
installation.
Because the roof installation does not only consist of aluminum, it had to be known how much of the
roof installation mass consists of aluminum. Afterwards, aluminum weight fraction is separated from
roof installation data in order to be recalculated with recycling. When recycling of the aluminum is
recalculated, the new data is added back to the remaining roof installation data and thus resulting in
total final impact results of the roof installation, where the aluminum parts are recycled.

52
Data which enabled recalculations was obtained from the results of the recycling LCA presented
below in figure 15 and in figure 14. The results include impact categories used in this LCA study as
well, and can thus be used. Almost all environmental impact categories are presented with one
exception, namely the ozone depletion potential. The author of the recycling LCA have not included
ozone depletion potential and has instead included photochemical ozone creation potential. An
assumption is made for the ozone depletion potential based on the lowest presented result, namely
eutrophication potential with 40%. The reason for choosing the lowest presented value and assuming
that for the ozone depletion potential is due to moral standards, and to address speculation about
dishonesty and data manipulation for beneficial results.
When the missing value is assumed, the whole environmental impact section for this study is
complete. Remaining impact categories such as human effect, land and water use are not included in
the recycling LCA either, and will thus not be included in this study as well. There will be no impact
gains for these categories due to recycling.
The resource category was modified for some resources in order to be more representative. Amongst
the materials affected are aluminum and all energy resources such as coal, natural gas etc. Mentioned
materials were reduced by 62,2 % in order to correspond to the recycled aluminum and speared energy
from excavating new aluminum. All other materials in the resource category remain unchanged.
Figure 15 presents the percentage of reduced impacts from aluminum and glass recycling.
Figure 15: Results for different impact categories when PV module is recycled. The biggest parts are aluminum
(dark blue) and glass (light blue).Source: Executive summary, Life cycle assessment (LCA) screening of the
Maltha recycling process for si-pv modules.

53
Table 21: Environmental impact potential data for the recycled aluminum, the remaining parts and the total
final values for a whole roof installation with aluminum recycling. Presented data is in kg units.
Final aluminum Rest materials
Sum, total roof installation with
Al recycling
Roof installation Roof installation Roof installation Unit
Acidification Potential 0,66 1,48 2,14
kg SO2-eq.
Global Warming Potential, 100 years 200,99 326,81 527,80
kg CO2-eq.
Eutrophication Potential 0,65 0,72 1,36
kg NOx-eq.
Ozone Depletion Potential, 10 years 1,98E-05 2,2E-05 4,18E-05
kg CFC-11-eq.
Table 21 above presents the environmental impact values for the new modified roof installation where
the aluminum rails are recycled, according to described methodology.
3.6.3 Recalculation for energy by recycling of aluminum in roof installation
The same method is used to calculate the final energy from the roof installation after including gains
in energy from recycling of aluminum in roof installation. Because the recycling LCA only presents
energy as a whole category and not as detailed as in this study (per source of energy), all the energy
sources will be reduced in equal amount. It is as if all separately presented energy sources in this LCA
are added up like the recycling LCA and then recalculated. Each source will thus be lowered by the
same percentage. The percentage of energy gain by recycling is obtained from LCA recycling diagram
shown in figure 15.
The table below is obtained through the same methodology as the aluminum recycling above was
obtained. The recalculation steps will thus not be presented here and only the final result will. The
final energy use for production of roof installation with recycled aluminum is presented below under
the section “final”. For further information see Appendix 1.

54
Table 22: Energy reduction as a result of recycling aluminum in the roof installation. The most right column is
the final result and the data used in this LCA. Final data is in kWh units.
(kWh)
Original roof Installation,
total
Original aluminum
only
Original remaining
saved aluminum
%
saved aluminum
final aluminum
final total roof installation,
final aluminum + Original remaining
renewable energy resources, biomass
35,37 22,00
13,37 62 13,64 8,36 21,73
non-renewable energy resources,
fossil
2524,59 1570,29
954,29 62 973,58 596,71 1551,00
non-renewable energy resources,
nuclear
645,72 401,63
244,08 62 249,01 152,62 396,70
non-renewable energy resources,
primary forest
0,012 0,0080
0,0048 62 0,0049 0,0030 0,0079
renewable energy resources, solar,
converted
0,057 0,036
0,021 62 0,022 0,013 0,035
renewable energy resources, potential (in barrage water),
converted
536,31 333,58
202,72 62 206,82 126,76 329,49
renewable energy resources, kinetic
(in wind), converted
4,06 2,53
1,53 62 1,56 0,96 2,50
3.6.4 Recalculation of front and back glass with recycling
The recalculation for glass recycling is much easier to conduct since it is presented in only glass data
in Ecoinvent, contrary to the aluminum in roof installation. The calculations are performed in the same
way as for the aluminum in roof installation. Results of the total glass for a 3 000 Wp system are
presented below along with savings and percent of reduction from figure 15.
Table 23: Environmental impact potential data for the non-recycled glass, percent of reduction due to recycling,
saved impact due to recycling and the final impact from glass used in this study. Presented data is in kg units.
Original reduction in % Saved Final
GWP, kg CO2-Eq 377,02 40 150,81 226,21
AP, kg SO2-Eq 3,27 25 0,82 2,45
EP, kg Nox-Eq 2,12 55 1,17 0,96
ODP. Kg CFC-11-Eq 4,60E-05 40 1,84E-05 2,76E-05

55
The recycling process spears the production and excavation of new resources in order to obtain glass
thus lowering the total environmental impact from glass production.
Due to lack of impact categories for human effect, resources, water and land use in the recycling LCA,
the gains from recycling will not be implemented on those categories.
3.6.5 Recalculation of energy with recycling of glass
The energy calculations are conducted in the same way as the case for aluminum and are presented
below. According to the results of recycling LCA study the energy required for extraction of raw
material is saved by 33%.
Table 24: Final results, on the most right column, of energy required for production of glass when recycling is
included. Final units are in kWh.
(kWh) Original % Saved Final renewable energy resources,
biomass 19,23 33 6,34 12,88 non-renewable energy
resources, fossil 1278,76 33 421,99 856,77 non-renewable energy
resources, nuclear 91,59 33 30,23 61,37 non-renewable energy
resources, primary forest 0,0036 33 0,0012 0,0024 renewable energy resources,
solar, converted 0,022 33 0,0074 0,015
renewable energy resources, potential (in barrage water),
converted 17,19 33 5,67 11,52
renewable energy resources, kinetic (in wind), converted
1,54 33 0,51 1,034

56

57
4 Results
Corresponding Life Cycle Inventories (LCI) for the chosen impact categories, seen in section 2.7, have
been calculated by the characterization methods mentioned earlier. All Life Cycle Impact Assessment
(LCIA) results for the impact categories in this study are presented in the coming sections. All data is
also presented in Appendix 5, where all stages for the solar cell production are aggregated to one title
named “solar cells”.
All results are presented as sub-products to the solar cells. They have also been denoted with “BOS”
and “Panel” in order to clarify what category they belong to. An alternative would have been to
present BOS, panels and transportation only but then the detail level is drastically reduced. In such
diagrams, it would be impossible to see the amount of contribution from sub-products such as solar
cells, inverter, encapsulate, etc.
All results, except for the EPBT and Speared emissions in Danish electricity mix, are presented per
function unit. Results for the impact categories represents a 30 year lifetime of the system. The 40
years scenario is presented after the impact category results in section 4.7,
The choice for the majority of the diagram types, is based on the desire to present diagram columns as
well as numeric results. This is due to small emission being dominated by larger ones and thus hard to
read.
4.1 Resources
Resources consist of 6 impact categories as seen in section 2.8.

58
4.1.1 Resource consumption
Figure 16: The amount of resources required for production of 3 000 Wp PV system. NRR stands for non-
renewable resources and RR stands for renewable resources. The description, on the right side, represent the
arranging of the diagram columns in falling order, BOS transportation highest up and Panel solar cells at the
bottom. All results are presented per FU.
This diagram enables the identification of which and what amount of a resource is used to produce the
sub-products for a PV panel, BOS and the whole PV system. Thorough analysis of the diagram also
reveals which sub-products are the most resource demanding. For the PV panel, the cells that are most
resource demanding followed by glass, encapsulate, AR-coating and last the protective back sheet.
Note that not all resources are included in the Ecoinvent EDIP characterization method. Sand for
instance is not included, but if it were the resource would probably be ruled by glass production.
The four highest results, brown coal, coal, natural gas and oil, are all resources connected to energy
production. The next three columns represent actual resources included in the PV system with iron
being the highest if them, followed by aluminum and copper.
The inverter and roof installation are the most demanding parts regarding the use of metals.
0,00E+00
5,00E-04
1,00E-03
1,50E-03
2,00E-03
2,50E-03
NR
R, a
lum
iniu
m
NR
R, a
nti
mo
ny
NR
R, b
row
n c
oal
NR
R, c
adm
ium
NR
R, c
oal
NR
R, c
ob
alt
NR
R, c
op
per
NR
R, g
old
NR
R, i
ron
NR
R, l
ead
NR
R, m
anga
ne
se
NR
R, m
ercu
ry
NR
R, m
oly
bd
enu
m
NR
R, n
atu
ral g
as
NR
R, n
icke
l
NR
R, o
il
NR
R, p
alla
diu
m
NR
R, p
lati
nu
m
NR
R, s
ilve
r
NR
R, t
anta
lum
NR
R, t
in
NR
R, z
inc
RR
, wo
od
kg /
kW
h
Resource consumption BOS Transport
BOS Roofinstallation
BOS Electricinstallation
BOS Inverter
Panel Assembly
Panel Transport
Panel Protectiveback sheet
Panel AR-coating
Panel Front andback glass
Panel Encapsulate
Panel Solar cells

59
Figure 17: The same data as in Figure 16 only the x-axis is changed to enable easier comprehension of the
amount of resources required per PV panel sub-product. NRR stands for non-renewable resources and RR
stands for renewable resources. Each section of the columns represents the amount of resources used and does
not extend down to the x-axis behind the other sections. The column sections are arranged in the same order as
the presented resources on the right hand side.
Figure 17 is similar to figure 16 with the difference being that the recourses and sub-parts have
changed place in order to easier identify the difference in scale between the sub-products. Here it can
be clearly seen that the inverter is the most resource demanding process followed by the roof
installation and solar cells. The category BOS accounts for the majority of resources in comparison to
the panel.
The total final resource use is 9,51*10-3
kg/kWh.
0,00E+00
5,00E-04
1,00E-03
1,50E-03
2,00E-03
2,50E-03
3,00E-03
3,50E-03
Sola
r ce
lls
Enca
psu
late
Fro
nt
and
bac
k gl
ass
AR
-co
atin
g
Pro
tect
ive
bac
k sh
eet
Tran
spo
rt
Ass
em
bly
Inve
rter
Elec
tric
inst
alla
tio
n
Ro
of
inst
alla
tio
n
Tran
spo
rt
Panel BOS
kg /
kW
h
Resource consumption
RR, wood
NRR, zinc
NRR, tin
NRR, tantalum
NRR, silver
NRR, platinum
NRR, palladium
NRR, oil
NRR, nickel
NRR, natural gas
NRR, molybdenum
NRR, mercury
NRR, manganese
NRR, lead
NRR, iron
NRR, gold
NRR, cobalt
NRR, coal
NRR, cadmium
NRR, brown coal
NRR, antimony
NRR, aluminium

60
4.1.2 Land
The majority of land use is derived from the solar cell production. Two other major contributors to this
impact category are roof installation and inverters but are not even close to the value for solar cells.
Pay attention to the values since the x-axis in the diagram is not linear but adjusted in order to enable
better oversight of the majority of the parts.
The total land use is 2,3*10-3
m2a/kWh.
Figure 18: The figure represents the annual areal use per FU for the total 3 000 Wp PV system. The description
field, on the right, represents the opposite arranging of the diagram sections. Panel solar cells are at the bottom
and BOS Transport is at the top.
1,16E-03
4,86E-05
1,98E-04
6,33E-05
3,56E-10
1,01E-05
4,04E-04
4,55E-05
3,66E-04
5,16E-06
1,16E-06
0,00E+00 5,00E-04 1,00E-03 1,50E-03 2,00E-03 2,50E-03
m2a/kWh
Land use
Panel Solar cells
Panel Encapsulate
Panel Front and back glass
Panel AR-coating
Panel Protective back sheet
Panel Transport
BOS Inverter
BOS Electric installation
BOS roof installation
BOS Transport
Panel Assembly

61
4.1.3 Water
The water use is dominated by the production of solar cells, followed by inverter, roof installation and
glass production. The panel requires approximately double the amount of water as BOS does and the
consumption is almost solely from the solar cell in the panel category.
The total amount of water use is 1,06*10-3
m3/kWh.
Figure 19: The figure represents the annual water use per FU for the total 3 000 Wp PV system. The description
field, on the right, represents the opposite arranging of the diagram sections. Panel solar cells are at the bottom
and BOS Transport is at the top.
8,65E-04
6,07E-06
4,72E-05
8,52E-06
5,63E-09
2,56E-06
6,01E-05
1,24E-05
5,37E-05
9,81E-07
6,99E-08
0,00E+00 5,00E-04 1,00E-03
m3 / kWh
Water consumption
Panel Solar cells
Panel Encapsulate
Panel Front and back glass
Panel AR-coating
Panel Protective back sheet
Panel Transport
BOS Inverter
BOS Electric installation
BOS roof installation
BOS transport
Panel Assembly

62
4.1.4 Cumulative energy demand
The CED category is yet again dominated by the solar cell production and requires far more energy
than all remaining parts combined. The roof installation and inverter production are the second and
third energy demanding processes of the PV system. The results demonstrate how energy intensive the
solar cell production is.
The total final CED for the PV system is 0,31 kWh/kWh.
Figure 20: The figure represents the CED per function unit for the total 3 000 Wp PV system. The description
parameters, on the right, represent the opposite arranging of the diagram sections. Panel solar cells are at the
bottom and BOS Transport is at the top.
Figure 21: Cumulative energy demand per source for the parts, and transport, of the studied PV system.
2,24E-01
6,03E-03
9,09E-04
1,93E-03
3,51E-05
4,52E-03
2,45E-02
7,67E-03
3,69E-02
1,08E-03 2,15E-04
0 0,1 0,2 0,3 0,4
kWh / kWh
Cumulative Energy Demand
Panel Solar cells
Panel Encapsulate
Panel Front and back glass
Panel AR-coating
Panel Protective back sheet
Panel Transport
BOS Inverter
BOS Electric installation
BOS roof installation
BOS Transport
Panel Assembly
0% 20% 40% 60% 80% 100%
Solar cells
Encapsulate
Front and back glass
AR-coating
Protective back sheet
Inverter
Electric installation
roof installation
Transport
Assembly
Pan
elB
OS
Tra
nsp ort
Pa
nel
Cumulative Energy Demand by Source
RE, biomass
NRE, fossil
NRE, nuclear
NRE, primary forest
RE, solar, converted
RE, water, converted
RE, wind, converted

63
4.1.5 Renewable energy
Since the renewable energy values are derived from the CED, it comes as no surprise that the solar cell
production is the most energy demanding process. The majority of the renewable energy originates
from hydropower. A process, along the production chain for solar cells, is located in Norway and thus
the Norwegian energy mix is taken into account. See metadata in appendix 4.
The roof installation and inverter production are the second and third largest production processes
using renewable energy.
The total amount of renewable energy for the production of 3 000 Wp solar system is 0,041
kWh/kWh.
Figure 22: The figure represents the renewable energy per function unit for the total 3 000 Wp PV system. The
description parameters, on the right, represent the opposite arranging of the diagram sections. Panel solar cells
are at the bottom and BOS Transport is at the top.
3,36E-02
1,75E-04
2,45E-05
1,99E-04
4,08E-07
6,69E-05
1,80E-03
3,88E-04
5,67E-03
1,65E-05
3,01E-05
0 0,01 0,02 0,03 0,04 0,05
kWh / kWh
Renewable energy demand
Panel Solar cells
Panel Encapsulate
Panel Front and back glass
Panel AR-coating
Panel Protective back sheet
Panel Transport
BOS Inverter
BOS Electric installation
BOS roof installation
BOS Transport
Panel Assembly

64
4.1.6 Non-renewable energy
The non-renewable energy consumption is similar in proportions to the renewable energy demand in
figure 22. The difference is in the amount. The total non-renewable energy demand is 0,27 kWh/kWh.
This is more than six times the amount of renewable energy used. The solar cell solely requires 0,19
kWh/kWh.
Figure 23: The figure represents the non-renewable energy per function unit for the total 3 000 Wp PV system.
The description parameters, on the right, represent the opposite arranging of the diagram sections. Panel solar
cells are at the bottom and BOS Transport is at the top.
4.2 Environmental Impact
Environmental impact, in this LCA study, consists of four impact categories namely global warming
potential, acidification potential, eutrophication potential and ozone depletion potential, as seen below
and in section 2.8.
1,90E-01
5,85E-03
8,84E-04
1,73E-03
3,47E-05
4,45E-03
2,27E-02
7,28E-03
3,12E-02
1,06E-03
9,31E-05
0,00 0,05 0,10 0,15 0,20 0,25 0,30
kWh / kWh
Non-renewable Energy demand
Panel Solar cells
Panel Encapsulate
Panel Front and back glass
Panel AR-coating
Panel Protective back sheet
Panel Transport
BOS Inverter
BOS Electric installation
BOS roof installation
BOS Transport
Panel Assembly

65
4.2.1 Global warming potential, 100 years
The largest potential emissions contributing to GWP originate from the solar cell production followed
by roof installation and inverter. Remaining parts, included in the PV system, are not even close to the
results of solar cell production.
The total global warming potential for a 3 000 Wp PV system is 0,053 kg CO2-eq/kWh.
Figure 24: The figure represents the GWP per FU for the total 3 000 Wp PV system. The description
parameters, on the right, represent the opposite arranging of the diagram sections. Panel solar cells are at the
bottom and BOS Transport is at the top.
3,79E-02
6,39E-04
2,43E-04
4,11E-04
3,19E-06
6,19E-04
4,76E-03
1,64E-03
6,81E-03 2,49E-04
2,58E-5
0,00 0,01 0,02 0,03 0,04 0,05 0,06
kg CO2-eq/kWh
Global Warming Potential, 100 years
Panel Solar cells
Panel Encapsulate
Panel Front and back glass
Panel AR-coating
Panel Protective back sheet
Panel Transport
BOS Inverter
BOS Electric installation
BOS Roof installation
BOS Transport
Panel Assembly

66
4.2.2 Acidification Potential
The highest contributor to potential acidification originated from the solar cell production. This impact
category is still dominated by the cell production potential effects but not in the same extent as in
previous categories. There are three other significant contributors to acidification potential namely the
production of inverter, roof installation and electric installation.
The total final acidification potential is 2,4*10-4
kg SO2-eq/kWh for a 3 000 Wp PV system.
Figure 25: The figure represents the AP per FU for the total 3 000 Wp PV system. The description parameters,
on the right, represent the opposite arranging of the diagram sections. Panel solar cells are at the bottom and
BOS Transport is at the top.
1,36E-04
2,04E-06
8,43E-07
2,12E-06
1,07E-08
2,61E-06
4,36E-05
2,43E-05
2,76E-05
7,38E-07
6,82E-08
0,00E+00 5,00E-05 1,00E-04 1,50E-04 2,00E-04 2,50E-04 3,00E-04
kg SO2-eq/kWh
Acidification Potential
Panel Solar cells
Panel Encapsulate
Panel Front and back glass
Panel AR-coating
Panel Protective back sheet
Panel Transport
BOS Inverter
BOS Electric installation
BOS roof installation
BOS Transport
Panel Assembly

67
4.2.3 Eutrophication Potential
The contribution to the highest eutrophication potential is due to solar cell production, followed by
inverter and roof installation production. The impact from the panel and BOS are almost equal for the
EP.
The total final eutrophication potential is 1,36*10-4
kg NOx-eq/kWh for the studied PV system.
Figure 26: The figure represents the EP per FU for the total 3 000 Wp PV system. The description parameters,
on the right, represent the opposite arranging of the diagram sections. Panel solar cells are at the bottom and
BOS Transport is at the top.
8,39E-05
1,29E-06
1,37E-06
8,35E-07
6,37E-09
3,07E-06
1,97E-05 7,69E-06
1,76E-05
1,01E-06 3,98E-08
0,00E+00 5,00E-05 1,00E-04 1,50E-04
kg NOx-eq/kWh
Eutrophication Potential
Panel Solar cells
Panel Encapsulate
Panel Front and back glass
Panel AR-coating
Panel Protective back sheet
Panel Transport
BOS Inverter
BOS Electric installation
BOS roof installation
BOS Transport
Panel Assembly

68
4.2.4 Ozone depletion potential, 10 years
The results for ODP are overwhelmingly represented by the solar cell production. The results for solar
cells alone are over 16 times greater than the remaining parts combined. The total final amount of
ODP is 2,25*10-8
kg CFC-11- eq/kWh.
Figure 27: The figure represents the ODP per FU for the total 3 000 Wp PV system. The description parameters,
on the right, represent the opposite arranging of the diagram sections. Panel solar cells are at the bottom and
BOS Transport is at the top.
2,11E-08
3,81E-11
2,97E-11
5,64E-11
1,09E-15
8,49E-11
5,29E-10
5,00E-11
5,39E-10
3,50E-11
1,95E-12
2,00E-08 2,05E-08 2,10E-08 2,15E-08 2,20E-08 2,25E-08 2,30E-08
kg CFC-11- eq/kWh
Ozone Depletion Potential, 10 years
Panel Solar cells
Panel Encapsulate
Panel Front and back glass
Panel AR-coating
Panel Protective back sheet
Panel Transport
BOS Inverter
BOS Electric installation
BOS roof installation
BOS Transport
Panel Assembly

69
4.3 Human effect
Human effect in this study consists of two impact categories which are human toxicity, 100 years and
ionizing radiation.
4.3.1 Human toxicity, 100 years
The HTP impact category is quite diverse. The highest contribution to HTP comes from the roof
installation production followed by the production of the inverter, electric installation and solar cells.
Almost half of the total contribution to this impact category is derived from the roof installation
production process.
The total final amount of ODP is 0,086 kg 1,4-DCB-eq/kWh for the PV system.
Figure 28: The figure represents the HTP per FU for the total 3 000 Wp PV system. The description parameters,
on the right, represent the opposite arranging of the diagram sections. Panel solar cells are at the bottom and
BOS Transport is at the top.
1,10E-02
1,35E-04
6,21E-04
8,75E-05
1,68E-08
1,12E-04
1,87E-02
1,40E-02
4,08E-02
3,63E-05
2,07E-06
0,00 0,02 0,04 0,06 0,08 0,10
kg 1,4-DCB-eq/kWh
Human toxicity potential, 100 years Panel Solar cells
Panel Encapsulate
Panel Front and back glass
Panel AR-coating
Panel Protective backsheetPanel Transport
BOS Inverter
BOS Electric installation
BOS roof installation
BOS transport
Panel Assembly

70
4.3.2 Ionizing radiation
The production processes of the roof installation and the inverters are the predominant contributors to
the ionizing radiation, followed by the solar cell production. For this impact category, the BOS is
contributing to ionizing radiation in higher degree than the solar panels.
The total final ionizing radiation is 1,5*10-10
DALY-eq/kWh for the PV system in this study.
Figure 29: The figure represents the IR per FU for the total 3 000 Wp PV system. The description parameters,
on the right, represent the opposite arranging of the diagram sections. Panel solar cells are at the bottom and
BOS Transport is at the top.
2,02E-11
3,06E-12
8,81E-12
9,56E-13
4,56E-17
1,31E-12
4,61E-11
6,55E-12
6,11E-11
6,00E-13
7,26E-15
0,00E+00 5,00E-11 1,00E-10 1,50E-10 2,00E-10
DALY-eq/kWh
Ionizing radiation potential
Panel Solar cells
Panel Encapsulate
Panel Front and back glass
Panel AR-coating
Panel Protective back sheet
Panel Transport
BOS Inverter
BOS Electric installation
BOS roof installation
BOS transport
Panel Assembly

71
4.4 Cumulative results
The figure below enables a total oversight of all impact categories for the studied PV system. The
columns are representative for the total sum of impact categories per PV system parts in percent, not
showing difference in magnitude between the parts.
Figure 30: Cumulative impact category results for the studied PV system.
4.5 Energy Pay-back Time
Energy payback time is a measure describing the time it takes for the PV system to generate the same
amount of electricity, relative to the electricity efficiency in the grid, as was needed for the production
of the PV system itself107
. One important parameter that needs to be known, in order to calculate the
EPBT, is the efficiency of the grid, meaning the ration between energy input from fossil sources and
the electricity output from these sources. Basically it is the electricity production efficiency of the
country, assumed that no electricity imports are made.
The energy payback time formula is presented, amongst others, by IEA PVPS Task 12, Life cycle
inventories and life cycle assessment of photovoltaic systems, and is shown below.
(5)
107
Jungbluth, N., et.al., op.cit., p. 152
0% 20% 40% 60% 80% 100%
Global Warming Potential, 100 years
Acidification Potential
Eutrophication Potential
Ozon Depletion Potential, 10 years
Human Toxicity Potential, 100 years
Ionizing Radiation Potential
Water
Land
Resources
Cumulative Energy Demand
Renewable Energy
Non-Renewable Energy
Cumulative results in percent Panel Solar cells
Panel Encapsulate
Panel Front andback glassPanel AR-coating
Panel Protectiveback sheetPanel Transport
BOS Inverter
BOS ElectricinstallationBOS roofinstallationBOS Transport
Assembly

72
Where,
Emat = Primary energy demand to producing materials for the PV system
Emanuf = Primary energy demand to manufacture the PV system
Etrans = Primary energy demand to transport all resources used in the PV system
Einst = Primary energy demand to install the PV system
EEOL = Primary energy demand for end of life treatment
Eagen = Annual generated electricity
Eaoper = Primary energy demand for operation and maintenance
ηG = Grid efficiency, average primary energy converted into electricity in the country
Table 25: Presentation of the parameters included in the EPBT calculation.
Emat Emanuf Etrans Einst EEOL Eagen Eaoper ηG
kWh 23329,66 10,74 502,00 0 0 2775 0 0,35
Ecoinvent data presents several of the presented parameters cumulatively. It does not separate
production of materials for the PV system from manufacturing of the PV system. The only difference
between these two parameters is the assembly energy demand. Therefore Emat will represent the
manufacturing of the PV and the producing materials as a cumulative value. Emanuf will on the other
hand only present the assembly of the PV panels, since all other manufacturing energy demand are
included in the Emat. A third parameter that is also included in all parts of the PV system and cannot be
separated from the Ecoinvent data is EEOL. As mentioned earlier, all parts are assumed to be
deposited/treated within the Ecoinvent data to some degree, but the results for just EEOL are impossible
to obtain from the cumulative Ecoinvent data. The EEOL data is thus also included in and represented in
Emat. The remaining parameters are, as earlier assumed, zero.
The conversion quota between primary energy input and electricity output is 35%108
. The total
cumulative energy demand for the PV system in this study is 23 842,4 kWh and the electricity
production for the first year is 2 775 kWh.
The energy payback time is in this case 3 years.
108
ABB, Denmark Energy Efficiency Report, 2013, retrieved 15 May 2014,
<http://www05.abb.com/global/scot/scot380.nsf/veritydisplay/81ca7ecdf0764500c1257be80053b4e0/$file/Den
mark.pdf>

73
4.6 Spared emissions in Danish electricity mix
By connecting a PV system to the grid, the solar generated electricity replaces the otherwise to be
produced electricity in Denmark if no PV was installed. It spares the production of electricity from the
national electricity mix. Danish electricity is produced, with 92% reliability109
, from wind generation,
hydro power, thermal production form renewables and thermal production from non-renewables, and
their respective annual production is 10 267 GWh, 18 GWh, 3 935 GWh and 14 700 GWh110
as
shown in figure 26.
A large amount of the total electricity production is from renewable energy sources, but still a very
large section of the electricity originates from fossil fuels and emits greenhouse gases to the
atmosphere. PV system generated electricity is assumed to replace the non-renewable generators only
and not the renewable ones. It would be unfortunate to replace a renewable energy source while non-
renewables still dominate the electricity mix, hence this assumption.
A convenient CO2 migration table for Denmark is presented by IEA PVPS Task 10111
in order to
calculate the amount of CO2 replacement by installation of a PV system. The presented values enable a
simple calculation for the amount of saved CO2 emissions. See the figure below.
Figure 31: The table shows the potential CO2 migration derived from the annual output. Source: Gaiddon, B.,
et.al., IEA-PVPS-Task 10, 2006, Compared assessment of selected environmental indicators of photovoltaic
electricity in OECD countries, p. 23
109
Energinet.dk, Environmental key figures for electricity, 2013, retrieved 15 May 2014,
<https://www.energinet.dk/EN/KLIMA-OG-MILJOE/Sider/Environmental-key-figures-for-electricity.aspx> 110
ibid. 111
Gaiddon, B., et.al., IEA-PVPS-Task 10, 2006, Compared assessment of selected environmental indicators of
photovoltaic electricity in OECD countries, p. 23

74
The potential for CO2 migration is presented in the lower left table and corresponds to 13 700 kg
CO2/kWp installed. The value is based on a lower annual output than the one used in this study (925
kWh/kWp) and after a simple conversion, the new, more representative value for the CO2 migration
results in 14 900 kg CO2/kWp.
When multiplied with the total amount of installed power, which is 3 kWp, the speared CO2 emissions
result in approximately 44 700 kg CO2.
In order to confirm this value, an alternative calculation was conducted based Danish electricity data
provided by eneginet.dk. The following tables present the values of importance for conduction a CO2
migration calculation.
Table 26: Specific electricity generation in Denmark, in GWh. Source: Energinet.dk, Environmental key figures
for electricity, 2013
Specification of electricity generation GWh
Electricity from wind turbines 10 263
Electricity from hydropower and photovoltaics 18
Electricity from thermal production on RE-fuels 3 935
Electricity from thermal production on non-RE fuels 14 700
Table 27: Environmental impact gases emission from electricity generation in Denmark, in tons. Source:
Energinet.dk, Environmental key figures for electricity, 2013
Emissions
Carbon dioxide (CO2) Tonnes 14 076 363
The following formula was put together in order to enable the CO2 migration.
(6)
The CO2 migration results in 54 000 kg CO2 which is somewhat close to the previous result and the
difference is due to ruff assumptions made in the calculation and probably different data compared to
previous calculations. The electricity mix is also assumed to be fixed, representative for today, during
the next 30 years which correspond to the lifetime of the PV system.
Nevertheless, the calculation roughly confirms the validity of the first calculation. Therefore the final
CO2 migration, due to the installation of 3 kWp PV system in Denmark, is 44 700 kg CO2 throughout
the lifetime of the PV system.
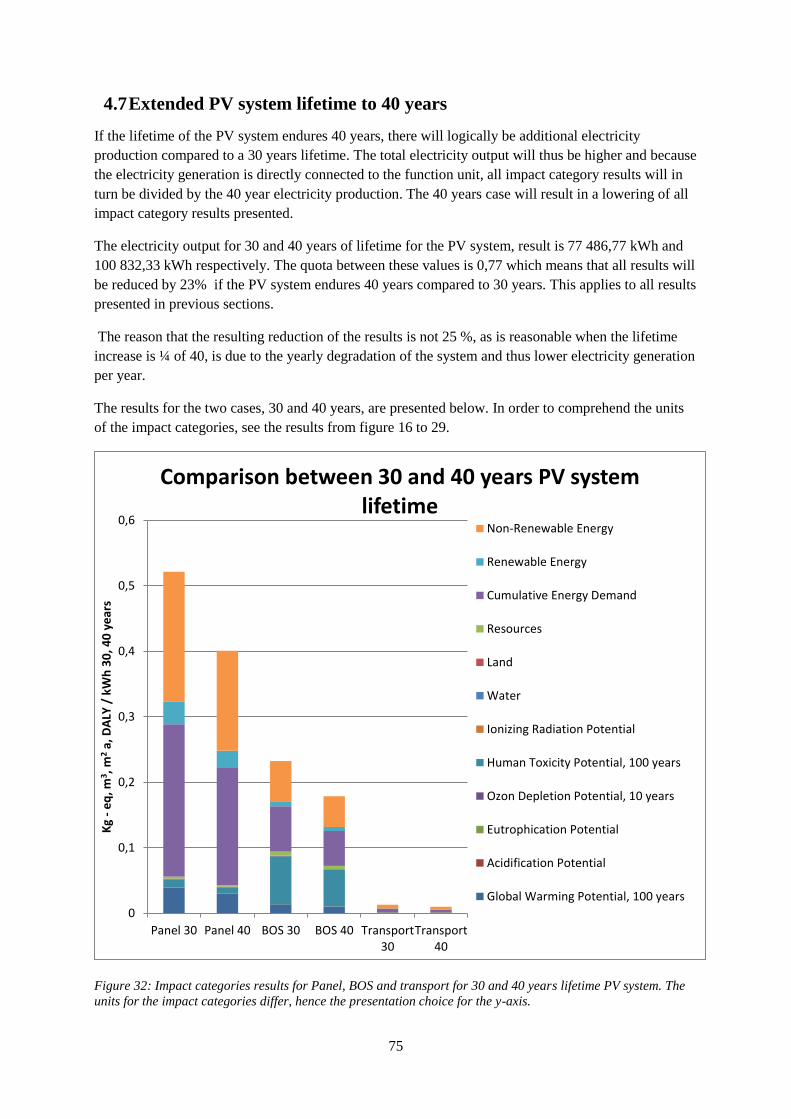
75
4.7 Extended PV system lifetime to 40 years
If the lifetime of the PV system endures 40 years, there will logically be additional electricity
production compared to a 30 years lifetime. The total electricity output will thus be higher and because
the electricity generation is directly connected to the function unit, all impact category results will in
turn be divided by the 40 year electricity production. The 40 years case will result in a lowering of all
impact category results presented.
The electricity output for 30 and 40 years of lifetime for the PV system, result is 77 486,77 kWh and
100 832,33 kWh respectively. The quota between these values is 0,77 which means that all results will
be reduced by 23% if the PV system endures 40 years compared to 30 years. This applies to all results
presented in previous sections.
The reason that the resulting reduction of the results is not 25 %, as is reasonable when the lifetime
increase is ¼ of 40, is due to the yearly degradation of the system and thus lower electricity generation
per year.
The results for the two cases, 30 and 40 years, are presented below. In order to comprehend the units
of the impact categories, see the results from figure 16 to 29.
Figure 32: Impact categories results for Panel, BOS and transport for 30 and 40 years lifetime PV system. The
units for the impact categories differ, hence the presentation choice for the y-axis.
0
0,1
0,2
0,3
0,4
0,5
0,6
Panel 30 Panel 40 BOS 30 BOS 40 Transport30
Transport40
Kg
- e
q, m
3 , m
2 a,
DA
LY /
kW
h 3
0, 4
0 y
ear
s
Comparison between 30 and 40 years PV system lifetime
Non-Renewable Energy
Renewable Energy
Cumulative Energy Demand
Resources
Land
Water
Ionizing Radiation Potential
Human Toxicity Potential, 100 years
Ozon Depletion Potential, 10 years
Eutrophication Potential
Acidification Potential
Global Warming Potential, 100 years

76
An increased lifetime of the PV system will also increase the CO2 migration with 13 410 kg CO2
resulting in a total of 58 110 kg CO2 migration. The values are obtained in the same way as for the 30
years case in the previous section.

77
5 Interpretation and Discussion
This section includes interpretation of the result, description of the origins and effects of the different
impact categories. An improvement section is included for the reduction of the solar cell thickness
from 270 μm, included in this study and based on Ecoinvent data, to 180 μm which is the actual
thickness of the solar cells used by Gaia Solar.
5.1 Technology improvement
As seen in the results, solar cells accounted for the largest impacts in almost all categories despite their
low weight in comparison to the remaining parts of the PV system. This indicates that the solar cell
production is a very intensive and energy demanding process. As mentioned earlier and as seen in
appendix 4, almost all data for the processes of the solar cell, are obtained in 2005-2006. This is quite
an unaccounted for gap in technology evolution and production efficiency. More recent reports from
2009 suggest that the solar cell technology has improved in all fields, such as irradiation conversion
efficiency, material saving and manufacturing efficiency112
. One of these improvement steps is the
reduction of solar cell thickness from 270 μm, as used in this study, to 180 μm which is the actual
thickness of the solar cells used by Gaia Solar113
. The reduction in thickness results is 33% material
savings and all solar cell production stages, up to the wafer sawing, are effected by such a change. The
remaining stages treat the solar cell surface and are not affected by the reduction in solar cell
thickness.
Table 28: Cumulative Energy Demand (CED) for each process of the solar cell production for a 3 000 Wp PV
system. It is not presented per FU. The sum of all processes up to wafer sawing are presented as well as the sum
remaining processes. Further information per FU can be found in Appendix 5.
(kWh) Sand MG-
silicon
SoG-
silicon
Si-
production
mix
CZ Si-
silicon
Wafer
sawing
Cell
production
Met.
Paste
front
Met.
Paste
back
Met.
Paste
alum.
CED
(kWh)
1,7 711,3 4126,4 484,0 6085,6 2835 2986,1 46,5 24,0 62,4
SUM
(kWh)
11409 5954
The table above presents the cumulative energy demand (CED) from the production of solar cells. The
formula below is intended to recalculate the energy reduction by reducing the thickness of the solar
cell up to the wafer sawing process.
(∑ ) ∑ (7)
484 kWh
112
Fthenakis, V. et. al., IEA – PVPS – Task 12, Life cycle inventories and life cycle assessment for photovoltaic
systems, p. 7 113
Sunrise, monocrystalline solar cells, 3 bus, 2012, retrieved 15 May 2014,
<http://www.sunriseglobalsolar.com/document/mono3bb.pdf>

78
(8)
The new CED is reduced by 22,3% to 13 484 kWh. This is a major reduction for the CED of solar
cells, from a previous value of 17 363 kWh, and for the whole PV system as well. Similar calculation
was conducted for the case of the whole PV system, resulting in 16,3% reduction from 23 842,4 kWh
to 19 963,4 kWh. This decrease in the total primary energy demand for the production of a 3 000 Wp
PV system reduces the energy payback time from 3 years to 2,5 years, trough same methodological
calculations as in previous section.
Extensive calculations were made on all sub-units, for all impact categories for the case where the cell
thickness is reduced to 180 μm. The results are presented in the figure below where the data for the
thinner cells are denoted with “new”. Obviously there is no change in the BOS and transport since
they are not affected by the reduction in cell thickness. Weight reduction for transportation of the
thinner solar cells is not assumed and is the same as for the ordinary solar cells. The difference
between the “sum” columns represents the difference in total impact between the case with thinner and
thicker solar cells, relative to the whole PV system.
Figure 33: Change in final results due to solar cell thickness reduction per FU.
0
0,2
0,4
0,6
0,8
1
1,2
Kg
- e
q, m
3, m
2 a,
DA
LY /
kW
h 3
0, 4
0 y
ear
s
Comparison between 270 and 180 μm solar cell thickness
Non-Renewable Energy
Renewable Energy
Cumulative Energy Demand
Resources
Land
Water
Ionizing Radiation Potential
Human Toxicity Potential, 100yearsOzon Depletion Potential, 10yearsEutrophication Potential
Acidification Potential
Global Warming Potential, 100years

79
The figure below is related to figure 33 but presents only the reduction of the different impact
categories due to solar cell thickness reduction. The reduction in energy was presented above but is is
also of great importance to present the reduction of all impact categories. Figure 34 generally makes it
easier to comprehend the reduction between the small sections in the columns in figure 33. The
reduction results correspond to the reduction of the whole PV system and not just the solar cells.
Results for reduction in percent can be applied on the total final results for the impact categories of the
total PV system presented from figure 18 to figure 29. This simplifies the interpretation of the results
compared to the results in figure 33 which are intended as an overlook comparison.
Figure 34: Reduction in percentage for the studied PV system due to reduction of solar cell thickness from 270
to 180.
5.2 Resources
5.2.1 Resource consumption
Resource consumption in this LCA is obtained through the characterization method EDIP. It includes
21 different types of resources, of estimated scarcer existence, and not resources such as sand and
common minerals. The resource horizon, meaning the amount of years before a reservoir is depleted
with current extraction pace, are of great importance for the characterization factor of a resource. Of
these 21 resources, only one is renewable and that is wood as seen in the resource diagrams.
The reason that solar cells do not dominate the “energy resources” as seen in CED results, is that the
production process of solar cells is largely derived from energy sources such as nuclear, primary forest
and hydropower. These sources are not and mustn’t be represented in resource consumption since the
sources are not consumed, except for nuclear power. All of these mentioned sources, except nuclear,
are driven by the sun and, even biomass which due to its fast lifecycle, compared to fossil resources, is
considered a renewable. These sources would be included in resource consumption if the sun’s fuel
was regarded as a resource
0
5
10
15
20
25
Reduction in percent from 270ηm to 180ηm

80
The two most resource demanding parts, roof installation and inverters, differ much in the way they
are produced and it is somewhat noticeable. They both use large amounts of fossil resources, where
the inverter requires more than the roof installation, but the roof installation on the other hand consists
of more metal resources. The inverter is thus more energy resource intensive, though not by much,
while the roof installation requires more metal resources for construction. The weights are also a factor
and while the two inverters whey slightly less than 40 kg, the roof installation is slightly above 70 kg.
The solar cells also require a lot of resources compared to the total weight of the 270 μm thick solar
cells, which whey slightly above 8 kg.
The inverter and roof installations, falling under the category of BOS, result in an even greater
difference between resource consumption for BOS compared to the panels.
5.2.2 Water
Water use is the amount of extracted water from a lake, river, well, sea or ocean required to produce a
product or service. It does not include water for cooling or energy production in hydro plants114
. Water
categorized by Selected LCI results additional, is only presented in quantitative measure of m3
regardless of location, importance or source115
.
Water is very scarce in some places116
, especially Africa and Asia, and is an important impact category
to include in LCA for processes in these regions. It is debated if water use is a more important
category then global warming potential due to the amount of people affected by lack of clean
drinkable water. Water may soon be presented in an own larger category, namely water footprint,
including more advanced aspects and weighing methods for importance of water at different regions.
A desiccation of water may also be needed in order to include the effect on the environment due to
water shortage caused by agricultural, industrial and drinking demands. Desiccation is not yet
implemented and incorporated into a life cycle impact category such as GWP, ODP, HTP etc. and thus
the importance and impact of water cannot be assessed properly117
.
Water is mostly used for agricultural purposes118
and therefore products related to agriculture will have
higher water use, and even theoretical desiccation depending on the location, then the production of
solar cells.
The production of solar cells require the most amount of water and the process sub-process of CZ-
silicon cells is in turn, by far, the most water intensive one compared to the remaining solar cell
production stages. See table 77 in Appendix 5 for information. This process location for the CZ-silicon
stage is located in Western Europe where water is not that scarce. Solar cell production requires 82%
of the water use for the total PV system.
114
Hischier, R., et.al., Ecoinvent, implementation of life cycle impact assessment method, report no. 3, 2010,
retieved 15 May -14, <http://www.ecoinvent.org/fileadmin/documents/en/03_LCIA-Implementation-v2.2.pdf>,
p. 162 115
Budavari, Z., et.al., LoRe-LCA, low resource consumption buildings and constructions by use of LCA in
design and decision making, 2011, retrieved 15 May 2014, <http://www.sintef.no/project/LoRe-
LCA/Deliverables/LoRE-LCA-WP5-D5.1-EMI_Final.pdf> 116
Pfister, S., Water resource in LCA, existing methods, regionalized aspects and future development, ETH
Zurich, 2010, retrieved 15 May 2014, <http://formations.cirad.fr/analyse-cycle-de-vie/pdf/StephanPfister.pdf> 117
ibid. 118
UNEP, Water scarcity index, 2006, retrieved 15 May 2014,
<http://www.unep.org/dewa/vitalwater/article77.html>

81
5.2.3 Land
Land use in CML 2001 characterization method accounts only for the land above water119
. The impact
is on the diversity of flora and fauna due to land occupancy. Buildings, farms, roads etc. occupy and
replace a natural environment that is no more, thus affecting the biodiversity in that location120
. The
size and location of the occupied land is important because the impact is measured in loss of
biodiversity, compared to unused surroundings121
. A factory, base or cultivation located in a desert
should not result in as high results for the same areal used in a highly biodiversity environments such
as the rainforest.
Solar cell production showed the highest results for land use. It is unclear if the land use is related to
factories land occupancy or excavation site for raw materials. It is most probable a combination of
both, but to what ratio is unclear.
5.2.4 Cumulative energy demand (CED)
Cumulative energy demand represents the total primary energy demand for a product/service during
the whole lifecycle. Energy is required from extraction of raw material to refining, from processing to
operation and recycling etc. There are some different approximations that can be made regarding the
primary energy demand. For instance there is a choice to be made regarding the heating value for
fuels, the upper and the lower. The upper heating value includes evaporation of water from fuels while
the lower does not, leading to different results. Generally, the majority of energy sources are
considered with upper heating value but it is more complicated when it comes to nuclear power and
wind, water and solar power. Due to extensive information regarding this subject and the process of
determining the caloric values, the reader is referred to the Ecoinvent report122
.
Ecoinvent data on CED consists of 7 different primary energy sources, 4 renewable and 3 fossil.
The cumulative energy demand for the production of solar cells reflects on the energy intensity of the
production process. Approximately 73% of the total CED is used in the solar cell production
processes. This has nothing to very little to do with the mass of the solar cells. The whole PV system is
assumed to be slightly lower than 500 kg and the solar cells are around 8,5 kg. Still, the solar cell
production process requires 73% of the total energy for the PV system.
If the solar cell production wore produced by the MG-silicon and EG-silicon pathway presented in
figure 7 & 8, the percentage would be even greater.
119
Hischier, R., et.al., op.cit., p. 29 120
Goedkopp, M., et.al., SimaPro database manual, method library, report no. 2, 2008, retrieved 15 May 2014,
<http://www.pre-sustainability.com/download/manuals/DatabaseManualMethods.pdf> 121
Baumann, H., et.al., op.cit., p. 148 122
Hischier, R., et.al., Ecoinvent, implementation of life cycle impact assessment method, report no. 3, 2010,
retieved 15 May -14, <http://www.ecoinvent.org/fileadmin/documents/en/03_LCIA-Implementation-v2.2.pdf>,
chap. 2

82
5.2.5 Renewable energy
The renewable sources presented in this study are biomass, water (hydropower), wind (wind turbines)
and solar (PV systems). It can be unclear, for some, what biomass includes while the remaining are
obvious. Biomass includes sources such as wood, food products, agricultural biomass123
.
Solar cell production also required the most of the total renewable energy for the PV system. Around
80% of the total results are represented by the production of solar cells. Hydropower accounted for
85% of the total renewable energy demand for the production of solar cells. The total renewable
energy use for the whole system was only 13,5% of the total CED.
5.2.6 Non-renewable energy
The non-renewable energy resources are fossil, nuclear and primary forest. The fossil fuels are hard
coal, peat, crude oil, lignite and natural gas.
The non-renewable energy category is predominantly represented by the use of fossil fuels. Yet again,
in consistency with the CED and renewable energy, the solar cell production process accounted for the
majority of the non-renewable energy demand.
5.3 Environmental impact
5.3.1 Global warming potential
Global warming potential and the term often used, with somewhat misleading name, carbon footprint,
are usually the categories of interest for presentation of a products/service environmental impact. The
term carbon footprint is not used in this study and instead global warming potential is used. Carbon
footprint has the same definition as global warming potential124
but could be interpreted, by the name,
as if it only accounts for the carbon dioxide emissions and not the remaining greenhouse gases.
It could be speculated why global warming potential is the category of choice when presenting
impacts of products. It could be due to the intensified global warming discussion and political rhetoric
about global warming and carbon emission, but one must not forget that other impact categories are of
high importance as well. A low global warming potential of a product does not mean low human
toxicity potential, low acidification potential etc. Therefore it is of great importance to include as many
categories as possible in order to present the products effect on a wider impact spectrum.
There are many substances that have a global warming effect but the most common are carbon dioxide
(CO2), methane (CH4), nitrous oxide (N2O) and fluorinated gases (f-gases, HFC, PFC, SF6)125
. The
presence of these gases in the atmosphere enable incoming solar energy, in form of short wave solar
irradiation, to pass through in higher rate than the earth’s long wave radiation (infrared, heat) emits
123
ibid., p. 34 124
Baldwin, S., Carbon footprint of electricity generation, Parliamentary office of science and technology,
retrieved 14 May 2014, <http://www.geni.org/globalenergy/library/technical-articles/carbon-
capture/parliamentary-office-of-science-and-technology/carbon-footprint-of-electricity-
generation/file_9270.pdf> 125
EPA, global greenhouse gas emissions data, 2013, retrieved 15 May 2014,
<http://www.epa.gov/climatechange/ghgemissions/global.html>

83
energy from the earth. The physiological properties of the gases enable the gases to absorb the
radiation from earth by exiting the electrons to a higher electron orbit, thereafter spreading it again
after the exited electrons fall back into the original orbit. It could be said that 50% of the reemitted
energy from the atmosphere is spread up into the universe and 50% back to earth126
.
The emitted greenhouse gases to the atmosphere are not only accumulated but there are also reduced
by natural sinks such as deposition in the oceans, uptake by algae, uptake by terrestrial vegetation and
chemical reactions in the atmosphere127
. Despite that, the concentration of CO2 in the atmosphere
increases by 1,8 ppmv/year128
(parts per million by volume/year) and is approximately 400 ppm in
2014129
. Anthropogenic sources for the increase of greenhouse gases are energy plants, industry, land
use and forestry, transportation and more130
while natural sources are volcanoes, soil erosion in the
lithosphere, gas-water exchange of the hydrosphere etc131
. According to IPCC, the increase is due to
anthropogenic activity. Most of the anthropogenic emissions are due to combustion of fossil fuels as
seen on the figure below.
Figure 35: World CO2 emissions by sector in 2011. source: IEA, CO2 emissions from fuels,
http://www.iea.org/publications/freepublications/publication/CO2EmissionsFromFuelCombustionHighlights201
3.pdf
As noted in the figure above, a large portion of the emissions originate from the electricity and energy
sector. Fossil fuel consuming energy generation pants contribute to increased global warming potential
in the construction phase, operation phase by burning fuels, and the disposal phase. Solar energy on
the other hand only contributes to emission in the production and disposal stage, thus generating
electricity without contributing to global warming. There is great room and potential to replace fossil
fuel with renewable sources, solar power being one of them.
It is quite reasonable that solar cell production contributes the most to GWP based on the results of the
CED and especially non-renewable energy. As seen in figure 34, a whole 42% of the anthropogenic
CO2 emissions in the world originate from the heat and electricity production. The total final CO2
emissions for the production of the PV system in this study, during 30 years, are 0,053 kg CO2 –
eq/kWh. The results are controlled against the report from Fthenakis, V., et.al., and seem to be correct
in comparison. The mentioned report resulted in a total of 38 g CO2 – eq/kWh but for conditions in
126
Jacobs, D.J., Introduction to atmospheric chemistry, 1999, p 129. 127
ibid., chapter 10, chapter 6.5. 128
ibid., p. 97 129
Atmospheric CO2, Mauna Loa Observatory, 2014, retrieved 15 May 2014,
<http://co2now.org/images/stories/data/co2-atmospheric-mlo-monthly-scripps.pdf> 130
EPA, global greenhouse gas emissions data, 2013, retrieved 15 May 2014,
<http://www.epa.gov/climatechange/ghgemissions/global.html> 131
Jacobs, D.J., op.cit., p. 88
84
southern Europe. The solar irradiation was 1700 kWh/m2/years instead of 1150 kWh/m
2/years as for
this study. Higher irradiation in turn leads to higher electricity generation and thus higher FU and in
turn results in lower GWP results. This is confirmed by the EPBT of that report which resulted in 2,3
years.
The solar cell production contributes to 71% of the total GWP results for the studied PV system. This
value would be lower for the actual case, with 180 μm thick solar cells.
5.3.2 Acidification potential
An acid is a proton donator, and thereby acidification occurs when a molecule donates a hydrogen, H+
ion, to a receiving medium132
. An increase of the hydrogen ion concentration lowers the pH of the
medium and affects the biosphere. Different substances contribute to acidification with different
magnitude depending on the ability of the substance to donate hydrogen ions. Fortunately there are
bases which neutralize the acidity. If acid rain, for instance, falls in the ocean or in an environment
with natural base resources such as limestone, the acid rain will not affect the biosphere because of
fast neutralization133
. Unfortunately emissions to air and water from anthropogenic activity in areas
which lack natural bases and buffers, lead to an acidification of the biosphere.
Major acidification chemical are SO2, NOx, HCL and NH3. SO2 and NOx are emitted from combustion
of fossil fuels which in turn contribute to acidification.
In LCA, the acidification potential characterization is based on the amount of hydrogen ions produced
per kg of chemical related to SO2. As in the case for global warming potential, the acidification
potential includes both stronger and weaker acids then SO2, but they are weighed against the
acidification potential of SO2 which is the representative substance.
The contribution to the acidification is with highest probability due to fuel combustion for power
generation required for the production of the PV system. The majority of the energy is utilized in the
solar cell production and they consequently contribute to the highest acidification potential. The total
potential acidification of solar cells is 57% of the total potential acidification from the whole PV
system.
5.3.3 Eutrophication potential
Eutrophication is also referred to as nitrification134
and describes the amount nutrients added to the
ecosystem. Additional nutrients are often introduced in form of manure and fertilizers with intention to
increase production form cultivated land135
. Increased levels of eutrophication have an impact on the
biodiversity by the faster growing organisms outsourcing the less abled ones. Eventually the nutrients
reach a water source such as a lake, pond and the sea, and have the same effect on the aquatic life as
on the terrestrial, leading to high concentration of algae at the expense of other aquatic organisms136
.
132
Jacobs, D.J., Chapter 13 133
Baumann, H., et.al., p. 155 134
ibid., p. 155 135
European commission, LCA, Eutrophication, retrieved 15 May 2014,
<http://qpc.adm.slu.se/7_LCA/page_09.htm> 136
ibid.

85
For instance, the aerobe decomposition of the algae depletes the oxygen concentration of the aquatic
environment, effecting organisms with high oxygen demand.
Substances consisting of nitrogen (N) and phosphorous (P) such as ammonia (NH3), nitrate (NO3) and
phosphate (PO43-
) are the major contributors to eutrophication137
. The representative substance for the
eutrophication category is NOx and other substances are converted into NOx-equivalents the same way
global warming and acidification potential substances were converted.
It is expected that products associated with cultivated land contribute to higher eutrophication then
products produced in land occupying facilities such as a factory.
Like the case for the potential acidification, the eutrophication potential is largely due to the solar cell
production. The total contribution percentage to the EP impact category from solar cells is 61,5% of
the total.
5.3.4 Ozone Depletion potential
Ozone depletion occurs every time an ozone molecule is reduced to oxygen138
. The gas is on the other
hand also formed but the reaction processes. The formation processes will not be described in this
LCA due to their extent and complexity. Ozone is both harmful and at the same time vital for earth’s
biosphere. This is due to the damaging properties of ozone to the biosphere at low altitudes and the
beneficial effects of ozone at stratospheric altitudes. Ozone in the stratosphere absorbs 99% of the
hazardous incoming UV irradiation, thus protecting life on earth139
. In order to determine if ozone is
good or bad for the biosphere, one has to define what altitude is considered.
Ozone depletion potential regards stratospheric depletion and not ground level ozone. If the ozone
layer around the earth is reduced, higher amount of damaging UV radiation will penetrate and affect
the biosphere negatively. In the impact category of ODP, reduction of ozone is negative for the
environment since the category represents stratospheric ozone only. There are many substances that
reduce ozone but all are related to the representative substance for this category which is kg CFC-11-
equivalents (kg trichlorofluoromethane equivalents) and thus adjusted to the ability of CFC-11 to
degrade ozone.
The main sources for ozone depletion are chlorinated and brominated substances140
. These substances
tend to have a very long residential time in the atmosphere and thus can deplete the ozone layer long
after the emissions have occurred.
This impact category is most affected from solar cell production compared to the remaining impact
categories, as seen in figure 30. A staggering 94% of the total potential for ozone depletion originates
form solar cell production process and 67% of the total ODP is from the solar cell production sub-
process “solar cell production”. This is not to be confused with the total solar cell production since
there is a sub-process sharing the same name. See Appendix 4, figure 61 and Appendix 5, figure 77
data for clarification.
137
Baumann, H., et.al., p. 156 138
Ziegel, Depletion of the stratospheric ozone layer, retrieved 15 May 2014, <http://www.ziegel.at/gbc-
ziegelhandbuch/eng/umwelt/wirkkatodp.htm> 139
Baumann, H., et.al., p. 150 140
ibid.

86
This could be due to the cleaning, polishing and treating compounds used for that stage. Metadata
states that several compounds consisting of phosphorous are used in that stage.
5.4 Human effect
5.4.1 Human toxicity potential, 100 years
Human toxicity potential impact category represents emitted compounds that effect human health. It is
a very complex category to characterize due to the amount of substances as well as how they affect
human health at a certain distance and concentration141
. HTP is derived from the fate, exposure and
effect of a toxic compound during infinite time142
. All compounds within that impact category are
adjusted and presented in kg 1,4-DB-eq (kg 1,4-dichlorobenzene equivalents).
This impact category is probably the most uncertain and debated one of all categories included in this
LCA. The category does not account for all toxic compounds in the world and many compounds
encountered in our environment have not undergone a risk assessment in order to be included in the
HTP impact category143
.
This impact category differs from the already mentioned in the way that solar cell production is not the
predominant source for HTP. The production of roof installation, inverter and electric installation
contribute to HTP in higher degree. Since solar cells contribute to the most CED, it could be
concluded that energy generation has very little to do with the human toxicity potential. The inverter
and roof installation production were the predominant resource consuming processes but in that chart
the inverter requires more than the roof installation. It seems odd that this ratio is not the same in the
HTP impact category until the realization of the difference in metals use. A closer analysis of the ratio
between metal use of the three major categories revel that aluminum, cadmium, magnesium and
mercury are highest in the roof installation. The excavation and processing of these metals could lead
to spills to the environment, thus causing higher results in HTP. The metals could also contribute to
human toxicity directly in the processing stages where employees work in close contact with the
metals.
5.4.2 Ionizing radiation
Radiation comes from a source with energy content with potential to transfer that energy to a receiving
molecule144
. Ionizing means that an electron can be knocked out of an atom or molecule thus creating
a radical which is highly reactive. Non-ionizing radiation on the other hand contains less energy and
only excites the electrons, without the ability to knocking them away145
.
141
ibid., p. 151 142
Building Research Establishment, Human toxicity, 2014, retrieved 15 May 2014,
<http://www.bre.co.uk/greenguide/page.jsp?id=2098> 143
Building Research Establishment, Human toxicity, 2013, retrieved 15 May 2014,
<http://www.bre.co.uk/greenguide/page.jsp?id=2098> 144
Uniformed service university of health and science, What is ionizing radiation, 2014, retrieved 15 May 2014,
<http://www.usuhs.edu/afrri/outreach/ionizing.htm> 145
Division of chemical education, department of chemistry, PURDUE university, Ionizing radiation, retrieved
15 May 2014, <http://chemed.chem.purdue.edu/genchem/topicreview/bp/ch23/radiation.php>

87
Ionizing radiation consists of x-rays, alpha, beta and gamma particles and is continuously all around
us, originating from sources such as the ground, universe, water, air, food etc. Ionizing radiation in
high does cause damage to the cells and the DNA, which in turn cause higher risk of cell death146
, cell
mutation and different diseases.
The impact category of ionizing radiation is presented in DALY (disability adjusted life years). DALY
is defined as the sum of years life lost (YLL) and years lived disabled (YLD) from the effect of
ionizing radiation.
The ionizing radiation impact category is very similar to the HTP category with one major difference
namely the lower impact from electric installation. Ionizing radiation is with high certainty not related
to the energy use since solar cells would dominate this category too. It is on the other hand more
probable that the resource consumption category is more related to the ionizing radiation. As
mentioned, ionizing radiation is emitted from the ground (among others) and by requiring raw
materials from mines and excavation sites, more of the ionizing bedrock is brought forth to the surface
where the ionizing waves could easier affect the biosphere.
Figure 36: Global radiation sources and quantities affecting the average human population. Source:
http://www.world-nuclear.org/info/Safety-and-Security/Radiation-and-Health/Nuclear-Radiation-and-Health-
Effects/
The majority of the radiation affecting humans is derived from building/soil and radon found in soil
and bedrock147
as seen in the figure above.
The majority of ionizing radiation related to the production of the studied PV system is related to raw
material excavation from soil and bedrock, consequently resulting increase in exposure of radon
(predominantly) to the biosphere.
146
ibid. 147
World nuclear association, Nuclear radiation and health effects, 2014, retrieved 18 May 2014,
http://www.world-nuclear.org/info/Safety-and-Security/Radiation-and-Health/Nuclear-Radiation-and-Health-
Effects/

88
5.4.3 Energy pay-back time consistency
The energy payback time was calculated in previous section and resulted in a final EPBT of 2,5-3
years. Other reports and projects present similar EPBT as this study. For instance Ecoinvent report no.
6, part XII resulted in 3,2 years for 3 kWp monocrystalline PV system on a slanted roof in
Switzerland. According to Eric Alsema, author of many PV studies, the EPBT is between 2,5-3,1
years, with higher irradiation (1700 kWh/m2*year) corresponding to southern Europe, but lower PR
(0,75) than this study148
. Alsema also presented EPBT results for conditions in Netherlands which
resulted in 3,5 years149
. A study by HESPUL showed that the EPBT of monocrystalline PV system, for
conditions in Edinburgh, was 3,3 years150
.
148
Fthenakis, V. et. al., IEA – PVPS – Task 12, Life cycle inventories and life cycle assessment for photovoltaic
systems, p. 5 149
ibid. 150
Gaiddon, B. et.al., Environmental benefits of PV system in OECD countries, 2006, HESPUL, p. 4

89
6 Conclusions
It is clear at this stage that the major cause for the impacts, from the production of the studied PV
system, is due to solar cell production. There is great room for further developments of more effective
solar cell production processes. The comparison between how the change in thickness of the solar cells
also indicates how big impact a small change can have. The results for the thinner solar cells are more
representative for this study while the thicker solar cells from Ecoinvent are the base for solar cell
production process in detail, step by step. Since the change in thickness is quantitative, it enables a
concrete comparison between the cases, and the results are thus representative. The only assumption is
that the production processes are identical. Most certainly the production process for thinner solar cells
are also more efficient in reality, but are not assumed to be so in this study, due to lack of such data.
To which degree the new processes are more efficient is unknown. This study represents industrial
processes predominantly from 2005-2006, leading to a time gap in development of almost 10 yeast up
to today. It is also inaccurate to make a comparison between production processes using only data of
increased efficiency, as the case with the solar cell thickness, since any such data would have to be
compared to the Ecoinvent data.
Since the thinner solar cells are more representative in this study, the EPBT should also be so. A
energy payback time of 2,5 years for Danish conditions is very good and in line with compared results
from other PV studies.
Gaia Solar estimates a lifetime of 30 and 40 years for their PV panels. This difference leads to a 23%
reduction of all results. It should be a striving goal to make any possible improvements in order to
ensure that the panel endures 40 years lifetime, based on the results from an environmental
perspective. It would also be of interest from a financial perspective as well.
The recycling process is not included completely because of the boundaries of the defined system. The
biggest, by mass, parts are assumed to be recycled but in reality even more part are recycled such as
cables, inverters etc. The solar cells can be used in other products after the expiration of the PV system
or could be recycled into a more advanced step of the solar cell production chain. Such an action
would improve the environmental results drastically.
This study has assumed the highest impact category values, based on the emission lifetime in the
environment, in order to represent a worst case scenario. It has also not assumed the recycling of all
parts which in turn also leads to a worst case scenario since the more recycled PV system parts, the
better final results. In reality, major contributors to the impact results such as the electric installation
and the inverter, would also be recycled, thus leading to even lower results as presented in this study.
The lack of data in combination with the time restriction of this study resulted in the exclusion of
aspects relating to the extended recycling process.
From an environmental point of view, the company should do adopt every new improvements of the
solar cells, be it further thickness reduction or improved production process, since small changes lead
to big impacts in the final results when it comes to solar cells. The remaining parts constitute much
low part of the total results and should therefore be less prioritized. Any environmental improvement
of the remaining parts is of course always a good thing and should also be encouraged, but not to the
same degree as the improvement of solar cells should be encouraged.
It is also of great environmental importance to strive to make the solar panels and the whole PV
system as long-lasting as possible since it reduces all impact categories and spears more CO2
emissions.

90
All presented results, suggestions and conclusions based on the environmental assessment of the PV
system should also be weighed against other parameters such as social, economic etc. in order to
obtain a complete picture and plan a strategic development of the PV system. The life cycle
assessment is not alone meant to be the foundations for decisions, since such actions could be
financially catastrophic. This study only enlightens the importance of the environment as one of these
parameters which should not be ignored in the strive for a more sustainable and cost efficient future
for PV technology.
This study is also in need for newer improved inventory data, representing the new production
processes for the PV system parts, especially the solar cell production.

91
References
ABB, Denmark Energy Efficiency Report, (2013), [Electronic source] Available at:
http://www05.abb.com/global/scot/scot380.nsf/veritydisplay/81ca7ecdf0764500c1257be80053b4e0/$f
ile/Denmark.pdf, [2014-05-15]
ABB, Solar inverters, (2014), [Electronic source] Available at: http://www.abb.com/solarinverters,
[2014-05-14]
Atmospheric CO2, Mauna Loa Observatory, (2014), [Electronic source] Available at:
http://co2now.org/images/stories/data/co2-atmospheric-mlo-monthly-scripps.pdf, [2014-05-15]
Baldwin, S., Carbon footprint of electricity generation, Parliamentary office of science and
technology, [Electronic source] Available at: http://www.geni.org/globalenergy/library/technical-
articles/carbon-capture/parliamentary-office-of-science-and-technology/carbon-footprint-of-
electricity-generation/file_9270.pdf, [2014-05-15]
Baumann, H., Tillman, A-M., The Hitch Hikers Guide to LCA, an orientation in life cycle assessment
methodology and application, (2004), Studentlitteratur, Lund
Budavari, Z., Szalay, Z., Brown, N., Malmqvist, T., Peuportier, B., Zabalza, I., Krigsvoll, G., Wetzel,
C., Cai, X., Staller, H., Tritthart, W., LoRe-LCA, low resource consumption buildings and
constructions by use of LCA in design and decision making, (2011), [Electronic source] Available at:
http://www.sintef.no/project/LoRe-LCA/Deliverables/LoRE-LCA-WP5-D5.1-EMI_Final.pdf, [2014-
05-15]
Building Research Establishment, Human toxicity, (2014), [Electronic source] Available at:
http://www.bre.co.uk/greenguide/page.jsp?id=2098, [2014-05-15]
Bunea, G., Xavier, G., Rose, D., Nelson, L., Peurach, J., Sunpower, Performance and reliability of
modules with anti-reflective coated glass, (2010), Sunpower corporation, San Jose, CA
Climate change connection, CO2-equivalents, (2009), [Electronic source] Available at:
http://www.climatechangeconnection.org/emissions/CO2_equivalents.htm, [2014-05-14]

92
Danfoss DLX, The Danfoss DLX PV inverter series, (2012), [Electronic source] Available at:
http://solarsysteme.baywa-re.com/media/filer_public/d3/1c/d31cc494-e22c-4471-93c7-
3331acc6cc7f/dksipfp203a202_dlx_factsheet_web.pdf, [2014-05-14]
Division of chemical education, department of chemistry, PURDUE university, Ionizing radiation,
[Electronic source] Available at:
http://chemed.chem.purdue.edu/genchem/topicreview/bp/ch23/radiation.php, [2014-05-15]
DIYTrade, Low density expanded polyethylene foam (EPE) roll, (2008), [Electronic source] Available
at:
http://www.diytrade.com/china/pd/8559255/Low_density_Expanded_Polyethylene_Foam_EPE_Roll.
html, [2014-05-14]
DuPont, Cost-effective photovoltaic junction box housings, (2014), [Electronic source] Available at:
EarthShift, CML 2001, (2012), [Electronic source] Available at:
http://www.earthshift.com/software/simapro/clm2001, [2014-05-14]
EarthShift, Selected LCI results, (2012), [Electronic source] Available at:
http://www.earthshift.com/software/simapro/selectedlci, [2014-05-14]
Ecomii, Coca-Cola dilemma, (2014), [Electronic source] Available at:
http://www.ecomii.com/building/coca-cola-dilemma, [2014-05-15]
EEA, Life cycle assessment – a guide to approaches, experiences and information sources, (2014),
[Electronic source] Available at: http://www.epa.gov/nrmrl/std/lca/pdfs/Issue20report20No206.pdf,
[2014-05-14]
ELS Spelsberg, Connecting System For Photovoltaics, 2009/2010, (2009-2010), Günter Spelsberg
GmbH, Schalksmühle
Energinet.dk, Environmental key figures for electricity, (2013), [Electronic source] Available at:
https://www.energinet.dk/EN/KLIMA-OG-MILJOE/Sider/Environmental-key-figures-for-
electricity.aspx, [2014-05-15]
Energy informative, The real lifespan of a solar system, (2014), [Electronic source] Available at:
http://energyinformative.org/lifespan-solar-panels/, [2014-05-14]

93
Energy Saving Trust, Solar inverters, (2014), [Electronic source] Available at:
http://www.energysavingtrust.org.uk/Generating-energy/Choosing-a-renewable-technology/Solar-
panels-PV/Solar-inverters, [2014-05-14]
EPA, global greenhouse gas emissions data, (2013), [Electronic source] Available at:
http://www.epa.gov/climatechange/ghgemissions/global.html, [2014-05-15]
EPA, global greenhouse gas emissions data, (2013), [Electronic source] Available at:
http://www.epa.gov/climatechange/ghgemissions/global.html, [2014-05-15]
EPD, supporting annexes for environmental product declaration, version 1, (2008), [Electronic
source] Available at: http://www.environdec.com/Documents/GPI/EPD_annexes_080229.pdf, [2014-
05-14]
Europa, Sammanfattning av EU-lagstiftning, (2013), [Electronic source] Available at:
http://europa.eu/legislation_summaries/environment/air_pollution/l28186_sv.htm, [2014-05-15]
European commission, Global irradiation and solar electricity potential, Denmark, [Electronic
source] Available at: http://re.jrc.ec.europa.eu/pvgis/cmaps/eu_cmsaf_opt/G_opt_DK.pdf, [2014-05-
14]
European commission, LCA, Eutrophication, [Electronic source] Available at:
http://qpc.adm.slu.se/7_LCA/page_09.htm, [2014-05-15]
exploringgreentechnology.com, History of solar energy, (2014), [Electronic source] Available at:
http://exploringgreentechnology.com/solar-energy/history-of-solar-energy/, [2014-05-14]
Fraunhofer IBP, Life cycle assessment (LCA) screening of the Maltha recycling process for PV-
modules, (2012), [Electronic source] Available at: http://www.pvcycle.org.uk/wp-
content/uploads/Exec-Summary-LCA-Screening-of-a-Recycling-process-of-silicon-based-PV-
modules-2012-07.pdf, [2014-05-14]
Fthenakis, V., Chul Kim, H., Frischknecht, R., Raugei, M., Sinha, P., Stucki, M., IEA – PVPS – Task
12, Subtask 20, Life cycle inventories and life cycle assessment for photovoltaic systems, (2011)
94
Fthenakis, V., Frischknecht, R., Raugei, M., Chul Kim, H., Alsema, E., Held, M., De Wild-Scholten,
M., IEA – PVPS – Task 12, Subtask 20, Methodology Guidelines on Life Cycle Assessment of
Photovoltaic Electricity, (2011)
GaBi Software, CML 2001, (2012), [Electronic source] Available at: http://database-
documentation.gabi-software.com/support/gabi/gabi-lcia-documentation/cml-2001/, [2014-05-14]
Gaia Solar, Hvem er Gaia Solar, (2014), [Electronic source] Available at:
http://www.gaiasolar.dk/dk/om-gaia-solar/, [2014-05-14]
Gaiddon, B., Jedliczka, M., Environmental benefits of PV system in OECD countries, (2006), Hespul,
Villeurbanne
Gaiddon, B., Jedliczka, M., IEA-PVPS-Task 10, 2006, Compared assessment of selected
environmental indicators of photovoltaic electricity in OECD countries, (2006), Hespul, Villeurbanne
Goedkopp, M., Oele, M., de Schryver, A., Vieira, M., SimaPro database manual, method library,
(2008), report no. 2, [Electronic source] Available at: http://www.pre-
sustainability.com/download/manuals/DatabaseManualMethods.pdf, [2014-05-15], PRé consultants,
Netherlands
Hischier, R., Weidema, B., Althaus, H-J., Bauer, C., Doka, G., Dones, R., Frischknecht, R., Hellweg,
S., Humbert, S., Jungbluth, N., Köllner, T., Loerincik, Y., Margni, M., Nemecek, T., Ecoinvent,
implementation of life cycle impact assessment method, (2010), report no. 3, [Electronic source]
Available at: http://www.ecoinvent.org/fileadmin/documents/en/03_LCIA-Implementation-v2.2.pdf,
[2014-05-15]
http://www.dupont.com/products-and-services/plastics-polymers-resins/thermoplastics/case-
studies/pv-junction-box-housings.html, [2014-05-14]
IEA, World Energy Outlook 2013 factsheet, (2013), [Electronic source] Available at:
http://www.iea.org/media/files/WEO2013_factsheets.pdf, [2014-05-15]
Ifu Hamburg, Ecoinvent: Transport – what is the difference between operation and transport in the
lorry database, (2012), [Electronic source] Available at: https://www2.ifu-
hh.de/otrs/public.pl?Action=PublicFAQZoom;ItemID=37, [2014-05-15]

95
ISO 14 040, Environmental management - Life cycle assessment - Principles and framework, (2006),
second ed.,
ISO 14 041, Environmental management- Life cycle assessment- Goal and scope definition and
inventory analysis, (1998), First ed.
ISO 14 044, Environmental management – Life cycle assessment – requirements and guidelines,
(2006), First ed.
Jacobs, D.J., Introduction to atmospheric chemistry, (1999), Princeton University Press, New Jersey
Jordan, D.C., Kurtz, S.R., Photovoltaic degradation rates- An analytical review, (2012), Journal
article: NREL/JA-5200-51664, [Electronic source] Available at:
http://www.nrel.gov/docs/fy12osti/51664.pdf, [2014-05-14]
Jungbluth, N., Stucki, N., Frischknecht, R., Part XII- Photovoltaics, Ecoinvent- report No.6, part XII,
Swiss center for Life Cycle Inventories, Dübendorf, CH, (2009)
Madico, Quality and the Environment, (2014), [Electronic source] Available at:
http://www.madico.com/about/manufacturing/quality/, [2014-05-14]
NovoGlass, Noval ultra clear low-iron glass, [Electronic source] Available at:
http://www.novalglass.com/DownLoad/Ultra-Clear-Float-Glass.pdf, [2014-05-14]
NSG Group, Pilkington group limited, Solar glass for solar panels, (2013), [Electronic source]
Available at: http://www.pilkington.com/products/bp/bybenefit/solarenergy/home.htm, [2014-05-14]
PE International Sustainability Performance, A brief history of life cycle assessment (LCA), (2014),
[Electronic source] Available at: http://www.pe-international.com/company/newsroom/news-
detail/article/a-brief-history-of-life-cycle-assessment-lca/, [2014-05-14]
Pfister, S., Water resource in LCA, existing methods, regionalized aspects and future development,
ETH Zurich, (2010), [Electronic source] Available at: http://formations.cirad.fr/analyse-cycle-de-
vie/pdf/StephanPfister.pdf, [2014-05-15]

96
Prof. Joillet, O., Norris, G.A.., Science network, Life cycle assessment – lecture 2, (2003), [Electronic
source] Available at: www.sciencenetwork.com/lca/lesson_2.pps, [2014-05-14]
PV Cycle, Find a collection point, (2013), [Electronic source] Available at:
http://www.pvcycle.org/collection-points/map/, location: Skanderborg, Horsensvej 91-93, [2014-05-
15]
Renewable energy world, BOS Series: Your new solar array, (2012), [Electronic source] Available at:
http://www.renewableenergyworld.com/rea/news/article/2012/04/your-new-solar-array-actual-
performance-may-vary, [2014-05-14]
Röhrlich, M., Mistry, M., Martens, P.N., Bunterbach, S., Ruhrberg, M., Dienhart, M., Briem, S.,
Quinkertz, R., Alkan, Z., Kugeler, K., LCA Case Studies, A method to calculate the cumulative energy
demand (CED) of lignite extraction, (2000), Journal: The international journal of life cycle
assessment, Volume 5, Issue 6, ecomed publisher, Landsberg, DE.
Rydh, C.J., Lindahl, M., Tingström, J., Livscykelanalys, en metod för miljöbedömning av produkter
och tjänster, (2002), ed. 1:7, Studentlitteratur AB, Lund
SMA, Performance ration – quality factor for PV plant, (2010), Version 1, [Electronic source]
Available at: http://files.sma.de/dl/7680/Perfratio-UEN100810.pdf, [2014-05-14]
SolarContact, How to compare solar panels, (2014), [Electronic source] Available at:
http://www.solarcontact.com/solar-panels/types/solar-panel-efficiency, [2014-05-14]
SPANCraft Glass, Low iron glass, 2014, [Electronic source] Available at:
http://www.spancraft.com/low-iron-glass.shtml, [2014-05-14]
STONE, stonecourse, Life cycle impact assessment, [Electronic source] Available at:
http://www.stonecourses.net/environment/impactlca.html, [2014-05-14]
STONE, stonecourses, Life cycle inventory analysis, [Electronic source] Available at:
http://www.stonecourses.net/environment/invlca.html, [2014-05-14]
97
STR Holdings Inc, STR protected benefits, (2014), [Electronic source] Available at:
http://www.strsolar.com/str-protected/benefits/, [2014-05-14]
Sunrise, monocrystalline solar cells, 3 bus, (2012), [Electronic source] Available at:
http://www.sunriseglobalsolar.com/document/mono3bb.pdf, [2014-05-15]
Sweden green building council, GreenBuilding – certifikat i energibesparing och energieffektivisering,
(2014), [Electronic source] Available at: http://www.sgbc.se/certifieringssystem/greenbuilding, [2014-
05-14]
The initiative for renewable energy in architecture, The initiative for renewable energy in architecture,
(2008), [Electronic source] Available at: http://www.rearch.umn.edu/, [2014-05-14]
UNEP, Water scarcity index, (2008), [Electronic source] Available at:
http://www.unep.org/dewa/vitalwater/article77.html, [2014-05-15]
Uniformed service university of health and science, What is ionizing radiation, (2014), [Electronic
source] Available at: http://www.usuhs.edu/afrri/outreach/ionizing.htm, [2014-05-15]
Vindico, PHOTOVOLTAIC GLASS STUDY, [Electronic source] Available at:
http://www.vindico.info/PDF/PP%20Vindico%20PV+(v5).pdf, [2014-05-14]
World nuclear association, Nuclear radiation and health effects, (2014), [Electronic source] Available
at: http://www.world-nuclear.org/info/Safety-and-Security/Radiation-and-Health/Nuclear-Radiation-
and-Health-Effects/, [2014-05-15]
World steel association, Interpretations – Objectives, (2012), [Electronic source] Available at:
http://www.steeluniversity.org/content/html/eng/default.asp?catid=146&pageid=2081271783, [2014-
05-14]
Ziegel, Depletion of the stratospheric ozone layer, [Electronic source] Available at:
http://www.ziegel.at/gbc-ziegelhandbuch/eng/umwelt/wirkkatodp.htm, [2014-05-15]

98

99
Appendix 1, Calculations
Recalculation of aluminum recycling from roof installation
950 kg CO2 is reduced by recycling aluminum from frames.
A approximated value for the aluminum weight of a standard module frame is made in IEA PVPS
Task 12, Life cycle inventories and life cycle assessment of photovoltaic systems, page 31. The
estimated weight for a 1,6 m2 module is 4,2 kg resulting in 2,63 kg aluminum/m2 panel.
The weight of a panel in the LCA recycling study is 22,4 kg151
. The function unit for the study is 1000
kg PV modules. This means that (4,2/22,4)*1000 = 187,5 kg aluminum frame is represented in the
LCA recycling study.
In figure 13 the results for aluminum primary materials show that approximately 950 kg CO2-eq are
saved per (FU) 1000 kg modules or 950 kg CO2-eq are saved per 187,5 kg aluminum. This means that
950/187,5 = 5,07 kg CO2-eq/kg aluminum is saved.
In the case of this LCA, the roof installation is assumed to consist mostly of aluminum but calculations
will be performed in order to represent the aluminum part only. Thus no recycling will be assumed for
the other mounting parts.
Roof installation is 3,54 kg/m2 and of that, 2,2 kg is aluminum. This is the actual data for roof
installation provided by Gaia Solar. The roof installation area is 21,37 m2 thus resulting in a total
aluminum mass of 21,37*2,2 = 47 kg. The weight percentage of aluminum from the roof installation is
2,2/3,54=62,2%. This means that only 62,2 % of Ecoinvent data will be allocated and recalculated to
represent a case for aluminum recycling.
Presented below is the data for 1 m2 of roof installation. This data has to be multiplied by 21,37 to
represent the case for a 3 000 Wp PV system.
Table 29: Environmental impacts for 1 m2 roof installation from Ecoinvent.
Roof installation
Acidification Potential
0,17261
GWP 100a 38,236
Eutrophication Potential
0,084
ODP 10a 2,5739E-06
Data below represent the whole roof installation for a 3 000 Wp system.
151
Executive summery, Life cycle assessment (LCA) screening of the Maltha recycling process for si-pv
modules, http://www.pvcycle.org//wp-content/uploads/Exec-Summary-LCA-Screening-of-a-Recycling-process-
of-silicon-based-PV-modules-2012-07.pdf

100
Table 30: Environmental impacts for 3 000 Wp PV system roof installation, based on Ecoinvent data.
Roof installation
Acidification Potential
3,68833048
GWP 100a 817,026848
Eutrophication Potential
1,794912
ODP 10a 5,49991E-05
Now the percentage of aluminum, 62,2%, of the total roof installation is extracted and the case for
aluminum only is presented below. Basically all the data above is multiplied by 0,62.
Table 31: Environmental impacts for aluminum only, for 3 000 Wp PV system roof installation.
Roof installation
Acidification Potential
2,212998288
GWP 100a
490,2161088
Eutrophication Potential
1,0769472
ODP 10a 3,29995E-05
This is the data for the aluminum part of the total roof installation. The difference is presented below.
It is of importance in order to obtain the remaining materials of the roof installation. The table below
thus presents only the remaining weight of the roof installation.
Table 32: Difference in environmental impacts between the whole roof installation and the aluminum parts in a
3 000 kWp PV system.
DIFF
Roof installation
Acidification Potential
1,475332192
GWP 100a
326,8107392
Eutrophication Potential
0,7179648
ODP 10a
2,19996E-05

101
The table below shows the saved impact and the final impact from the roof installation aluminum for a
3 000 Wp PV system.
Table 33: Saved and final environmental impacts for the aluminum part of a whole roof installation for a 3 000
Wp PV system.
Saved Final
%
roof installation roof installation
Acidification Potential
70% 1,549098802 0,663899486
GWP 100a
59% 289,2275042 200,9886046
Eutrophication Potential
40% 0,43077888 0,64616832
ODP 10a 40% 1,31998E-05 1,97997E-05
The ozone depletion potential (ODP) was not presented in the study but will be assumed to equal the
lowest presented result. This can be discussed further, but in order to be as honest and trustworthy one
cannot assume optimal values for a unknown category. Assuming the lowest value on the other hand is
more moral. Therefore the ODP is assumed to be reduced by 40% only.
Below are the final values for recycled aluminum are rejoined with the remaining parts which were not
assumed to be recycled, noted as DIFF above.
Table 34: Final recycled aluminum with remaining non-recycled parts of the roof installation and the total final
combined results for a 3 000 Wp PV system roof installation with recycled aluminum parts.
Final rest mtrl
Sum total roof installation with Al recycling
roof installation Roof installation roof installation Acidification
Potential 0,663899486 1,475332192 2,139231678
GWP 100a 200,9886046 326,8107392 527,7993438 Eutrophication
Potential 0,64616832 0,7179648 1,36413312
ODP 10a 1,97997E-05 2,19996E-05 4,17993E-05
Human effect category, land use, water use and resources can unfortunately not be presented because
of lack of such impact category data in recycling LCA. Instead they will not be converted and
benefited by recycling. The original data, without recycling, will be used for these impact categories.
Recalculation of energy wen recycling aluminum in roof installation

102
The same method is used to calculate the final energy from the roof installation after including gains
in energy from recycling of aluminum in roof installation. Because the recycling LCA only presents
energy as a whole category and not as detailed as in this study, per source of energy, all the energy
sources will be reduced in equal amount. It is as if all separately presented energy sources in this LCA
are added up like the recycling LCA and the recalculated. Each source will thus be lowered by the
same percentage. The percentage of energy gain by recycling is obtained from LCA recycling diagram
along with the remaining impact categories (global warming potential, acidification potential etc.).
The table below presents the energy required for production of a roof installation from Ecoinvent data
before the recycling is considered. Data is adjusted to represent the Gaia Solar case, thus lower than
the original roof installation CED.
Table 35: Energy required for the production of a whole roof installation to a 3 000 Wp PV system, with data
from Ecoinvent.
Roof installation renewable energy
resources, biomass 35,3748209
non-renewable energy resources, fossil
2524,593755
non-renewable energy resources, nuclear
645,7200231
non-renewable energy resources, primary
forest 0,012912026
renewable energy resources, solar,
converted 0,057912996
renewable energy resources, potential (in barrage water),
converted 536,3173991
renewable energy resources, kinetic (in
wind), converted 4,069656529
The table below is obtained the same way as the aluminum recycling was obtained above. The
recalculation steps will thus not be presented here and only the final result will. The final energy use
for production of roof installation with recycled aluminum is presented below under the section
“final”.
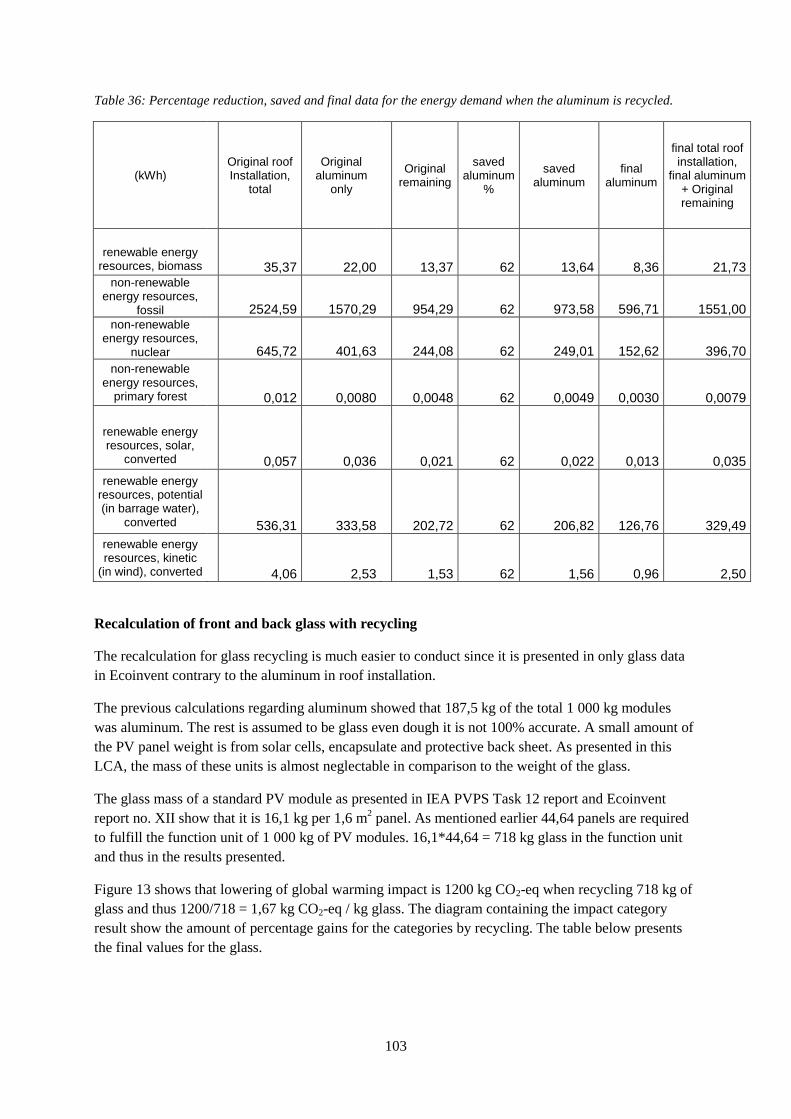
103
Table 36: Percentage reduction, saved and final data for the energy demand when the aluminum is recycled.
(kWh)
Original roof Installation,
total
Original aluminum
only
Original remaining
saved aluminum
%
saved aluminum
final aluminum
final total roof installation,
final aluminum + Original remaining
renewable energy resources, biomass
35,37 22,00
13,37 62 13,64 8,36 21,73
non-renewable energy resources,
fossil
2524,59 1570,29
954,29 62 973,58 596,71 1551,00
non-renewable energy resources,
nuclear
645,72 401,63
244,08 62 249,01 152,62 396,70
non-renewable energy resources,
primary forest
0,012 0,0080
0,0048 62 0,0049 0,0030 0,0079
renewable energy resources, solar,
converted
0,057 0,036
0,021 62 0,022 0,013 0,035
renewable energy resources, potential (in barrage water),
converted
536,31 333,58
202,72 62 206,82 126,76 329,49
renewable energy resources, kinetic
(in wind), converted
4,06 2,53
1,53 62 1,56 0,96 2,50
Recalculation of front and back glass with recycling
The recalculation for glass recycling is much easier to conduct since it is presented in only glass data
in Ecoinvent contrary to the aluminum in roof installation.
The previous calculations regarding aluminum showed that 187,5 kg of the total 1 000 kg modules
was aluminum. The rest is assumed to be glass even dough it is not 100% accurate. A small amount of
the PV panel weight is from solar cells, encapsulate and protective back sheet. As presented in this
LCA, the mass of these units is almost neglectable in comparison to the weight of the glass.
The glass mass of a standard PV module as presented in IEA PVPS Task 12 report and Ecoinvent
report no. XII show that it is 16,1 kg per 1,6 m2 panel. As mentioned earlier 44,64 panels are required
to fulfill the function unit of 1 000 kg of PV modules. 16,1*44,64 = 718 kg glass in the function unit
and thus in the results presented.
Figure 13 shows that lowering of global warming impact is 1200 kg CO2-eq when recycling 718 kg of
glass and thus 1200/718 = 1,67 kg CO2-eq / kg glass. The diagram containing the impact category
result show the amount of percentage gains for the categories by recycling. The table below presents
the final values for the glass.

104
Table 37: Original, percentage reduction, saved and final data for the environmental impacts for glass recycling
for a 3 000 Wp PV system.
Original reduction in % Saved Final
GWP, kg CO2-Eq 377,0151 40 150,80604 226,2091
AP, kg SO2-Eq 3,2674565 25 0,816864125 2,450592
EP, kg Nox-Eq 2,124507 55 1,16847885 0,956028
ODP. Kg CFC-11-Eq 4,60383E-05 40 1,84153E-05 2,76E-05
The recycling process spears the production and excavation of new resources in order to obtain glass.
Due to lack of impact categories for human effect, water and land use in the recycling LCA, the gains
from recycling will not be implemented on those categories.

105
Appendix 2, Energy comparison between EG and SoG-silicon
pathway and inverter data Table 38: Electricity required for production of 1 kg purified silicon from two different pathways.
Table 39: Unit process raw data for MG-silicon from silica sand. Source Ecoinvent.

106
Table 40: Material composition for 1 inverter, 2 400 W. Source Jungbluth, N., et.al., op.cit., p. 105

107
Appendix 3, Unit process raw data
Table 41: Unit process raw data for solar cells part 1.
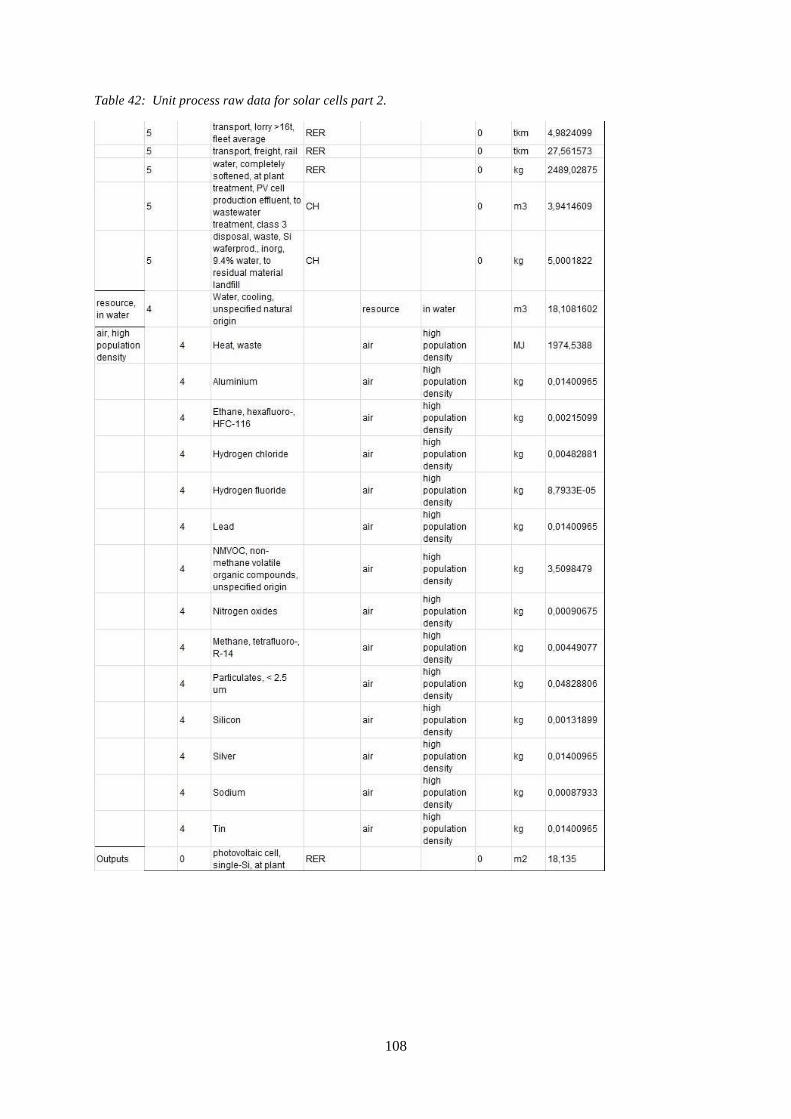
108
Table 42: Unit process raw data for solar cells part 2.

109
Table 43: Unit process raw data for solar cells part 3.

110
Table 44: Unit process raw data for solar cells part 4.

111
Table 45: Unit process raw data for production of the inverters.

112
Table 46: Unit process raw data for the electric installation.
Table 47: Unit process raw data for the encapsulate.

113
Table 48: Unit process raw data for front and back glass.

114
Table 49: Unit process raw data for protective back sheet, part 1.
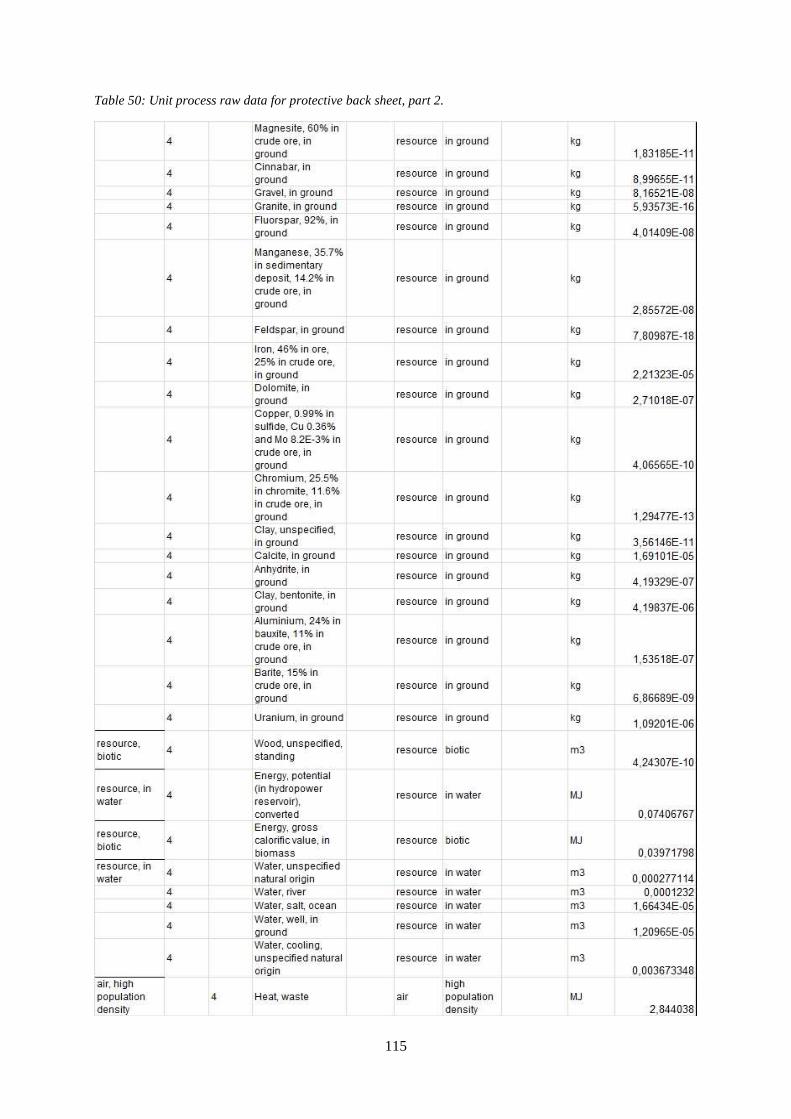
115
Table 50: Unit process raw data for protective back sheet, part 2.

116
Table 51: Unit process raw data for protective back sheet, part 3.

117
Table 52: Unit process raw data for protective back sheet, part 4.

118
Table 53: Unit process raw data for protective back sheet, part 5.
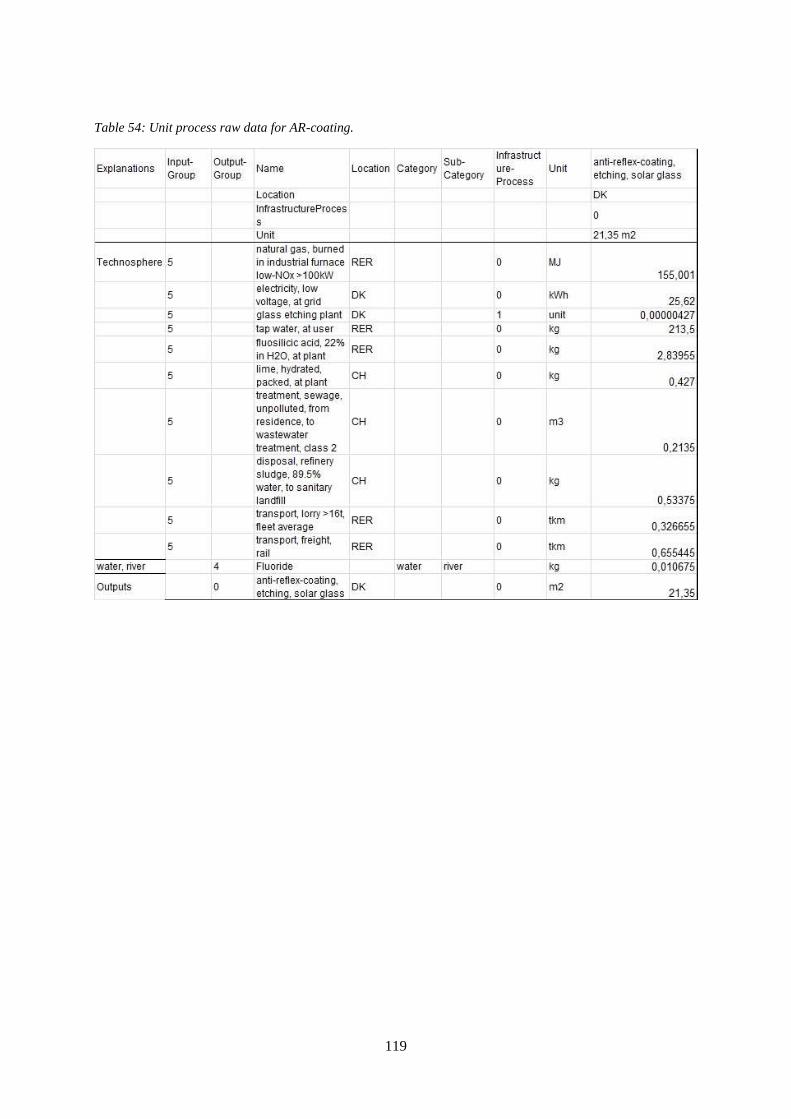
119
Table 54: Unit process raw data for AR-coating.
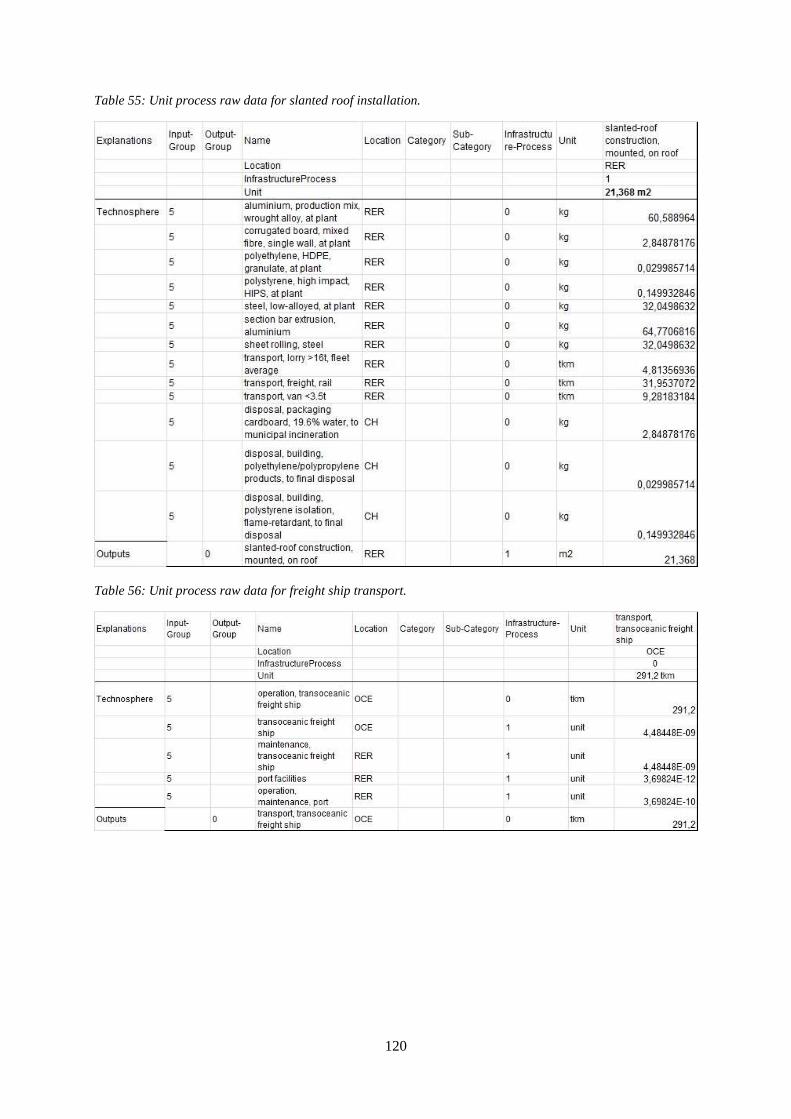
120
Table 55: Unit process raw data for slanted roof installation.
Table 56: Unit process raw data for freight ship transport.
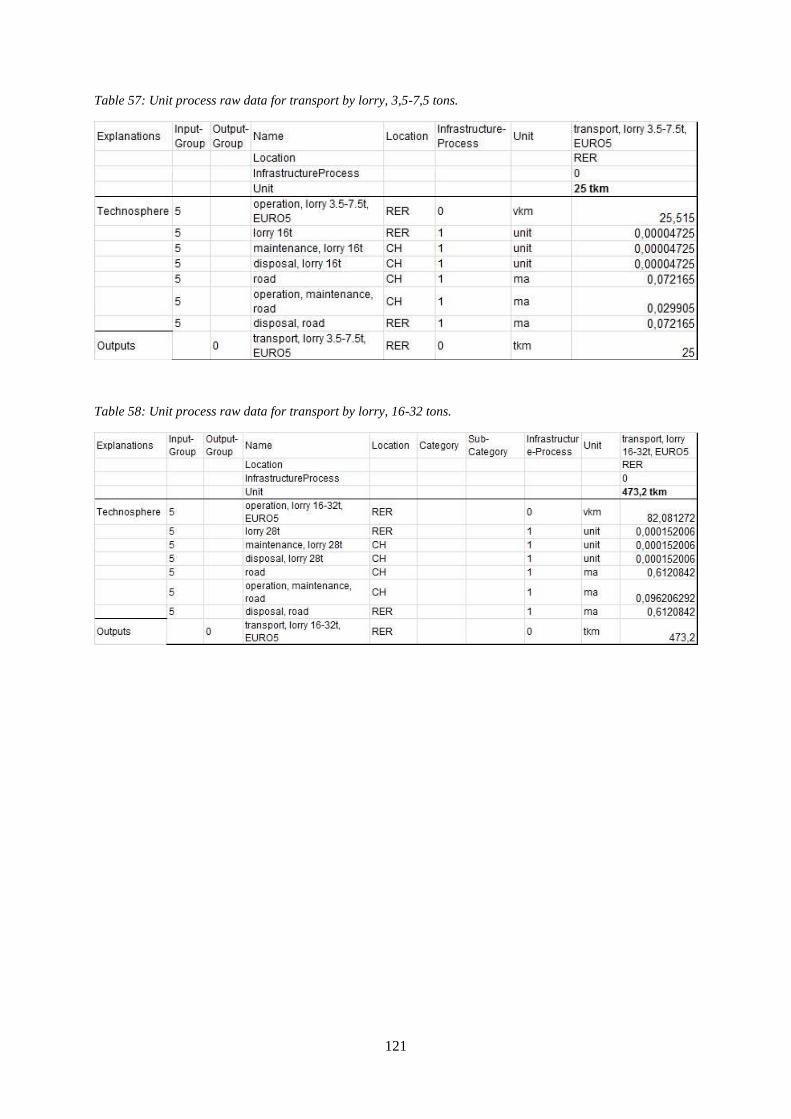
121
Table 57: Unit process raw data for transport by lorry, 3,5-7,5 tons.
Table 58: Unit process raw data for transport by lorry, 16-32 tons.

122

123
Appendix 4, Metadata
Table 59: Metadata for silica sand.

124
Table 60: Metadata for MG-silicon.
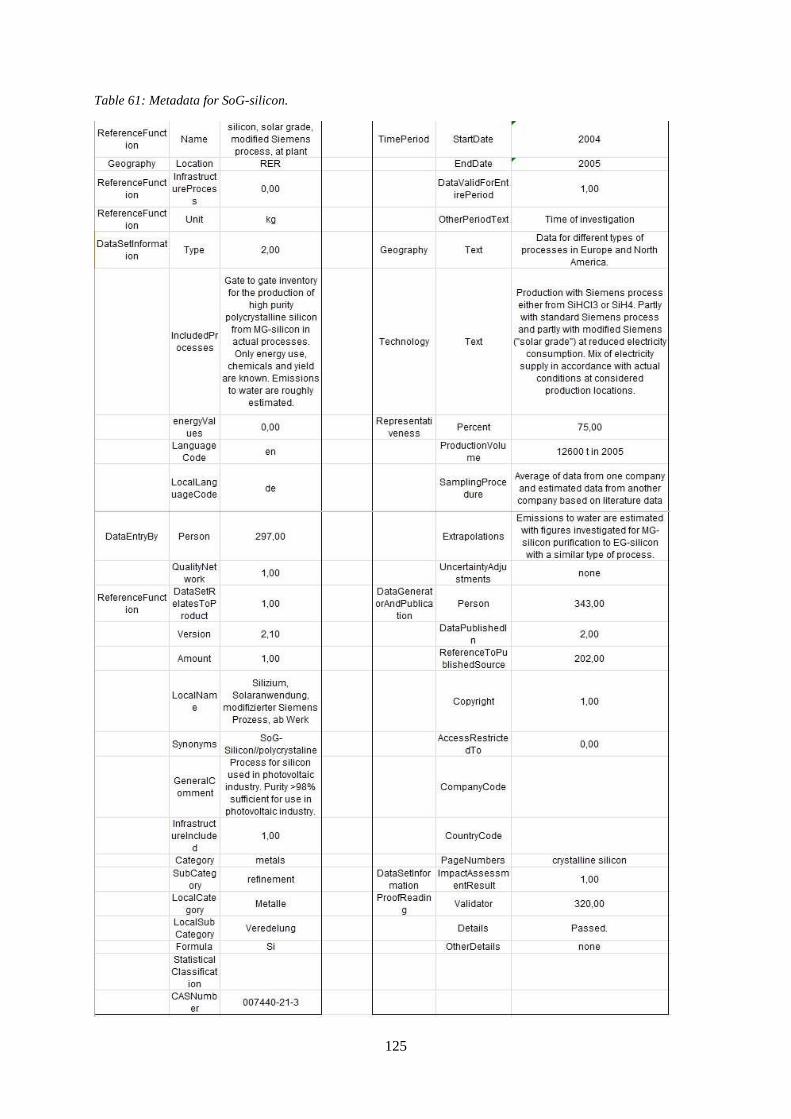
125
Table 61: Metadata for SoG-silicon.

126
Table 62: Metadata for silicon production mix.

127
Table 63: Metadata for CZ single silicon.

128
Table 64: Metadata for single silicon wafers.

129
Table 65: Metadata for photovoltaic cell.
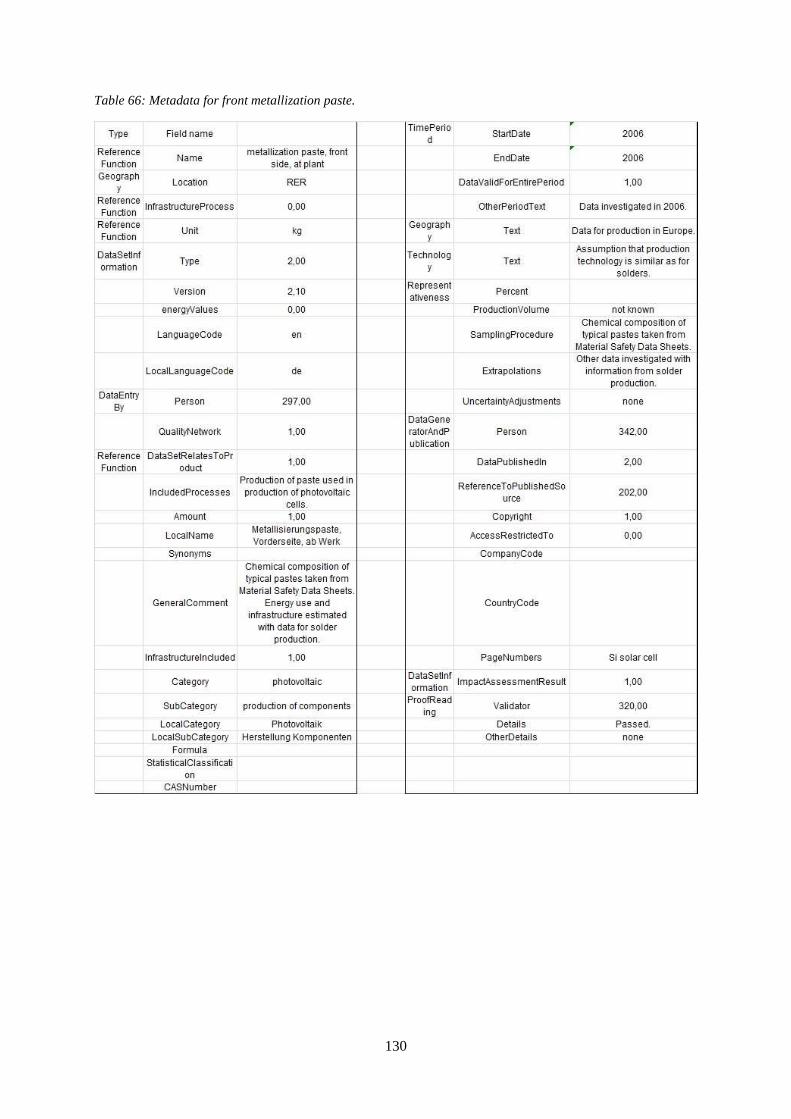
130
Table 66: Metadata for front metallization paste.
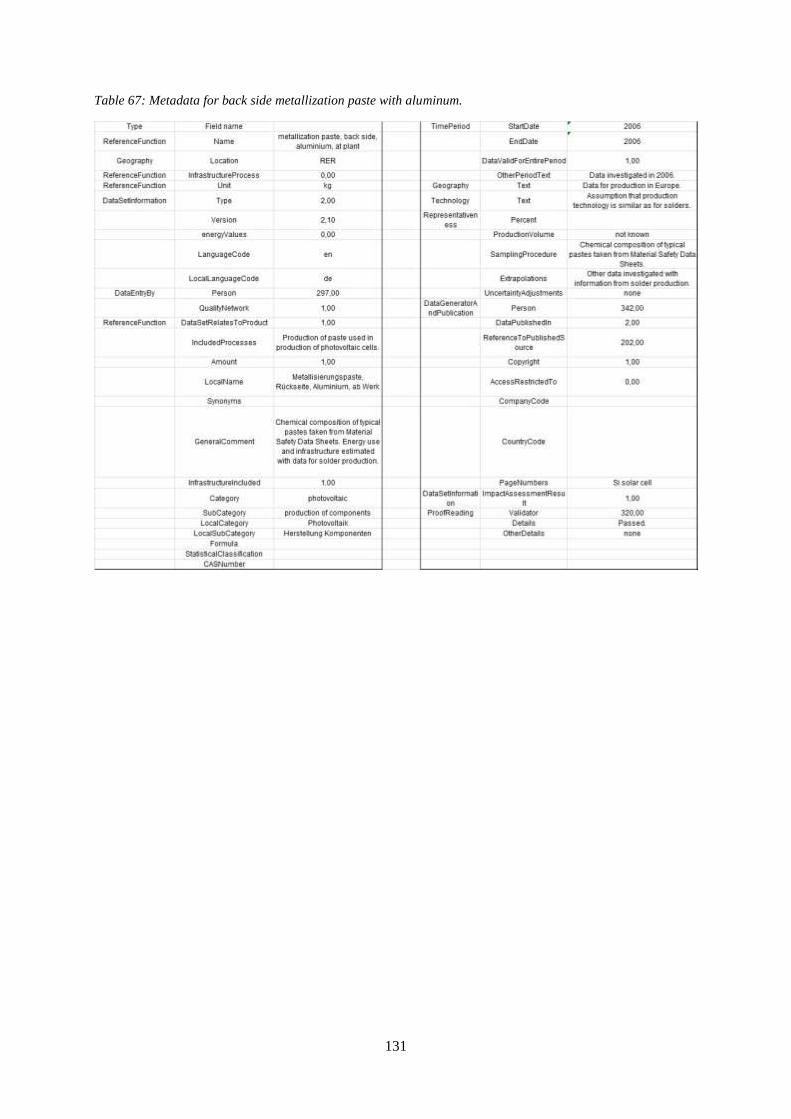
131
Table 67: Metadata for back side metallization paste with aluminum.

132
Table 68: Metadata for back side metallization paste.

133
Table 69: Metadata for inverter, 2 400 W.

134
Table 70: Metadata for electric installation.

135
Table 71: Metadata for roof installation.

136
Table 72: Metadata for AR-coating.
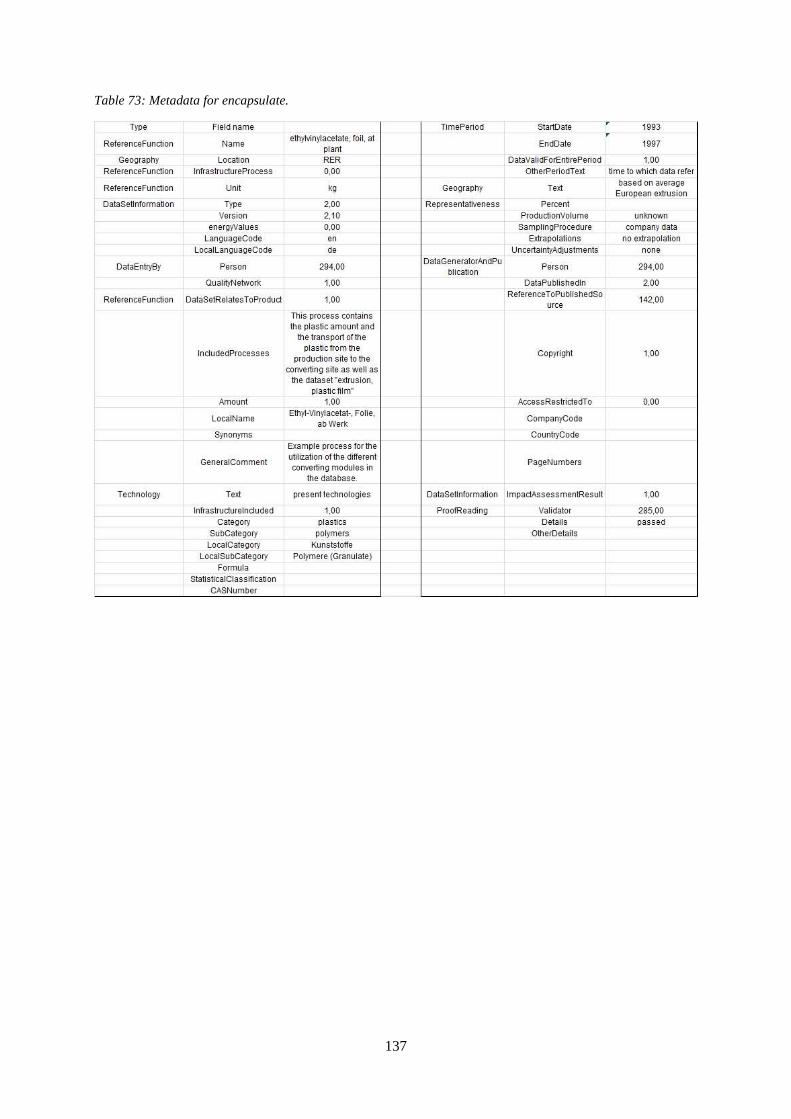
137
Table 73: Metadata for encapsulate.

138
Table 74: Metadata for front and back glass.
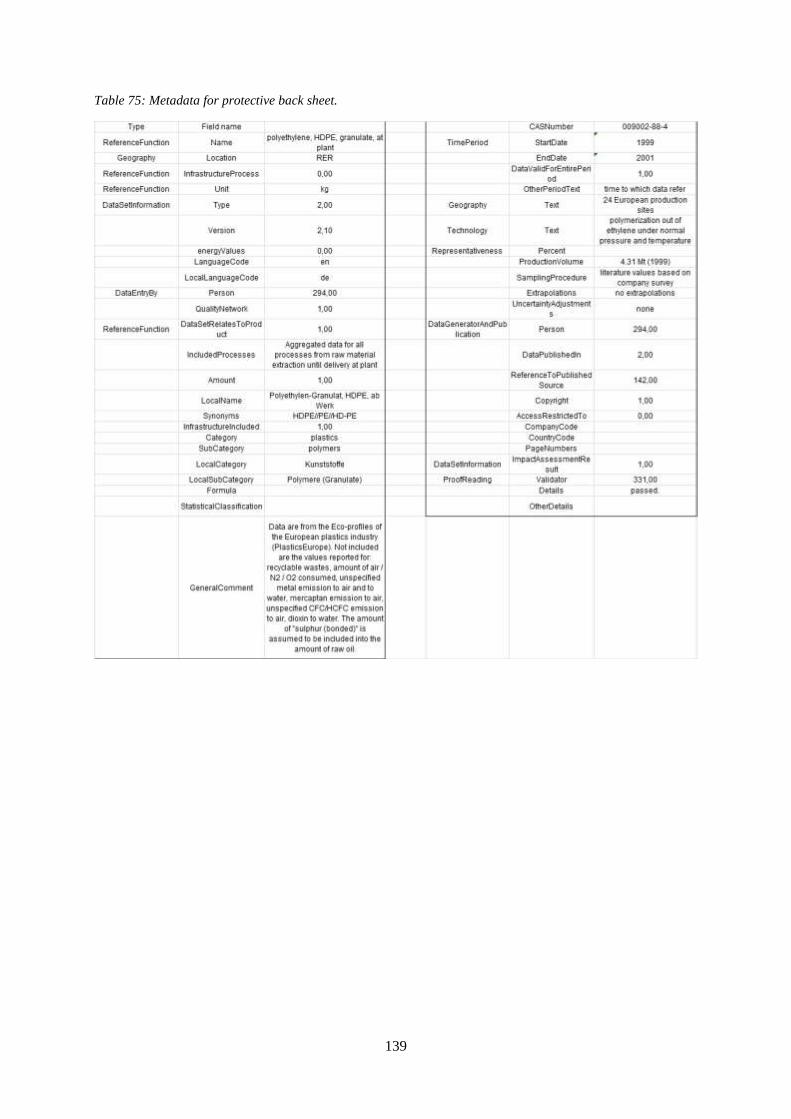
139
Table 75: Metadata for protective back sheet.

140
Table 76: Metadata for transport with freight ship.

141
Table 77: Metadata for transport with lorry 16-32 tons, EURO 5.

142
Table 78: Metadata for transport with lorry 3,5 - 7,5 tons, EURO 5.

143
Appendix 5, impact categories result, resources, degradation
and production data
Table 79: Results from impact categories by process per function unit for 30 years PV system lifetime.
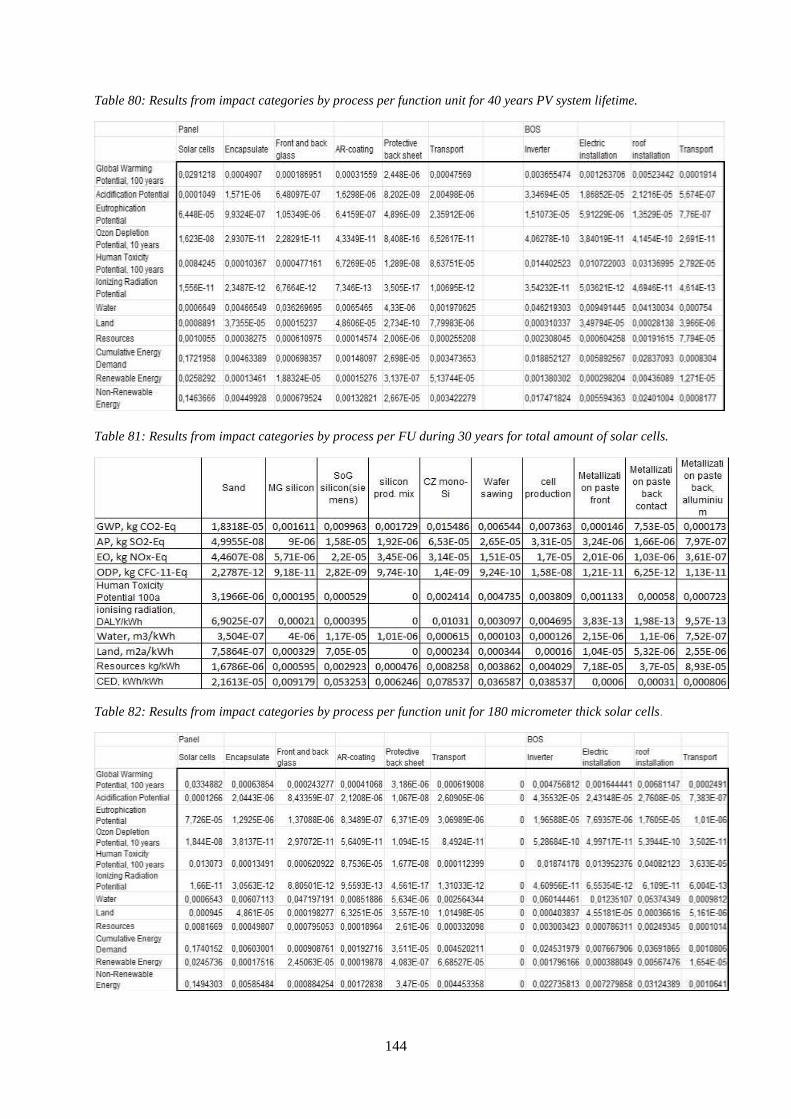
144
Table 80: Results from impact categories by process per function unit for 40 years PV system lifetime.
Table 81: Results from impact categories by process per FU during 30 years for total amount of solar cells.
Table 82: Results from impact categories by process per function unit for 180 micrometer thick solar cells.

145
Table 83: Recourses for PV system per function unit for 30 years lifetime.
Table 84: Recourses for PV system per function unit for 40 years lifetime.
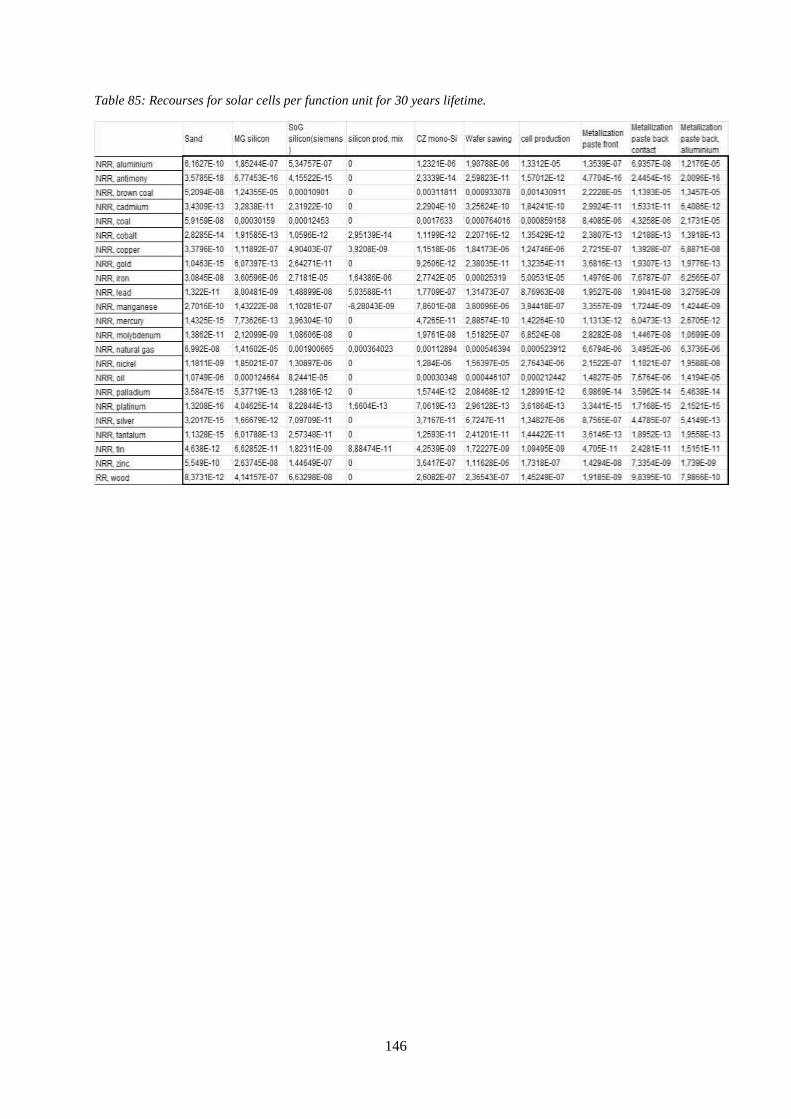
146
Table 85: Recourses for solar cells per function unit for 30 years lifetime.

147
Table 86: Recourses for PV system per function unit for 40 years lifetime.

148
Table 87: Energy production during 30 and 4o years for optimal tilted 3 000 Wp PV system in Denmark
including degradation.

149
Table 88: Raw data for the comparison between 270 and 180 micrometer thick solar cells.