Embed Size (px)
Citation preview
1
Life cycle assessment of Particleboard, Medium Density Fiberboard, and Hardboard/Engineered Wood Siding & Trim A white paper on the science-based LCA reports of three wood composite panels1 1 Background The demand for green products because of their favorable environmental performance is increasing in the marketplace. The Consortium for Research on Renewable Industrial Materials (CORRIM) recently conducted life-cycle assessments (LCAs) documenting the environmental performance of particleboard and medium density fiberboard (MDF) panel products made from wood residue resources (Puettmann and Salazar 2018, “LCA MDF” and “LCA Particleboard”). A cradle-to-gate LCA on hardboard/engineered wood siding and trim (EWST) was conducted previously and reported using the same environmental metrics (Bergman 2015, “LCI Hardboard”; Puettmann et al. 2016, “LCA Hardboard”). Each product LCA was then used to develop an Environmental Product Declaration (EPD)2. These studies are based on international standards for conducting LCAs and the North American Product Category Rules (PCR) for developing EPDs (FPInnovations 20153). The three LCAs conducted used a declared unit of 1.0 m3 of finished panel product ready for shipment. The cradle-to-gate system boundary included resources and raw material consumption, energy use, and emissions to air, water, and land from seedling establishment through final product. Biogenic carbon flows were also reported, as per the PCR requirements. Life cycle impact assessments results were reported for global warming potential (GWP), acidification, eutrophication, ozone, and smog impact categories. Energy consumption for fossil, renewable, nuclear, wind, hydroelectric, and solar were calculated based on higher heating values. Other categories reported, as required by the PCR, were total renewable and non-renewable resource use, freshwater use, and solid waste. A comparison to alternative materials of steel, cement, plastic, and glass are reported for the same impact categories used for particleboard, MDF, and hardboard/EWST. The wood panel products were determined to have lower environmental impacts over most impact categories compared to most alternative building materials. Wood composite panels had environmental benefits in terms of resource renewability and sustainability, renewable resource use efficiency, renewable biomass fuel use, lower carbon emissions, and for most cases in acidification, eutrophication and smog impact indices. In conclusion, it was determined that wood composite panels have an overall lower environmental footprint, based on environmental factors and analyses presented in this paper. 1 Prepared by Maureen Puettmann, PhD, WoodLife Environmental Consultants, Corvallis, Oregon. 2 See the Composite Panel Association website, “Environmental Product Declarations,” https://www.compositepanel.org/education-resources/environmental-product-declarations.html. 3 The wood composite panel LCAs reported in the paper were performed prior to the completion of the new PCR (ULE 2019), which is still under public review at the time of this publication.
2
2 Introduction The United States (US) is moving to a green marketplace in an effort to meet the demands of environmentally conscious consumers. Consumers increasingly want to purchase green products, whether to follow their personal beliefs or to meet various purchasing and building green guidelines and standards. The challenge for the consumer is to determine what is really “green”; while it is easy to say that a product or material is green, this attribute is best defined by science-based analysis of the many aspects of what it takes to be a green material or product. The science-based approach—referred to as a cradle-to-gate analysis—documents the environmental impact of manufacturing a product from its in-ground resources through all of the aspects of production and transportation it takes to produce the finished product. If a product’s end-use and method of disposal or recycling is known, a cradle-to-grave analysis can also be done. These analyses can be used to establish whether or not a product is green by assessing its impact upon such environmental factors as resource use; climate change, in terms of net carbon flow; energy use; fossil fuel use and emissions to air, water, and land; and how its performance compares to alternative product selections. The Consortium for Research on Renewable Industrial Materials (CORRIM) has derived lifecycle inventory (LCI) data for major wood products and wood production regions in the US.4 The LCI data cover forest regeneration, growth, and harvesting through to wood product production at the mill gate. Over 20 years of research has covered 14 major forest products, including both structural and nonstructural uses and four major wood producing regions. This paper is based on the third-party certified LCA reports for the wood composite panels (WCP): particleboard, MDF, and hardboard/EWST (Puettmann et al. 2016, “LCA Hardboard”; Puettmann and Salazar 2018, “LCA MDF” and “LCA Particleboard”). Life-cycle assessment has evolved as an internationally accepted method to analyze complex impacts and outputs of a product or process and the corresponding effects they might have on the environment. The key component in an LCA is the LCI, which is an objective, data-based process of quantifying energy and raw material requirements, air emissions, waterborne effluents, solid waste, and other environmental releases occurring within the system boundaries. It is this information that provides a quantitative basis for comparing wood products, their manufacturing processes and, most importantly from the forest industry point of view, their performance against competing products made from other resources. The life-cycle impact assessment (LCIA) process characterizes and assesses the effects of environmental
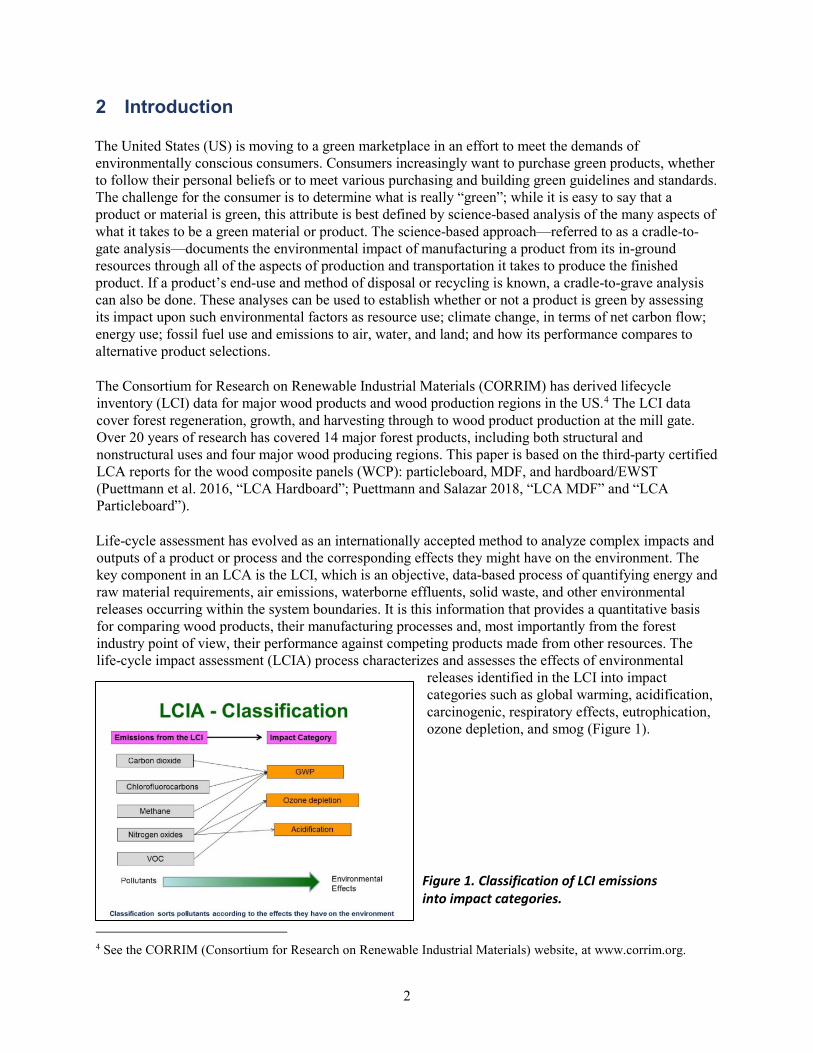
releases identified in the LCI into impact categories such as global warming, acidification, carcinogenic, respiratory effects, eutrophication, ozone depletion, and smog (Figure 1).
4 See the CORRIM (Consortium for Research on Renewable Industrial Materials) website, at www.corrim.org.
Figure 1. Classification of LCI emissions into impact categories.

3
Figure 2 shows the boundary of the cradle-to-gate LCA for WCP from in-ground resources through to manufacture of the product.
Figure 2. Cradle-to-gate system boundary for wood composite panel (WCP).
Particleboard, MDF, and hardboard/EWST panels are manufactured to strict mechanical and environmental standards (Table 1). They can be produced from industrial wood residues, a coproduct from primary wood products manufacturing (pre-consumer residues) and post-consumer residues. Residues can be shavings, sawdust, plywood trim, chips, whole logs, urban wood waste (post-consumer residues), and/or agriculture-fiber sources. Wood composite panels are produced by mixing uniform wood residues (particles or fibers) with resin, wax, and other additives to form panels, which are then consolidated and cured under pressure and heat, and then sanded and trimmed to the desired dimensions. These non-structural panels can be used industrially to manufacture products such as furniture components, cabinets, tables, countertops, paneling, moulded door skins, and millwork, and can be used in building construction as flooring underlayment (Figure 3). Table 1. Standards for wood composite panels.
Particleboard MDF Hardboard EWST ANSI A208.1-2016 ANSI A208- 2016 ANSI A135.4-2012 ANSI A135.6-2012 CPA 4-11 ECC CPA 4-11 ECC CPA 4-11 ECC ANSI A135.7-2012 CARB ATCM 93120 CARB ATCM 93120 CARB ATCM 93120 CPA 4-11 ECC CAN.CSA-0160-16 CARB ATCM 93120 EPA TSCA Title VI

4
Figure 3. Particleboard, medium density, and hardboard/engineered wood siding and trim (EWST).
3 Data Collection and Analysis Primary data for the WCP LCIs were collected through industry direct surveys in accordance with CORRIM guidelines for conducting wood product LCAs, ISO 14044, 14040, 14025, and 21930 (ISO 2006a-d), and the PCR (FPInnovations 2015). This study relied almost exclusively on production input requirements and emissions output data provided by WCP producers in the US and Canada. The survey data represents WCP production in terms of input materials and resources, electricity, and fuel use, and emissions for the 2016 production year for particleboard and MDF and 2013 for hardboard/EWST. The wood residue came from a variety of co-products produced in both hardwood and softwood lumber mills and softwood plywood facilities in the Pacific Northwest, Southeast, and Northeast-Northcentral regions of the US and in Canada (Bergman and Bowe 2008, “NENC Hardwood Lumber”; Bergman and Bowe. 2010 “NENC Softwood Lumber”; Bergman and Bowe 2012 “SE Hardwood Lumber”; Milota 2015, “LCA PNW Lumber” and “LCA SE Lumber”; Puettmann et al. 2016, “LCA PNW Plywood” and “LCA SE Plywood”). Total production of particleboard, MDF, hardboard/EWST was 5.9, 4.0, and 0.65 million m3, respectively. Manufacturer production and number of manufacturers that contributed to these LCA studies are presented in Table 2.
Table 2. Survey respondents’ contribution to MDF, particleboard, and hardboard/EWST production in the United States and Canada.
PARTICLEBOARD MDF HARDBOARD
/EWST Cubic meter (m3) of annual production5
Production year 2017 2017 2012
Survey 3,761,022 1,803,030 269,651
Number of Manufacturer Respondents 8 9 4
Survey Percent of Total Production 63% 45% 42%
Total 5,954,746 4,024,560 650,000
5 1.0 MSF (3/4 inch basis) = 1,000 ft2 (3/4 inch basis) = 1.7698 m3 (calculated using 19.05 mm basis).

5
The data was weight-averaged to provide performance on a typical unit volume of 1.0 m3 of material. The data was checked for consistency, mass flow, and energy balance and was found to be of high quality. Two internationally recognized environmental assessment modeling software packages, SimaPro and GaBi, were used to determine the LCI based on the entered survey data and the library database processes that are included with the software (PRé Sustainability 2018, Gabi 2018). For LCI, input data for the production of other resources, such as fuels, electricity, and other non-resin-based chemicals were used from production process available in the SimaPro software package (LTS 2018). Mass-based allocation was used to assign environmental burdens to the WCP process production. Using the LCI output, the LCIA was performed by using the US Environmental Protection Agency’s TRACI tool to provide impacts for various environmental categories (Bare 2011).
4 Renewable Resource Wood composite panels are produced from wood resources that are considered sustainable and renewable. United States forests are sustainable, in that growth rate exceeds harvesting rates. In 2012, there was 49% more net growth than total removals, with removals accounting for only 1.3% of the total US timber inventory (Oswalt and Smith 2014). Although not included in the LCA studies presented herein, producers can request wood resources from specific, certified wood resources, such as third-party groups like FSC, SFI, ATSF, or CSA (Dovetail Partners 2009). The production process for WCPs was very efficient in material use, with little to non-solid waste ending up in a landfill. Resource use was about 56-97% by wood mass, from input wood going into the products and fuel used to generate process heat in manufacturing, leaving about 1-3% ending up in landfills (Table 3). Another environmental benefit is that these wood residues were gathered from relatively close facilities, on average, within 165 km (103 miles), which conserves transportation fuel use.
Table 3. Breakdown of wood resource use onsite at wood composite panel (WCP) facilities.
Particleboard MDF Hardboard/EWST Wood residue into WCP 97% 85% 56% Wood fuel use in mill 2% 14% 41% Wood waste to landfill 1% 1% 3% 100% 100% 100%
Wood composite panels are comprised of 91-95% renewable wood residue resources and less than 10% resin and smaller components of wax, catalyst, and scavenger (Table 4).
Wood composite panel production is a highly efficient production process, with little of the wood resource going to waste.

6
Table 4. Components of particleboard, MDF, and hardboard/EWST on a dry-weight basis.
Particleboard MDF Hardboard/EWST Wood residue into WCP 93% 90% 94% Resin system 7% 10% 6% 100% 100% 100% Panel density, kg/m3 692 782 768
5 Treatment of Biogenic Carbon The treatment of biogenic carbon in this LCA follows the requirements set out in the reference PCR. The requirements in the PCR were adapted from EN 16485. Modifications to the methodology from EN 16485 include the specification that carbon storage in products is to be excluded in the calculation of GWP in cradle-to-gate LCA. Forests are understood as a natural system with multiple functions, including the production function of timber. Therefore, natural growth and decay processes, including natural disturbances, are not attributable to the production function of forests and are therefore not considered in LCA. Harvesting operations lead to temporal decreases in forest carbon pools in the respective stands. Impacts on forest carbon pools resulting from the sustainable or unsustainable management of forests, however, cannot be defined or assessed on the stand level, but require the consideration of carbon pool changes on the landscape level, i.e., the level based on which management decisions are made. Resulting from the fundamental principle of sustainable forest management to preserve the production function of a forest, total forest carbon pools can be considered stable (or increasing) under sustainable forest management. This is due to the fact that temporal decreases of forest carbon pools resulting from harvesting on one site are compensated by increases of carbon pools on the other sites, forming together the forest area under sustainable forest management. It is acknowledged that excessive extraction of slash, litter, or roots for the purpose of bioenergy generation can lead to decreases in forest carbon pools. These activities, however, are not causally linked to the extraction of timber for the material use of wood. The effects on forest carbon pools related to the extraction of slash, litter, or roots are not attributable to the material use of wood and are therefore not considered in the LCA of the WCP. The North American PCR approach is followed here for GWP reporting; therefore, the default TRACI impact assessment method was used. This default method does not count the CO2 emissions released during the combustion of woody biomass during production. Other greenhouse gas (GHG) emissions associated from wood combustion, e.g., methane or nitrogen oxides, do contribute to and are included in the GWP impact category.

7
6 LCIA Results for WCPs The LCIA phase establishes links between the LCI results and potential environmental impacts. The LCIA calculates impact indicators, such as GWP and smog. These impact indicators provide general, but quantifiable, indications of potential environmental impacts. The target impact indicator, the impact category, and means of characterizing the impacts are summarized below. Environmental impacts are determined using the TRACI method (Bare et al. 2011). Five impact categories are reported, consistent with the requirement of the wood products PCR. Each impact indicator is a measure of an aspect of a potential impact. The LCIA does not make value judgments about the impact indicators, meaning that comparison indicator values are not valid. Additionally, each impact indicator value is stated in units that are not comparable to others. For the same reasons, indicators should not be combined or added. Additionally, the LCIA results are relative expressions and do not predict impacts on category endpoints, the exceeding of thresholds, safety margins, or risks. The primary fuels are categorized into non-renewable fossil, non-renewable nuclear, non-renewable biomass, renewable biomass, hydroelectric, and other (wind, solar, geothermal). Table 5 summarizes the source and scope of each of the six impact categories reported in this report:
• Global warming - TRACI uses GWP, a midpoint metric proposed by the International Panel on Climate Change (IPCC), for the calculation of the potency of GHG relative to CO2. The 100-year time horizons recommended by the IPCC and used by the United States for policy making and reporting are adopted within TRACI. The methodology and science behind the GWP calculation can be considered one of the most accepted LCIA categories. GWP100 will be expressed on an equivalency basis relative to CO2 (i.e., equivalent CO2 mass basis).
• Ozone depletion - Stratospheric ozone depletion is the reduction of the protective ozone within
the stratosphere caused by emissions of ozone-depleting substances. International consensus exists on the use of Ozone Depletion Potentials (ODP), a metric proposed by the World Meteorological Organization for calculating the relative importance of chlorofluorocarbons (CFCs), hydrochlorofluorocarbons (HFCs), and halons expected to contribute significantly to the breakdown of the ozone layer. TRACI uses the ODP published in the Handbook for the International Treaties for the Protection of the Ozone Layer, where chemicals are characterized relative to trichlorofluoromethane (CFC-11).
• Acidification - As per TRACI, acidification comprises processes that increase the sulfur dioxide
(SO2) of water and soil systems from acid-forming chemicals such as sulfur oxides, nitrogen oxides, hydrochloric acid, and ammonia. Acidification is a more regional rather than global impact affecting freshwater and forests, as well as human health, when high concentrations of SO2 are attained. The calculation of the acidification potential of an air emission is based on the number of SO2 that can be produced and therefore is expressed as potential SO2 equivalents per kg of contributing emission.
• Photochemical smog - Under certain climatic conditions, air emissions from industry and
transportation can be trapped at ground level where, in the presence of sunlight, they produce photochemical smog, a symptom of photochemical ozone creation potential (POCP). While ozone is not emitted directly, it is a product of interactions between volatile organic compounds (VOCs) and nitrogen oxides (NOx). The “smog” indicator is expressed on a mass of equivalent ozone (O3) basis.

8
• Eutrophication - In TRACI, eutrophication is defined as the fertilization of surface waters by nutrients that were previously scarce. This measure encompasses the release of mineral salts and their nutrient-enrichment effects on waters, which typically consists of phosphorous and nitrogen compounds and organic matter flowing into waterways. The result is expressed on an equivalent mass of nitrogen (N) basis. The characterization factors estimate the eutrophication potential of a release of chemicals containing N or P to air or water, per kilogram of chemical released, relative to 1 kg N discharged directly to surface freshwater.
• Total primary energy – Total primary energy, which is also referred to as “embodied energy,” is the sum of all energy sources that are drawn directly from the earth, such as natural gas, oil, coal, biomass, or hydropower energy. The total primary energy contains further categories, namely non-renewable and renewable energy, and fuel and feedstock energy. Non-renewable energy includes all fossil and mineral primary energy sources, such as natural gas, oil, coal, and nuclear energy. Renewable energy includes all other primary energy sources, such as hydropower and biomass. Feedstock energy is that part of the primary energy entering the system which is not consumed and/or is available as fuel energy and for use outside the system boundary. Total primary energy is expressed in mega joules (MJ).
Table 5. Selected impact indicators required for reporting
Impact category Unit Method Level of site specificity Global warming kg CO2 eq TRACI 2.1 v1.01 Global Smog kg SO2 eq TRACI 2.1 v1.01 North America Acidification kg N eq TRACI 2.1 v1.01 North America Ozone depletion kg CFC-11 eq TRACI 2.1 v1.01 North America Eutrophication kg O3 eq TRACI 2.1 v1.01 North America Total energy MJ CED Global
Non-renewable fossil MJ CED Global Non-renewable nuclear MJ CED Global
Renewable woody biomass MJ CED Global Other renewables* MJ CED Global
* Solar, hydro, geothermal, wind For any LCI there is usually a long list of emissions, which makes it challenging for product and process comparisons. To view the full LCI of each of the WCPs in this paper, please see the individual LCA reports (Puettmann and Salazar 2018, “LCA MDF” and “LCA Particleboard”, Puettmann et al. 2016, “LCA Hardboard”).
9
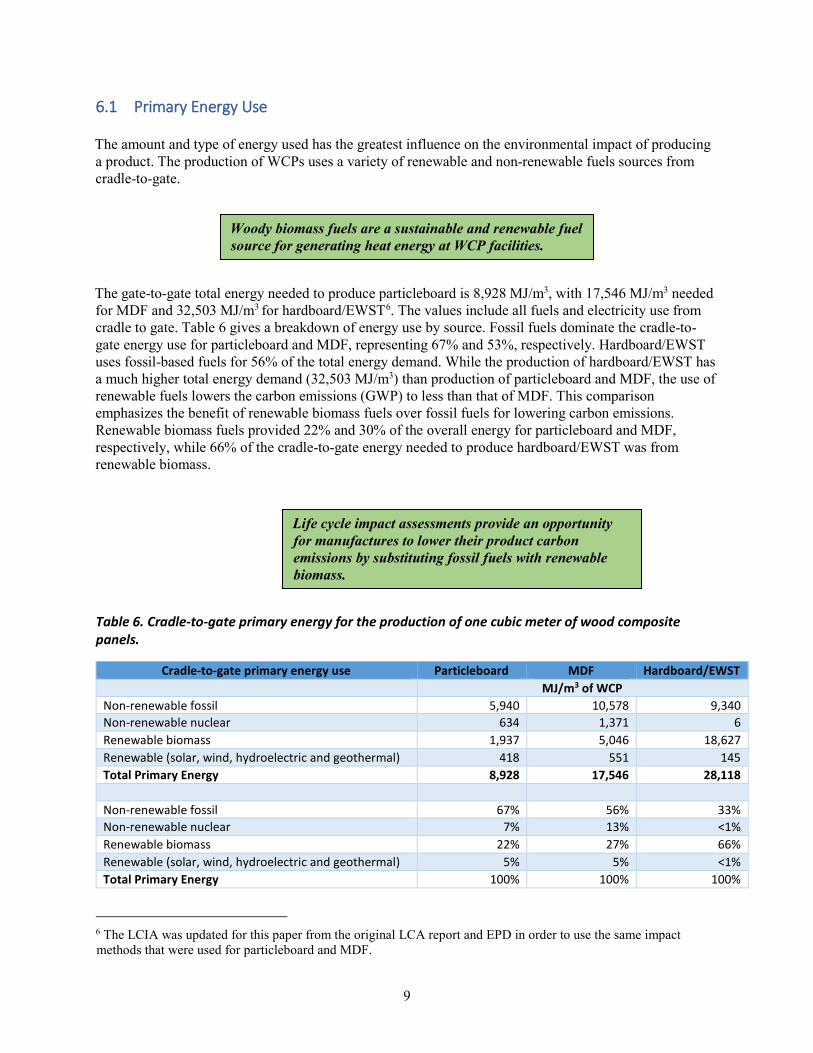
6.1 Primary Energy Use The amount and type of energy used has the greatest influence on the environmental impact of producing a product. The production of WCPs uses a variety of renewable and non-renewable fuels sources from cradle-to-gate.
The gate-to-gate total energy needed to produce particleboard is 8,928 MJ/m3, with 17,546 MJ/m3 needed for MDF and 32,503 MJ/m3 for hardboard/EWST6. The values include all fuels and electricity use from cradle to gate. Table 6 gives a breakdown of energy use by source. Fossil fuels dominate the cradle-to-gate energy use for particleboard and MDF, representing 67% and 53%, respectively. Hardboard/EWST uses fossil-based fuels for 56% of the total energy demand. While the production of hardboard/EWST has a much higher total energy demand (32,503 MJ/m3) than production of particleboard and MDF, the use of renewable fuels lowers the carbon emissions (GWP) to less than that of MDF. This comparison emphasizes the benefit of renewable biomass fuels over fossil fuels for lowering carbon emissions. Renewable biomass fuels provided 22% and 30% of the overall energy for particleboard and MDF, respectively, while 66% of the cradle-to-gate energy needed to produce hardboard/EWST was from renewable biomass.
Table 6. Cradle-to-gate primary energy for the production of one cubic meter of wood composite panels.
Cradle-to-gate primary energy use Particleboard MDF Hardboard/EWST MJ/m3 of WCP Non-renewable fossil 5,940 10,578 9,340 Non-renewable nuclear 634 1,371 6 Renewable biomass 1,937 5,046 18,627 Renewable (solar, wind, hydroelectric and geothermal) 418 551 145 Total Primary Energy 8,928 17,546 28,118 Non-renewable fossil 67% 56% 33% Non-renewable nuclear 7% 13% <1% Renewable biomass 22% 27% 66% Renewable (solar, wind, hydroelectric and geothermal) 5% 5% <1% Total Primary Energy 100% 100% 100%
6 The LCIA was updated for this paper from the original LCA report and EPD in order to use the same impact methods that were used for particleboard and MDF.
Woody biomass fuels are a sustainable and renewable fuel source for generating heat energy at WCP facilities.
Life cycle impact assessments provide an opportunity for manufactures to lower their product carbon emissions by substituting fossil fuels with renewable biomass.

10
The values in total primary energy include the energy equivalent based on the higher heating values of fuels in-ground to extract, process, and deliver fuels, electricity, resin, wax, and additives to the mill. With a national interest in using more fuels that are renewable and sustainable to displace fossil fuels that are neither, the wood panel industry is already leading the way with a significant use of woody biomass for fuel. The manufacturers of WCPs may be able to source some resources and raw materials that use sustainable and renewable materials and are produced using renewable fuels, but in most cases these opportunities do not exist. Therefore, the activities and choices they can make on-site (at the WCP facility alone) can have a significant influence on their overall environmental profile. Table 7 shows the energy use at each WCP facility and the percent allocation to total onsite energy use.
Table 7. Gate-to-gate primary energy for the production of one cubic meter of wood composite panels.
Gate-to-gate(onsite) primary energy use Particleboard MDF Hardboard/EWST MJ/m3 of WCP Non-renewable fossil 2,216 5,183 8,716 Non-renewable nuclear 503 1,198 6 Renewable biomass 376 2,872 18,594 Renewable (solar, wind, hydroelectric and geothermal) 293 448 410 Total primary energy 3,387 9,407 27,456 Non-renewable fossil 65% 56% 32% Non-renewable nuclear 15% 13% <1% Renewable biomass 11% 27% 68% Renewable (solar, wind, hydroelectric and geothermal) 9% 5% <1% Total primary energy 100% 100% 100%
6.2 Carbon Footprint The science-based LCA results demonstrated that all three WCPs have a negative carbon emission, which means that they store more carbon in the product (as CO2) than is released during their manufacturing process. Naturally stored carbon in wood as part of its chemical structure prevents the carbon from being released in the form of CO2 into the atmosphere until the wood breaks down. The carbon will be released only when the WCPs are combusted, decayed, or degraded chemically. The carbon stored in the panels functions as a carbon offset against the sum of the GHG emissions released during manufacturing due to the combustion of fossil fuels. Since GHG emissions are known to contribute to climate change, the negative values of the net carbon footprints for WCPs mean that these materials store more carbon than is released into the atmosphere during their manufacturing process. Using the IPCC framework (IPCC 2006), 403 kg CO2e were released in the cradle-to-gate production of 1 m3 of particleboard, 759 kg CO2e were released for MDF, and 659 kg CO2e for hardboard/EWST. That same 1 m3 of particleboard stores 1,268 kg CO2e, while MDF stores 1,437 kg CO2e and hardboard/EWST stores 1,355 kg CO2e, resulting in more carbon stored in the products than was released during manufacturing (Figure 4).
The WCP industry further optimizes the use a renewable wood sources by ensuring that wood residues are produced with over 70% renewable biomass fuels.

11
Figure 4. Cradle-to-gate carbon emissions (GWP), carbon stored in final product, and net carbon footprint (emissions minus storage) shown in kg CO2 eq. for particleboard, MDF, and hardboard/EWST
The carbon footprint of WCPs was determined from LCI data cradle-to-gate by summing all the GHG emissions, such as CO2, methane (CH4), nitrous oxide (N2O) and the fluorinated gases that contribute to the GWP impact category. The GHG emissions are given in their CO2 equivalent weights (kg-CO2 equivalent). The GHG emissions are primarily due to the combustion of fossil fuels to produce and deliver fuels, electricity generation, and material production, as well as emissions due to the combustion of fuels for process heat and to operate emissions mitigation equipment in manufacturing process onsite at WCP facilities.
Carbon storage in wood—which is comprised approximately of 50% carbon—occurs during photosynthesis as trees grow, a process by which CO2 is pulled from the atmosphere and the carbon is used to make wood. This process also releases oxygen (O2) back to the atmosphere. Thus, the C stored in
Wood composite panels store more carbon than the amount expended during their manufacture and transportation from cradle-to-gate.
Every 1.0 kg of carbon stored in WCPs is equivalent to 3.67 kg of CO2 not in the atmosphere.

12
the wood remains in the WCPs until they break down due to combustion, decay, or degradation, thereby releasing carbon in the form of CO2 back to the atmosphere and completing the closed carbon cycle7. The fact that WCPs have negative “net carbon footprints” is very beneficial toward lessening climate change and reducing GWP. There is sufficient carbon stored in WCPs to offset all of the GHG emissions released to produce them. From a climate change impact perspective, these products are very environmentally friendly. 7 Comparing Wood Composite Panels to Alternative Materials All materials, processes, and actions have some type of environmental impact for their production, use, and disposal. When selecting a material or product, the best approach is to choose one with the least environmental impact that still meets the product’s use requirements. Choosing what environmental impact to use as a metric can depend on the goals of the project, e.g., to reduce carbon emission, lower total primary energy, or reduce waste. Sometimes, one particular impact will be used as metric in order to meet regional building codes or environmental regulations and codes, or to establish a “green” certification label. The science-based methodology of LCA can be used to compare alternative material selections. Ideally, the comparison should be based on the intrinsic use of the material in the intended product, such as office furniture or in building. However, since there are so many different material applications, a general comparison can be made on an equivalent use volume (m3) or weight (kg) basis of the materials, as long as the limitations of this approach are recognized. Wood composite panels, as well as most alternative materials, are generally purchased on a volume basis. Therefore, the environmental impacts of the various materials are given here per volume (1.0 m3), considering all impacts from cradle-to-gate (Table 8). The volume values can be converted to weight (1.0 kg) values using the densities of each material—in units of kg/m3, the values are as follows: particleboard, 692; MDF, 782; hardboard/EWST, 768; hot rolled steel, 7,600; cement, 3,150; HDPE plastic, 950; and flat uncoated glass, 2531. Cradle-to-gate environmental performance results for global warming; acidification; eutrophication; ozone depletion and smog; energy consumption from non-renewables (fossil and nuclear fuels) and renewables (wind, hydro, solar, geothermal, and biomass); consumption of renewable and nonrenewable resources; and generation of solid waste are shown in Table 8. Air quality for WCPs can be addressed in two manners: (1) for emissions from the production process; and (2) for emissions from the panels themselves. The LCA reports of each panel product provide those emissions for production for both cradle-to-gate and gate-to-gate. The gate-to-gate emissions at the time of the data collection in 2012 and 2017 for hardboard/EWST, particleboard, and MDF met air standards listed in Table 1. All onsite air emissions occurring during the manufacturing process of WCPs, such as HAPs, particulates, formaldehyde, and methanol, as well as all cradle-to-gate emissions are available in CORRIM reports (Puettmann and Salazar 2018, “LCA MDF” and “LCA Particleboard”; Bergman 2015, LCI Hardboard; Puettmann et al. 2016, “LCA Hardboard”).
7 We assume a carbon content of 50% in the WCPs. To convert from carbon in the wood to CO2, multiply the oven-dry mass of the wood by 0.5 and then 3.67. The 3.67 conversion ratio comes from the molar mass ratio of CO2 to C of 44 to12.

13
Table 8. Cradle-to-gate LCIA results for 1 m3 particleboard8, MDF, and hardboard/EWST9, and alternative non-wood-based materials10.
Impact category Unit PB MDF Hardboard/EWST Cement Steel Plastic Glass Unit/m3
Global warming kg CO2 eq 402 759 572 4,311 13,599 1,672 2,563 Acidification kg SO2 eq 6.34 5.52 6 21.73 53.12 3.90 21.37 Eutrophication kg N eq 1.390 3.420 1 0.505 51.666 1.125 2.095 Smog kg O3 eq 134 70 78 276 670 49 243 Ozone depletion kg CFC-11 eq 0.0000 0.0001 0.0000 0.0000 0.0004 0.0000 0.0002 Energy Consumption
Total primary energy MJ 8,928 17,546 28,118 16,485 198,977 71,339 29,796 Non-renewable fossil MJ 5,940 10,578 9,340 16,485 181,837 69,934 27,864
Non-renewable nuclear MJ 634 1,371 6 0 15,998 1,131 1,350 Renewable biomass MJ 1,936 5,046 18,627 0 102 28 308
Renewable (solar, wind, hydroelectric and
geothermal) MJ 418 551 145 0 1,039 246 274
Material Resources Consumption Non-renewable
materials kg 29 50 4 5,119 9,080 21 3,177
Renewable materials kg 799 1,050 1,302 0 5 1 15 Freshwater l 1,242 3,018 3,110 2,647 205,544 7,320 33,270 Waste Generation
Hazardous waste generated kg 0.0000 0.0000 0.0000 0.0000 3.3604 0.0705 0.0930
Non-hazardous waste generated kg 9 12 109 292 29,402 488 972
Wood composite panels are lower than non-wood alternatives in every environmental impact category except in eutrophication and smog. Steel has the highest eutrophication potential impact and cement has the lowest. Smog potential amounts are highest in steel production and lowest for plastics. For eutrophication, steel production had the highest impact value, while cement had the lowest. Wood composite panels use significantly lower amounts of non-renewable materials, with the exception of plastics. Water usage and waste generation were considerably higher for non-wood materials. Wood composite panels beneficially use more renewable biomass fuel, which displaces fossil-fuel use, as is reflected in the GWP impact amounts. On average, 22% to 56% of the total energy needs for WCPs were provided by renewable wood fuels. The materials listed in Table 8 can be further described in terms of their renewable component and recycled content, as well as product characteristics, such as how they are disposed of at the end of their service life. Of all the materials, only WCPs can be considered produced from a renewable and sustainable material. All but cement can be made from recycled material. At the end of their service life, all materials can be recycled for use into other products, and all can be accepted in landfill, but only the WCPs and plastic can be used for fuel to further displace the use of fossil fuels.
8 Data source: particleboard and MDF, TRACI and CED in Gabi 9 Data source: hardboard/EWST, TRACI and CED in SimaPro 10 Data source: steel and cement, plastic, and glass, Datasmart2018 in SimaPro.

14
The most significant outcome of this study is that the net carbon emissions values for WCPs are negative. The negative carbon emissions for wood composite panels means there is sufficient carbon (as CO2 equivalents) remaining in WCPs to offset CO2 emissions released from cradle-to-gate (Figure 5). Plastic has a carbon component, but it is not considered an offset against GHG emissions because its carbon cycle is not near term, as is that of wood; additionally, plastic is not made from a renewable resource when it is based on fossil-fuel feedstock.
Figure 5. Cradle-to-gate carbon emissions (GWP), carbon stored in final product, and net carbon footprint (emissions minus storage) shown in kg CO2 eq. for particleboard, MDF, hardboard/EWST, steel, cement, plastic, and glass materials.
To compare the results of these LCA results for WCPs to other materials and processes, it is necessary to use the same boundary conditions and methodologies, as presented here.

15
8 Environmental Product Declarations There are standards in place for conducting LCAs. The International Organization for Standardization published requirements and guidelines for conducting LCAs (ISO 14044, 14040). Life cycle assessments conducted solely under the ISO standard might not necessary report on the same functional unit or even report the same impacts. Product Category Rules make it easy to consistently evaluate the environmental impacts of products (i.e., making “apples-to-apples” comparisons). A PCR is a set of rules, requirements, and guidelines following international established protocols to develop EPDs (ISO 14025, 21930). The users of a PCR can be manufacturers of wood products, architects, builders, and other interested parties. A PCR presents a structure that is intended to ensure a harmonious approach to deriving, verifying, and presenting EPDs for solid wood building products in the United States and Canada.
An EPD is a document that provides, in a user-friendly format, the environmental impacts, energy usage, and other information that results from a science-based LCA of a product. The development of an EPD is based on a set of international standards outlined in the PCR that defines the
processes to be used when evaluating some or all of the product's life-cycle stages. An EPD provides the basis for an evaluation of the environmental performance of products, but does not "judge" whether the product or service meets any environmental quality standard. Users of EPDs are able to make their own judgments based on the information presented. What is perhaps most important, however, is that an EPD is a disclosure by a company or industry that makes public the standardized environmental impacts of its products (Table 8). While an EPD would not include comparisons between products or make reference to any environmental benchmark or baseline, when properly structured and verified against the same PCR, an EPD for one product can be used for comparison against the EPD for another. The key is that for realistic comparisons, the functional unit must be the same (see, e.g., Figure 6).
Figure 6. Type III EPDs (source: Composite Panel Association website, available at https://www.compositepanel.org/education-resources/environmental-product-declarations.html).
An EPD is a standardized tool used to communicate the environmental performance of a product or system
16
Environmental product declarations are used worldwide on several products and include information on the impact factors shown in Table 8. The WCP industry has developed several EPDs that include both structural and non-structural products; these can be found at the websites for the Composite Panel Association (www.compositepanels.org) and the American Wood Council (www.awc.org). All LCA reports can be found on the CORRIM website (www.corrim.org).
9 Summary Science-based LCA studies were conducted to determine the environmental impact of producing particleboard, MDF, and hardboard/EWST panel products. These wood composite panels are composed of over 90% renewable wood residues. Life cycle assessment studies on WCPs document the environmental performance of these products. This paper shows that WCPs use less energy, have a lower carbon footprint, use less non-renewable materials, and have less waste than the alternative materials. More specifically, the following statements are made: Life cycle assessments were developed for the production of particleboard, medium density
fiberboard, and hardboard/EWST, based on CORRIM, ISO, and PCR standards.
The boundary conditions for the LCAs included both those at the manufacturing site (gate-to-gate) and cradle-to-gate, which would include those upstream processes for raw material resources use, transportation, fuel and energy production, and combustion
LCA reports break down the cradle-to-gate results according to PCR standards for resource extraction, including residue production, transportation, and onsite WCP production.
Wood composite production data was collected by surveying panel manufacturers that directly represented 63%, 45%, and 42% of annual production for particleboard, MDF, and hardboard/EWST, respectively.
Survey data was found to be of high quality; other data included information on wood residues and resin obtained from previous industry surveys and from other CORRIM databases.
SimaPro and Gabi software packages were used to develop the assessment (LCIA) in terms of TRACI environmental impact categories. Mass-based allocation of environmental impacts was used. Data on electricity, fuels, transportation, and chemicals were obtained from Datasmart2018.
The WCPs had very high material resource efficiencies, with 97% to 99% of all input wood residues going into product and energy, and only <3% going into landfill.
The cradle-to-gate total primary energy requirements for producing WCPs were 8,928 MJ/m3 for particleboard; 17,546 MJ/m3 for MDF; and 28,118 MJ/m3 for hardboard/EWST. Woody biomass, a renewable fuel, was used to generate 22% to 66% of process heat for WCPs. Fossil fuels use was 33–67%.

17
A significantly favorable environmental characteristic of WCPs is that about 50% of the mass of their wood component consists of stored carbon. Since CO2 emissions contribute to global warming, keeping CO2 out of the atmosphere reduces carbon emission and subsequent GWP. The CO2 equivalent carbon stores for WCPs are −1,268 kg/m3 for particleboard; −1,434 kg/m3 for MDF; and 1,355 kg/m3 for hardboard/EWST. These stores are sufficient to offset all of the GHG emissions from the burning of fossil fuels from in-ground resources through the production of these WPCs, with additional store remaining for additional offset from end-of-life combustion or decomposition. The net carbon emission as measured in kg CO2 equivalents is a negative value for all wood products. These products store more carbon than is released during their cradle-to-gate manufacturing processes.
A comparison was made with WCPs to alternative materials of steel, cement, plastic, and glass. In most cases, the wood composite products performed better in the environmental metrics evaluated than did all other materials in terms of resource, fossil fuel, feedstock, and water use. Likewise, WCPs performed significantly better in terms of their carbon emission (GWP), and in most cases better in terms of their acidification, eutrophication, and smog environmental impact indices.
Overall, WCPs were found to have a number of very favorable environmental attributes, especially when compared to alternative materials, and they should be considered as green products.

18
10 References Bare J.C. 2011. TRACI 2.0: the tool for the reduction and assessment of chemical and other
environmental impacts 2.0. Clean Techn Environ Policy 13:687–696. Bergman R.D. and S.A. Bowe. 2008. Environmental impact of producing hardwood lumber using life-
cycle inventory. Wood Fiber Sci 40(3):448-458. Bergman R.D. and S.A. Bowe. 2010. Environmental impact of manufacturing softwood lumber
determined by life-cycle inventory. Wood Fiber Sci 42(CORRIM Special Issue):67-78. Bergman R.D. and S.A. Bowe. 2012. Life-cycle inventory of manufacturing hardwood lumber in the
southeastern United States. Wood Fiber Sci 44(1):71-84. Bergman, R.D. 2015. Cradle-to-gate life-cycle inventory of hardboard and engineered wood siding and
trim produced in North America. CORRIM Final Report, Prepared for CPA-Composite Panel Association. 83pp.
LTS. 2018. DATASMART LCI Package. https://ltsexperts.com/services/software/datasmart-life-cycle-
inventory/ (accessed February 2019). Dovetail Partners Inc. 2009. http://www.dovetailinc.org/content/forest-certification-programscase-studies. FP Innovations. 2015. Product Category Rules (PCR) for preparing an Environmental Product Declaration
(EPD), For North American Structural and Architectural Wood Products. June 2015. GaBi. 2018. GaBi Life Cycle Assessment software package. https://thinkstep.com/software/gabi-software.
(accessed February 2019). Intergovernmental Panel on Climate Change (IPCC). 2006. IPCC Guidelines for National Greenhouse
Gas Inventories. https://www.ipcc-nggip.iges.or.jp/public/2006gl/ (accessed February 2019) ISO 2006a. Environmental management - Life cycle assessment–Requirements and guidelines.
International Organization for Standardization. (ISO 14044:2006[E]). 54pp. ISO 2006b. Environmental management - Life cycle assessment–Principles and framework. International
Organization for Standardization. (ISO 14040:2006[E]). 20pp. ISO 2006c. Environmental labels and declarations —Type III environmental declarations —Principles
and procedures. (ISO 14025:2006-07-01). 25pp. ISO 2017. Sustainability in buildings and civil engineering works -- Core rules for environmental product
declarations of construction products and services. (ISO 21930:2017). 80pp Milota, M.R. 2015. Life cycle assessment for the production of Pacific Northwest softwood lumber.
CORRIM Report – Module B. https://corrim.org/wp-content/uploads/Module-B-PNW-Lumber.pdf (accessed Febuary 2019). 73pp.
Milota M.R. 2015. Life cycle assessment for the production of southeastern softwood lumber. CORRIM
Report – Module C. https://corrim.org/wp-content/uploads/Module-C-SE-Lumber.pdf (accessed Febuary 2019) 72pp.

19
Oswalt, S.N. and W. B. Smith. 2014. U.S. Forest resource facts and historical trends. USDA Forest
Service FS-1035 August 2014. 64pp. Puettmann, M., R. Bergman, and E. Oneil. 2016. Cradle-to-gate life cycle assessment of North American
hardboard and engineered wood siding and trim production. Prepared for CPA-Composite Panel Association. https://corrim.org/wp-content/uploads/2017/12/LCA-of-NA_Hardboard_and_Engineered_Wood_Siding_and_Trim_Production.pdf (accessed February 2019) 77pp.
Puettmann, M., D. Kaestner, and A. Taylor. 2016. Life cycle assessment of softwood plywood production
in the US Pacific Northwest. CORRIM Report – Module D1. https://corrim.org/wp-content/uploads/Module-D1-PNW-Plywood.pdf (accessed February 2019). 56pp.
Puettmann, M., D. Kaestner, and A. Taylor. 2016. Life cycle assessment of softwood plywood production
in the US Southeast. CORRIM Report – Module D2. https://corrim.org/wp-content/uploads/Module-D2-SE-Plywood.pdf. 55pp.
Puettmann, M. and J. Salazar. 2018. Cradle to gate life cycle assessment of North American medium
density fiberboard production. CORRIM report prepared for Composite Panel Association. 46pp. Puettmann, M. and J. Salazar. 2018. Cradle to gate life cycle assessment of North American particleboard
production. CORRIM report prepared for Composite Panel Association. 50pp.