Embed Size (px)
Citation preview
ORIGINAL ARTICLE
Life cycle assessment of integrated recycling schemes for plasticcontainers and packaging with consideration of resin composition
Asako Nishijima • Jun Nakatani • Kazuo Yamamoto •
Fumiyuki Nakajima
Received: 17 January 2011 / Accepted: 14 November 2011 / Published online: 8 December 2011
� Springer 2011
Abstract Many life cycle assessment studies have eval-
uated and compared the environmental performance of
various technologies for recycling plastic containers and
packaging in Japan and other countries. However, no
studies have evaluated the combination of recycling tech-
nologies in consideration of the resin composition in terms
of the quantity of each recycled product so as to maximize
their environmental potential. In this study, 27 scenarios of
recycling schemes for household waste plastic containers
and packaging are developed through integrating a con-
ventional recycling scheme with additional recycling
schemes. The conventional recycling scheme involves
municipal curbside collection and either the material
recycling or feedstock recycling of waste plastics. The
additional recycling schemes are feedstock recycling in
steel works of the residue from conventional material
recycling processes, and corporate voluntary collection and
independent material recycling of specific types of plastic
trays. Life cycle assessment based on the modeling of
recycling processes considering the resin composition in
terms of the quantity of each recycled product is applied to
evaluate and compare these scenarios from the viewpoints
of fossil resource consumption and CO2 emission. The
results show that the environmental loads are reduced in
all scenarios including the additional recycling schemes
compared with the conventional recycling scheme. How-
ever, the independent plastic tray recycling scheme
exhibits lower additional environmental savings when the
residue recycling scheme is integrated with the conven-
tional material recycling scheme. This is because both
additional recycling schemes aim to utilize polystyrene and
polyethylene terephthalate, which would otherwise be
incinerated as residue from material recycling processes.
The evaluation of the environmental loads of plastic
recycling with consideration of the resin composition in
terms of the quantity of each recycled product makes it
possible to investigate recycling schemes that integrate
different technologies to maximize their environmental
potential.
Keywords Material recycling � Feedstock recycling �Residue recycling � Voluntary collection �Independent plastic tray recycling
Introduction
Plastics are now used in countless applications including car
parts, home products, mobile phones, containers and
packaging. Containers and packaging remain the largest of
these applications in Japan, accounting for 43.1% of all
plastic products in 2008 [1]. The Law for Promotion of
Sorted Collection and Recycling of Containers and Pack-
aging (Containers and Packaging Recycling Law) was
enacted in 1995 and enforced in 1997 in Japan. The
A. Nishijima
Japan Weather Association, Tokyo, Japan
A. Nishijima (&)
Institute of Industrial Science, The University of Tokyo,
4-6-1 Komaba, Meguro-ku, Tokyo 153-8505, Japan
e-mail: [email protected]
J. Nakatani
Department of Urban Engineering, The University of Tokyo,
Tokyo 113-8656, Japan
K. Yamamoto � F. Nakajima
Environmental Science Center, The University of Tokyo,
Tokyo 113-0033, Japan
123
J Mater Cycles Waste Manag (2012) 14:52–64
DOI 10.1007/s10163-011-0032-y
recycling of postconsumer plastic containers and packag-
ing, other than beverage polyethylene terephthalate (PET)
bottles, has been subject to the law since 2000 [2]. It is said
that the law has contributed to the promotion of plastic
recycling, at least in terms of the collection rate for recy-
cling. However, many problems still remain unsolved, for
example, the mismatch between the resin composition of
collected waste plastics and the characteristics of recycling
processes. Hence, almost half of the collected waste plastics
become residue and are finally disposed of without material
recovery in conventional material recycling [3]. To increase
the utilization ratio of waste plastics, the feedstock recy-
cling of residue from material recycling processes has been
proposed [4]. In addition, recycled polyethylene (PE) and
polypropylene (PP) mixed resin produced by conventional
material recycling is sold at much lower prices than virgin
PE or PP resin because of its reduced quality due to con-
tamination from different types of resin and grime. A col-
lection scheme for pure plastics is required to improve the
quality of recycled materials, and specific types of plastic
trays, foamed polystyrene (PS) trays and transparent PS and
PET trays, are partly collected and recycled as voluntary
activities by consumers, retailers and private recyclers
independently from the conventional municipal curbside
collection of waste plastics.
Many life cycle assessment (LCA) studies have evalu-
ated and compared the environmental performance of var-
ious technologies for recycling plastic containers and
packaging in Japan and other countries. Arena et al. [5] and
Perugini et al. [6] compared the environmental performance
between different technologies for recycling plastic con-
tainers in Italy. Similar comparisons have been carried out
in Denmark [7], UK [8], Germany [9], Sweden [10, 11] and
Japan [12–16]. In these studies, collected waste plastics and
collection schemes were assumed to be identical among the
evaluated scenarios, and they only focused on the difference
between recycling technologies. The Japan Plastic Con-
tainers and Packaging Recycling Association (2007) [14]
also evaluated the environmental performance of the com-
bination of material recycling and energy recovery of res-
idue from the material recycling processes considering the
resin composition of waste plastics in terms of calorific
value. Sekine et al. [17] investigated the potential reduction
of CO2 emission for feedstock recycling technologies in
steel works for different types of plastic resin. Larsen et al.
[18] demonstrated the environmental and economic poten-
tials of the recycling of household waste including plastic
packaging wastes in a full-scale waste management system
and compared various collection schemes; however, the
recycling technology was assumed to be identical regard-
less of the collection scheme. To the best of our knowledge,
no studies have evaluated the combination of recycling
technologies in consideration of the resin composition of
waste plastics in terms of the quantity of each recycled
product.
In this study we aim to investigate recycling schemes for
household waste plastic containers and packaging in which
different technologies are integrated so as to maximize
their environmental potential with consideration of the
resin composition in terms of the quantity of each recycled
product. First, we summarize the current plastic container
and packaging recycling system in Japan based on our field
surveys and a literature survey. Then, 27 scenarios are
developed through integrating a conventional recycling
scheme with a couple of additional recycling schemes.
The conventional recycling scheme involves municipal
curbside collection and either the material recycling or
feedstock recycling of waste plastics. The additional
recycling schemes are the feedstock recycling of the resi-
due from the conventional material recycling processes,
and corporate voluntary collection and independent mate-
rial recycling of specific types of plastic trays. LCA based
on the modeling of recycling processes considering the
resin composition of waste plastics in terms of the quantity
of each recycled product is applied to evaluate and com-
pare these scenarios from the viewpoints of fossil resource
consumption and CO2 emission.
Plastic container and packaging recycling system
in Japan
Conventional recycling schemes for plastic containers
and packaging
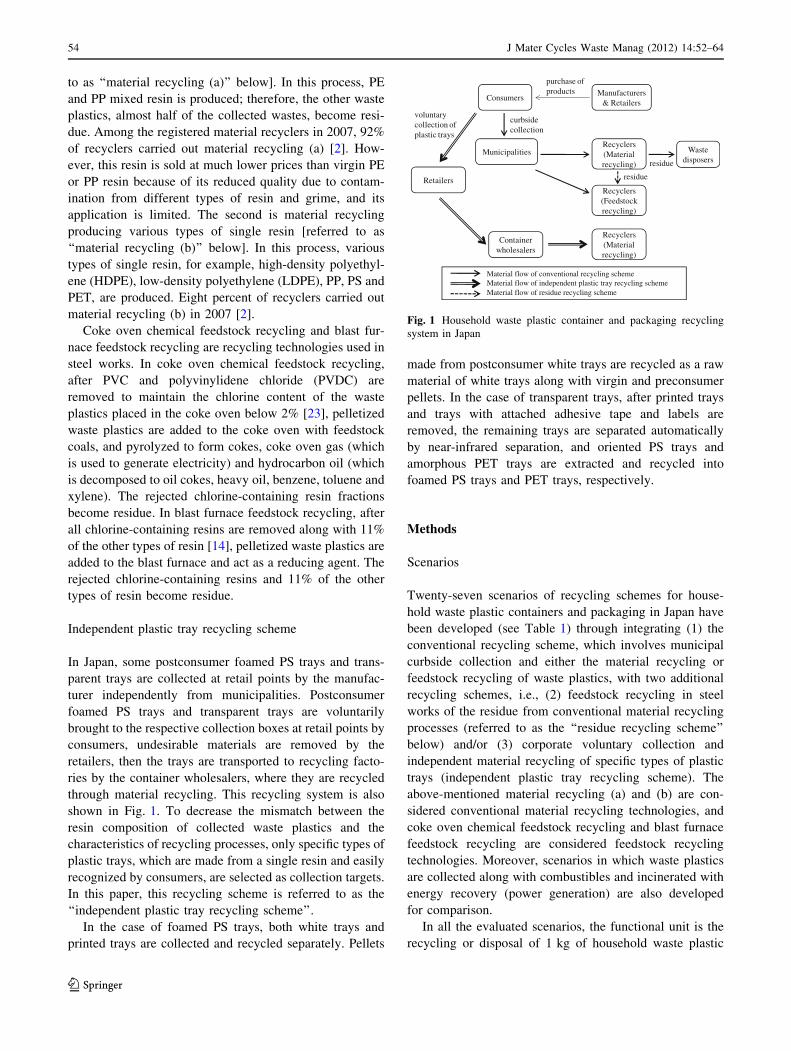
Figure 1 shows the current recycling system for household
waste plastic containers and packaging in Japan. Beverage
PET bottles [19], which are collected and recycled sepa-
rately from other plastic containers and packaging, are
outside the scope of evaluation in this paper. Plastic con-
tainers and packaging include various types of plastic resin,
for example, PE, PP, PS, PET and polyvinylchloride
(PVC), and some containers and packaging are made from
a single resin and some are made from a mixed resin such
as laminated films. Municipalities collect household waste
plastic containers and packaging, which consumers dispose
of at the curbside, remove other undesirable materials,
compact the remaining waste plastics as pretreatment, and
then outsource their recycling to approved private recy-
clers. At this point, material recycling and several types of
feedstock recycling, i.e., coke oven chemical feedstock
recycling [20], blast furnace feedstock recycling, gasifica-
tion and liquefaction [21, 22], are approved by the national
designated recycling association.
Material recycling is categorized into two types. The
first is material recycling producing mixed resin [referred
J Mater Cycles Waste Manag (2012) 14:52–64 53
123
to as ‘‘material recycling (a)’’ below]. In this process, PE
and PP mixed resin is produced; therefore, the other waste
plastics, almost half of the collected wastes, become resi-
due. Among the registered material recyclers in 2007, 92%
of recyclers carried out material recycling (a) [2]. How-
ever, this resin is sold at much lower prices than virgin PE
or PP resin because of its reduced quality due to contam-
ination from different types of resin and grime, and its
application is limited. The second is material recycling
producing various types of single resin [referred to as
‘‘material recycling (b)’’ below]. In this process, various
types of single resin, for example, high-density polyethyl-
ene (HDPE), low-density polyethylene (LDPE), PP, PS and
PET, are produced. Eight percent of recyclers carried out
material recycling (b) in 2007 [2].
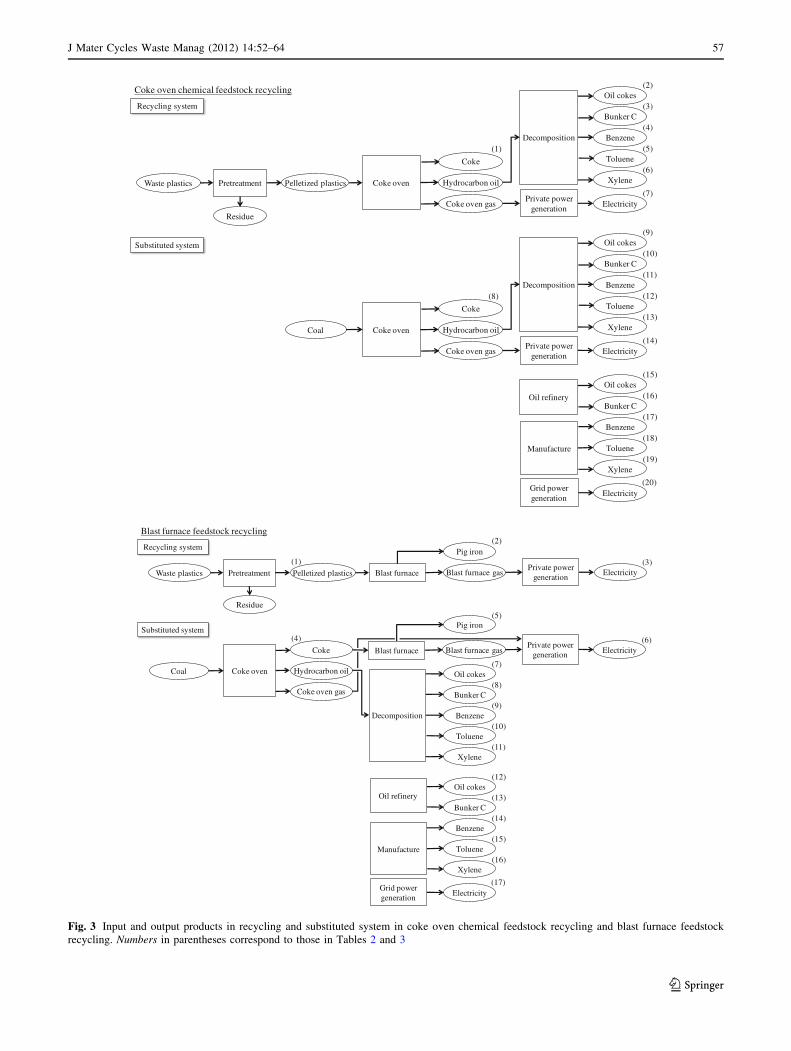
Coke oven chemical feedstock recycling and blast fur-
nace feedstock recycling are recycling technologies used in
steel works. In coke oven chemical feedstock recycling,
after PVC and polyvinylidene chloride (PVDC) are
removed to maintain the chlorine content of the waste
plastics placed in the coke oven below 2% [23], pelletized
waste plastics are added to the coke oven with feedstock
coals, and pyrolyzed to form cokes, coke oven gas (which
is used to generate electricity) and hydrocarbon oil (which
is decomposed to oil cokes, heavy oil, benzene, toluene and
xylene). The rejected chlorine-containing resin fractions
become residue. In blast furnace feedstock recycling, after
all chlorine-containing resins are removed along with 11%
of the other types of resin [14], pelletized waste plastics are
added to the blast furnace and act as a reducing agent. The
rejected chlorine-containing resins and 11% of the other
types of resin become residue.
Independent plastic tray recycling scheme
In Japan, some postconsumer foamed PS trays and trans-
parent trays are collected at retail points by the manufac-
turer independently from municipalities. Postconsumer
foamed PS trays and transparent trays are voluntarily
brought to the respective collection boxes at retail points by
consumers, undesirable materials are removed by the
retailers, then the trays are transported to recycling facto-
ries by the container wholesalers, where they are recycled
through material recycling. This recycling system is also
shown in Fig. 1. To decrease the mismatch between the
resin composition of collected waste plastics and the
characteristics of recycling processes, only specific types of
plastic trays, which are made from a single resin and easily
recognized by consumers, are selected as collection targets.
In this paper, this recycling scheme is referred to as the
‘‘independent plastic tray recycling scheme’’.
In the case of foamed PS trays, both white trays and
printed trays are collected and recycled separately. Pellets
made from postconsumer white trays are recycled as a raw
material of white trays along with virgin and preconsumer
pellets. In the case of transparent trays, after printed trays
and trays with attached adhesive tape and labels are
removed, the remaining trays are separated automatically
by near-infrared separation, and oriented PS trays and
amorphous PET trays are extracted and recycled into
foamed PS trays and PET trays, respectively.
Methods
Scenarios
Twenty-seven scenarios of recycling schemes for house-
hold waste plastic containers and packaging in Japan have
been developed (see Table 1) through integrating (1) the
conventional recycling scheme, which involves municipal
curbside collection and either the material recycling or
feedstock recycling of waste plastics, with two additional
recycling schemes, i.e., (2) feedstock recycling in steel
works of the residue from conventional material recycling
processes (referred to as the ‘‘residue recycling scheme’’
below) and/or (3) corporate voluntary collection and
independent material recycling of specific types of plastic
trays (independent plastic tray recycling scheme). The
above-mentioned material recycling (a) and (b) are con-
sidered conventional material recycling technologies, and
coke oven chemical feedstock recycling and blast furnace
feedstock recycling are considered feedstock recycling
technologies. Moreover, scenarios in which waste plastics
are collected along with combustibles and incinerated with
energy recovery (power generation) are also developed
for comparison.
In all the evaluated scenarios, the functional unit is the
recycling or disposal of 1 kg of household waste plastic
ConsumersManufacturers
& Retailers
MunicipalitiesRecyclers(Material recycling)
curbside collection
purchase of products
Retailers
Container wholesalers
voluntary collection of plastic trays
Material flow of conventional recycling schemeMaterial flow of independent plastic tray recycling schemeMaterial flow of residue recycling scheme
Recyclers(Feedstock recycling)
Waste disposersresidue
residue
Recyclers(Material recycling)
Fig. 1 Household waste plastic container and packaging recycling
system in Japan
54 J Mater Cycles Waste Manag (2012) 14:52–64
123
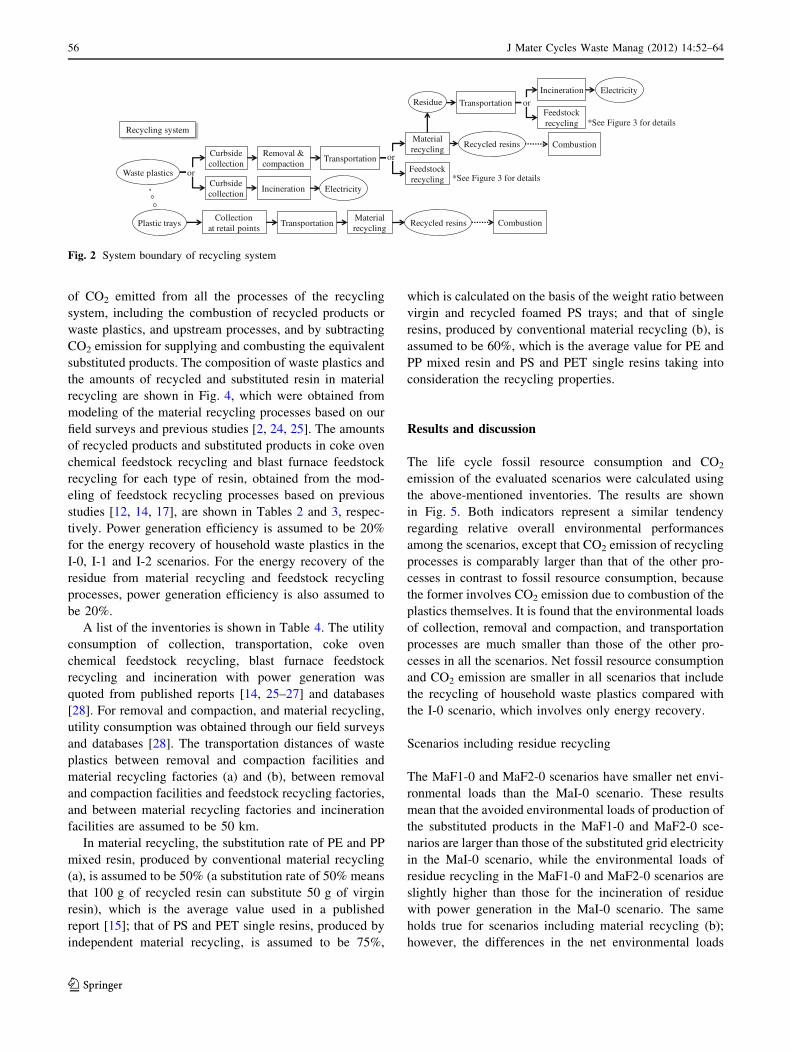
containers and packaging including 0.151 kg of undesir-
able materials other than plastics. The system boundary of
the recycling system is shown in Figs. 2 and 3. In material
recycling (a), PE and PP mixed resin is produced, and in
material recycling (b), HDPE, LDPE, PP, PS and PET
single resins are produced. Removed plastics and other
materials, i.e., residue from material recycling and feed-
stock recycling processes, are incinerated with power
generation in the scenarios other than those including res-
idue recycling. In independent plastic tray recycling,
foamed PS trays are made into PS single resin, and trans-
parent PS and PET trays are made into PS and PET single
resins, respectively. All foamed PS trays and transparent
PS and PET trays are assumed to be collected at retail
points. The environmental loads of the substituted system,
which includes the production of equivalent products
substituted by the recycled products, are subtracted from
those of the recycling system.
Inventories
For each scenario, net fossil resource consumption was
calculated by summing the amounts of fossil resources
consumed in all the processes of the recycling system (see
Fig. 2) and upstream processes for supplying relevant raw
materials and fuels, and by subtracting those consumed for
supplying the equivalent substituted products. Similarly,
net CO2 emission was calculated by summing the amounts
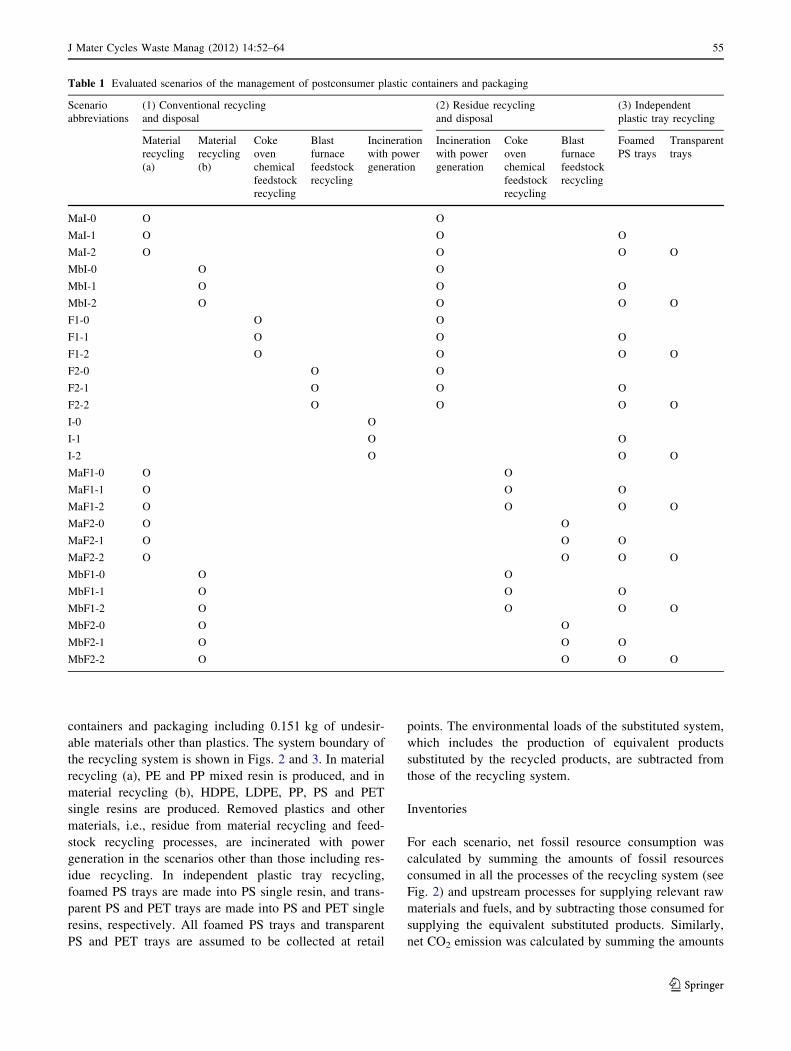
Table 1 Evaluated scenarios of the management of postconsumer plastic containers and packaging
Scenario
abbreviations
(1) Conventional recycling
and disposal
(2) Residue recycling
and disposal
(3) Independent
plastic tray recycling
Material
recycling
(a)
Material
recycling
(b)
Coke
oven
chemical
feedstock
recycling
Blast
furnace
feedstock
recycling
Incineration
with power
generation
Incineration
with power
generation
Coke
oven
chemical
feedstock
recycling
Blast
furnace
feedstock
recycling
Foamed
PS trays
Transparent
trays
MaI-0 O O
MaI-1 O O O
MaI-2 O O O O
MbI-0 O O
MbI-1 O O O
MbI-2 O O O O
F1-0 O O
F1-1 O O O
F1-2 O O O O
F2-0 O O
F2-1 O O O
F2-2 O O O O
I-0 O
I-1 O O
I-2 O O O
MaF1-0 O O
MaF1-1 O O O
MaF1-2 O O O O
MaF2-0 O O
MaF2-1 O O O
MaF2-2 O O O O
MbF1-0 O O
MbF1-1 O O O
MbF1-2 O O O O
MbF2-0 O O
MbF2-1 O O O
MbF2-2 O O O O
J Mater Cycles Waste Manag (2012) 14:52–64 55
123
of CO2 emitted from all the processes of the recycling
system, including the combustion of recycled products or
waste plastics, and upstream processes, and by subtracting
CO2 emission for supplying and combusting the equivalent
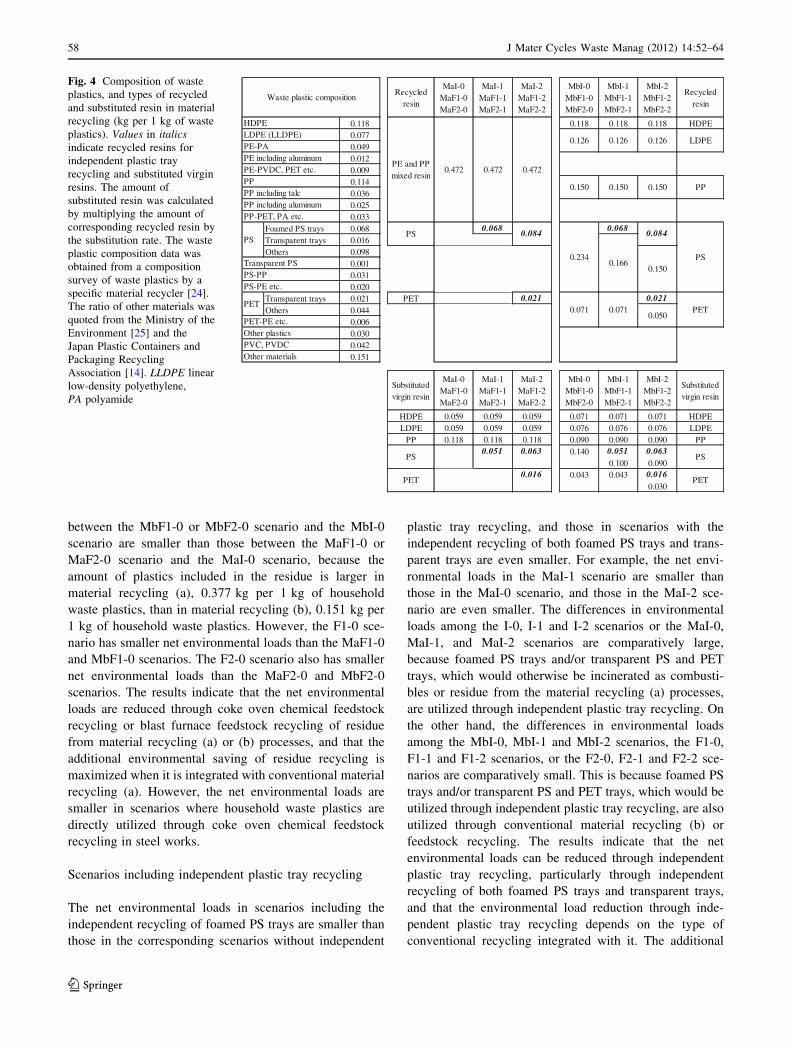
substituted products. The composition of waste plastics and
the amounts of recycled and substituted resin in material
recycling are shown in Fig. 4, which were obtained from
modeling of the material recycling processes based on our
field surveys and previous studies [2, 24, 25]. The amounts
of recycled products and substituted products in coke oven
chemical feedstock recycling and blast furnace feedstock
recycling for each type of resin, obtained from the mod-
eling of feedstock recycling processes based on previous
studies [12, 14, 17], are shown in Tables 2 and 3, respec-
tively. Power generation efficiency is assumed to be 20%
for the energy recovery of household waste plastics in the
I-0, I-1 and I-2 scenarios. For the energy recovery of the
residue from material recycling and feedstock recycling
processes, power generation efficiency is also assumed to
be 20%.
A list of the inventories is shown in Table 4. The utility
consumption of collection, transportation, coke oven
chemical feedstock recycling, blast furnace feedstock
recycling and incineration with power generation was
quoted from published reports [14, 25–27] and databases
[28]. For removal and compaction, and material recycling,
utility consumption was obtained through our field surveys
and databases [28]. The transportation distances of waste
plastics between removal and compaction facilities and
material recycling factories (a) and (b), between removal
and compaction facilities and feedstock recycling factories,
and between material recycling factories and incineration
facilities are assumed to be 50 km.
In material recycling, the substitution rate of PE and PP
mixed resin, produced by conventional material recycling
(a), is assumed to be 50% (a substitution rate of 50% means
that 100 g of recycled resin can substitute 50 g of virgin
resin), which is the average value used in a published
report [15]; that of PS and PET single resins, produced by
independent material recycling, is assumed to be 75%,
which is calculated on the basis of the weight ratio between
virgin and recycled foamed PS trays; and that of single
resins, produced by conventional material recycling (b), is
assumed to be 60%, which is the average value for PE and
PP mixed resin and PS and PET single resins taking into
consideration the recycling properties.
Results and discussion
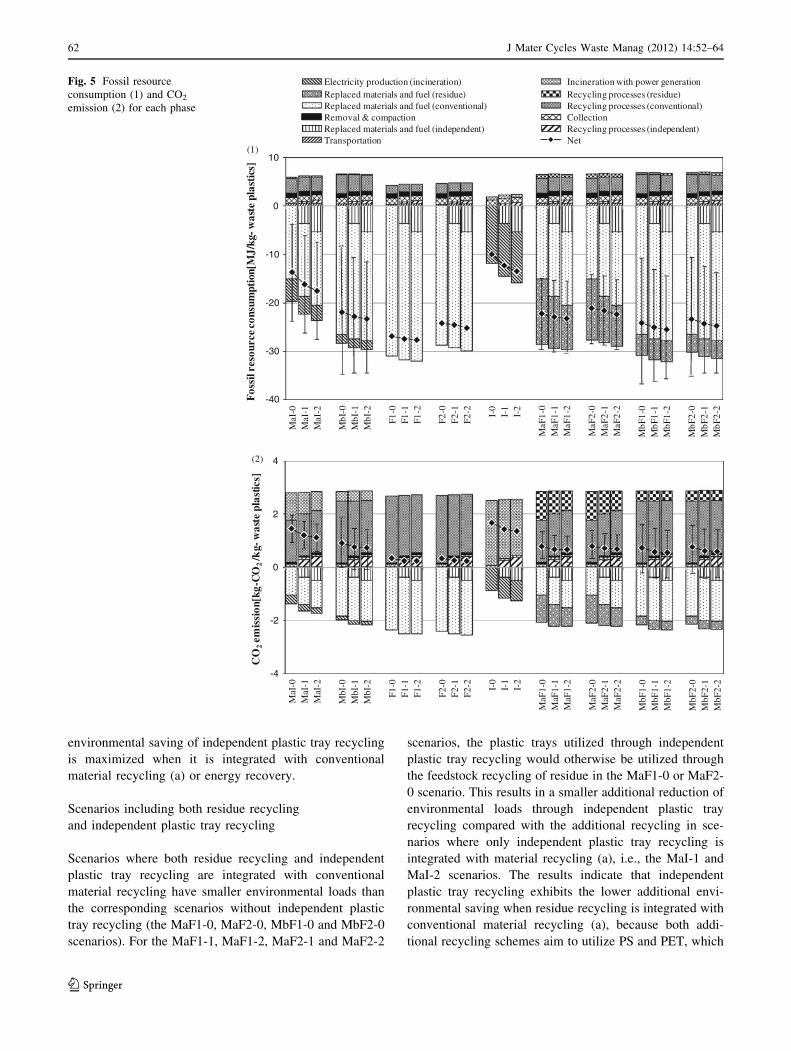
The life cycle fossil resource consumption and CO2
emission of the evaluated scenarios were calculated using
the above-mentioned inventories. The results are shown
in Fig. 5. Both indicators represent a similar tendency
regarding relative overall environmental performances
among the scenarios, except that CO2 emission of recycling
processes is comparably larger than that of the other pro-
cesses in contrast to fossil resource consumption, because
the former involves CO2 emission due to combustion of the
plastics themselves. It is found that the environmental loads
of collection, removal and compaction, and transportation
processes are much smaller than those of the other pro-
cesses in all the scenarios. Net fossil resource consumption
and CO2 emission are smaller in all scenarios that include
the recycling of household waste plastics compared with
the I-0 scenario, which involves only energy recovery.
Scenarios including residue recycling
The MaF1-0 and MaF2-0 scenarios have smaller net envi-
ronmental loads than the MaI-0 scenario. These results
mean that the avoided environmental loads of production of
the substituted products in the MaF1-0 and MaF2-0 sce-
narios are larger than those of the substituted grid electricity
in the MaI-0 scenario, while the environmental loads of
residue recycling in the MaF1-0 and MaF2-0 scenarios are
slightly higher than those for the incineration of residue
with power generation in the MaI-0 scenario. The same
holds true for scenarios including material recycling (b);
however, the differences in the net environmental loads
Waste plastics
Curbsidecollection
Transportation
Materialrecycling
Recycled resinsRemoval &compaction
Collectionat retail points
Transportation
Recycling system
Materialrecycling
IncinerationCurbsidecollection
or Feedstockrecycling
or
Incineration
Feedstockrecycling
orResidue Transportation
Electricity
Plastic trays Recycled resins
Electricity
*See Figure 3 for details
*See Figure 3 for details
Combustion
Combustion
Fig. 2 System boundary of recycling system
56 J Mater Cycles Waste Manag (2012) 14:52–64
123
Coke ovenPelletized plastics
Recycling system
Coke
Hydrocarbon oil
Coke oven gasPrivate power
generationElectricity
Decomposition
Oil cokes
Bunker C
Benzene
Toluene
Xylene
(1)
(7)
(2)
(3)
(4)
(5)
(6)
Coke ovenCoal
Substituted system
Coke
Hydrocarbon oil
Coke oven gasPrivate power
generationElectricity
Decomposition
Oil cokes
Bunker C
Benzene
Toluene
Xylene
(8)
(14)
(9)
(10)
(11)
(12)
(13)
Oil refinery
Oil cokes
Bunker C
Benzene
Toluene
Xylene
(15)
(16)
(17)
(18)
(19)
Grid powergeneration
Electricity(20)
Manufacture
Coke oven chemical feedstock recycling
Waste plastics Pretreatment
Residue
Blast furnace
Recycling system
Blast furnace gasPrivate power
generationElectricity
(3)
Coke ovenCoal
Substituted system
Coke
Hydrocarbon oil
Coke oven gas
Decomposition
Oil cokes
Bunker C
Benzene
Toluene
Xylene
(4)
(7)
(8)
(9)
(10)
(11)
Oil refineryOil cokes
Bunker C
Benzene
Toluene
Xylene
(12)
(13)
(14)
(15)
(16)
Grid powergeneration
Electricity(17)
Manufacture
Blast furnace Blast furnace gasPrivate power
generation Electricity(6)
Blast furnace feedstock recycling
Pelletized plastics
(1)
Waste plastics Pretreatment
Pig iron
Pig iron
(2)
(5)Residue
Fig. 3 Input and output products in recycling and substituted system in coke oven chemical feedstock recycling and blast furnace feedstock
recycling. Numbers in parentheses correspond to those in Tables 2 and 3
J Mater Cycles Waste Manag (2012) 14:52–64 57
123
between the MbF1-0 or MbF2-0 scenario and the MbI-0
scenario are smaller than those between the MaF1-0 or
MaF2-0 scenario and the MaI-0 scenario, because the
amount of plastics included in the residue is larger in
material recycling (a), 0.377 kg per 1 kg of household
waste plastics, than in material recycling (b), 0.151 kg per
1 kg of household waste plastics. However, the F1-0 sce-
nario has smaller net environmental loads than the MaF1-0
and MbF1-0 scenarios. The F2-0 scenario also has smaller
net environmental loads than the MaF2-0 and MbF2-0
scenarios. The results indicate that the net environmental
loads are reduced through coke oven chemical feedstock
recycling or blast furnace feedstock recycling of residue
from material recycling (a) or (b) processes, and that the
additional environmental saving of residue recycling is
maximized when it is integrated with conventional material
recycling (a). However, the net environmental loads are
smaller in scenarios where household waste plastics are
directly utilized through coke oven chemical feedstock
recycling in steel works.
Scenarios including independent plastic tray recycling
The net environmental loads in scenarios including the
independent recycling of foamed PS trays are smaller than
those in the corresponding scenarios without independent
plastic tray recycling, and those in scenarios with the
independent recycling of both foamed PS trays and trans-
parent trays are even smaller. For example, the net envi-
ronmental loads in the MaI-1 scenario are smaller than
those in the MaI-0 scenario, and those in the MaI-2 sce-
nario are even smaller. The differences in environmental
loads among the I-0, I-1 and I-2 scenarios or the MaI-0,
MaI-1, and MaI-2 scenarios are comparatively large,
because foamed PS trays and/or transparent PS and PET
trays, which would otherwise be incinerated as combusti-
bles or residue from the material recycling (a) processes,
are utilized through independent plastic tray recycling. On
the other hand, the differences in environmental loads
among the MbI-0, MbI-1 and MbI-2 scenarios, the F1-0,
F1-1 and F1-2 scenarios, or the F2-0, F2-1 and F2-2 sce-
narios are comparatively small. This is because foamed PS
trays and/or transparent PS and PET trays, which would be
utilized through independent plastic tray recycling, are also
utilized through conventional material recycling (b) or
feedstock recycling. The results indicate that the net
environmental loads can be reduced through independent
plastic tray recycling, particularly through independent
recycling of both foamed PS trays and transparent trays,
and that the environmental load reduction through inde-
pendent plastic tray recycling depends on the type of
conventional recycling integrated with it. The additional
Recycledresin
MaI-0MaF1-0MaF2-0
MaI-1MaF1-1MaF2-1
MaI-2MaF1-2MaF2-2
MbI-0MbF1-0MbF2-0
MbI-1MbF1-1MbF2-1
MbI-2MbF1-2MbF2-2
Recycledresin
EPDH811.0811.0811.0811.00.0770.0490.0120.0090.1140.0360.0250.033
Foamed PS trays 0.068 860.0860.0Transparent trays 0.016Others 0.098
0.0010.0310.020
Transparent trays 0.021 PET 120.0120.0Others 0.044
0.0060.0300.0420.151
Substitutedvirgin resin
MaI-0MaF1-0MaF2-0
MaI-1MaF1-1MaF2-1
MaI-2MaF1-2MaF2-2
MbI-0MbF1-0MbF2-0
MbI-1MbF1-1MbF2-1
MbI-2MbF1-2MbF2-2
Substitutedvirgin resin
HDPE 0.059 0.059 0.059 0.071 0.071 0.071 HDPELDPE 0.059 0.059 0.059 0.076 0.076 0.076 LDPE
PP 0.118 0.118 0.118 0.090 0.090 0.090 PP0.051 0.063 0.140 0.051 0.063
0.100 0.0900.016 0.043 0.043 0.016
0.030
0.150
PS
TEPTEP
PS
0.071 0.0710.050
PET
0.126 0.126 0.126
PS
LDPE
0.150 0.150 0.150 PP
0.084
0.472
PP including aluminumPP-PET, PA etc.
Transparent PS
0.472 0.472PE and PPmixed resin
PET-PE etc.
PS-PP0.166
PE including aluminumPE-PVDC, PET etc.
PVC, PVDC
0.234
Other plastics
PS 0.084
Waste plastic composition
HDPELDPE (LLDPE)PE-PA
Other materials
PET
PS
PPPP including talc
PS-PE etc.
Fig. 4 Composition of waste
plastics, and types of recycled
and substituted resin in material
recycling (kg per 1 kg of waste
plastics). Values in italicsindicate recycled resins for
independent plastic tray
recycling and substituted virgin
resins. The amount of
substituted resin was calculated
by multiplying the amount of
corresponding recycled resin by
the substitution rate. The waste
plastic composition data was
obtained from a composition
survey of waste plastics by a
specific material recycler [24].
The ratio of other materials was
quoted from the Ministry of the
Environment [25] and the
Japan Plastic Containers and
Packaging Recycling
Association [14]. LLDPE linear
low-density polyethylene,
PA polyamide
58 J Mater Cycles Waste Manag (2012) 14:52–64
123
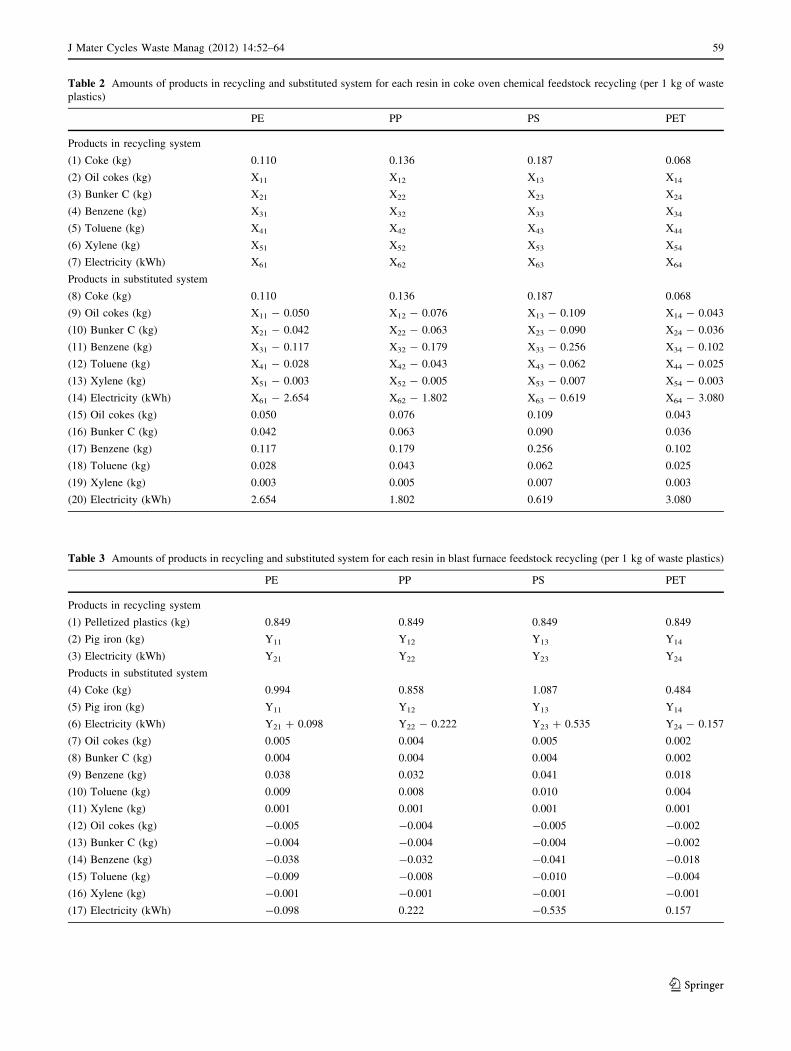
Table 2 Amounts of products in recycling and substituted system for each resin in coke oven chemical feedstock recycling (per 1 kg of waste
plastics)
PE PP PS PET
Products in recycling system
(1) Coke (kg) 0.110 0.136 0.187 0.068
(2) Oil cokes (kg) X11 X12 X13 X14
(3) Bunker C (kg) X21 X22 X23 X24
(4) Benzene (kg) X31 X32 X33 X34
(5) Toluene (kg) X41 X42 X43 X44
(6) Xylene (kg) X51 X52 X53 X54
(7) Electricity (kWh) X61 X62 X63 X64
Products in substituted system
(8) Coke (kg) 0.110 0.136 0.187 0.068
(9) Oil cokes (kg) X11 - 0.050 X12 - 0.076 X13 - 0.109 X14 - 0.043
(10) Bunker C (kg) X21 - 0.042 X22 - 0.063 X23 - 0.090 X24 - 0.036
(11) Benzene (kg) X31 - 0.117 X32 - 0.179 X33 - 0.256 X34 - 0.102
(12) Toluene (kg) X41 - 0.028 X42 - 0.043 X43 - 0.062 X44 - 0.025
(13) Xylene (kg) X51 - 0.003 X52 - 0.005 X53 - 0.007 X54 - 0.003
(14) Electricity (kWh) X61 - 2.654 X62 - 1.802 X63 - 0.619 X64 - 3.080
(15) Oil cokes (kg) 0.050 0.076 0.109 0.043
(16) Bunker C (kg) 0.042 0.063 0.090 0.036
(17) Benzene (kg) 0.117 0.179 0.256 0.102
(18) Toluene (kg) 0.028 0.043 0.062 0.025
(19) Xylene (kg) 0.003 0.005 0.007 0.003
(20) Electricity (kWh) 2.654 1.802 0.619 3.080
Table 3 Amounts of products in recycling and substituted system for each resin in blast furnace feedstock recycling (per 1 kg of waste plastics)
PE PP PS PET
Products in recycling system
(1) Pelletized plastics (kg) 0.849 0.849 0.849 0.849
(2) Pig iron (kg) Y11 Y12 Y13 Y14
(3) Electricity (kWh) Y21 Y22 Y23 Y24
Products in substituted system
(4) Coke (kg) 0.994 0.858 1.087 0.484
(5) Pig iron (kg) Y11 Y12 Y13 Y14
(6) Electricity (kWh) Y21 ? 0.098 Y22 - 0.222 Y23 ? 0.535 Y24 - 0.157
(7) Oil cokes (kg) 0.005 0.004 0.005 0.002
(8) Bunker C (kg) 0.004 0.004 0.004 0.002
(9) Benzene (kg) 0.038 0.032 0.041 0.018
(10) Toluene (kg) 0.009 0.008 0.010 0.004
(11) Xylene (kg) 0.001 0.001 0.001 0.001
(12) Oil cokes (kg) -0.005 -0.004 -0.005 -0.002
(13) Bunker C (kg) -0.004 -0.004 -0.004 -0.002
(14) Benzene (kg) -0.038 -0.032 -0.041 -0.018
(15) Toluene (kg) -0.009 -0.008 -0.010 -0.004
(16) Xylene (kg) -0.001 -0.001 -0.001 -0.001
(17) Electricity (kWh) -0.098 0.222 -0.535 0.157
J Mater Cycles Waste Manag (2012) 14:52–64 59
123
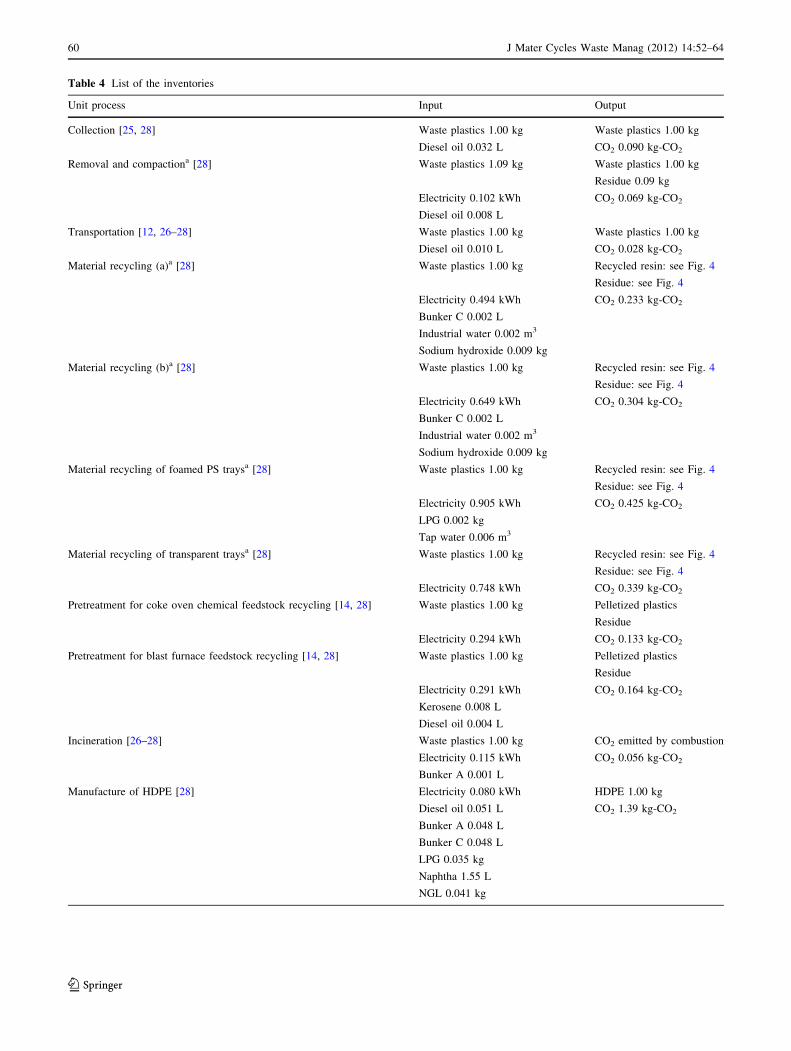
Table 4 List of the inventories
Unit process Input Output
Collection [25, 28] Waste plastics 1.00 kg Waste plastics 1.00 kg
Diesel oil 0.032 L CO2 0.090 kg-CO2
Removal and compactiona [28] Waste plastics 1.09 kg Waste plastics 1.00 kg
Residue 0.09 kg
Electricity 0.102 kWh CO2 0.069 kg-CO2
Diesel oil 0.008 L
Transportation [12, 26–28] Waste plastics 1.00 kg Waste plastics 1.00 kg
Diesel oil 0.010 L CO2 0.028 kg-CO2
Material recycling (a)a [28] Waste plastics 1.00 kg Recycled resin: see Fig. 4
Residue: see Fig. 4
Electricity 0.494 kWh CO2 0.233 kg-CO2
Bunker C 0.002 L
Industrial water 0.002 m3
Sodium hydroxide 0.009 kg
Material recycling (b)a [28] Waste plastics 1.00 kg Recycled resin: see Fig. 4
Residue: see Fig. 4
Electricity 0.649 kWh CO2 0.304 kg-CO2
Bunker C 0.002 L
Industrial water 0.002 m3
Sodium hydroxide 0.009 kg
Material recycling of foamed PS traysa [28] Waste plastics 1.00 kg Recycled resin: see Fig. 4
Residue: see Fig. 4
Electricity 0.905 kWh CO2 0.425 kg-CO2
LPG 0.002 kg
Tap water 0.006 m3
Material recycling of transparent traysa [28] Waste plastics 1.00 kg Recycled resin: see Fig. 4
Residue: see Fig. 4
Electricity 0.748 kWh CO2 0.339 kg-CO2
Pretreatment for coke oven chemical feedstock recycling [14, 28] Waste plastics 1.00 kg Pelletized plastics
Residue
Electricity 0.294 kWh CO2 0.133 kg-CO2
Pretreatment for blast furnace feedstock recycling [14, 28] Waste plastics 1.00 kg Pelletized plastics
Residue
Electricity 0.291 kWh CO2 0.164 kg-CO2
Kerosene 0.008 L
Diesel oil 0.004 L
Incineration [26–28] Waste plastics 1.00 kg CO2 emitted by combustion
Electricity 0.115 kWh CO2 0.056 kg-CO2
Bunker A 0.001 L
Manufacture of HDPE [28] Electricity 0.080 kWh HDPE 1.00 kg
Diesel oil 0.051 L CO2 1.39 kg-CO2
Bunker A 0.048 L
Bunker C 0.048 L
LPG 0.035 kg
Naphtha 1.55 L
NGL 0.041 kg
60 J Mater Cycles Waste Manag (2012) 14:52–64
123
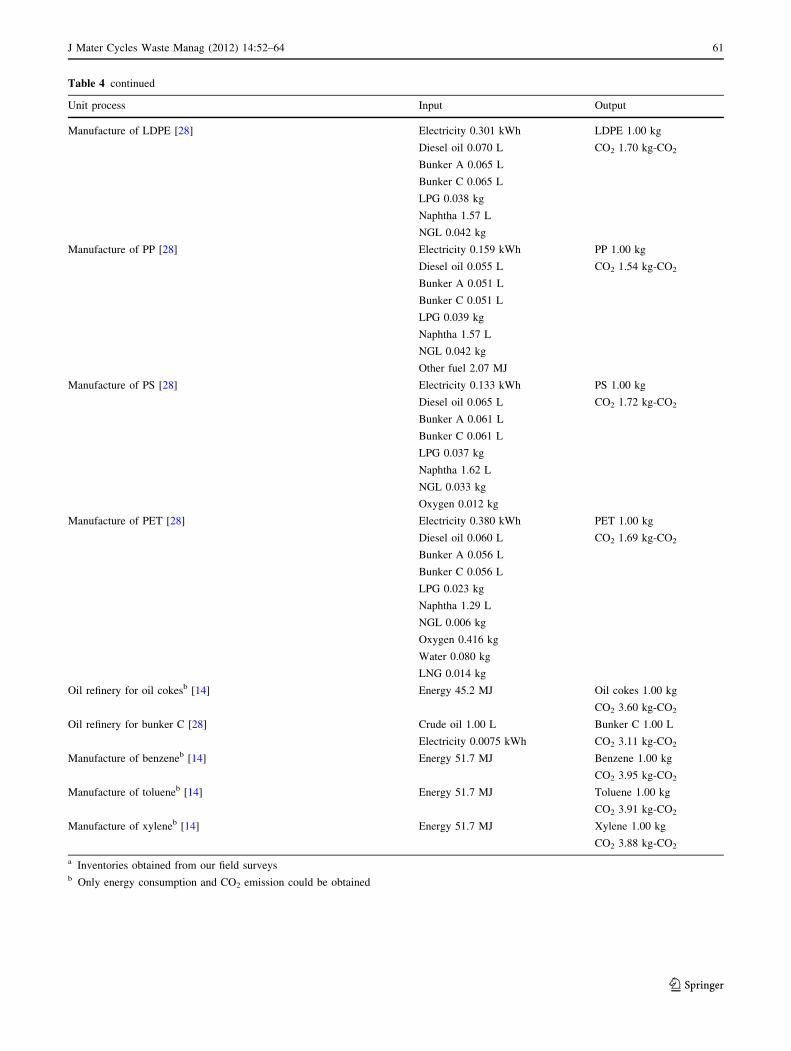
Table 4 continued
Unit process Input Output
Manufacture of LDPE [28] Electricity 0.301 kWh LDPE 1.00 kg
Diesel oil 0.070 L CO2 1.70 kg-CO2
Bunker A 0.065 L
Bunker C 0.065 L
LPG 0.038 kg
Naphtha 1.57 L
NGL 0.042 kg
Manufacture of PP [28] Electricity 0.159 kWh PP 1.00 kg
Diesel oil 0.055 L CO2 1.54 kg-CO2
Bunker A 0.051 L
Bunker C 0.051 L
LPG 0.039 kg
Naphtha 1.57 L
NGL 0.042 kg
Other fuel 2.07 MJ
Manufacture of PS [28] Electricity 0.133 kWh PS 1.00 kg
Diesel oil 0.065 L CO2 1.72 kg-CO2
Bunker A 0.061 L
Bunker C 0.061 L
LPG 0.037 kg
Naphtha 1.62 L
NGL 0.033 kg
Oxygen 0.012 kg
Manufacture of PET [28] Electricity 0.380 kWh PET 1.00 kg
Diesel oil 0.060 L CO2 1.69 kg-CO2
Bunker A 0.056 L
Bunker C 0.056 L
LPG 0.023 kg
Naphtha 1.29 L
NGL 0.006 kg
Oxygen 0.416 kg
Water 0.080 kg
LNG 0.014 kg
Oil refinery for oil cokesb [14] Energy 45.2 MJ Oil cokes 1.00 kg
CO2 3.60 kg-CO2
Oil refinery for bunker C [28] Crude oil 1.00 L Bunker C 1.00 L
Electricity 0.0075 kWh CO2 3.11 kg-CO2
Manufacture of benzeneb [14] Energy 51.7 MJ Benzene 1.00 kg
CO2 3.95 kg-CO2
Manufacture of tolueneb [14] Energy 51.7 MJ Toluene 1.00 kg
CO2 3.91 kg-CO2
Manufacture of xyleneb [14] Energy 51.7 MJ Xylene 1.00 kg
CO2 3.88 kg-CO2
a Inventories obtained from our field surveysb Only energy consumption and CO2 emission could be obtained
J Mater Cycles Waste Manag (2012) 14:52–64 61
123
environmental saving of independent plastic tray recycling
is maximized when it is integrated with conventional
material recycling (a) or energy recovery.
Scenarios including both residue recycling
and independent plastic tray recycling
Scenarios where both residue recycling and independent
plastic tray recycling are integrated with conventional
material recycling have smaller environmental loads than
the corresponding scenarios without independent plastic
tray recycling (the MaF1-0, MaF2-0, MbF1-0 and MbF2-0
scenarios). For the MaF1-1, MaF1-2, MaF2-1 and MaF2-2
scenarios, the plastic trays utilized through independent
plastic tray recycling would otherwise be utilized through
the feedstock recycling of residue in the MaF1-0 or MaF2-
0 scenario. This results in a smaller additional reduction of
environmental loads through independent plastic tray
recycling compared with the additional recycling in sce-
narios where only independent plastic tray recycling is
integrated with material recycling (a), i.e., the MaI-1 and
MaI-2 scenarios. The results indicate that independent
plastic tray recycling exhibits the lower additional envi-
ronmental saving when residue recycling is integrated with
conventional material recycling (a), because both addi-
tional recycling schemes aim to utilize PS and PET, which
-30
-40
-20
-10
0
10
MaI
-0M
aI-1
MaI
-2
MbI
-0M
bI-1
MbI
-2
F1-0
F1-1
F1-2
F2-0
F2-1
F2-2 I-0
I-1
I-2
MaF
1-0
MaF
1-1
MaF
1-2
MaF
2-0
MaF
2-1
MaF
2-2
MbF
1-0
MbF
1-1
MbF
1-2
MbF
2-0
MbF
2-1
MbF
2-2
Fos
sil r
esou
rce
cons
umpt
ion[
MJ/
kg-w
aste
pla
stic
s]
Electricity production (incineration) Incineration with power generationReplaced materials and fuel (residue) Recycling processes (residue)Replaced materials and fuel (conventional) Recycling processes (conventional)Removal & compaction CollectionReplaced materials and fuel (independent) Recycling processes (independent)Transportation Net
-4
-2
0
2
4
MaI
-0M
aI-1
MaI
-2
MbI
-0M
bI-1
MbI
-2
F1-0
F1-1
F1-2
F2-0
F2-1
F2-2 I-0
I-1
I-2
MaF
1-0
MaF
1-1
MaF
1-2
MaF
2-0
MaF
2-1
MaF
2-2
MbF
1-0
MbF
1-1
MbF
1-2
MbF
2-0
MbF
2-1
MbF
2-2
CO
2em
issi
on[k
g-C
O2
/kg-
was
te p
last
ics]
(2)
(1)
Fig. 5 Fossil resource
consumption (1) and CO2
emission (2) for each phase
62 J Mater Cycles Waste Manag (2012) 14:52–64
123
would otherwise be incinerated as residue from the mate-
rial recycling (a) processes.
Sensitivity analysis
Sensitivity analysis was conducted to examine the validity
of the critical assumptions. The results showed that, in the
range of plus or minus 50% for each parameter, both fossil
resource consumption and CO2 emission were the most
sensitive to the substitution rate of recycled resins pro-
duced by conventional material recycling (a) and (b).
Therefore, the results of sensitivity analysis for the sub-
stitution rate of recycled resins are indicated by error bars
in Fig. 5.
Conclusions
In this study, we evaluated and compared recycling
schemes for household waste plastic containers and pack-
aging from the viewpoints of fossil resource consumption
and CO2 emission. Various scenarios were developed
through integrating the conventional recycling scheme,
which involved municipal curbside collection and either
material recycling or feedstock recycling, with a couple of
additional recycling schemes, i.e., feedstock recycling of
the residue from conventional material recycling processes
and/or independent material recycling of foamed PS trays
and transparent trays.
Both indicators represented a similar tendency regarding
relative overall environmental performances among the
scenarios, except that CO2 emission of recycling processes
was comparably larger than that of the other processes in
contrast to fossil resource consumption, because CO2
emission of recycling processes involved CO2 emission
due to combustion of the plastics themselves. Among all
scenarios, the net environmental loads were smaller in
scenarios integrating independent plastic tray recycling
with coke oven chemical feedstock recycling, and they
were reduced in all scenarios including the additional
recycling schemes compared with the corresponding sce-
narios that only involved conventional recycling or energy
recovery. The residue recycling scheme and independent
plastic tray recycling scheme maximized their additional
environmental saving when they were integrated with
conventional material recycling (a). On the other hand,
independent plastic tray recycling exhibited a lower addi-
tional reduction when residue recycling was integrated
with conventional material recycling (a), because both
additional recycling schemes aimed to utilize PS and PET,
which would otherwise be incinerated as residue from the
material recycling (a) processes. The same was true of
material recycling (b), and the overall environmental loads
in scenarios including material recycling (b) were smaller
than those in scenarios including material recycling (a).
The practical implications obtained from this study are
summarized below. In the case where no recycling schemes
of waste plastics have yet been introduced, independent
material recycling of foamed PS trays and transparent trays
integrated with coke oven chemical feedstock recycling of
the other waste plastics should be chosen from the view-
points of reduction of the net environmental loads. In
the case where conventional material recycling (a) or
(b) schemes have already been introduced, independent
material recycling of foamed PS trays and transparent trays
integrated with coke oven chemical feedstock recycling of
the residue from material recycling processes should be
chosen, and if only one additional recycling scheme can be
introduced, the addition of coke oven chemical feedstock
recycling of the residue from material recycling processes
can maximize the additional environmental saving.
In this paper, it was found that the additional environ-
mental saving through the additional recycling schemes
depended on the type of the conventional recycling scheme
integrated with them. The results empirically indicated that
evaluation of the environmental loads of individual recy-
cling technologies, as conducted in previous studies, was
insufficient to investigate recycling schemes that maximize
the net environmental performance of the whole recycling
system. In this paper, to evaluate and compare the overall
environmental performance in scenarios including addi-
tional recycling schemes, LCA based on the modeling of
recycling processes considering the resin composition of
waste plastics in terms of the quantity of each recycled
product was applied from the viewpoints of the whole
recycling system, which made it possible to investigate
recycling schemes that integrate different technologies to
maximize their environmental potential. Evaluation from
both bird’s-eye and insect’s-eye viewpoints is an essential
step in investigating more desirable recycling systems.
Acknowledgments The authors are grateful to the anonymous
Japanese recyclers who provided valuable information.
References
1. Plastic Waste Management Institute (2010) Plastic products,
plastic waste and resource recovery. PWMI Newsletter No. 39
(in Japanese)
2. The Japan Plastic Containers and Packaging Recycling Associ-
ation. http://www.jcpra.or.jp/eng/index.html. Accessed 28 Dec
2010 (in Japanese)
3. Moriguchi Y (2005) Plastic waste issues from the viewpoint of a
sound material-cycle society. Haikibutsu gakkaishi 16(5):243–
252 (in Japanese)
4. Ministry of the Environment and Ministry of Economy, Trade
and Industry, Government of Japan (2010) Council documents
(in Japanese)
J Mater Cycles Waste Manag (2012) 14:52–64 63
123
5. Arena U, Mastellone ML, Perugini F (2003) Life cycle assessment
of a plastic packaging recycling system. Int J LCA 8(2):92–98
6. Perugini F, Mastellone ML, Arena U (2005) A life cycle assess-
ment of material and feedstock recycling options for management
of plastic packaging wastes. Process Integr 24(2):137–154
7. Molgaard C (1995) Environmental impacts by disposal of plastic
from municipal solid waste. Resour Conservat Recycl 15(1):51–63
8. Amelia LC, Jane CP (1996) Lifecycle assessment and economic
evaluation of recycling: a case study. Resour Conserv Recycl
17(2):75–96
9. Wollny V, Dehoust G, Fritsche UR, Weinem P (2002) Compar-
ison of plastic packaging waste management options—feedstock
recycling versus energy recovery in Germany. J Ind Ecol
5(3):49–63
10. Eriksson O, Reich MC, Frostell B, Bjorklund A, Assefa G,
Sundqvist JO, Granath J, Baky A, Thyselius L (2005) Municipal
solid waste management from a systems perspective. J Cleaner
Prod 13(3):241–252
11. Finnveden G, Johansson J, Lind P, Moberg A (2005) Life cycle
assessment of energy from solid waste—part 1: general meth-
odology and results. J Cleaner Prod 13(3):213–229
12. Inaba R, Hashimoto S, Moriguchi Y (2005) Life cycle assessment
of recycling in the steel industry for plastic containers and
packaging—influence of system boundary. Haikibutsu gakkai
ronbunshi 16(6):467–480 (in Japanese)
13. Nakatani J, Aramaki T, Hanaki K (2007) Multi-aspect impact
assessment of plastics waste management: a case study of Ka-
wasaki city. Kankyokagakukaishi 20(3):181–194 (in Japanese)
14. The Japan Plastic Containers and Packaging Recycling Associ-
ation (2007) Environmental assessment of recycling technologies
for plastic containers and packaging (in Japanese)
15. Plastic Waste Management Institute (2006) Eco-efficiency in
management of plastic containers and packaging (in Japanese)
16. Plastic Waste Management Institute (2008) Feasibility assess-
ment of material recycling of plastic containers and packaging
based on life cycle assessment (in Japanese)
17. Sekine Y, Fukuda K, Kato K, Adachi Y, Matsuno Y (2009) CO2
reduction potentials by utilizing waste plastics in steel works. Int
J Life Cycle Assess 14(2):122–136
18. Larsen AW, Merrild H, Møller J, Christensen TH (2010) Waste
collection systems for recyclables: an environmental and eco-
nomic assessment for the municipality of Aarhus (Denmark).
Waste Manag 30:744–754
19. Nakatani J, Fujii M, Moriguchi Y, Hirao M (2010) Life-cycle
assessment of domestic and transboundary recycling of post-
consumer PET bottles. Int J Life Cycle Assess 15:590–597
20. Kato K, Nomura S, Uematsu H (2003) Waste plastics recycling
process using coke ovens. J Mater Cycles Waste Manag 5(2):98–101
21. Fukushima M, Shioya M, Wakai K, Ibe H (2009) Toward max-
imizing the recycling rate in a Sapporo waste plastics liquefaction
plant. J Mater Cycles Waste Manag 11(1):11–18
22. Fukushima M, Beil W, Ibe H, Wakai K, Sugiyama E, Abe H,
Kitagawa K, Tsuruga S, Shimura K, Ono E (2010) Study on
dechlorination technology for municipal waste plastics containing
polyvinyl chloride and polyethylene terephthalate. J Mater Cycles
Waste Manag 12(2):108–122
23. National Institute for Environmental Studies (in Japanese)
http://www-cycle.nies.go.jp/precycle/index.html. Accessed on 28
Dec 2010
24. Ministry of the Environment and Ministry of Economy, Trade
and Industry, Government of Japan (2007) Council documents (in
Japanese)
25. Ministry of the Environment, Government of Japan (2003) Field
survey on disposal of containers and packaging wastes (in
Japanese)
26. Matsuto T, Tanaka N (2000) Estimation of household waste flow.
Haikibutsu gakkai ronbunshi 11(4):214–223 (in Japanese)
27. Matsuto T (2005) Analysis, planning, and assessment for man-
agement system of municipal waste. Gihodo syuppan, Tokyo (in
Japanese)
28. Japan Environmental Management Association for Industry
(2004) JLCA-LCA database 2004Fy, 2nd edn (in Japanese)
64 J Mater Cycles Waste Manag (2012) 14:52–64
123