Embed Size (px)
Citation preview
Ma terials Sci ence & Technolog y
Life Cycle Assessment LCA
of Li-Ion batteries for
electric vehicles
1. Project goals
2. Presentation of a typical battery
from cradle to gate
3. LCA results
M. Gauch, R. Widmer, D. Notter, A. Stamp, H.J. Althaus, P. Wäger
Empa - Swiss Federal Laboratories for Materials Testing and Research
TSL Technology and Society Lab
2009
Materials for Energy Technologies
graphics: Empa
Ma terials Sci ence & Technolog y2
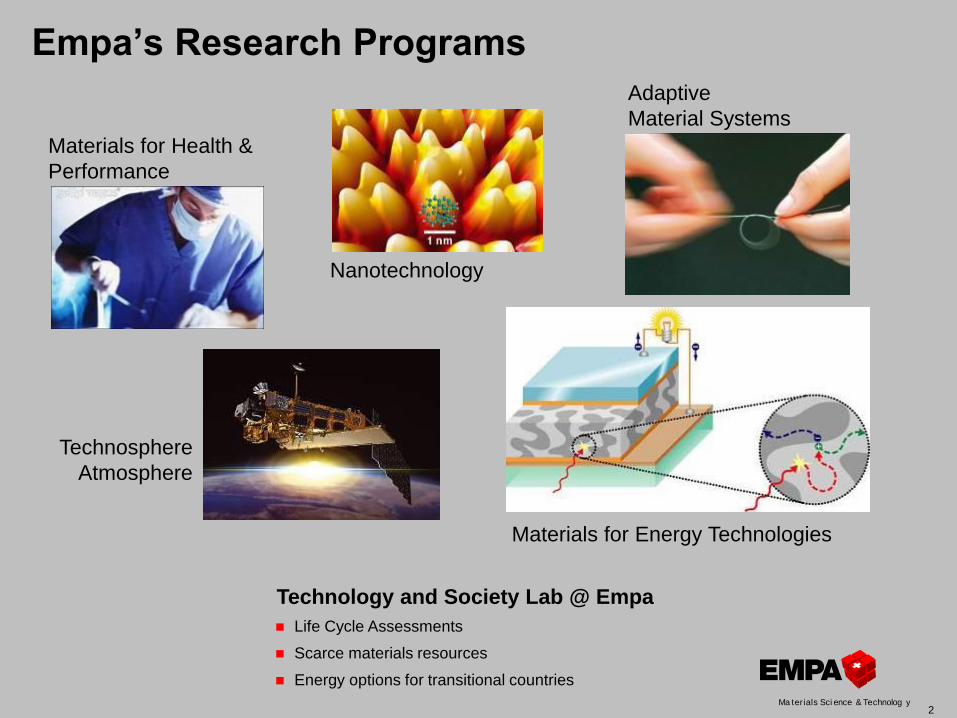
Empa’s Research Programs
Materials for Health &
Performance
Technosphere
Atmosphere
Materials for Energy Technologies
Nanotechnology
Adaptive
Material Systems
Technology and Society Lab @ Empa
Life Cycle Assessments
Scarce materials resources
Energy options for transitional countries

Ma terials Sci ence & Technolog y3
Project goals
4 In-wheel motors (each 30 kg), > 400 PS / 160 km autonomy
Removal of drivetrain components: 1000 pounds (454kg)
Batteries LiIon 1000 pounds (40kWh),
Prototype for tuningfare SEMA Las Vegas Nov ‘08
Foto: www.hypadrive.com
Detailed cradle-to-gate Life Cycle Inventory LCI of a modern Li-Ion battery
Special focus on Lithium mining and refining to battery-grade material
Integration of the results in ecoinvent database
Evaluation of the environmental impacts with Life Cycle Assessment LCA tools
- how harmful is the battery / a vehicle / a km in comparison with a standard ICE car?
ecoinvent
The most comprehensive public worldwide
database for Life Cycle Inventories.
More than 4000 process on energy
supply, resource extraction, material
supply, chemicals, metals, agriculture,
waste management services, transport
services
Based on industry data, compiled by
independent experts
Consistent, validated and transparent
Ma terials Sci ence & Technolog y4
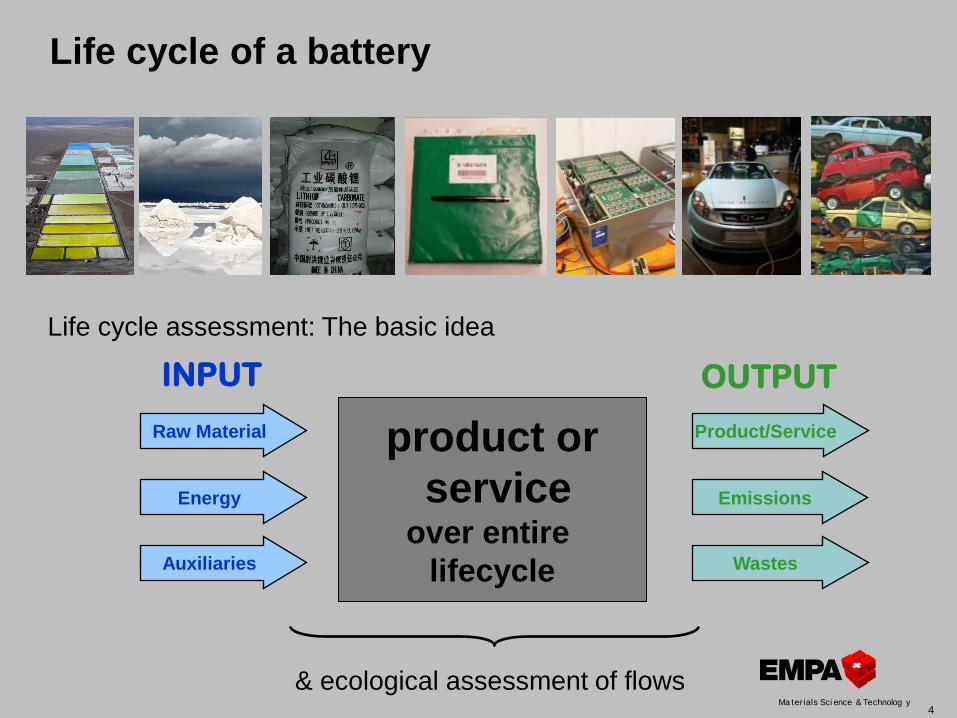
Life cycle of a battery
Life cycle assessment: The basic idea
& ecological assessment of flows
OUTPUT
Product/Service
Emissions
Wastes
INPUT
Raw Material
Energy
Auxiliaries
product or
service over entire
lifecycle

Ma terials Sci ence & Technolog y5
A Li-Ion Battery is built (Manganese oxide type)
Al foil
Brines Li2CO3
LiMn2O4
+binder+solvent
coating
Cathode
Separator
Cu foil
Graphite
+binder+solvent
Anode
PE foil Cell
Ethylene
carbonate
+ LiPF6 Electrolyte
Battery Pack
winding/stacking
filling/sealing coating
Enclosure
Electronics, BMS
Wires &
Connectors
assembly
active electrode material
mining & refining
of Al, Cu, Mn, C,
...
Two foils and a thin separator that is permeable to ions are wound or folded into a stack
to pack a big surface into a low volume
This stack is inserted in a pouch or case, filled with Li-salt electrolyte and sealed.
-> The cell is ready (assumption for this study: 3.7V; 40Ah; 130 Wh/kg; 5C_cont.)
These cells are combined in series or parallel and completed with a battery management
system (BMS) and the necessary wirings. This assembly is fit into an enclosure
-> The battery pack is ready
Assumption for this study: 100Wh/kg, 5C_cont, 30kWh, 300kg graphics: Empa
Ma terials Sci ence & Technolog y6
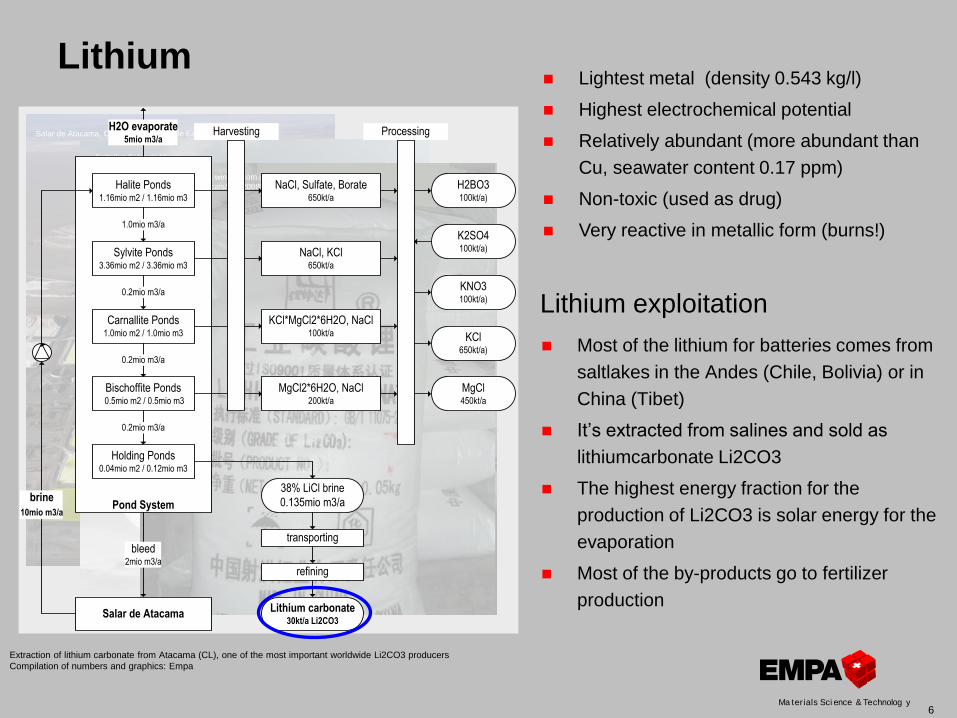
Lithium
Most of the lithium for batteries comes from
saltlakes in the Andes (Chile, Bolivia) or in
China (Tibet)
It’s extracted from salines and sold as
lithiumcarbonate Li2CO3
The highest energy fraction for the
production of Li2CO3 is solar energy for the
evaporation
Most of the by-products go to fertilizer
production
Extraction of lithium carbonate from Atacama (CL), one of the most important worldwide Li2CO3 producers
Compilation of numbers and graphics: Empa
Salar de Atacama, Chile, Picture: Google Earth
Saltpiles Salar de Uyuni
http://tqchemicals.win.mofcom.gov.cn
/www/10/tqchemicals/img/20085995252.jpg
Pond System
Halite Ponds1.16mio m2 / 1.16mio m3
Sylvite Ponds3.36mio m2 / 3.36mio m3
Carnallite Ponds1.0mio m2 / 1.0mio m3
1.0mio m3/a
Bischoffite Ponds 0.5mio m2 / 0.5mio m3
Holding Ponds0.04mio m2 / 0.12mio m3
refining
transporting
brine
10mio m3/a
NaCl, Sulfate, Borate650kt/a
NaCl, KCl650kt/a
KCl*MgCl2*6H2O, NaCl100kt/a
MgCl2*6H2O, NaCl200kt/a
Lithium carbonate 30kt/a Li2CO3
ProcessingHarvesting
38% LiCl brine
0.135mio m3/a
H2BO3100kt/a)
K2SO4100kt/a)
KNO3100kt/a)
KCl650kt/a)
MgCl450kt/a
Salar de Atacama
bleed2mio m3/a
H2O evaporate5mio m3/a
0.2mio m3/a
0.2mio m3/a
0.2mio m3/a
Lightest metal (density 0.543 kg/l)
Highest electrochemical potential
Relatively abundant (more abundant than
Cu, seawater content 0.17 ppm)
Non-toxic (used as drug)
Very reactive in metallic form (burns!)
Lithium exploitation
Ma terials Sci ence & Technolog y7
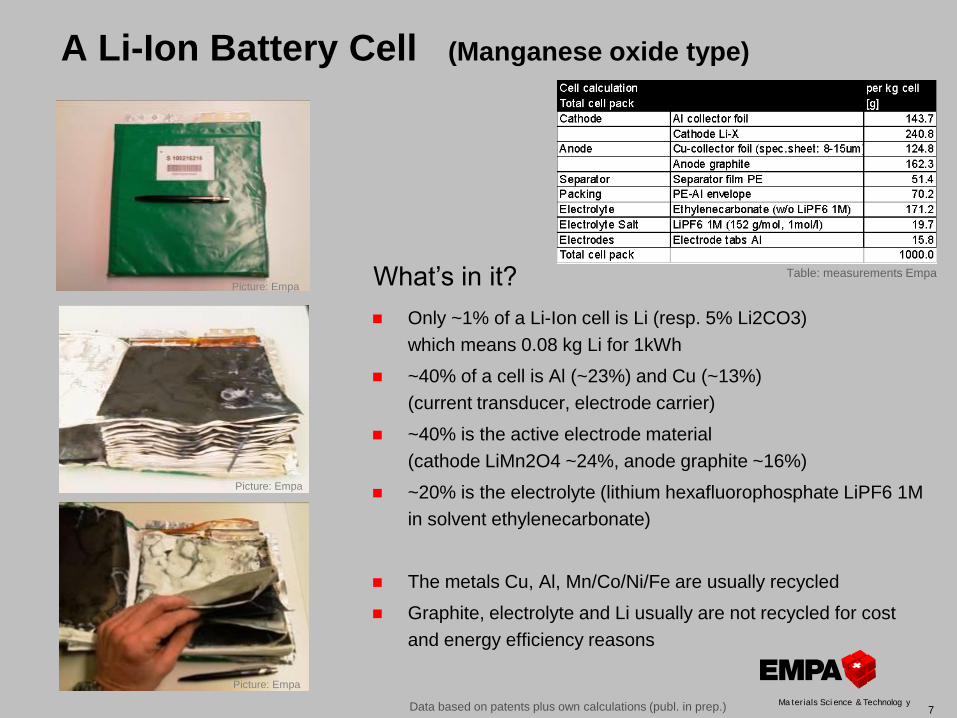
A Li-Ion Battery Cell (Manganese oxide type)
Only ~1% of a Li-Ion cell is Li (resp. 5% Li2CO3)
which means 0.08 kg Li for 1kWh
~40% of a cell is Al (~23%) and Cu (~13%)
(current transducer, electrode carrier)
~40% is the active electrode material
(cathode LiMn2O4 ~24%, anode graphite ~16%)
~20% is the electrolyte (lithium hexafluorophosphate LiPF6 1M
in solvent ethylenecarbonate)
The metals Cu, Al, Mn/Co/Ni/Fe are usually recycled
Graphite, electrolyte and Li usually are not recycled for cost
and energy efficiency reasons
What’s in it?
Data based on patents plus own calculations (publ. in prep.)
Picture: Empa
Picture: Empa
Picture: Empa
Table: measurements Empa
Ma terials Sci ence & Technolog y8
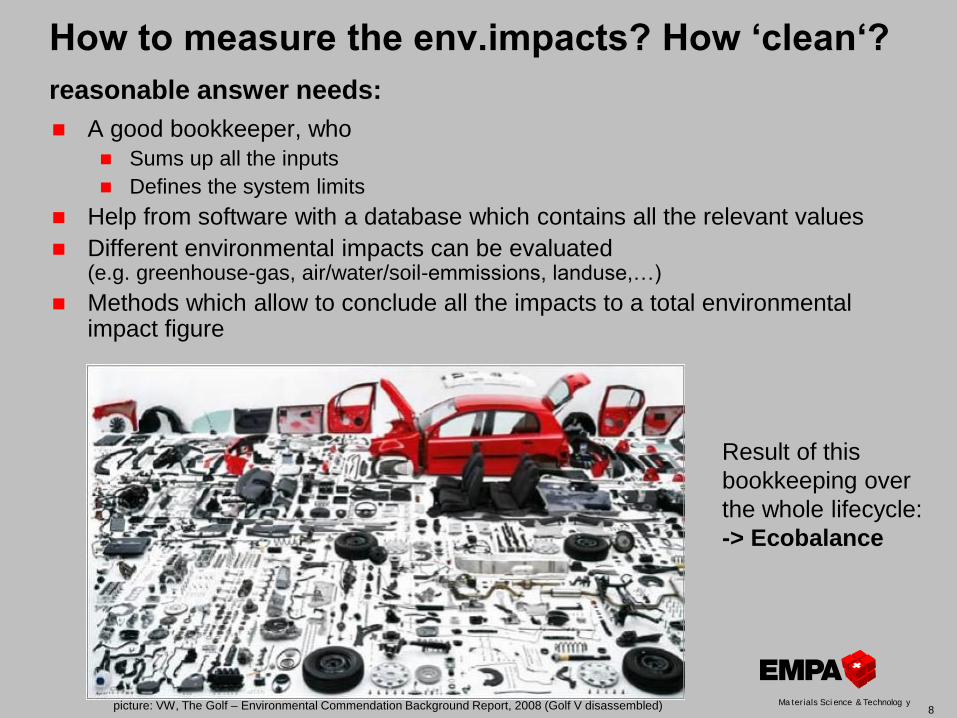
How to measure the env.impacts? How ‘clean‘?
reasonable answer needs:
A good bookkeeper, who
Sums up all the inputs
Defines the system limits
Help from software with a database which contains all the relevant values
Different environmental impacts can be evaluated (e.g. greenhouse-gas, air/water/soil-emmissions, landuse,…)
Methods which allow to conclude all the impacts to a total environmental impact figure
picture: VW, The Golf – Environmental Commendation Background Report, 2008 (Golf V disassembled)
Result of this
bookkeeping over
the whole lifecycle:
-> Ecobalance

Ma terials Sci ence & Technolog y9
LCA result Comparison: ICE / BEV vehicle production
Producing a BEV incl. battery causes significantly more damage than a conventional ICE car
Producing an electric drivetrain w/o battery causes slightly less damage than an ICE drivetrain
Global warming potential GWP (kg CO2-eq) of the car production (w/o operation)
Total environmental impact (ecoindicator EI99 points) of the car production (w/o operation)
BEV, golf-class,
300kg battery 30kWh
~200km autonomy in NEDC
ICE, golf-class
Data from: ecoinvent database plus own calculations (publ. in prep.)
3'737
3'737
1'461
1'350 1'682
- 1'000 2'000 3'000 4'000 5'000 6'000 7'000 8'000
Standard car
Electric car
Global Warming Potential GWP [kg CO2-eq.]
Glider
ICE drivetrain
El. Drivetrain
Battery (300kg)
270
270
127
120 232
- 100 200 300 400 500 600 700
Standard car
Electric car
Ecoindicator EI99 [Pt.]
Glider
ICE drivetrain
El. Drivetrain
Battery (300kg)
plus ~30%
plus ~57%
Ma terials Sci ence & Technolog y10
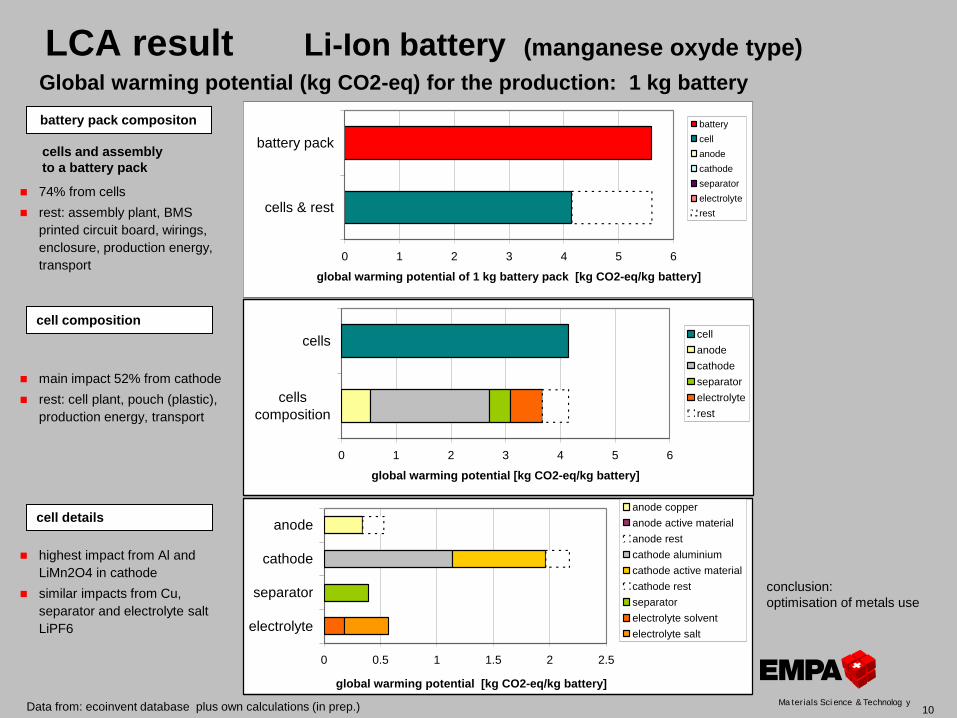
LCA result Li-Ion battery (manganese oxyde type)
main impact 52% from cathode
rest: cell plant, pouch (plastic),
production energy, transport
Global warming potential (kg CO2-eq) for the production: 1 kg battery
cells and assembly
to a battery pack
Data from: ecoinvent database plus own calculations (in prep.)
0 1 2 3 4 5 6
battery pack
cells & rest
global warming potential of 1 kg battery pack [kg CO2-eq/kg battery]
battery
cell
anode
cathode
separator
electrolyte
rest
0 1 2 3 4 5 6
cells
cells
composition
global warming potential [kg CO2-eq/kg battery]
cell
anode
cathode
separator
electrolyte
rest
0 0.5 1 1.5 2 2.5
anode
cathode
separator
electrolyte
global warming potential [kg CO2-eq/kg battery]
anode copper
anode active material
anode rest
cathode aluminium
cathode active material
cathode rest
separator
electrolyte solvent
electrolyte salt
cell composition
battery pack compositon
cell details
74% from cells
rest: assembly plant, BMS
printed circuit board, wirings,
enclosure, production energy,
transport
highest impact from Al and
LiMn2O4 in cathode
similar impacts from Cu,
separator and electrolyte salt
LiPF6
conclusion:
optimisation of metals use
Ma terials Sci ence & Technolog y11
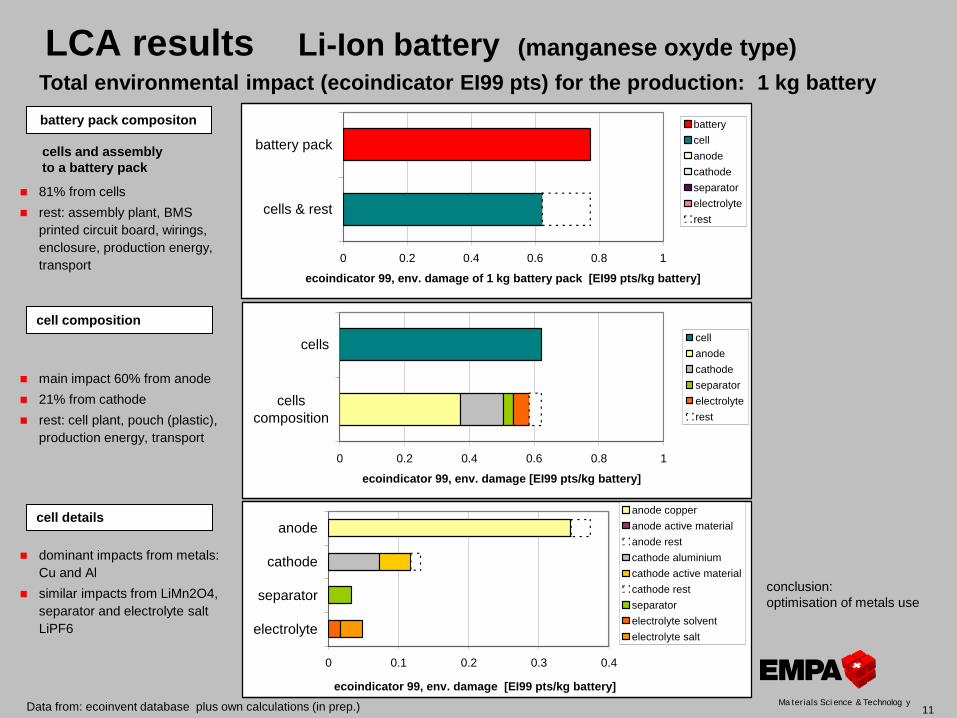
LCA results Li-Ion battery (manganese oxyde type)
main impact 60% from anode
21% from cathode
rest: cell plant, pouch (plastic),
production energy, transport
Total environmental impact (ecoindicator EI99 pts) for the production: 1 kg battery
cells and assembly
to a battery pack
Data from: ecoinvent database plus own calculations (in prep.)
cell composition
battery pack compositon
cell details
81% from cells
rest: assembly plant, BMS
printed circuit board, wirings,
enclosure, production energy,
transport
dominant impacts from metals:
Cu and Al
similar impacts from LiMn2O4,
separator and electrolyte salt
LiPF6
0 0.2 0.4 0.6 0.8 1
battery pack
cells & rest
ecoindicator 99, env. damage of 1 kg battery pack [EI99 pts/kg battery]
battery
cell
anode
cathode
separator
electrolyte
rest
0 0.2 0.4 0.6 0.8 1
cells
cells
composition
ecoindicator 99, env. damage [EI99 pts/kg battery]
cell
anode
cathode
separator
electrolyte
rest
0 0.1 0.2 0.3 0.4
anode
cathode
separator
electrolyte
ecoindicator 99, env. damage [EI99 pts/kg battery]
anode copper
anode active material
anode rest
cathode aluminium
cathode active material
cathode rest
separator
electrolyte solvent
electrolyte salt
conclusion:
optimisation of metals use

Ma terials Sci ence & Technolog y12
LCA: Entire lifecycle Comparison ICE / BEV vehicle
Due to the higher efficiency in the operation there is a significant advantage for the BEV over the whole
lifecycle, even if operated with electricity including a relatively high fossil energy fraction
Global warming potential (kg CO2-eq) over entire lifecycle (production + 150’000km operation)
Total environmental impact (EI99 pts) over entire lifecycle (production + 150’000km operation)
BEV, EU-electricity
(UCTE-mix, 593 gCO2eq/kWh)
300kg battery
ICE, gasoline EURO4
avg. europ. car (golf-class)
Data from: ecoinvent database plus own calculations (publ. in prep.)
3'737
3'737
1'461
1'350
36'117
12'7481'682
- 5'000 10'000 15'000 20'000 25'000 30'000 35'000 40'000 45'000
Standard car
Electric car
Global Warming Potential GWP [kg CO2-eq./150'000km]
Glider
ICE drivetrain
El. Drivetrain
Battery (300kg)
Operation
270
270
127
120 232
2'271
536
- 500 1'000 1'500 2'000 2'500 3'000
Standard car
Electric car
Ecoindicator EI99 [Pt./150'000km]
Glider
ICE drivetrain
El. Drivetrain
Battery (300kg)
Operation
minus ~53%
minus ~57%
(CH-mix, 134 gCO2eq/kWh)
(EU-coal-mix, 1095 gCO2eq/kWh)

Ma terials Sci ence & Technolog y13
Conclusion:
the transition from ICE cars to BEVs looks favorable from an environmental perspective
although the impact from BEV production is significantly higher than from ICE car production
very efficient ICE cars might be competitive with BEVs operated with electricity with very high
fossil footprint (pure coal power plants)
operated with low fossil energy containing electricity, BEVs perform better than the best
possible ICE car
your feedback is welcome! [email protected]
source: unknown


![AnalysisofGradientDescentsin RandomEnergiesandHeatBaths · Moreau [Mor70] [Mor71] [Mor76]. Rate-independent systems occur throughout physics, engineering, ma-terials science, finance](https://img.pdfslide.us/doc/110x75/5f0274627e708231d404584f/analysisofgradientdescentsin-randomene-moreau-mor70-mor71-mor76-rate-independent.jpg)