Embed Size (px)
Citation preview

Copyright @ 2019 By Journal of Sustainable Energy and Environment
Journal of Sustainable Energy & Environment
10 (2019) 65-73
65
Life cycle assessment and cost-benefit analysis of palm biorefinery in Thailand
for different empty fruit bunch (EFB) management scenarios
Nattaya Huailuek1,2, Thapat Silalertruksa1,2 and Shabbir H. Gheewala1,2,*
1The Joint Graduate School of Energy and Environment, King Mongkut’s University of Technology Thonburi,
Bangkok, Thailand 2Center of Excellence on Energy Technology and Environment, PERDO, Bangkok, Thailand
*Corresponding author: [email protected]
Abstract. Palm oil production has been growing over the past decade to fulfill the increased demands for vegetable oil and biodiesel.
Along with crude palm oil production, a substantial amount of palm biomass is produced, inappropriate management of which would
affect environmental performance, and consequently business competitiveness. Life cycle assessment (LCA) has been conducted to
assess the environmental impacts of five different palm biorefinery scenarios for empty fruit bunch (EFB) management comparing
them with the baseline scenario (i.e. mulching in oil palm plantations). The scenarios include (1) EFB and Palm Oil Mill Effluent
(POME) co-compost and cogeneration, (2) EFB based ethanol production and cogeneration, (3) EFB briquette production and
cogeneration, (4) EFB compost and cogeneration and (5) EFB cogeneration. The ReCiPe impact assessment methodology was used
considering seven impacts categories, viz., global warming, acidification, freshwater eutrophication, marine eutrophication,
photochemical oxidant formation, particular matter formation, and fossil depletion. The results revealed that the EFB and POME co-
compost and cogeneration (Scenario 1), EFB compost and cogeneration (Scenario 4), and EFB cogeneration (Scenario 5) could help
improve the environmental performance of the existing Thai palm oil industry. In terms of economic aspect, the cost-benefit analysis
and net present value (NPV) were used to evaluate each scenario’s investment. The EFB and POME co-compost production (Scenario
1), EFB briquette production (Scenario 3), EFB compost (Scenario 4) and EFB cogeneration (Scenario 5) were financially feasible.
However, the Scenario 1 was recommended due to the least investment and operation costs and the highest NPV. The EFB based
ethanol production (Scenario 2) was not financially feasible.
Keywords: Life Cycle Assessment, palm oil mill, biomass, biorefinery.
1. Introduction
Oil palm is one of the important crops which is recognized
worldwide as a feedstock for various products such as cooking
oil, oleochemicals, and biodiesel. The growing global demand for
palm oil has led to an increase in oil palm plantation area and
Fresh Fruit Bunch (FFB) production. From the year 2010 to 2017,
the global oil palm plantation area increased by around 27% and
the global FFB production also increased by 33%. Indonesia and
Malaysia are the two largest producers; the combined palm oil
production from those two countries accounting for about 85% of
the world’s palm oil production. Thailand is the third largest
producer sharing about 3% of the total palm oil production [1]. In
Thailand, oil palm is widely planted in the southern region of the
country. The total oil palm plantation area in 2017 was around
756,630 ha, which has been increased from 2010 by around 40%.
This was due to the growing demands for palm oil for domestic
use i.e. food as well as use as a raw material for biodiesel
industries. Around 14.6 million tonne of FFB were produced in
2017, which was an increase of about 77% from 2010 [1]. The
increase in palm oil production resulted in the increased palm
biomass generation.
Generally, at the palm oil mill, there are two main products,
i.e. crude palm oil (CPO) and palm kernel, generated along with
the palm biomass residues, i.e., empty fruit bunch (EFB), fiber,
shell and decanter cake. On a mass basis, the products and
residues generation per tonne of FFB processed include about
20% of CPO, 5% of palm kernel, 22-23% of EFB, 12-15% of
fiber, 4-7% of shell, and 3.5% of decanter cake [2-5]). To produce
a tonne of CPO, around 5-7.5 tonne of water is also required; about
50% of that water used will end up as the palm oil mill effluent
(POME) [5-6]. Currently, most of the palm oil mills in Thailand
have installed biogas capture systems and produce electricity to
sell to the Provincial Electricity Authority (PEA). It was evaluated
that this practice could reduce the greenhouse gas (GHG) emissions
of the palm oil production system by around 30% as compared to
the process without biogas capture [7]. Moreover, the treated
POME can be used as a liquid fertilizer which increasing FFB
production [8]. Fiber is used as a solid fuel for the in-house boiler
to produce steam for the milling process. Palm shell is sometimes
used partially as a fuel in the boiler. The rest of the shell is sold
to the other industries to be used as solid fuel. EFB, the major
biomass residues of the mill, is generally dumped or mulched in
plantation or used for mushroom cultivation. Decanter cake is
processed for producing animal feed [9-10].
Since the time environmental standards like ISO 14000
series were established, environmental performance has influenced
business competition. In addition, many of the sustainability
standards have also been launched such as Roundtable on
Sustainable Palm Oil (RSPO), Renewable Energy Directive of the
EU, Roundtable on Sustainable Biomaterials (RSB), and Global
Bioenergy Partnership (GBEP) to drive the industries in moving
towards sustainable production. There are several environmental
challenges for the palm oil industry to handle, one of the major
ones being waste management. The traditional waste management
approach like end-of-pipe treatment should be changed. The palm
oil mills nowadays try to cope with the palm biomass residues by
creating additional value from them. Palm biomass residues are
Journal of Sustainable Energy & Environment 10 (2019) 65-73
Copyright @ 2019 By Journal of Sustainable Energy and Environment 66
mostly lignocellulosic materials which can be further processed
and used in a variety of applications. For example, EFB has been
recommended to be used as a feedstock for ethanol production
[11-12], briquette production [13], co-composting [14], and power
generation [15]. Fiber can be used as feedstock for fiberboard;
while the shell can be used as feedstock for biochar, activated
carbon, and charcoal [16]. However, the different approaches of
palm biomass residues management will require additional unit
processes as well as the materials, chemicals, and energy which
in turn may result in additional environmental impacts. For
example, utilization of EFB as solid fuel requires the addition of
the shredding process and transportation of EFB to the boiler. Co-
composting of EFB with POME requires fuel for the mixing
process. Thus, life cycle assessment is necessary to evaluate the
environmental loads and potential environmental impacts associated
with palm oil mills and their new approach for palm biomass
residues management. The study, therefore, aims to explore the
current EFB management practices and the capability of those
practices for improving the environmental performance of the
palm oil mills in Thailand. The different systems of the palm oil
mill equipped with the various options of waste management and
utilization for producing the new products are therefore evaluated
using life cycle assessment. Moreover, the financial feasibility of
each practice is evaluated using the net present value (NPV). The
recommendations are expected to support the palm entrepreneurs’
decision making in selection of EFB management options.
2. Materials and methods
Life cycle assessment (LCA) was applied to evaluate the
environmental impacts of different palm biorefinery scenarios for
EFB management i.e. EFB cogeneration, EFB briquette production,
EFB composting and EFB based ethanol production. According
to Saswattecha et al. (2016) [15], the use of EFB as a solid fuel
for power generation could significantly reduce several
environmental impacts of the palm oil production system such as
acidification, eutrophication, and human toxicity, while, EFB as
briquette or compost could bring about environmental benefits as
well. Cellulosic ethanol production from EFB is also widely
discussed to substitute the current first generation bioethanol
production derived from food crops like sugarcane and cassava.
The ReCiPe methodology, an environmental impact
assessment method widely used in LCA [17], was chosen to use
in the study. The life cycle inventory (LCI) data from the
investigated biorefinery includes the emissions of substances
such as CO2, CH4, N2O, NOx, SOx and particulate matter (PM)
from palm biomass combustion, total N and total P from
fertilizers used and composting process. Hence, there are several
key environmental impacts categories relevant to the resources
used and emissions considered, i.e. global warming, acidification,
freshwater eutrophication, marine eutrophication, photochemical
oxidant formation, particular matter formation, and fossil depletion.
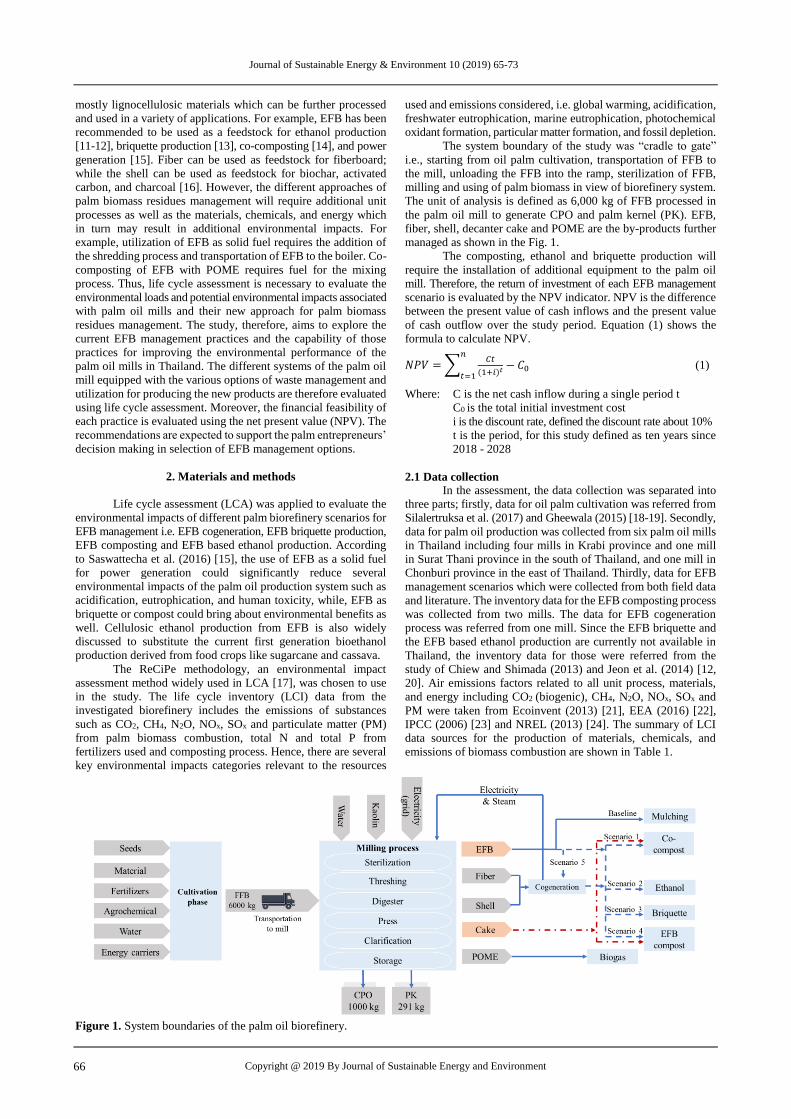
The system boundary of the study was “cradle to gate”
i.e., starting from oil palm cultivation, transportation of FFB to
the mill, unloading the FFB into the ramp, sterilization of FFB,
milling and using of palm biomass in view of biorefinery system.
The unit of analysis is defined as 6,000 kg of FFB processed in
the palm oil mill to generate CPO and palm kernel (PK). EFB,
fiber, shell, decanter cake and POME are the by-products further
managed as shown in the Fig. 1.
The composting, ethanol and briquette production will
require the installation of additional equipment to the palm oil
mill. Therefore, the return of investment of each EFB management
scenario is evaluated by the NPV indicator. NPV is the difference
between the present value of cash inflows and the present value
of cash outflow over the study period. Equation (1) shows the
formula to calculate NPV.
𝑁𝑃𝑉 =∑𝐶𝑡
(1+𝑖)𝑡− 𝐶0
𝑛
𝑡=1 (1)
Where: C is the net cash inflow during a single period t
C0 is the total initial investment cost
i is the discount rate, defined the discount rate about 10%
t is the period, for this study defined as ten years since
2018 - 2028
2.1 Data collection
In the assessment, the data collection was separated into
three parts; firstly, data for oil palm cultivation was referred from
Silalertruksa et al. (2017) and Gheewala (2015) [18-19]. Secondly,
data for palm oil production was collected from six palm oil mills
in Thailand including four mills in Krabi province and one mill
in Surat Thani province in the south of Thailand, and one mill in
Chonburi province in the east of Thailand. Thirdly, data for EFB
management scenarios which were collected from both field data
and literature. The inventory data for the EFB composting process
was collected from two mills. The data for EFB cogeneration
process was referred from one mill. Since the EFB briquette and
the EFB based ethanol production are currently not available in
Thailand, the inventory data for those were referred from the
study of Chiew and Shimada (2013) and Jeon et al. (2014) [12,
20]. Air emissions factors related to all unit process, materials,
and energy including CO2 (biogenic), CH4, N2O, NOx, SOx and
PM were taken from Ecoinvent (2013) [21], EEA (2016) [22],
IPCC (2006) [23] and NREL (2013) [24]. The summary of LCI
data sources for the production of materials, chemicals, and
emissions of biomass combustion are shown in Table 1.
Figure 1. System boundaries of the palm oil biorefinery.
Journal of Sustainable Energy & Environment 10 (2019) 65-73
Copyright @ 2019 By Journal of Sustainable Energy and Environment 67
Table 1. The summary of data sources for this study.
Unit processes/materials Activities References
Oil palm cultivation
- FFB Production of FFB
[18-19]
Palm oil production
1. Milling
- Electricity grid
- Kaolin
2. Steam and electricity generation
- Fiber
- Shell
3. Water treatment
- Alum
- Polymer
- Cl
- NaCl
4. Wastewater treatment
- POME
Production of grid electricity
Production of kaolin
Combustion of fiber
Combustion of shell
Production of alum
Production of polymer
Production of Cl
Production of NaCl
Anaerobic treatment of wastewater
[21]
[21]
[22-23]
[22-23]
[21]
[21]
[21]
[21]
[23]
Biorefinery concept
- Diesel
- NaOH
- Enzyme cellulase
- EFB
Production of diesel
Combustion of diesel
Production of NaOH
Production of Enzyme cellulase
Combustion of EFB
[21]
[21]
[24]
[24]
[22-23]
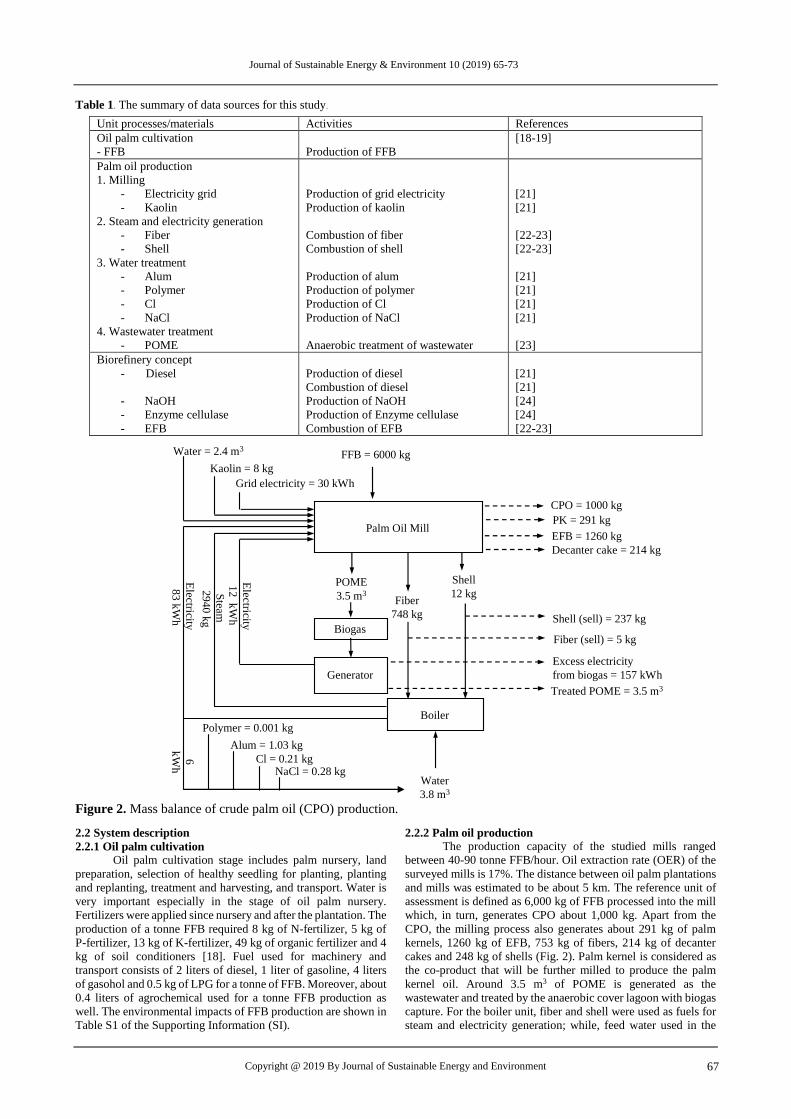
Figure 2. Mass balance of crude palm oil (CPO) production.
2.2 System description
2.2.1 Oil palm cultivation
Oil palm cultivation stage includes palm nursery, land
preparation, selection of healthy seedling for planting, planting
and replanting, treatment and harvesting, and transport. Water is
very important especially in the stage of oil palm nursery.
Fertilizers were applied since nursery and after the plantation. The
production of a tonne FFB required 8 kg of N-fertilizer, 5 kg of
P-fertilizer, 13 kg of K-fertilizer, 49 kg of organic fertilizer and 4
kg of soil conditioners [18]. Fuel used for machinery and
transport consists of 2 liters of diesel, 1 liter of gasoline, 4 liters
of gasohol and 0.5 kg of LPG for a tonne of FFB. Moreover, about
0.4 liters of agrochemical used for a tonne FFB production as
well. The environmental impacts of FFB production are shown in
Table S1 of the Supporting Information (SI).
2.2.2 Palm oil production
The production capacity of the studied mills ranged
between 40-90 tonne FFB/hour. Oil extraction rate (OER) of the
surveyed mills is 17%. The distance between oil palm plantations
and mills was estimated to be about 5 km. The reference unit of
assessment is defined as 6,000 kg of FFB processed into the mill
which, in turn, generates CPO about 1,000 kg. Apart from the
CPO, the milling process also generates about 291 kg of palm
kernels, 1260 kg of EFB, 753 kg of fibers, 214 kg of decanter
cakes and 248 kg of shells (Fig. 2). Palm kernel is considered as
the co-product that will be further milled to produce the palm
kernel oil. Around 3.5 m3 of POME is generated as the
wastewater and treated by the anaerobic cover lagoon with biogas
capture. For the boiler unit, fiber and shell were used as fuels for
steam and electricity generation; while, feed water used in the
FFB = 6000 kgWater = 2.4 m3
Kaolin = 8 kg
Grid electricity = 30 kWh
Fiber
748 kg
Boiler
Shell
12 kg
Water
3.8 m3
Polymer = 0.001 kg
Alum = 1.03 kg
Cl = 0.21 kgNaCl = 0.28 kg
POME
3.5 m3
Biogas
CPO = 1000 kg
PK = 291 kg
EFB = 1260 kg
Decanter cake = 214 kg
Fiber (sell) = 5 kg
Shell (sell) = 237 kg
Excess electricity
from biogas = 157 kWh
Treated POME = 3.5 m3
Electricity
12
kW
h
Steam
29
40 k
g
Electricity
83
kW
h
6
kW
h
Palm Oil Mill
Generator

Journal of Sustainable Energy & Environment 10 (2019) 65-73
Copyright @ 2019 By Journal of Sustainable Energy and Environment 68
boiler also required the treatment before. The system boundary of
assessment therefore includes the production and use of
chemicals such as polymer, alum, chlorine, and sodium chloride
for boiler feed water treatment. The boiler capacity of the studied
mills is about 30-45 tonne/hour of steam (2-6 MPa). The steam
turbine generator has a capacity of about 1.2 MW. Furthermore,
around 8 kg of kaolin is used per 6,000 kg of FFB in the
hydrocyclone process for separating the palm kernel from the
shell. The LCI for the processing of 1000 kg CPO in each mill is
presented in the Table S2 of the SI.
2.3 EFB management scenarios under the biorefinery concept
2.3.1 Baseline scenario
At present, EFB is generally sent to mulch in the oil palm
plantation areas owned by the mills. The transportation of EFB
from the mill to the plantation, around 5 km, is also accounted.
About 748 kg of fibers and 12 kg of shells are used as solid fuel
in the boilers at the mills to produce 2,940 kg of steam and 105
kWh of electricity (Fig. 2). The generated electricity from the
boiler is used inside the factory for the milling process, office, and
water treatment process. Nevertheless, the own-produced electricity
used internally in the mill is not adequate. About 30 kWh of
electricity from the grid is additionally required for the mill. The
electricity produced from biogas capture during POME treatment
is mainly sold to the PEA; only a small amount will be used in the
mill. Shells and decanter cake are sold as fuel and animal feed,
respectively.
2.3.2 Scenario 1: EFB and POME co-compost and cogeneration
In this scenario, EFB will be used for both electricity
generation and composting. For the cogeneration system, about
748 kg of fibers, 15 kg of shells and 205 kg of shredded EFB are
used as fuels to generate steam and electricity for internal use.
Compared to the baseline, the additional electricity obtained from
the utilization of EFB in the cogeneration system is subtracted by
the additional electricity used in the system for shredding EFB
and EFB compost. The electricity obtained from EFB can thus
reduce the grid electricity consumption of the mills from 30 kWh
(from baseline) to 17 kWh. Moreover, the composting technique
has been added to produce fertilizer from EFB and decanter cake.
For both cogeneration as well as composting, EFB needs to be
pretreated by pressing and shredding. The EFB weight reduces
from the initial 1260 kg (with 60% of moisture content) to 505 kg
(with less than 10% of moisture content) after the pretreatment.
The EFB pretreatment process consumes 13 kWh of electricity
(based on 10.3 kWh electricity per 1000 kg EFB).
After the EFB pretreatment, the EFB is divided for two
purposes. As mentioned above, about 205 kg of the pretreated EFB
is used as fuel in the cogeneration. The remaining pretreated EFB
of around 300 kg is used for composting. About 46 kg of decanter
cake is added into the process, and 0.5 m3 of the treated POME is
sprayed. About 2 kWh of electricity is used for the aeration process
during composting. At the end of this process, 115 kg of compost
is produced. In summary, the palm biorefinery (Scenario 1) generates
1000 kg of CPO as the main product, and the co-products include
291 kg of palm kernel, 168 kg of excess decanter cake, 234 kg of
excess shell, 5 kg of excess fiber, 157 kWh of excess electricity,
and 115 kg of EFB and POME co-compost.
2.3.3 Scenario 2: EFB based ethanol production and cogeneration
The feedstocks used for the boiler and cogeneration
system are the fiber, shell, and EFB which is the same as the
Scenario 1. However, ethanol production from EFB is added to
the system. In the production system, the EFB is shredded,
separated and used for two purposes. For the first purpose, about
265 kg of shredded EFB is used as fuel for the cogeneration
system along with 748 kg of fibers and 16 kg of shells. The
generated electricity is used in the milling process, water
treatment, shredder, and ethanol production at about 83, 8, 13 and
13 kWh, respectively. Nevertheless, the system still requires 20
kWh of the grid-electricity for running the process.
For the second purpose, about 240 kg of shredded EFB is
further treated with 139 kg of sodium hydroxide (NaOH) for
ethanol production. After that, the EFB is then hydrolyzed and
fermented with 40 FPU/g cellulose and 5% of Saccharomyces
cerevisiae (FPU stands for the filter paper unit which means of
the amount of enzyme capable of releasing one micromole
reducing sugar [25]). Energy consumption of the ethanol
production process is around 13 kWh, and about 35 kg ethanol is
obtained. In summary, the palm biorefinery system as Scenario 2
would generate the main product as 1000 kg of CPO, and co-
products including 291 kg of palm kernel, 214 kg of excess
decanter cake, 233 kg of excess shell, 5 kg of excess fiber, 157
kWh of excess electricity, and 35 kg of EFB based ethanol.
2.3.4 Scenario 3: EFB briquette production and cogeneration
Briquette production from EFB has been added in the
system to substitute the composting and the ethanol production in
Scenarios 1 and 2, respectively. In the system, around 630 kg of
EFB is pretreated by the pressing and shredding units. After the
pretreatment, the weight of EFB is reduced to around 252 kg with
less than 10% moisture content. The pretreatment process
consumes around 6 kWh. In this scenario, EFB is shredded and
used only for the boiler. The amounts of fiber, shell, and shredded
EFB used for the cogeneration are the same as in Scenario 2. The
steam and electricity generated in the factory are used internally
for the milling process, water treatment, EFB shredder, and EFB
briquette production. Nevertheless, the electricity from the boiler
is not sufficient for the EFB briquette production, and the use of
electricity from biogas is required. The remaining 630 kg of EFB
could be used as the raw material for briquette production. The
EFB briquette production requires about 0.11 kg of diesel, 29
kWh of electricity for the production of 210 kg of EFB briquette.
Accordingly, the products and co-products generated from the
Scenario 3 are about 1000 kg of CPO as the main product, while,
291 kg of palm kernel, 5 kg of excess fiber, 214 kg of excess
decanter cake, 234 kg of excess shell, 155 kWh of excess
electricity, and 210 kg of EFB briquette are co-products.
2.3.5 Scenario 4: EFB compost and cogeneration
The system is like Scenario 1 but with a different
technology used for fertilizer production. In Scenario 4, around
300 kg of EFB and 68 kg of decanter cake were composted in the
ponds and then left as a pile to reduce the moisture. After that, it
was sent as the feed to bio-mixer which is a machine for grinding
and pelletizing the compost by using the granular fertilizer
machine at 80ºC. The machine requires about 0.24 kWh of electricity
to produce 141 kg of compost. The remaining 960 kg of EFB will
be shredded and used as fuel for boiler together with 748 kg of
fiber and 17 kg of shells. About 384 kg of shredded EFB
remaining from this system can be used to produce electricity
which will increase the electricity production by around 55 kWh
as compared to the baseline scenario. The surplus electricity can
be sold to the grid system. Hence, the products and co-products
obtained from the Scenario 4 are main product 1000 kg of CPO,
with 291 kg of palm kernel, 5 kg of excess fiber, 146 kg of excess
decanter cake, 231 kg of excess shell, 168 kWh of excess
electricity, 141 kg of EFB compost as co-products.
2.3.6 Scenario 5: EFB cogeneration
In Scenario 5, EFB is only used as fuel for electricity
production. In the system, about 1260 kg of EFB is shredded
requiring about 13 kWh of electricity. After the shredding process,
about 505 kg of EFB (with less than 10% moisture content) is

Journal of Sustainable Energy & Environment 10 (2019) 65-73
Copyright @ 2019 By Journal of Sustainable Energy and Environment 69
Table 2. The co-products obtained from the studied biorefinery scenarios and their avoided products.
Scenario Products Quantity Avoided products Quantity
Baseline
scenario
Electricity (biogas) (kWh)
Shell (kg)a
157
237
Electricity (grid) (kWh)
Bituminous coal (kg)c
157
152
Scenario 1 Electricity (biogas) (kWh)
Shell (kg)a
Compost (kg)b
157
234
115
Electricity (grid) (kWh)
Bituminous coal (kg)c
N -fertilizer (kg)
P -fertilizer (kg)
K -fertilizer (kg)
157
150
2.65
1.62
3.12
Scenario 2 Electricity (biogas) (kWh)
Shell (kg) a
Ethanol (kg)d
157
233
35
Electricity (grid) (kWh)
Bituminous coal (kg)c
Gasoline (L)c
157
149
31
Scenario 3 Electricity (biogas) (kWh)
Shell (kg)a
Briquette (kg)e
155
234
210
Electricity (grid) (kWh)
Bituminous coal (kg)c
Bituminous coal (kg)c
155
149
144
Scenario 4 Electricity (biogas) (kWh)
Shell (kg) a
Compost (kg)f
168
231
141
Electricity (grid) (kWh)
Bituminous coal (kg)c
N -fertilizer (kg)
P -fertilizer (kg)
K -fertilizer (kg)
168
148
2.85
1.27
3.23
Scenario 5 Electricity (biogas) (kWh)
Shell (kg)a
182
229
Electricity (grid) (kWh)
Bituminous coal (kg)
182
147 a calorific value from DEDE (2018) [26] b nutrition of compost acquired from Chima and Umeh (2019) study [27] c calorific value from Engineering ToolBox (2003) [28] d calorific value from NPL (2017) [29] e calorific value from Chiew and Shimada (2013) [20] f nutrition of composed is factory-based analysis by 2.02% N, 0.9% P, 2.29 % K
obtained. This is used as fuel in the boiler along with the fiber
(748 kg) and shells (19 kg) to produce electricity and steam. The
product and co-products of this Scenario 5 include 1000 kg of
CPO as the main product, and 291 kg of palm kernel, 5 kg of
excess fiber, 214 kg of excess decanter cake, 229 kg of excess
shell, 182 kWh of excess electricity as co-products.
2.4 Substitution and avoided products
The environmental impact potentials of each scenario are
evaluated and presented based on the reference flow of about
6000 kg FFB processed in each biorefinery scenario. The
substitution of the co-products of the biorefinery is considered.
The electricity produced from biogas is supposed to substitute the
grid-mix electricity of Thailand, the shells are supposed to substitute
bituminous coal, the compost is used to substitute N-P-K
chemical fertilizers, the ethanol is used to substitute conventional
gasoline, and the briquettes are used to substitute bituminous coal.
The substitution description of each scenario is shown in Table 2.
Scenario 3 has less grid electricity avoided than the other
scenarios because the EFB briquette production requires 29 kWh
of electricity which cannot be fully met by the electricity from the
boiler. Thus, about 2 kWh of electricity from the biogas unit is
provided to fulfill the deficit and the remaining electricity from
biogas to substitute grid electricity is thus about 155 kWh. On the
other hand, Scenarios 4 and 5 have about 11 and 25 kWh higher
avoided electricity, respectively, than the baseline scenario
because more EFB is used for electricity generation.
3. Results and Discussion
3.1 Environmental impacts of the biorefinery after accounting
the environmental credits for EFB utilization
Fig. 3 shows the potential environmental impacts of the
biorefinery after accounting the environmental credits for the
EFB utilization in each scenario. These results are calculated
based on Table S1 and S3 in the SI. The red line represents the
net impact values of the baseline scenario. Fig. 3a reveals that
Scenario 4 brought about the lowest global warming impact, i.e.
734 kg CO2eq/reference unit (i.e. 6,000 t FFB processed), followed
by Scenarios 1, 5 and 3, respectively (Table S3 of the SI). The main
source of global warming in all scenarios is the FFB production
(from the oil palm cultivation phase) sharing about 82-96%. The
N2O and CO2 emitted as direct emission from the applied N-P-K
fertilizers, and fuel in the plantation contribute about 49-60% of
total global warming potential. The production of N-P-K fertilizers
contributed about 37% with N-fertilizer production alone
contributing 28%. The other contributors are the production of
pesticide, soil amendment, tap water and fuel. On the other hand,
Scenario 2 performed the worst. The global warming impact of
the biorefinery system would increase as compared to the baseline
scenario as well as the other scenarios. This implies that the credit
obtained from EFB based ethanol would be lesser than the
existing credit that the mills obtain from the excess electricity to
substitute grid electricity. In addition to FFB production, the grid
electricity used for the mill is a large contributor to global
warming in all the scenarios. Especially for the Scenario 2, the
ethanol production process requires substantial electricity
consumption due to distillation and dehydration leading to high
global warming contribution of this scenario. The ethanol
production contributes about 148 kg CO2eq to global warming in
which 98% of the impact stems from the NaOH production.
The acidification impact potentials are shown in Fig. 3b.
The results are almost the same in all scenarios because FFB
production contributed about 99% of the total acidification
impact in all scenarios (Table S1 of the SI). The major source of
acidification impact in FFB production includes about 61% from
NH3 emission and 35% from the production of N-P-K fertilizer.
Palm biomass combustion in the mill also emits the NOx and SOx.
The co-products obtained at the mills in each scenario, i.e. compost,
ethanol, electricity, briquette, and bituminous coal, can turn to only
about 0.5-0.7 kg SO2eq avoided emissions; which are very low
when compared to emissions from FFB production (725 kg SO2eq).
Scenario 2 shows the highest acidification impact due to the
additional impact of ethanol production process (i.e. NaOH used).
Freshwater eutrophication impact potentials are shown in
Fig. 3c. Scenario 4 has the highest reduction of the eutrophication
impact as compared to the baseline scenario, followed by
Scenarios 5, 1, and 2, respectively. For the baseline scenario, the

Journal of Sustainable Energy & Environment 10 (2019) 65-73
Copyright @ 2019 By Journal of Sustainable Energy and Environment 70
source of freshwater eutrophication is FFB production and the use
of grid electricity. The FFB production is the main contributor to
the total freshwater eutrophication impact in all scenarios sharing
about 85-98%. The impact in FFB production is from the leaching
of phosphate to river during the cultivation process contributing
about 46-49%. In addition, the production of N-P-K fertilizer and
pesticide shares about 19-23% as well. The significant improvement
found in Scenarios 4, 5 and 1 were due to the production and use
of the compost derived from the decanter cake to substitute chemical
fertilizers and the use of bioelectricity from biomass and biogas.
NOx emissions from EFB combustion in the boiler can
contribute to the marine eutrophication impact. Nevertheless, the
leaching of nitrogen from fertilizers during oil palm cultivation
was the major source contributing about 99% of the total marine
eutrophication impact potential. The avoided emissions from the
co-products obtained in the scenarios are about 0.1-1 kg N eq
which are not much when compared with the impact from the
FFB production. Fig. 3d shows that there is no significant
difference in the marine eutrophication impacts when comparing
between the baseline scenario and the five scenarios of EFB
management. The milling process contributes less than 1% of the
total marine eutrophication impact; meanwhile, about 99% of the
impacts are from the oil palm cultivation.
The results of photochemical oxidant formation and
particular matter formation potential were identical for all the
scenarios as shown in Fig. 3e and 3f. The impacts on photochemical
oxidant formation and particular matter formation at about 66%
and 53%, respectively, mainly came from the stage of production
of N-P-K fertilizer, especially N-fertilizer. The other contributors
from FFB production are from direct emission of NOx emission
at about 25%. For particular matter formation, direct emission of
FFB production came from NH3 emission at about 41%. The results
revealed that there are no differences between the scenarios.
Although the grid electricity could be avoided from the studied
systems, but the biomass combustion in the boiler also leads to
the CH4 (biogenic), CO (biogenic), NO2, NOx, NMVOC, SOx,
PM10, and PM2.5 emissions which potentially affected both impacts.
Fig. 3g shows the fossil depletion potential; the Scenarios 1,
3, 4 and 5 can help reduce the fossil depletion impact as compared to
the baseline due to the reduction of grid electricity used in the palm
biorefinery system. Another credit stems from the selling of shells to
the other industries which generally use shells to substitute the
imported bituminous coal. The only exception is the Scenario 2
where the EFB based ethanol production is energy intensive
resulting in the higher net fossil depletion potential impact as
compared to the baseline scenario. The summary of the environmental
impact potential values are shown in the Tables S1 and S3 of the SI.
3.2 Financial feasibility analysis of the EFB management scenarios
The EFB and POME co-compost production (Scenario 1),
the EFB based ethanol production (Scenario 2), the EFB briquette
production (Scenario 3) and the EFB compost production
(Scenario 4) are considered as the new processes which would be
installed to the palm oil mill. Although for the EFB cogeneration
(Scenario 5), the same boiler of the palm oil mill can be used;
however, EFB shredder would be required to pretreat the EFB
before loading it into the boiler. Thus, the costs, benefits and NPV
of the new EFB scenarios were analyzed for evaluating the
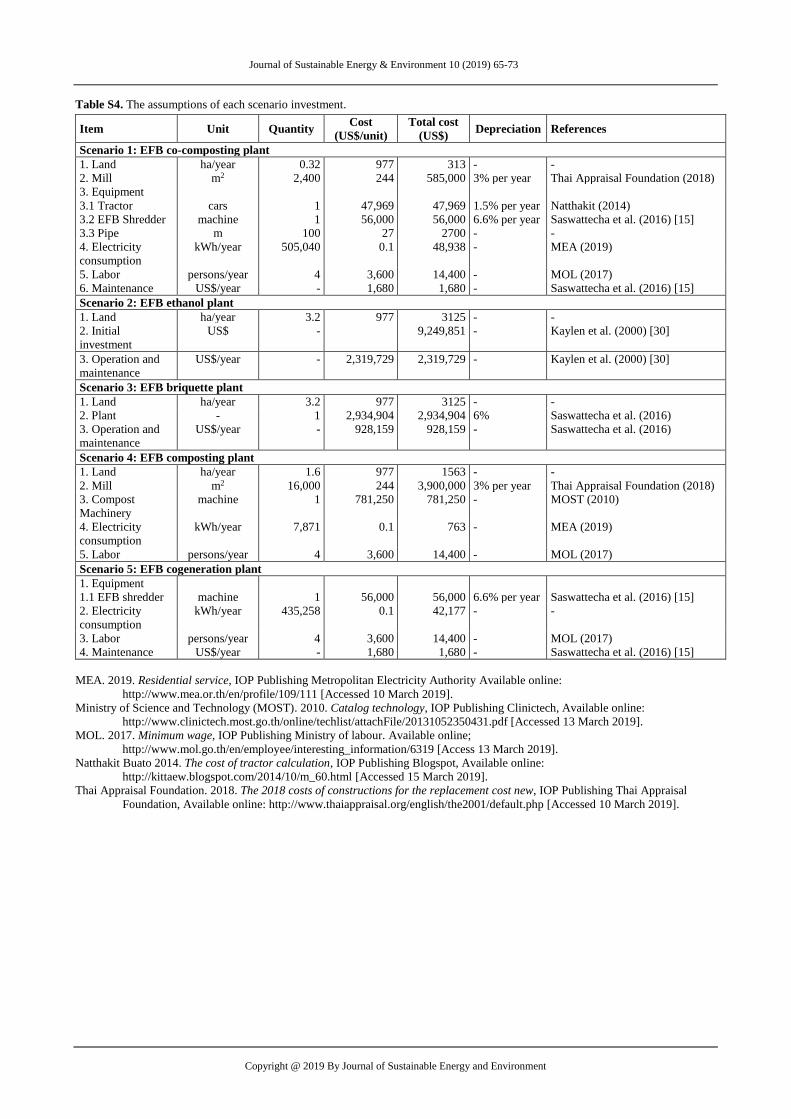
financial feasibility of the investments for those scenarios. The
assumptions of each scenario investment is shown in Table S4 in
SI. The cost of the EFB composting plant (Scenarios 1 and 4) are
estimated from based on a pilot plant in a factory in Krabi
province. The plant capacity is about 25 tonne compost per day
(Scenario 1) and 20 tonne compost per day (Scenario 4) operating
300 days per year. On the other hand, Scenario 2, 3 and 5 are
referred from literature. The cost of the EFB based ethanol plant
(Scenario 2) is calculated based on the cost model of the
lignocellulosic ethanol plant of Kaylen et al. (2000) [30]. The
EFB briquette plant (Scenario 3) cost is calculated based on the
EFB briquette plant with a capacity of about 4.35 tonne/hour with
7116 hours operation per year [15]. The salvage values are not
accounted in all scenarios.
Table 3 shows the results on the costs, benefits and NPV
of the five different EFB scenarios. The positive NPV indicates
that the investment would be profitable. The NPV of the EFB
based ethanol production (Scenario 2) is about -4,872 US$/tonne
EFB, due to the high investment as well as high operation and
maintenance costs of the lignocellulosic ethanol process as compared
to the benefit obtained. This pointed that, although the lignocellulosic
ethanol i.e. ethanol derived from the agricultural residues is
expected as the promising option to avoid the problem on food-
fuel competition due to the first generation bioethanol production
in Thailand like the cassava ethanol and molasses ethanol [31],
however, ethanol production from EFB (Scenario 2) is not feasible.
It can be seen that Scenarios 1, 3, 4 and 5 obtain the
positive NPV which indicates that these options are feasible. The
highest NPV is obtained for the Scenario 1 at about 239 US$/tonne
EFB followed by the Scenarios 4, 5 and 3, respectively. The EFB
compost production (Scenario 4) shows the highest investment
cost, while the EFB cogeneration (Scenario 5) shows the highest
operation and maintenance cost. Nevertheless, the EFB compost
production (Scenario 4) would yield the highest revenue when
compared with the Scenarios 1, 3 and 5.
The Scenarios 1 and 4 have the first and second highest
NPV values. However, nowadays the substitution of chemical
fertilizers by compost is not widely recognized by the palm
growers due to its slow effects to the FFB productivity compared
to the application of chemical fertiliers. Additionally, a large amount
of compost would be required in the field in order to substitute
the same amount of N-P-K nutrients provided by the chemical
fertilizers. Hence, the cost of palm growers might be increased.
Nevertheless, there are studies showing that the compost should
be promoted to palm growers due to its long-term benefits such
as the increased productivity and soil quality [32].
The EFB briquette production (Scenario 3) offers many
benefits. Although it is generally used in small scale, like the
household, for cooking stoves and restaurants; however, it can
also be used in larger scales for the industrial boilers to produce
heat, steam, and power. For example, briquette can substitute coal
in the power plant. The prices of EFB briquette and bituminous coal
are 53 US$/tonne of EFB briquette (or 2.94 US$/GJ EFB briquette)
and 75.9 US$/tonne of bituminous coal (2.88 US$/GJ bituminous
coal). Thus we can see that on an energy basis, the prices of EFB
briquette and bituminous coal are almost the same. Substitution
of this fossil fuel by EFB briquette may reduce the adverse effects
of fossil fuel use. Furthermore, the use of briquette could help
decrease the wood logging for wood burning stoves [33].
Table 3. The costs, benefits and NPV results for the investment of Scenarios 1-5 (calculated as per a tonne EFB)
Options Unit Scenario 1 Scenario 2 Scenario 3 Scenario 4 Scenario 5
Cost
- Investment US$/tonne EFB 35 2,156 32 363 13
- Operation and maintenance US$/tonne EFB 3 541 10 1 14
Benefit US$/tonne EFB 48 185 18 96 31
NPV US$/tonne EFB 239 (4,872) 15 219 95
( … ) refers to negative values

Journal of Sustainable Energy & Environment 10 (2019) 65-73
Copyright @ 2019 By Journal of Sustainable Energy and Environment 71
Figure 3. Environmental impact potential of 6000 kg FFB processed.
-400
-200
0
200
400
600
800
1000
1200
Baseline Scenario1
Scenario2
Scenario3
Scenario4
Scenario5
(a) Global warming impact potential
-100
0
100
200
300
400
500
600
700
800
Baseline Scenario1
Scenario2
Scenario3
Scenario4
Scenario5
(b) Acidification impact potential
-0.10
-0.08
-0.06
-0.04
-0.02
0.00
0.02
0.04
0.06
0.08
0.10
Baseline Scenar io1
Scenar io2
Scenar io3
Scenar io4
Scenar io5
(c) Freshwater eutrophication impactpotential
-10
0
10
20
30
40
50
60
70
80
90
Baseline Scenar io1
Scenar io2
Scenario3
Scenario4
Scenar io5
(d) Marine eutrophication impactpotential
-200
0
200
400
600
800
1000
1200
1400
Baseline Scenario1
Scenario2
Scenario3
Scenario4
Scenario5
(e) Photochemical oxidant formation impactpotential
-50
0
50
100
150
200
250
300
Baseline Scenario1
Scenario2
Scenario3
Scenar io4
Scenar io5
(f) Particular matter formation impact potential
-500
-400
-300
-200
-100
0
100
200
300
Baseline Scenar io1
Scenar io2
Scenar io3
Scenario4
Scenario5
(g) Fossil depletion impact potential
Total emission/consumption Avoided
Net emission/consumption Baseline
kg C
O2e
q
kg S
O2e
q
kg P
eq
kg N
eq
kg N
MV
OC
kg P
M10
eq
kg O
il eq

Journal of Sustainable Energy & Environment 10 (2019) 65-73
Copyright @ 2019 By Journal of Sustainable Energy and Environment 72
4. Conclusions
The study evaluated the environmental sustainability and
the financial feasibility of palm biorefinery systems in Thailand
based on the five different EFB management scenarios comparing
with the baseline scenario (i.e. EFB is used to mulch in palm oil
plantation). The five scenarios consist of Scenario 1: EFB and
POME co-compost and cogeneration, Scenario 2: EFB based
ethanol production and cogeneration, Scenario 3: EFB briquette
production and cogeneration, Scenario 4: EFB compost and
cogeneration, and Scenario 5: EFB cogeneration. The LCA results
revealed that EFB compost and cogeneration (Scenario 4) resulted
in a high potential to reduce the global warming and freshwater
eutrophication impacts. The EFB briquette production and
cogeneration (Scenario 3) should be recommended for the fossil
depletion impact reduction. The Scenario 2 has shown the lowest
environmental performances because most of the environmental
impact potentials would be increased as compared to the baseline
scenario. This was due to the environmental impacts from energy
and chemicals used in the EFB based ethanol production process.
The financial feasibility of those five scenarios is evaluated by
using the cost, benefit and NPV. The results showed that the
Scenarios 1, 3, 4 and 5 are financially feasible for the investment.
The Scenario 1 could be recommended due to the least investment
and operation costs and the highest NPV. The EFB based ethanol
production (Scenario 2) was not financially feasible. The detailed
practice for each EFB management practices used, advantages and
limitations are also discussed for supporting the decision making
of the palm millers.
Acknowledgment
The authors gratefully thank the Joint Graduate School of
Energy and Environment, King Mongkut’s University of
Thonburi for financial support. We would like to thank the staff
at palm oil milling companies for kindly providing information.
References
[1] FAO. 2019. FAOSTAT, IOP Publishing FAO, Available
online: http://www.fao.org/faostat/en/#data [Accessed 20
February 2018].
[2] Ali, A.A., Othman, M.R., Shirai, Y. and Hassan, M.A. 2015.
Sustainable and integrated palm oil biorefinery concept with
value – addition of biomass and zero emission system,
Journal of Cleaner Production 91, 96-99.
[3] Chaikitkaew, S., Kongjan, P. and O – Thong, S. 2015. Biogas
production from biomass residues of palm oil mill by solid
state anaerobic digestion, Energy Procedia, 79, 838-844.
[4] Garcia-Nunez, J.A., Rodriguez, D.T., Fontanilla, C.A.,
Ramirez, N.E., Lora, E.E.S., Frear C.S., Stockle, C.,
Amonette, J. and Garcia-Perez, M. 2016. Evaluation of
alternatives for the evolution of palm oil mills into
biorefineries, Biomass and Bioenergy, 95, 310-329.
[5] Kasivisvanathan, H., Ng, R.T.L., Tay D.H.S. and Ng,
D.K.S. 2012. Fuzzy optimization for retrofitting a palm oil
mill into a sustainable palm oil-based integrated biorefinery,
Chemical Engineering Journal, 200-202, 694-709.
[6] Aziz, M., Kurniawan, T., Oda, T. and Kashiwagi, T. 2017.
Advanced power generation using biomass wastes from
palm oil mills, Applied Thermal Engineering, 114, 1378-1386.
[7] Kaewmai, R., H-Kittikun, A. and Musikavong, C. 2012.
Greenhouse gas emissions of palm oil mills in Thailand,
International Journal of Greenhouse Gas Control, 11, 141-151.
[8] Hasanudin, U., Sugiharto, R., Haryanto, A. and Fujie, K.
2015. Palm oil mill effluent treatment and utilization to
ensure the sustainability of palm oil industries, Water
Science and Technology, 72(7), 1089-1095.
[9] Silalertruksa, T. and Gheewala, S.H. 2012. Environmental
sustainability assessment of palm biodiesel production in
Thailand, Energy, 43, 306-314.
[10] Singh, R.P., Ibrahim, M.H., Esa, N. and Iliyana, M.S. 2010.
Composting of waste from palm oil mill: a sustainable waste
management practice, Environmental Science and
Bio/Technology, 9(4), 331-344.
[11] Tan, L., Yu, Y., Li, X., Zhao, J., Qu, Y., Choo, Y.M. and
Loh, S.K. 2013. Pretreatment of empty fruit bunch from oil
palm for fuel ethanol production and proposed biorefinery
process, Bioresource Technology, 135, 275-282.
[12] Jeon, H., Kang, K., Jeong, J., Gong, G., Choi, J., Abimanyu, H.,
Ahn, B.S., Suh, D.J. and Choi, G.W. 2014. Production of
anhydrous ethanol using oil palm empty fruit bunch in a pilot
plant, Biomass and Bioenergy, 67, 99-107.
[13] Nasrin, A.B., Choo, Y.M., Lim, W.S., Joseph, L., Michael,
S., Rohaya, M.H., Astimar, A.A. and Loh, S.K. 2011.
Briquetting of empty fruit bunch fibre and palm shell as a
renewable energy fuel, Journal of Engineering and Applied
Sciences, 6(6), 446-451.
[14] Krishnan, Y., Bong, C., Azman, N.F., Zakaria, Z., Othman,
N.A., Abdullah, N., Ho, C.S., Lee, C.T., Hansen, S.B. and
Hara, H. 2017. Co-composting of palm empty fruit bunch
and palm oil mill effluent: microbial diversity and potential
mitigation of greenhouse gas emission, Journal of Cleaner
Production, 146, 94-100.
[15] Saswattecha, K., Kroeze, C., Jawjit, W. and Hein, L. 2016.
Options to reduce environmental impacts of palm oil production
in Thailand, Journal of Cleaner Production, 137, 370-393.
[16] Beaudry, G., Macklin, C., Roknich, E., Sears, L., Wiener, M.
and Gheewala, S.H. 2018. Greenhouse gas assessment of palm
oil mill biorefinery in Thailand from a life cycle perspective,
Biomass Conversion and Biorefinery, 8(1), 43-58.
[17] Huijbregts, M.A.J., Steinmann, Z.J.N., Elshout, P.M.F.,
Stam, G., Verones, F., Vieira, M.D.M., Hollander, A., Zijp,
M. and Zelm, R.V. 2016. ReCiPe 2016: A Harmonized Life
Cycle Impact Assessment Method at Midpoint and Endpoint
level. Report I: Characterization, RIVM Report 2016-0104.
[18] Silalertruksa, T., Gheewala, S.H., Pongpat, P., Kaenchan,
P., Permpool, N., Lecksiwilai, N. and Mungkung, R. 2017.
Environmental sustainability of oil palm cultivation in
different regions of Thailand: greenhouse gases and water
use impact, Journal of Cleaner Production, 167, 1009-1019.
[19] Gheewala, S.H. 2015. Final Report: Life Cycle Environmental
Sustainability Assessment of Oil Palm Plantation in Thailand,
Agricultural Research Development Agency, Bangkok.
[20] Chiew, Y. and Shimada, S. 2013. Current state and
environmental impact assessment for utilizing oil palm
empty fruit bunches for fuel, fiber and fertilizer – a case
study of Malaysia, Biomass and Bioenergy, 51, 109-124.
[21] Ecoinvent. 2013. Ecoinvent 3.0 database. Switzerland.
[22] EEA. 2016. EMEP/EEA air pollutant emission inventory
guidebook – 2016, IOP Publishing European Environment
Agency, Available online:
https://www.eea.europa.eu/publications/emep-eea-
guidebook-2016 [Accessed 15 November 2017].
[23] IPCC. 2006. Task Force on National Greenhouse Gas
Inventories, IOP Publishing IPCC, Available online:
https://www.ipcc-nggip.iges.or.jp/public/2006gl/
[Accessed 15 November 2017].
[24] NREL. 2013. U.S. Life Cycle Inventory Database, IOP
Publishing NREL, Available online:
https://www.nrel.gov/lci/ [Accessed 15 November 2017].
[25] Adney, B. and Baker, J. 1996. Measurement of Cellulase
Activities, IOP Publishing NREL, Available online:
https://www.nrel.gov/docs/gen/fy08/42628 [Accessed 15
May 2018].

Journal of Sustainable Energy & Environment 10 (2019) 65-73
Copyright @ 2019 By Journal of Sustainable Energy and Environment 73
[26] DEDE. 2018. Information. IOP Publishing DEDE, Available
online: http://biomass.dede.go.th/biomass_web/index.html
[Accessed 3 May 2018].
[27] Chima, N.V. and Umeh, C.N. 2019. Co – composting of Oil
Palm Empty Fruit Bunch and Palm Oil Mill Effluent, IOP
Publishing Academia, Available online:
http://www.academia.edu/18490879/co-
composting_of_oil_palm_empty_fruit_bunch_and_palm_o
il_mill_effluent [Accessed 13 February 2018].
[28] Engineering ToolBox. 2003. Fuels-Higher and Lower
Calorific Values. IOP Publishing The Engineering Toolbox.
https://www.engineeringtoolbox.com/fuels-higher-
calorific-values-d_169.html [Accessed 21 March 2018].
[29] NPL. 2017. Calorific Values of Solid, Liquid and Gaseous
Fuels, IOP Publishing National Physical Laboratory,
Available online:
http://www.kayelaby.npl.co.uk/chemistry/3_11/3_11_4.ht
ml [Accessed 21 March 2018].
[30] Kaylen, M., Dyne, D., Choi, Y.S. and Blasé, M. 2000.
Economic feasibility of producing ethanol from lignocellulosic
feedstocks, Bioresource Technology, 72, 19-32.
[31] Tunpaiboon, N. 2017. Ethanol Industrial (Thai version),
IOP Publishing Krungsri, Available online:
https://www.krungsri.com/bank/getmedia/df29b533-7d27-
481f-a91d-
2c9130894d05/IO_Ethanol_2017_TH.aspx%20%5b2018
[Accessed 18 February 2018].
[32] Wongkrachang, S. 2015. Effect of oil palm bunch compost
for growth oil palm seedling, Princess of Naradhiwas
University Journal, 7, 146-152.
[33] Knudsen, M.S. 2017. The art and advantages of briquetting.
IOP Publishing Biomass Magazine, Available online:
http://biomassmagazine.com/articles/14269/the-art-and-
advantages-of-briquetting%20%5b2018 [Accessed 29 May
2018].

Journal of Sustainable Energy & Environment 10 (2019) 65-73
Copyright @ 2019 By Journal of Sustainable Energy and Environment
Supporting Information
Life Cycle Assessment and Cost-Benefit Analysis of Palm Biorefinery in Thailand for different Empty Fruit Bunch (EFB)
Management Scenarios
Nattaya Huailuek1,2, Thapat Silalertruksa1,2 and+ Shabbir H. Gheewala1,2,*
1The Joint Graduate School of Energy and Environment, King Mongkut’s University of Technology Thonburi, Bangkok, Thailand 2 Center of Excellence on Energy Technology and Environment, PERDO, Bangkok, Thailand
*Corresponding author email: [email protected]
Table S1. Environmental impact potential classified by sources.
Environmental impacts Baseline
Scenario
Scenario 1 Scenario 2 Scenario 3 Scenario 4 Scenario 5
Global warming (kg CO2eq)
FFB
Kaolin production
Electricity grid mix, TH
Cogeneration
Biogas unit
Transportation
Co-compost
EFB Ethanol
EFB Briquette
EFB compost
Total
887
1.8
21
6.3
0.0005
22.4
-
-
-
-
939
887
1.8
12.2
6.6
0.0005
19.1
0.4
-
-
-
927
887
1.8
14.3
6.4
0.0005
19.1
-
148
-
-
1077
887
1.8
21
6
0.0005
19.1
-
-
1.18
-
936
887
1.8
-
7.1
0.0005
19.1
-
-
-
0.01
915
887
1.8
-
7
0.0005
19.1
-
-
-
-
915
Environmental impacts Baseline
Scenario
Scenario 1 Scenario 2 Scenario 3 Scenario 4 Scenario 5
Acidification (kg SO2eq)
FFB
Kaolin production
Electricity grid mix, TH
Cogeneration
Biogas unit
Transportation
Co-compost
EFB Ethanol
EFB Briquette
EFB compost
Total
725
0.01
0.08
1.04
0.07
0.14
-
-
-
-
727
725
0.01
0.04
1.07
0.07
0.12
0.06
-
-
-
727
725
0.01
0.05
1.04
0.07
0.12
-
1.28
-
-
728
725
0.01
0.08
0.98
0.07
0.12
-
-
0.18
-
727
725
0.01
-
1.15
0.07
0.12
-
-
-
0.002
727
725
0.01
-
1.13
0.07
0.12
-
-
-
-
727
Environmental impacts Baseline
Scenario
Scenario 1 Scenario 2 Scenario 3 Scenario 4 Scenario 5
Freshwater eutrophication (kg P eq)
FFB
Kaolin production
Electricity grid mix, TH
Cogeneration
Biogas unit
Transportation
Co-compost
EFB Ethanol
EFB Briquette
EFB compost
Total
0.07
0.001
0.01
0.0005
0
0.0001
-
-
-
-
0.083
0.07
0.001
0.01
0.001
0
0.0001
0.00003
-
-
-
0.078
0.07
0.001
0.01
0.001
0
0.0001
-
0.002
-
-
0.082
0.07
0.001
0.01
0.001
0
0.0001
-
-
0.0001
-
0.083
0.07
0.001
-
0.001
0
0.0001
-
-
-
0.000001
0.072
0.07
0.001
-
0.001
0
0.0001
-
-
-
-
0.072
Environmental impacts Baseline
Scenario
Scenario 1 Scenario 2 Scenario 3 Scenario 4 Scenario 5
Marine eutrophication (kg N eq)
FFB
Kaolin production
Electricity grid mix, TH
Cogeneration
Biogas unit
Transportation
Co-compost
EFB Ethanol
EFB Briquette
EFB compost
Total
80.6
0.003
0.01
0.07
0.003
0.01
-
-
-
-
80.7
80.6
0.003
0.01
0.07
0.003
0.01
0.004
-
-
-
80.7
80.6
0.003
0.01
0.07
0.003
0.01
-
0.02
-
-
80.7
80.6
0.003
0.01
0.06
0.003
0.01
-
-
0.01
-
80.7
80.6
0.003
-
0.08
0.003
0.01
-
-
-
0.0001
80.7
80.6
0.003
-
0.07
0.003
0.01
-
-
-
-
80.7

Journal of Sustainable Energy & Environment 10 (2019) 65-73
Copyright @ 2019 By Journal of Sustainable Energy and Environment
Environmental impacts Baseline
Scenario
Scenario 1 Scenario 2 Scenario 3 Scenario 4 Scenario 5
Photochemical oxidant formation (kg
NMVOC)
FFB
Kaolin production
Electricity grid mix, TH
Cogeneration
Biogas unit
Transportation
Co-compost
EFB Ethanol
EFB Briquette
EFB compost
Total
1288
0.01
0.04
1.78
0.001
0.26
-
-
-
-
1290
1288
0.01
0.02
1.84
0.001
0.22
0.1
-
-
-
1290
1288
0.01
0.03
1.78
0.001
0.22
-
0.67
-
-
1290
1288
0.01
0.04
1.68
0.001
0.22
-
-
0.31
-
1290
1288
0.01
-
1.97
0.001
0.22
-
-
-
0.003
1290
1288
0.1
-
1.93
0.001
0.22
-
-
-
-
1290
Environmental impacts Baseline
Scenario
Scenario 1 Scenario 2 Scenario 3 Scenario 4 Scenario 5
Particular matter formation
(kg PM10eq)
FFB
Kaolin production
Electricity grid mix, TH
Cogeneration
Biogas unit
Transportation
Co-compost
EFB Ethanol
EFB Briquette
EFB compost
Total
284
0.003
0.02
0.95
0.01
0.05
-
-
-
-
285
284
0.003
0.01
0.97
0.01
0.04
0.06
-
-
-
285
284
0.003
0.02
0.94
0.01
0.04
-
0.39
-
-
286
284
0.003
0.02
0.89
0.01
0.04
-
-
0.16
-
285
284
0.003
-
1.04
0.01
0.04
-
-
-
0.001
285
284
0.003
-
1.03
0.01
0.04
-
-
-
-
285
Environmental impacts Baseline
Scenario
Scenario 1 Scenario 2 Scenario 3 Scenario 4 Scenario 5
Fossil depletion (kg oil eq)
FFB
Kaolin production
Electricity grid mix, TH
Cogeneration
Biogas unit
Transportation
Co-compost
EFB Ethanol
EFB Briquette
EFB compost
Total
102
0.5
6.4
0.34
0
7.7
-
-
-
-
117
102
0.5
3.7
0.38
0
6.6
0.02
-
-
-
114
102
0.5
4.4
0.37
0
6.6
-
47.5
-
-
162
102
0.5
6.4
0.35
0
6.6
-
-
0.2
-
116
102
0.5
-
0.42
0
6.6
-
-
-
0.001
110
102
0.5
-
0.43
0
6.6
-
-
-
-
110
Table S2. Input and output per tonne of CPO production in each mill.
Input/output Units Mill 1 Mill 2 Mill 3 Mill 4 Mill 5 Mill 6
Input
Materials
FFB
Kaolin
Water
Energy
Electricity (grid)
Electricity (boiler)
Electricity (biogas)
Steam
Output
Crude palm oil
Palm kernel
EFB
Fiber
Shell
Decanter cake
Treated POME
Electricity
kg
kg
m3
kWh
kWh
kWh
kg
kg
kg
kg
kg
kg
kg
m3
kWh
6930
11
1.04
26
105
35
4260
1000
129
1390
0
277
208
3.1
89
6290
15
4.7
10
85
21
2940
1000
342
1109
0
377
241
3.9
681
5950
10
2.8
24
75
34
3640
1000
297
1190
38
383
237
4.3
109
5940
11
4.4
10
91
9
2990
1000
300
1200
0
337
212
4.9
206
6100
10
2.4
13
72
0
2430
1000
352
1350
0
345
305
2.8
106
5650
1.3
0.9
55
80
0
2470
1000
290
1310
0
74
169
2.8
5

Journal of Sustainable Energy & Environment 10 (2019) 65-73
Copyright @ 2019 By Journal of Sustainable Energy and Environment
Table S3. The summary of environmental impact potentials.
Environmental impacts Baseline
scenario Scenario 1 Scenario 2 Scenario 3 Scenario 4 Scenario 5
Global warming (kg CO2eq)
- Emission
- Avoided
- Net Emission
939
-135
803
927
-172
755
1077
-147
930
936
-157
779
915
-182
734
915
-152
763
Acidification (kg SO2eq)
- Emission
- Avoided
- Net Emission
727
-1
726
727
-1
726
728
-1
727
727
-1
726
727
-1
726
727
-1
726
Freshwater eutrophication (kg Peq)
- Emission
- Avoided
- Net Emission
0.08
-0.06
0.02
0.08
-0.07
0.01
0.08
-0.06
0.02
0.08
-0.06
0.02
0.07
-0.07
0
0.07
-0.07
0
Marine eutrophication (kg N eq)
- Emission
- Avoided
- Net Emission
80.7
-0.1
80.6
80.7
-1
80
80.7
-0.1
80.6
80.7
-0.1
80.6
81
-1.1
80
80.7
-0.1
80.6
Photochemical oxidant formation (kg NMVOC)
- Emission
- Avoided
- Net Emission
1290
-0.3
1289
1290
-0.4
1289
1290
-0.4
1290
1290
-0.3
1290
1290
-0.4
1289
1290
-0.3
1289
Particular matter formation (kg PM10eq)
- Emission
- Avoided
- Net Emission
285
-0.1
285
285
-0.2
285
286
-0.2
285
285
-0.2
285
285
-0.2
285
285
-0.2
285
Fossil depletion (kg oil eq)
- Consumption
- Avoided
- Net consumption
117
-143
-25
114
-148
-34
162
-170
08
116
-244
-127
110
-149
-39
110
-144
-35
Journal of Sustainable Energy & Environment 10 (2019) 65-73
Copyright @ 2019 By Journal of Sustainable Energy and Environment
Table S4. The assumptions of each scenario investment.
Item Unit Quantity Cost
(US$/unit)
Total cost
(US$) Depreciation References
Scenario 1: EFB co-composting plant
1. Land ha/year 0.32 977 313 - -
2. Mill m2 2,400 244 585,000 3% per year Thai Appraisal Foundation (2018)
3. Equipment
3.1 Tractor
3.2 EFB Shredder
3.3 Pipe
cars
machine
m
1
1
100
47,969
56,000
27
47,969
56,000
2700
1.5% per year
6.6% per year
-
Natthakit (2014)
Saswattecha et al. (2016) [15]
-
4. Electricity
consumption
kWh/year 505,040 0.1 48,938 - MEA (2019)
5. Labor persons/year 4 3,600 14,400 - MOL (2017)
6. Maintenance US$/year - 1,680 1,680 - Saswattecha et al. (2016) [15]
Scenario 2: EFB ethanol plant
1. Land ha/year 3.2 977 3125 - -
2. Initial
investment
US$ - 9,249,851 - Kaylen et al. (2000) [30]
3. Operation and
maintenance
US$/year - 2,319,729 2,319,729 - Kaylen et al. (2000) [30]
Scenario 3: EFB briquette plant
1. Land ha/year 3.2 977 3125 - -
2. Plant - 1 2,934,904 2,934,904 6% Saswattecha et al. (2016)
3. Operation and
maintenance
US$/year - 928,159 928,159 - Saswattecha et al. (2016)
Scenario 4: EFB composting plant
1. Land ha/year 1.6 977 1563 - -
2. Mill m2 16,000 244 3,900,000 3% per year Thai Appraisal Foundation (2018)
3. Compost
Machinery
machine 1 781,250 781,250 - MOST (2010)
4. Electricity
consumption
kWh/year 7,871 0.1 763 - MEA (2019)
5. Labor persons/year 4 3,600 14,400 - MOL (2017)
Scenario 5: EFB cogeneration plant
1. Equipment
1.1 EFB shredder machine 1 56,000 56,000 6.6% per year Saswattecha et al. (2016) [15]
2. Electricity
consumption
kWh/year 435,258 0.1 42,177 - -
3. Labor persons/year 4 3,600 14,400 - MOL (2017)
4. Maintenance US$/year - 1,680 1,680 - Saswattecha et al. (2016) [15]
MEA. 2019. Residential service, IOP Publishing Metropolitan Electricity Authority Available online:
http://www.mea.or.th/en/profile/109/111 [Accessed 10 March 2019].
Ministry of Science and Technology (MOST). 2010. Catalog technology, IOP Publishing Clinictech, Available online:
http://www.clinictech.most.go.th/online/techlist/attachFile/20131052350431.pdf [Accessed 13 March 2019].
MOL. 2017. Minimum wage, IOP Publishing Ministry of labour. Available online;
http://www.mol.go.th/en/employee/interesting_information/6319 [Access 13 March 2019].
Natthakit Buato 2014. The cost of tractor calculation, IOP Publishing Blogspot, Available online:
http://kittaew.blogspot.com/2014/10/m_60.html [Accessed 15 March 2019].
Thai Appraisal Foundation. 2018. The 2018 costs of constructions for the replacement cost new, IOP Publishing Thai Appraisal
Foundation, Available online: http://www.thaiappraisal.org/english/the2001/default.php [Accessed 10 March 2019].


![Life Cycle Benefit of Concrete Slab Track, Sunil Kondapalli, David Bilow [2008]](https://img.pdfslide.us/doc/110x75/552aadb755034670428b46f7/life-cycle-benefit-of-concrete-slab-track-sunil-kondapalli-david-bilow-2008.jpg)