Embed Size (px)
Citation preview
1
Life Cycle AssessmentA product-oriented methodfor sustainability analysis
UNEP LCA Training KitModule b – Overview of LCA
Contents • What is LCA?
• Why LCA?
• The ISO 14040 framework– Goal and scope definition– Inventory analysis– Impact assessment– Interpretation
33
What is LCA?
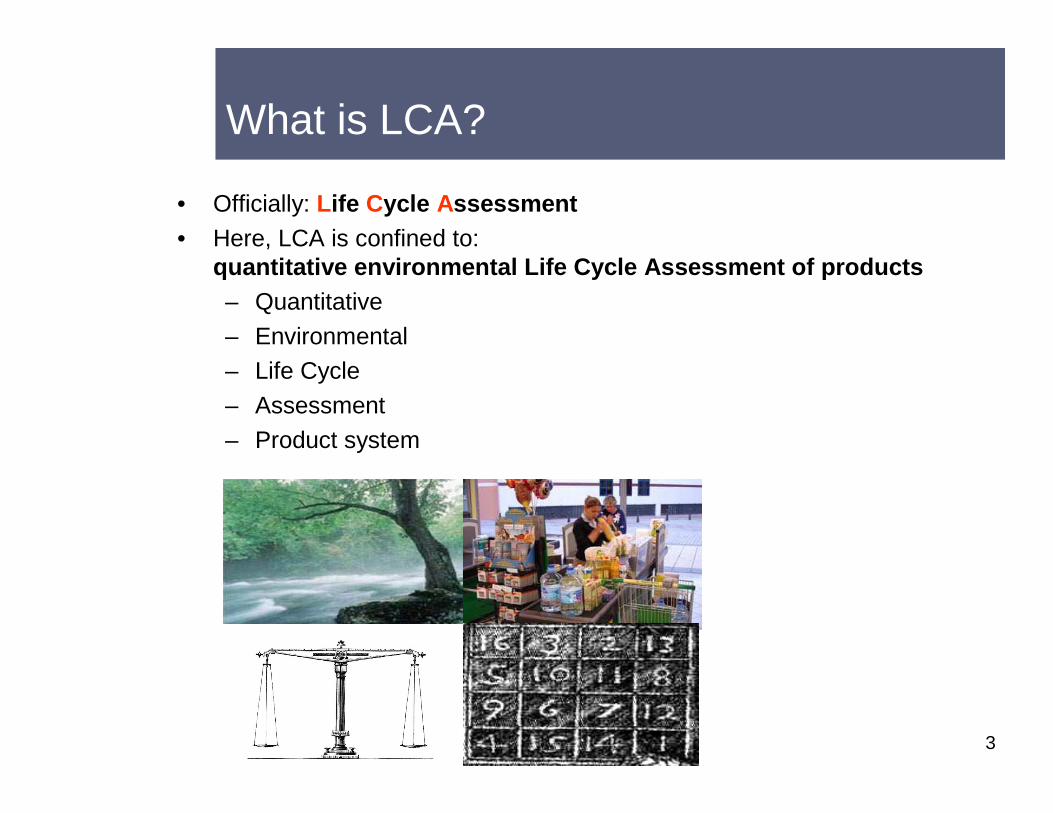
• Officially: Life Cycle Assessment• Here, LCA is confined to:
quantitative environmental Life Cycle Assessment of products– Quantitative
– Environmental – Life Cycle
– Assessment
– Product system
44
What is LCA?
• LCA has at least three different meanings:– LCA as a field of study– LCA as a technique– LCA as a specific study
55
What is LCA?
• Tool for decision-support– computational aspects
• which data?• which models?• which formulas?
– procedural aspects• who to involve?• how to report?• how to use?
66
What is LCA?
• ISO 14040 - standardised LCA procedure(ISO 14040, created in 1997-2000; revised in 2006)– Structured framework: four phases– Rules, requirements and considerations specified– Specific data and calculation steps not specified– Much attention for transparency in reporting
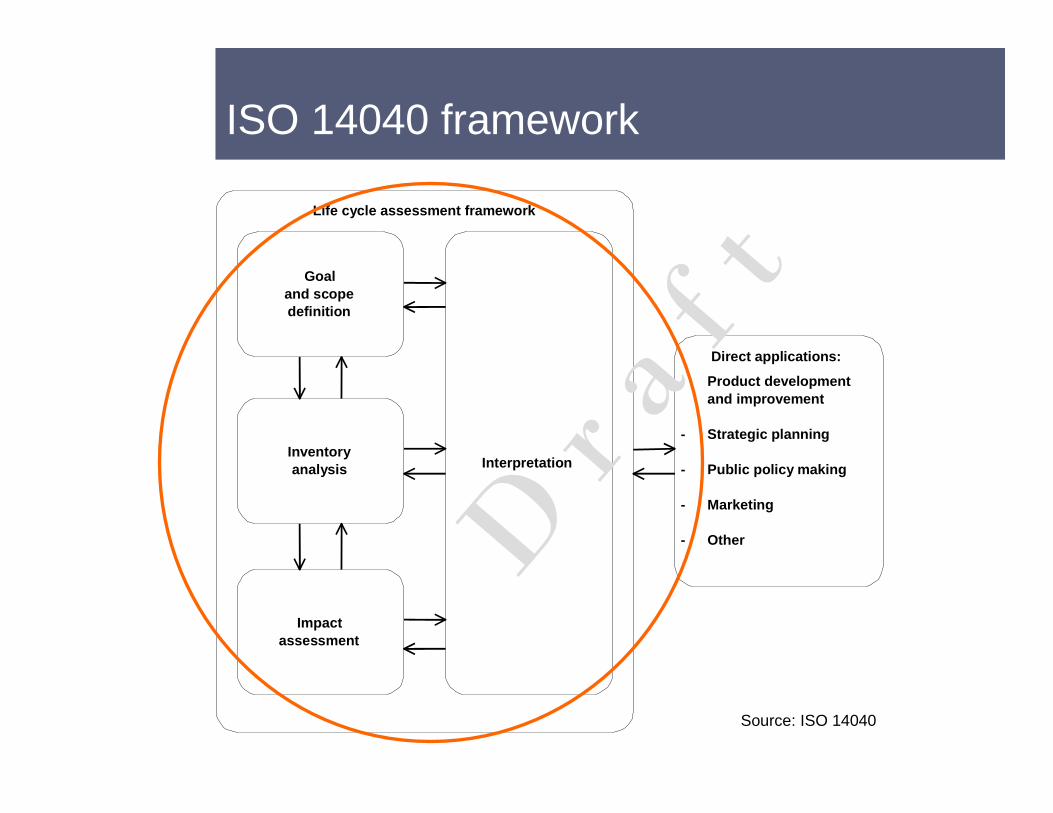
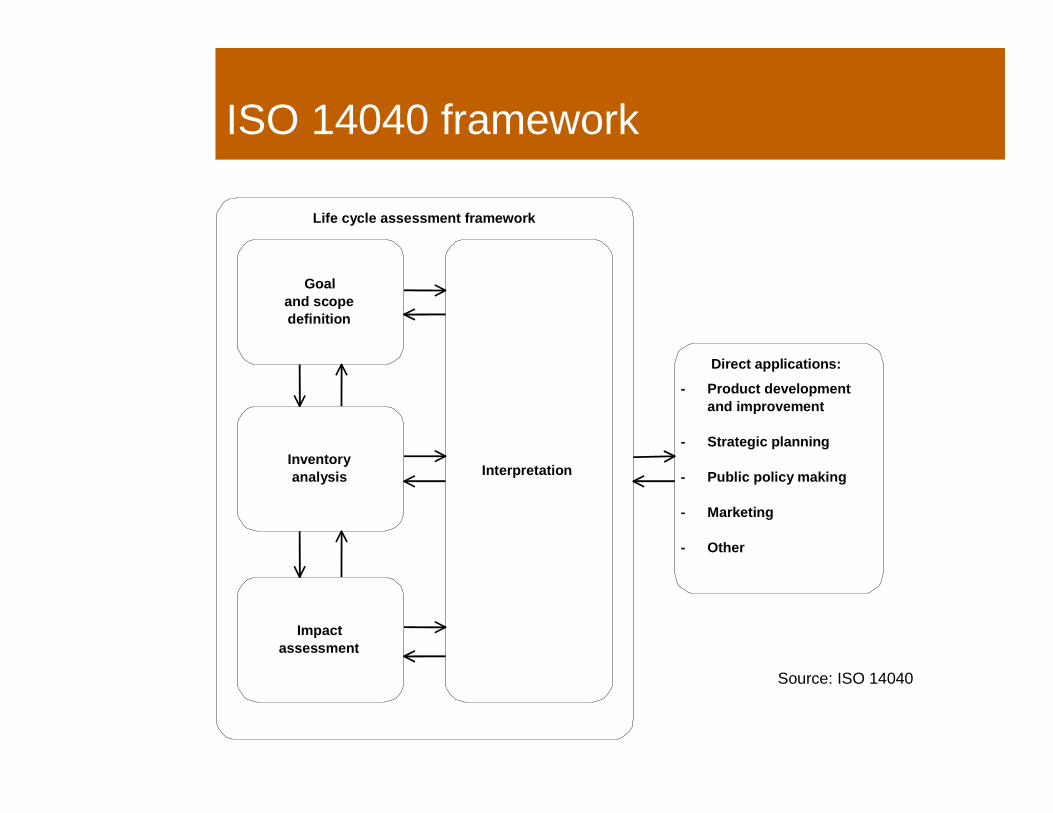
ISO 14040 framework
- Product developmentand improvement
- Strategic planning
- Public policy making
- Marketing
- Other
Goaland scopedefinition
Inventoryanalysis
Impactassessment
Interpretation
Direct applications:
Life cycle assessment framework
Source: ISO 14040
D r a f t
88
ISO 14040 framework
• ISO: Compilation and evaluation of the inputs, outputs and the potential environmental impacts of a product system throughout its life cycle– International Standard ISO 14040– complementary International Standards ISO 14041,
14042, 14043– no Technical Report to 14040, but Technical Reports to
14041 and 14042– 14044 merges the revised 14040-14043 (2006)– 14020, 14021, 14024 and 14025 address public assertions
of environmental performance on products
99
Why LCA?
• Why an integrated information tool?– Prevent problem shifting
• to other life cycle stages• to other substances• to other environmental problems• to other countries• to the future
1010
Why LCA?
• Why a method?– To structure the large amount of complex data– To facilitate comparisons across product alternatives– To enable benchmarking
Why LCA?
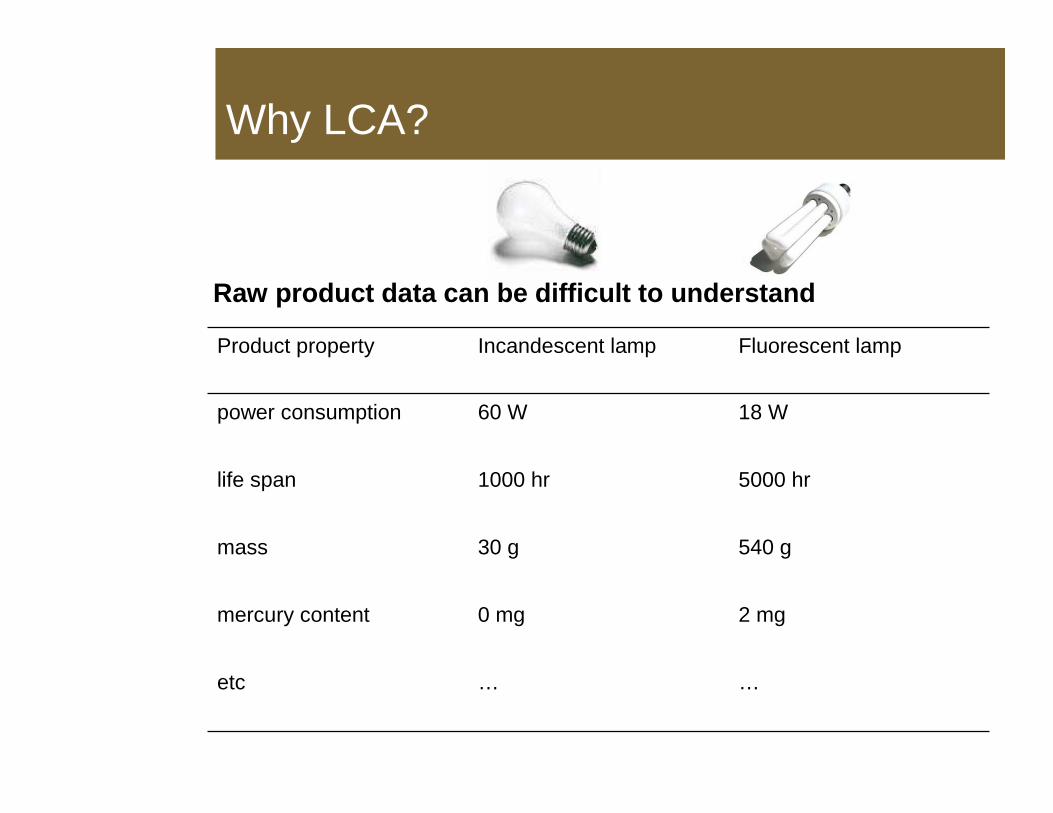
Raw product data can be difficult to understand
……etc
2 mg0 mgmercury content
540 g30 gmass
5000 hr1000 hrlife span
18 W60 Wpower consumption
Fluorescent lampIncandescent lampProduct property
ISO 14040 framework
- Product developmentand improvement
- Strategic planning
- Public policy making
- Marketing
- Other
Goaland scopedefinition
Inventoryanalysis
Impactassessment
Interpretation
Direct applications:
Life cycle assessment framework
Source: ISO 14040
1313
Phase 1: Goal and scope definition
• Goal and scope definition is the LCA phase in which the aim of the study is established. The breadth and depth of the study are also established in relation to that.– goal definition– scope definition
1414
Phase 1: Goal and scope definition
• Goal definition:– intended application
• product development and improvement• strategic planning• public decision making• marketing• other
– reasons for carrying out the study– intended audience
1515
Phase 1: Goal and scope definition
• Scope definition:– function, functional unit and reference flow– initial choices
• system boundaries• data quality
– critical review and other procedural aspects
1616
Phase 1: Goal and scope definition
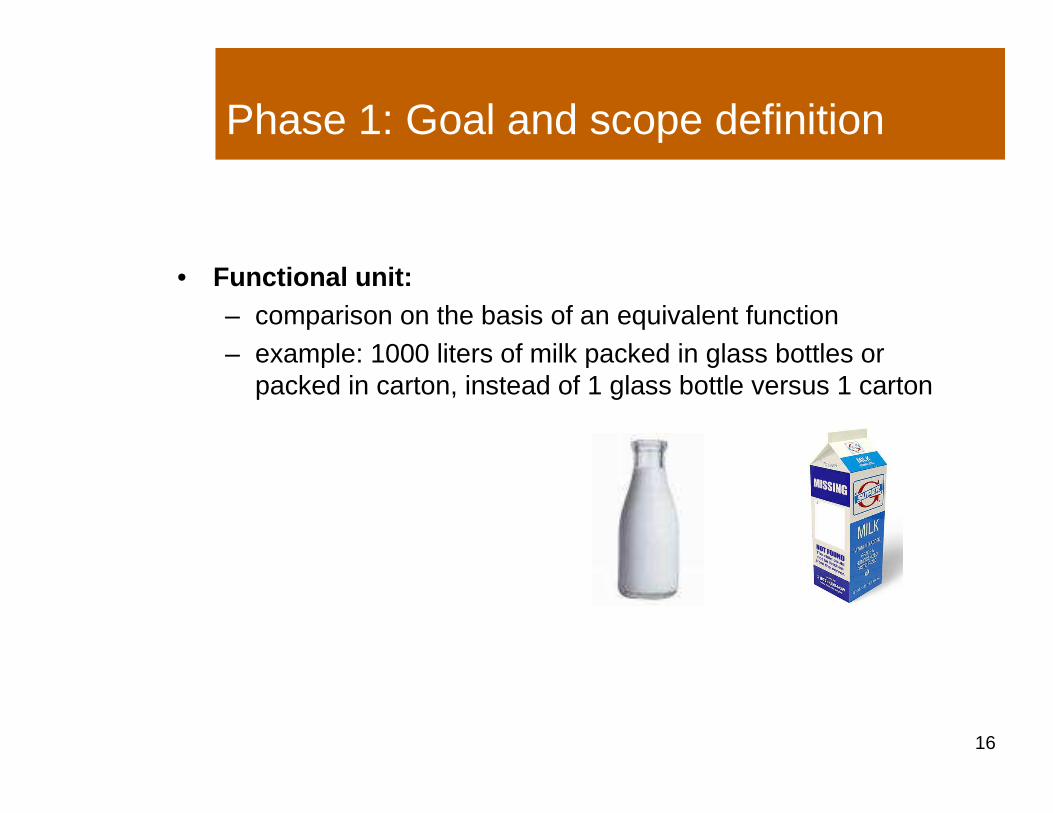
• Functional unit:– comparison on the basis of an equivalent function– example: 1000 liters of milk packed in glass bottles or
packed in carton, instead of 1 glass bottle versus 1 carton
1717
Phase 1: Goal and scope definition
• Critical review and other procedural aspects– critical review to ensure the consistency, scientific validity,
transparency of the report, etc.– internal review, external review, review by interested
parties– procedural embedding of LCA: LCA as a (participatory)
process
1818
Phase 2: Inventory analysis
• Inventory analysis is the LCA phase involving the compilation and quantification of inputs and outputs for a given product system throughout its life cycle.
• Steps:– preparing for data collection– data collection
(both described in ISO 14041)
– calculation procedures– allocation and recycling
(both described in ISO 14042)
1919
Phase 2: Inventory analysis
• Central position for unit process– smallest portion of a product system for which data are
collected• Typical examples:
– electricity production by coal combustion– PVC production– use of a passenger car– recycling of aluminum scrap
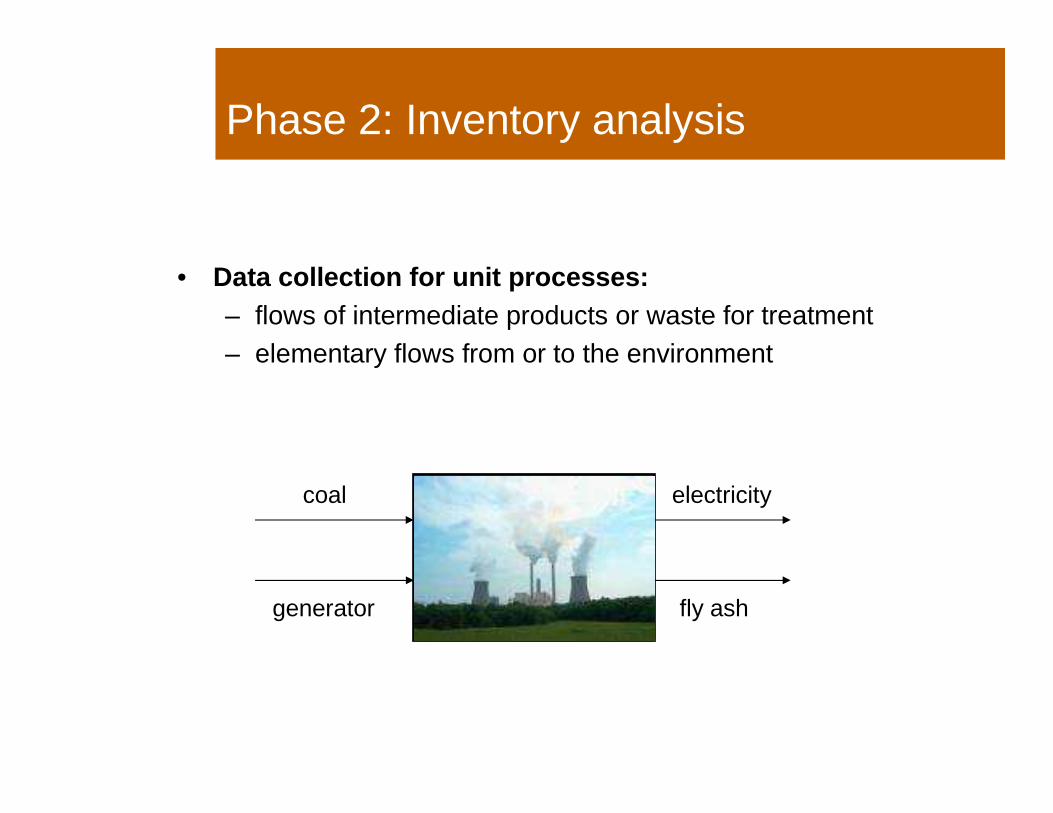
Phase 2: Inventory analysis
• Data collection for unit processes:– flows of intermediate products or waste for treatment– elementary flows from or to the environment
electricity production
electricitycoal
generator fly ash
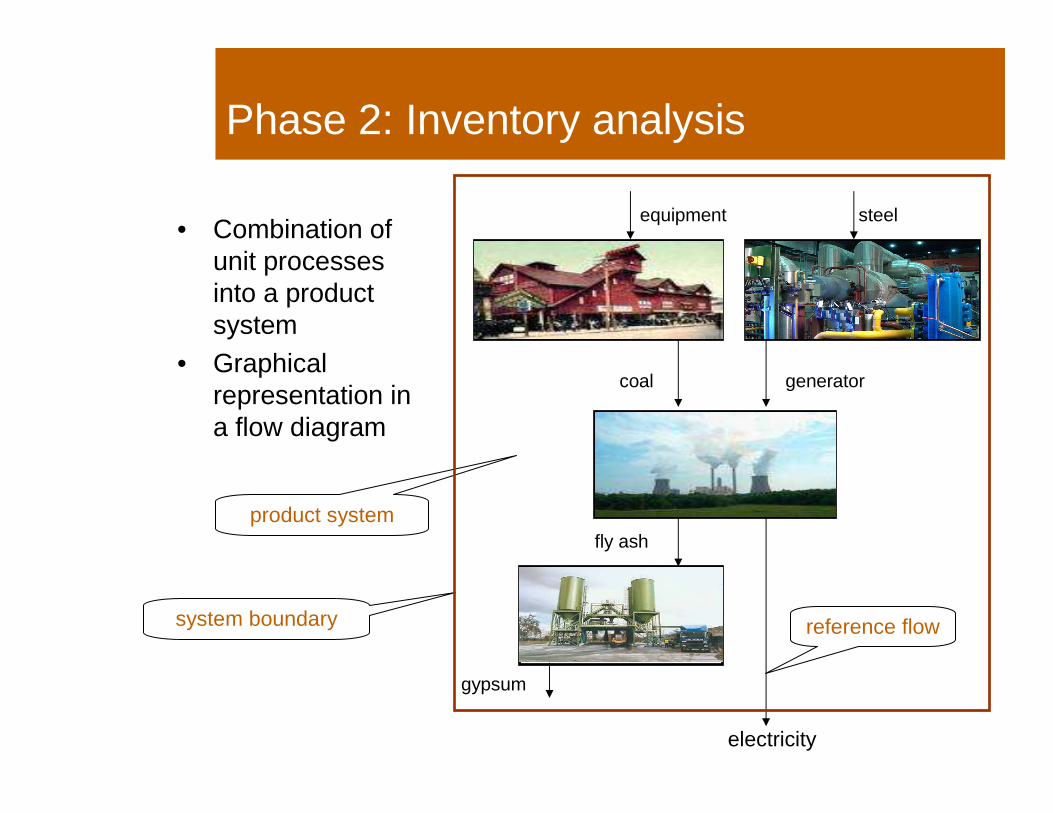
Phase 2: Inventory analysis
• Combination of unit processes into a product system
• Graphical representation in a flow diagram
electricity production
electricity
coal generator
fly ash
coal mining
equipment
generator production
steel
fly ash treatment
gypsum
system boundary reference flow
product system
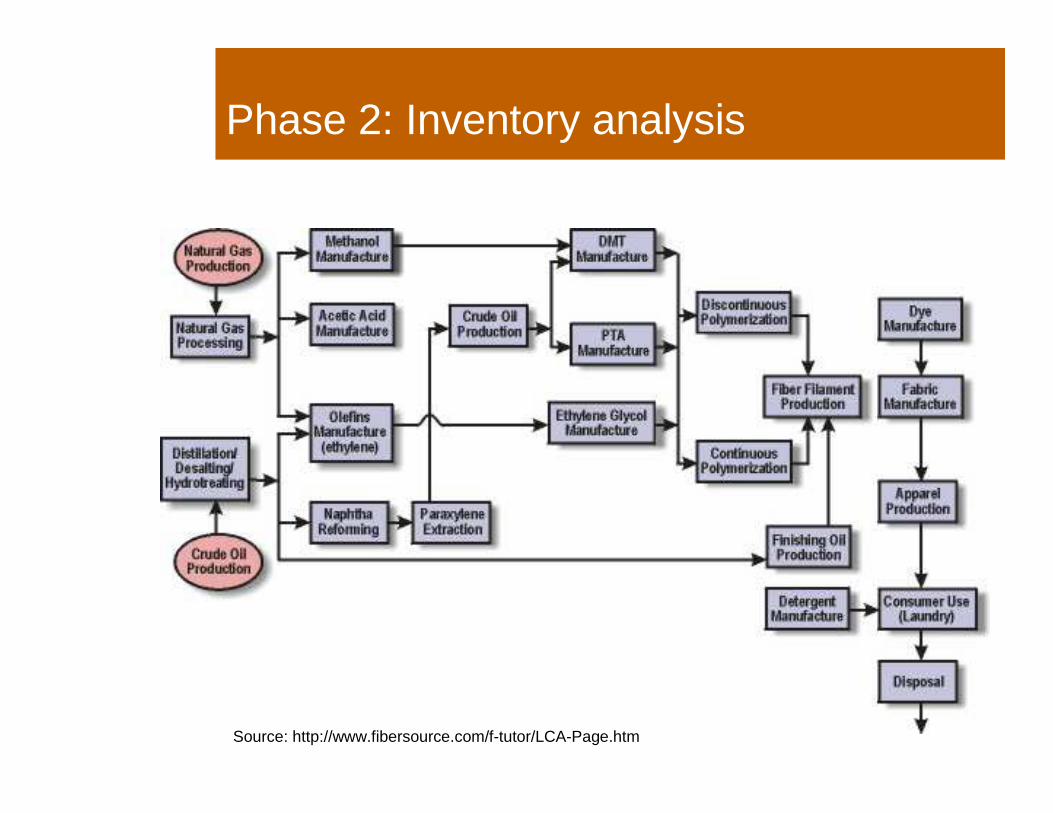
Phase 2: Inventory analysis
Source: http://www.fibersource.com/f-tutor/LCA-Page.htm
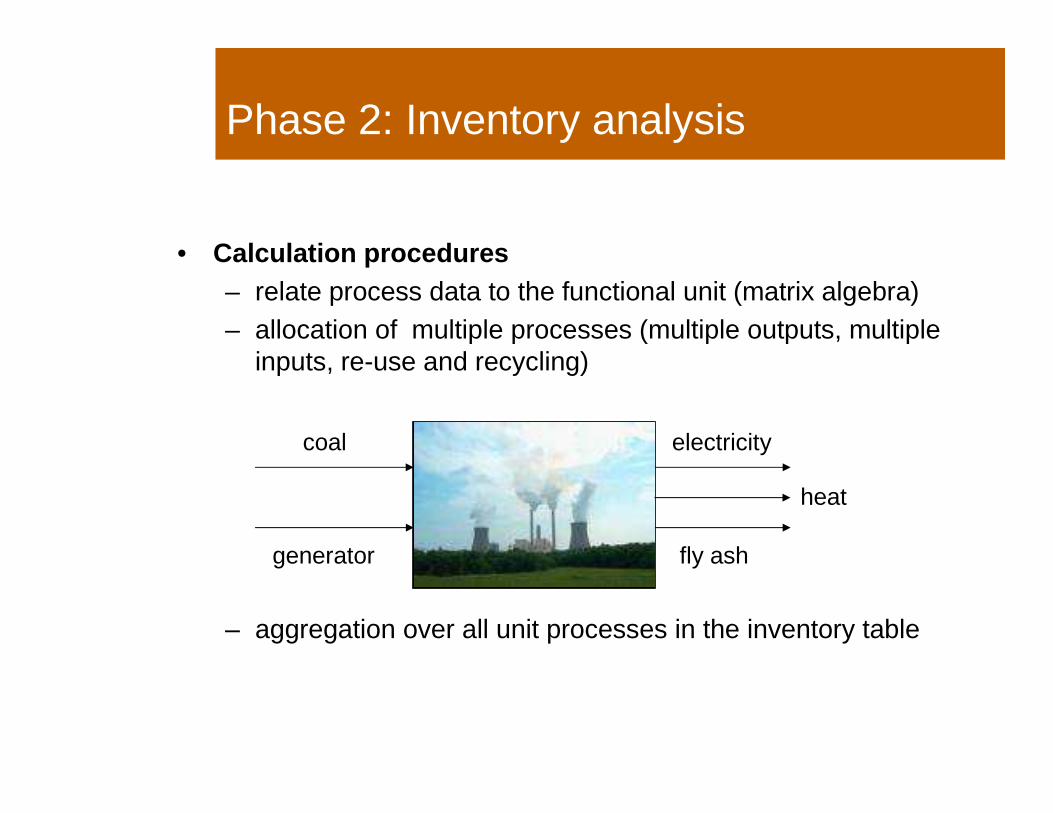
Phase 2: Inventory analysis
electricity productionwith cogeneration
of heat (CHP)
electricitycoal
generator fly ash
heat
• Calculation procedures– relate process data to the functional unit (matrix algebra)– allocation of multiple processes (multiple outputs, multiple
inputs, re-use and recycling)
– aggregation over all unit processes in the inventory table
2424
Phase 2: Inventory analysis
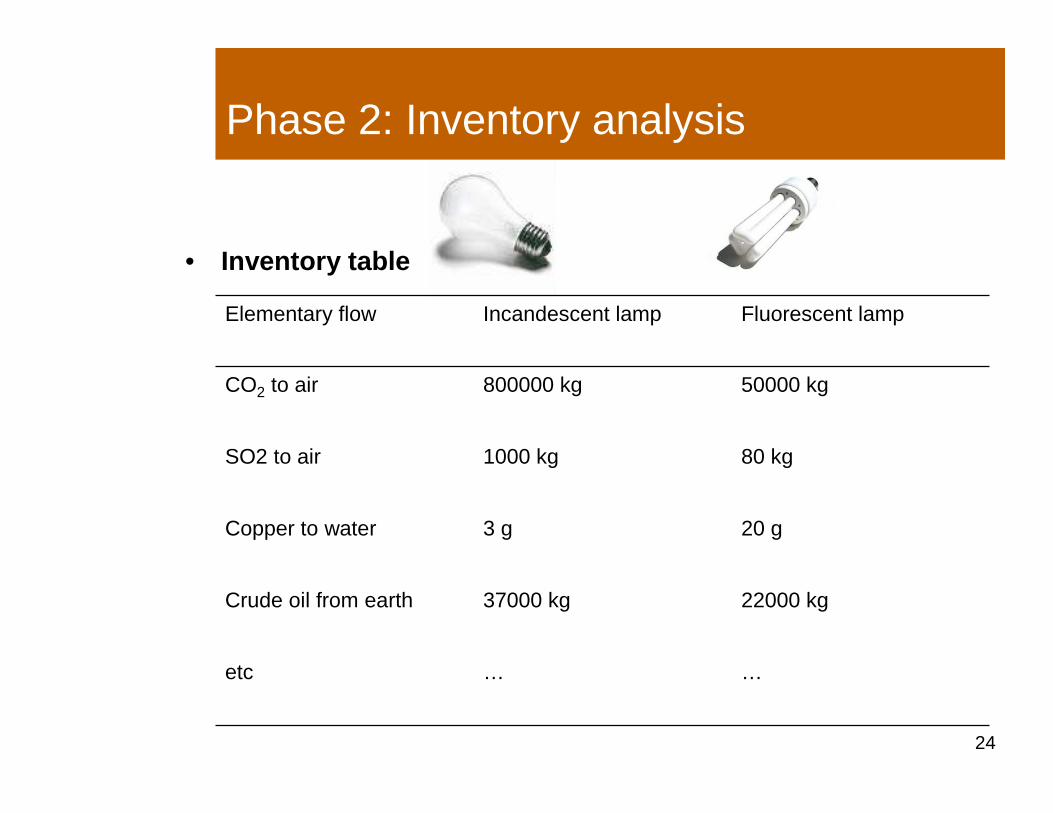
• Inventory table
……etc
22000 kg37000 kgCrude oil from earth
20 g3 gCopper to water
80 kg1000 kgSO2 to air
50000 kg800000 kgCO2 to air
Fluorescent lampIncandescent lampElementary flow
2525
Phase 3: Impact assessment
• Impact Assessment is the LCA phase that evaluates the importance of the potential environmental effects with the aid of the results of the inventory analysis.
• Steps:– selection and definition of impact categories, indicators
and models– classification– characterisation– normalisation– aggregation and/or weighing
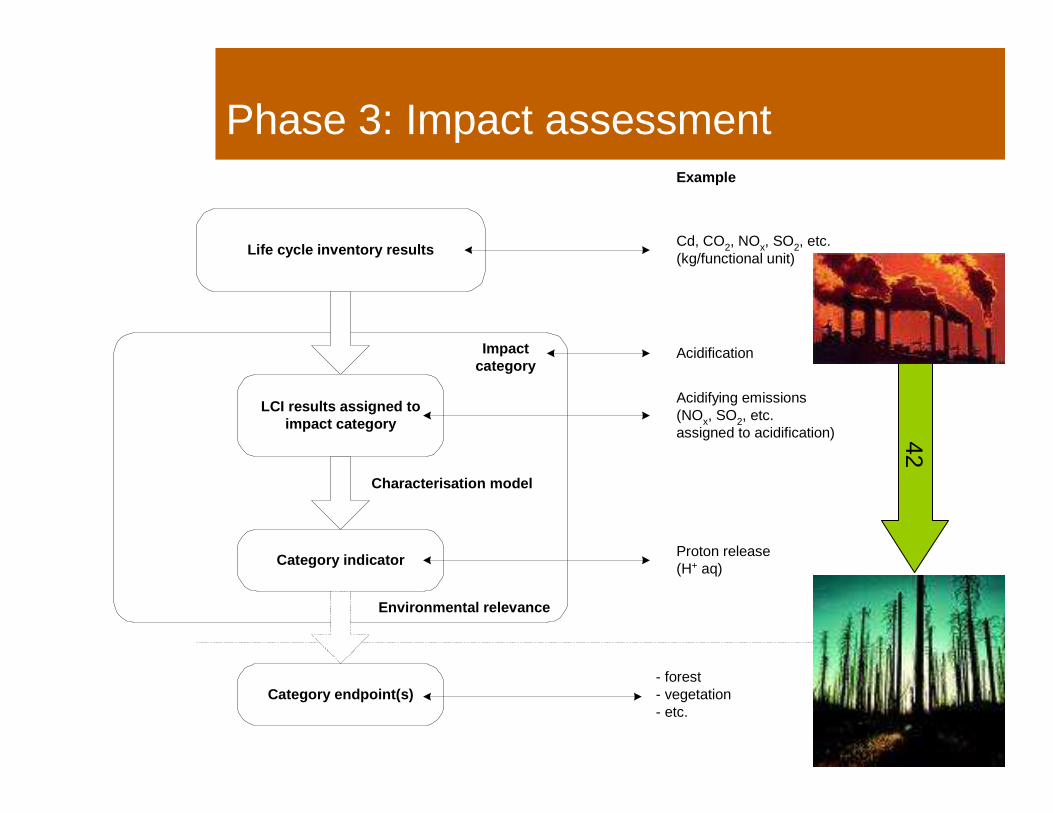
42Phase 3: Impact assessment
Life cycle inventory results
LCI results assigned toimpact category
Category indicator
Category endpoint(s)- forest- vegetation- etc.
Characterisation model
Environmental relevance
Impactcategory
Proton release(H+ aq)
Acidifying emissions(NOx, SO2, etc.assigned to acidification)
Acidification
Cd, CO2, NOx, SO2, etc.(kg/functional unit)
Example
2727
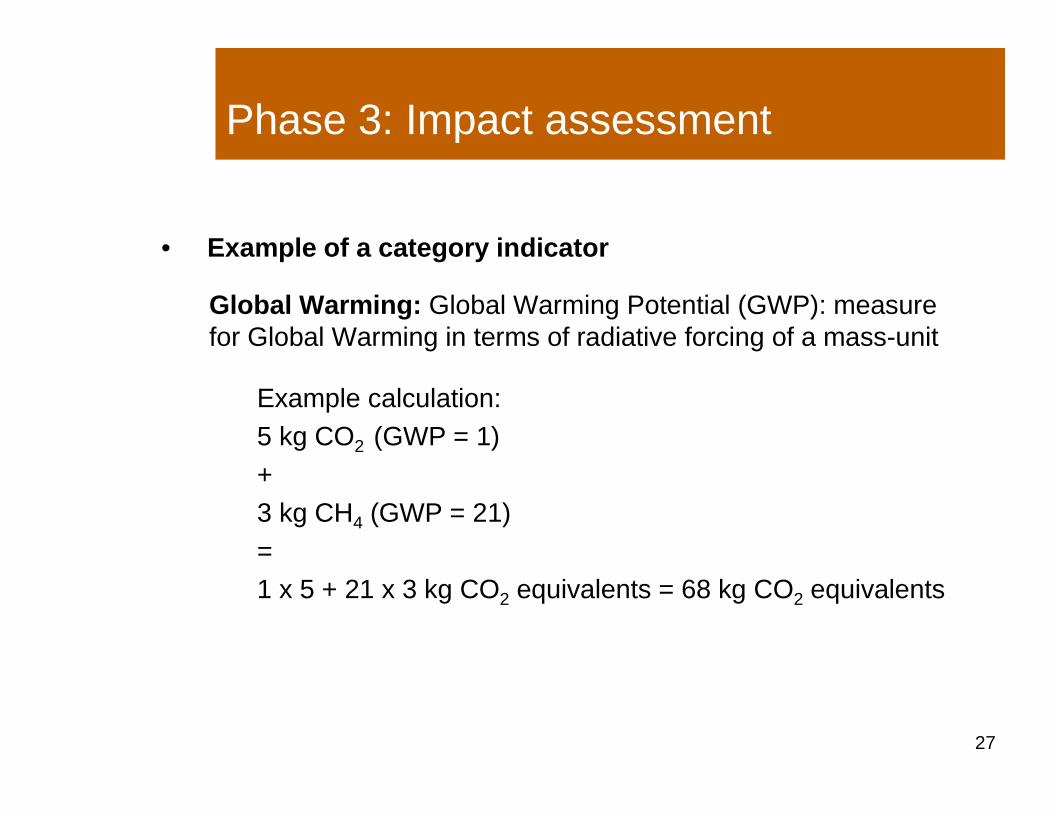
Phase 3: Impact assessment
• Example of a category indicator
Global Warming: Global Warming Potential (GWP): measure for Global Warming in terms of radiative forcing of a mass-unit
Example calculation:5 kg CO2 (GWP = 1) + 3 kg CH4 (GWP = 21) = 1 x 5 + 21 x 3 kg CO2 equivalents = 68 kg CO2 equivalents
2828
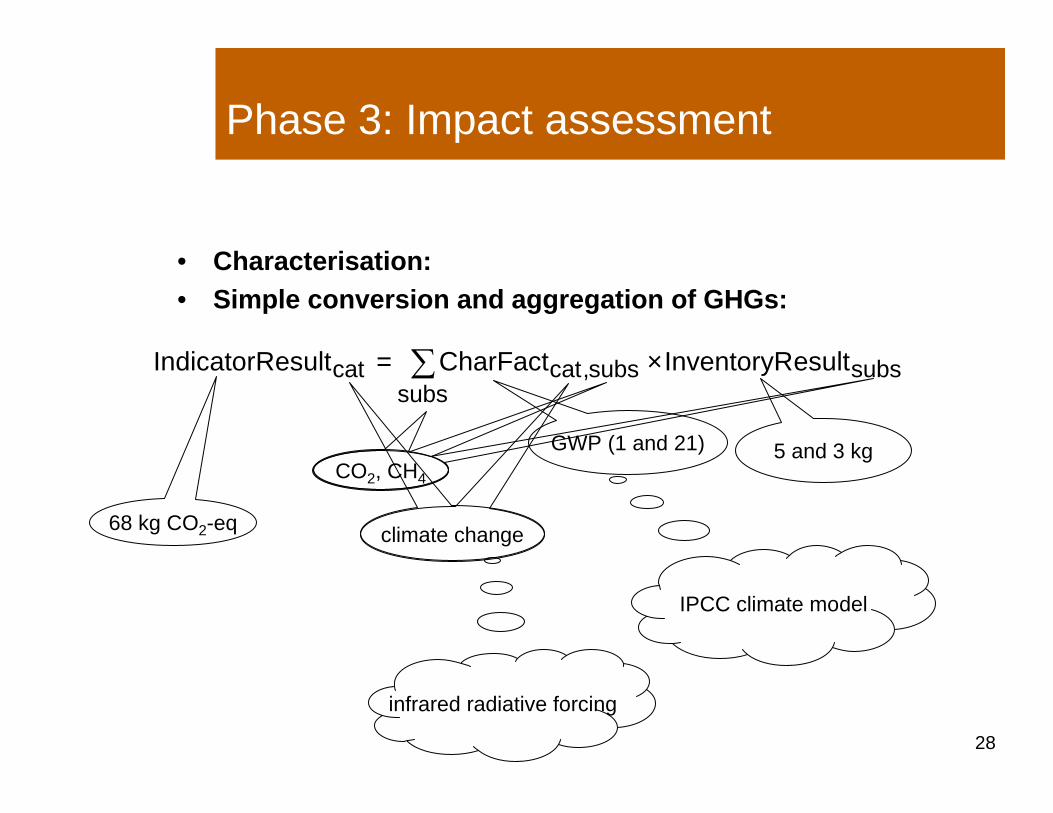
Phase 3: Impact assessment
• Characterisation:• Simple conversion and aggregation of GHGs:
∑ ×=subs
subssubscatcat esultInventoryRCharFactesultIndicatorR ,
CO2, CH4
climate change
GWP (1 and 21) 5 and 3 kg
68 kg CO2-eq
infrared radiative forcing
IPCC climate model
2929
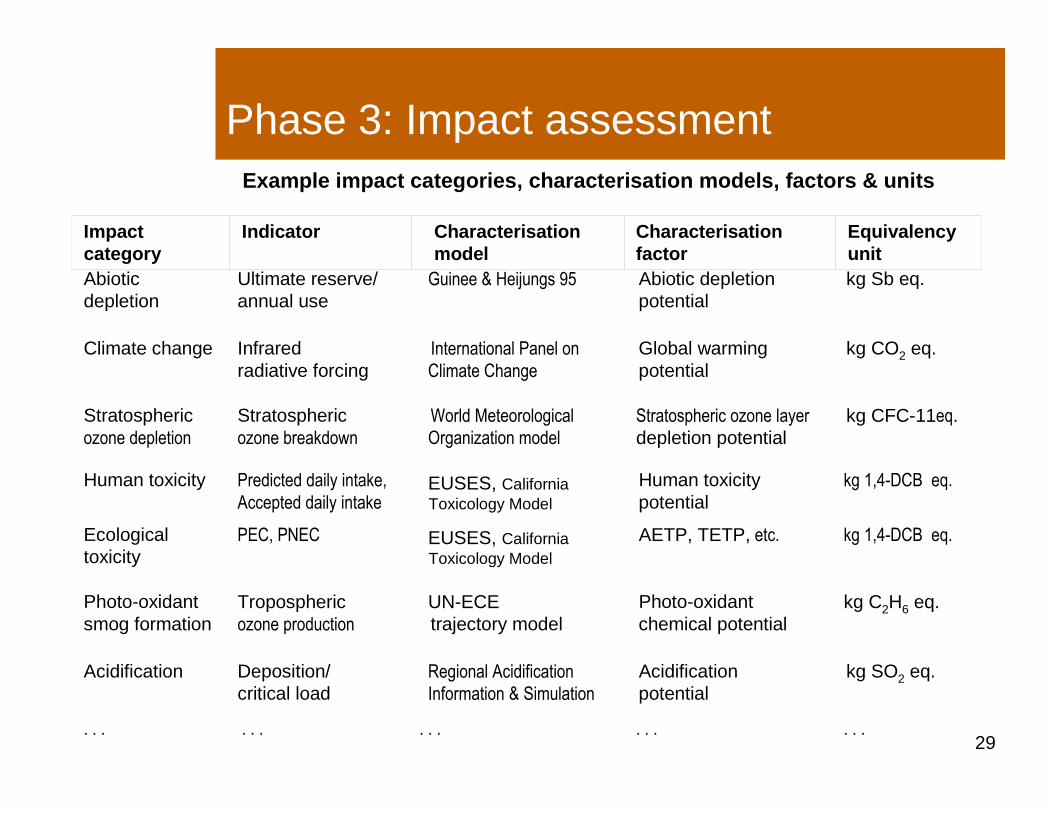
Phase 3: Impact assessmentExample impact categories, characterisation models, factors & units
Abioticdepletion
Ultimate reserve/annual use
Guinee & Heijungs 95 Abiotic depletion potential
kg Sb eq.
Climate change Infrared radiative forcing
International Panel on
Climate Change
Global warming potential
kg CO2 eq.
Stratospheric ozone depletion
Stratospheric ozone breakdown
World Meteorological
Organization model
Stratospheric ozone layer
depletion potentialkg CFC-11eq.
Human toxicity Predicted daily intake,
Accepted daily intakeEUSES, California Toxicology Model
Human toxicity potential
kg 1,4-DCB eq.
Ecological toxicity
PEC, PNEC EUSES, California Toxicology Model
AETP, TETP, etc. kg 1,4-DCB eq.
Photo-oxidant smog formation
Troposphericozone production
UN-ECE trajectory model
Photo-oxidant chemical potential
kg C2H6 eq.
Acidification Deposition/ critical load
Regional Acidification
Information & Simulation
Acidification potential
kg SO2 eq.
. . . . . . . . . . . . . . .
Impact category
Indicator Characterisationmodel
Characterisationfactor
Equivalency unit
3030
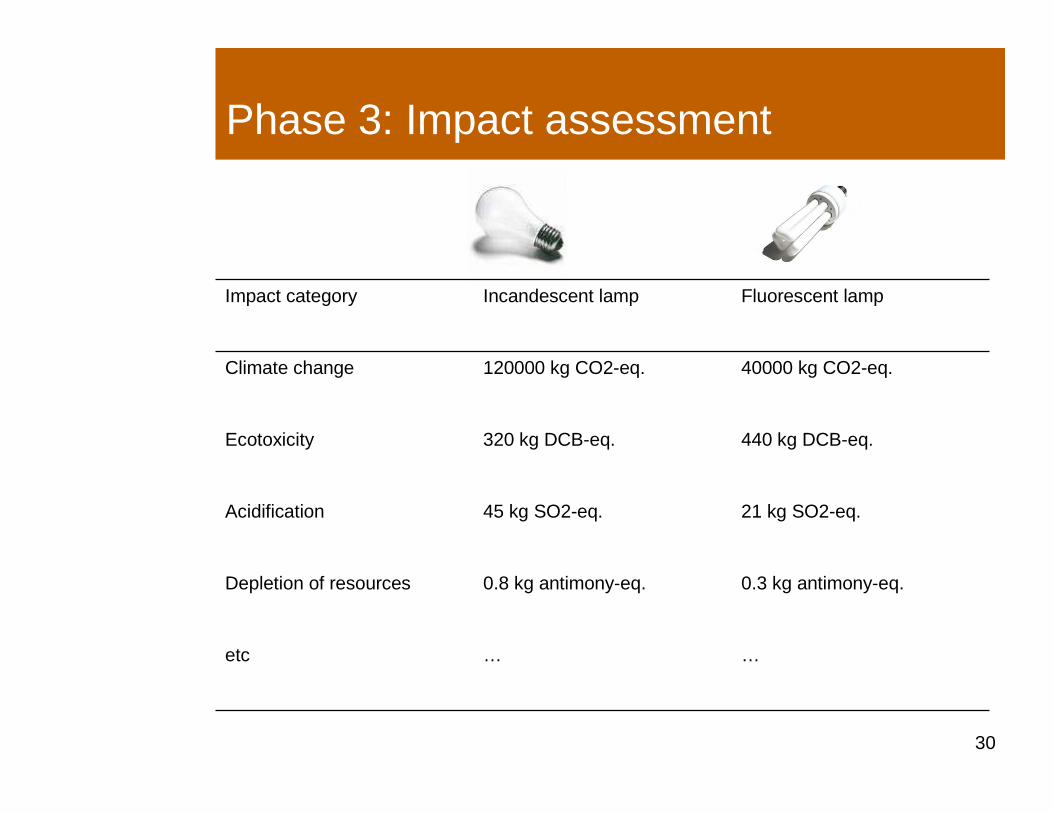
Phase 3: Impact assessment
……etc
0.3 kg antimony-eq.0.8 kg antimony-eq.Depletion of resources
21 kg SO2-eq.45 kg SO2-eq.Acidification
440 kg DCB-eq.320 kg DCB-eq.Ecotoxicity
40000 kg CO2-eq.120000 kg CO2-eq.Climate change
Fluorescent lampIncandescent lampImpact category
3131
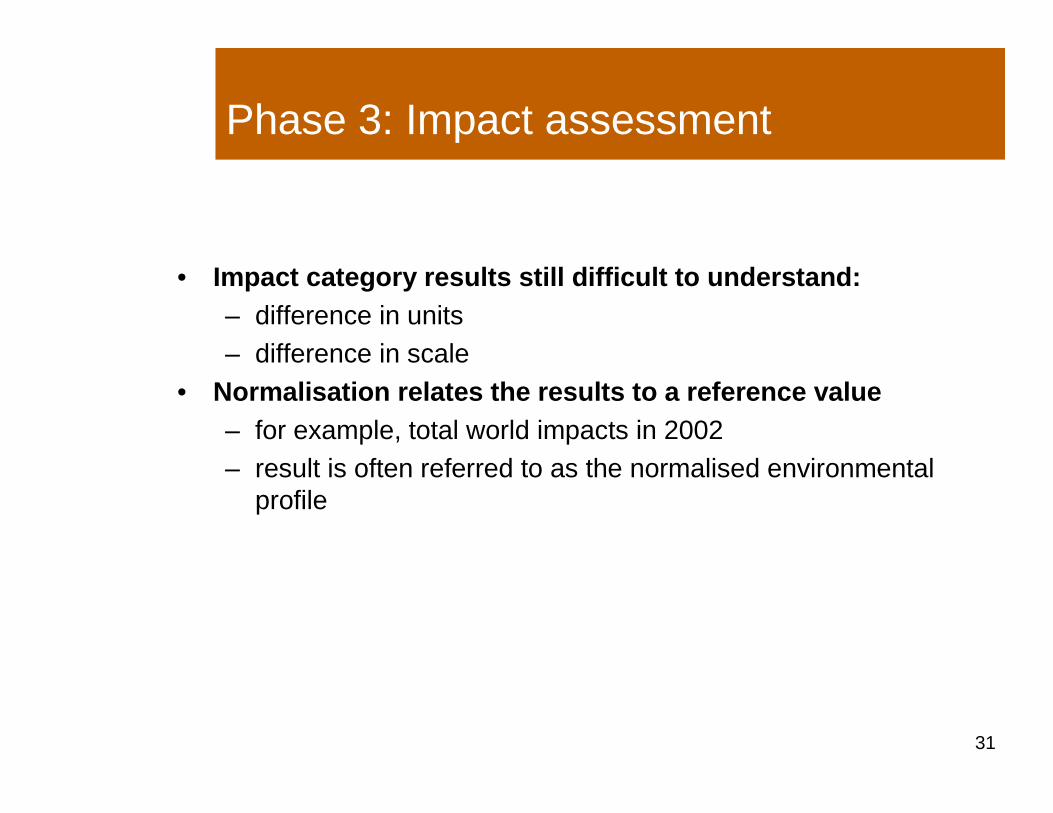
Phase 3: Impact assessment
• Impact category results still difficult to understand:– difference in units– difference in scale
• Normalisation relates the results to a reference value– for example, total world impacts in 2002– result is often referred to as the normalised environmental
profile
3232
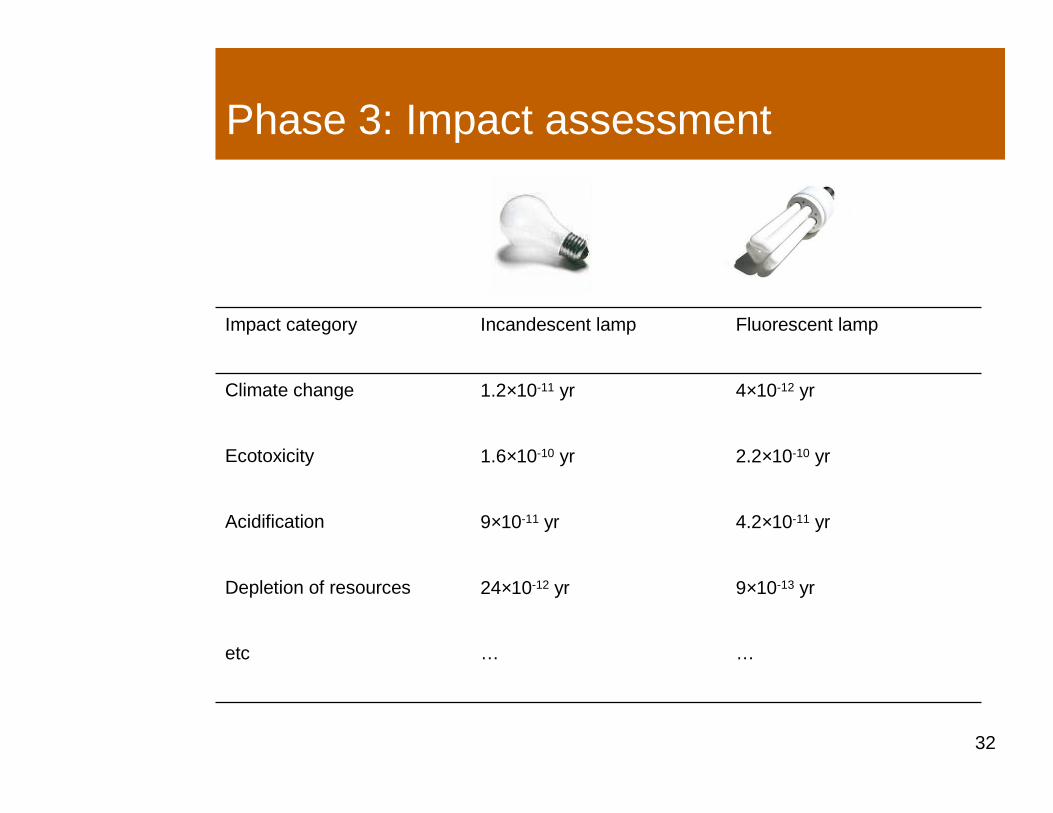
Phase 3: Impact assessment
……etc
9×10-13 yr24×10-12 yrDepletion of resources
4.2×10⁻¹¹ yr9×10-11 yrAcidification
2.2×10⁻¹⁰ yr1.6×10-10 yrEcotoxicity
4×10-12 yr1.2×10-11 yrClimate change
Fluorescent lampIncandescent lampImpact category
3333
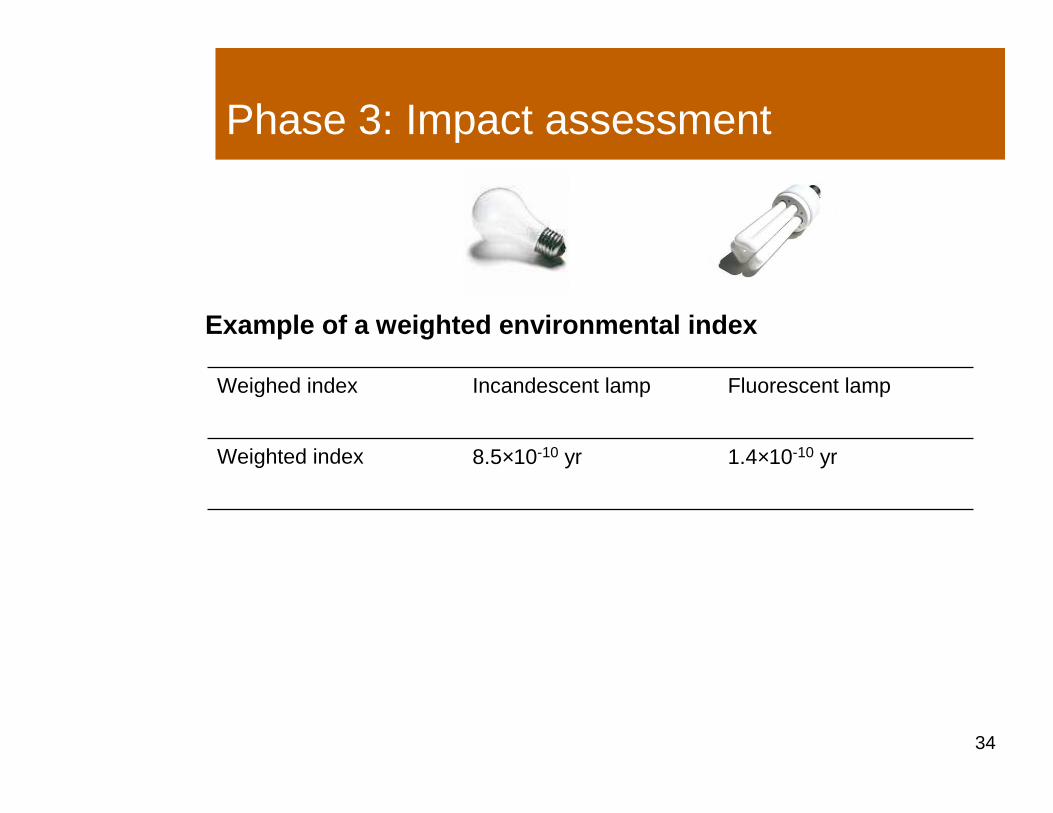
Phase 3: Impact assessment
Even after normalisation, there is no clear answer.– aggregation of (normalized) impact category results into a
single index– subjective weighting factors increase the priority given to
impact categories we think are important, and decrease the priority given to those we think are unimportant
3434
Phase 3: Impact assessment
Example of a weighted environmental index
1.4×10⁻¹⁰ yr8.5×10-10 yrWeighted index
Fluorescent lampIncandescent lampWeighed index
3535
Phase 4: Interpretation
Conclusions, recommendations, analysis: all relate to the goal and scope of the research.– Interpretation should be based on an evaluation of data
quality and sensitivity analysis.– Review by independent experts is important.
3636
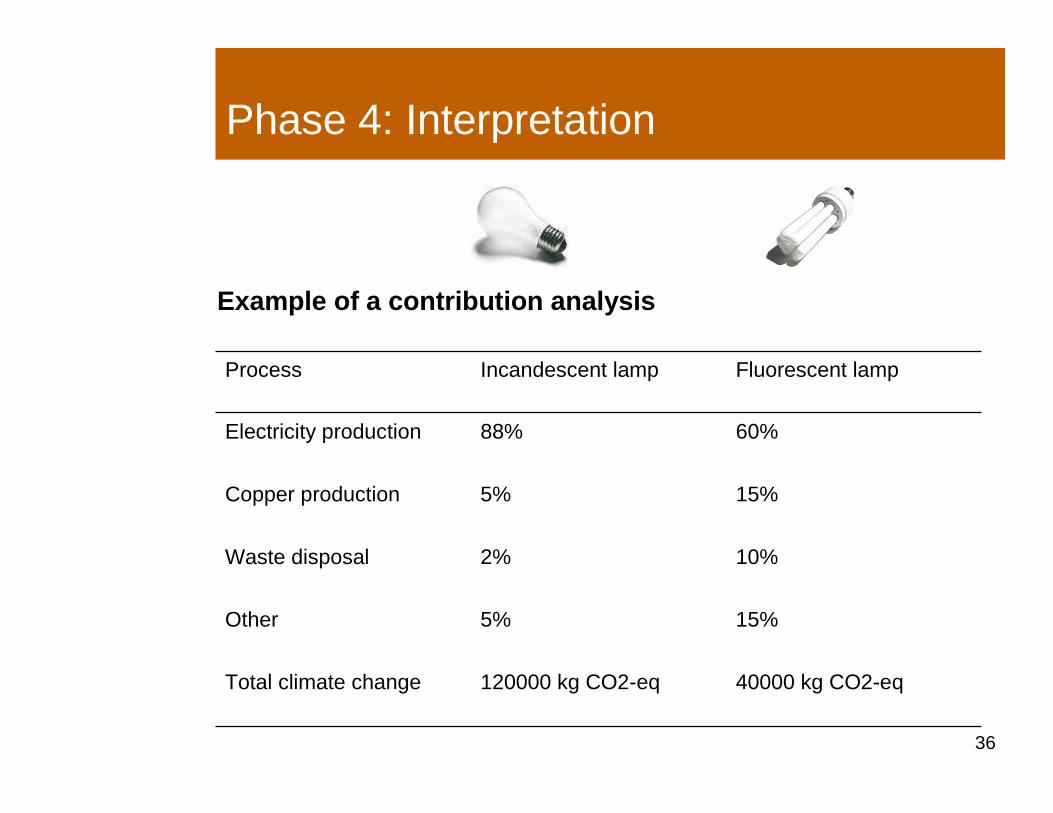
Phase 4: Interpretation
Example of a contribution analysis
40000 kg CO2-eq120000 kg CO2-eqTotal climate change
15%5%Other
10%2%Waste disposal
15%5%Copper production
60%88%Electricity production
Fluorescent lampIncandescent lampProcess
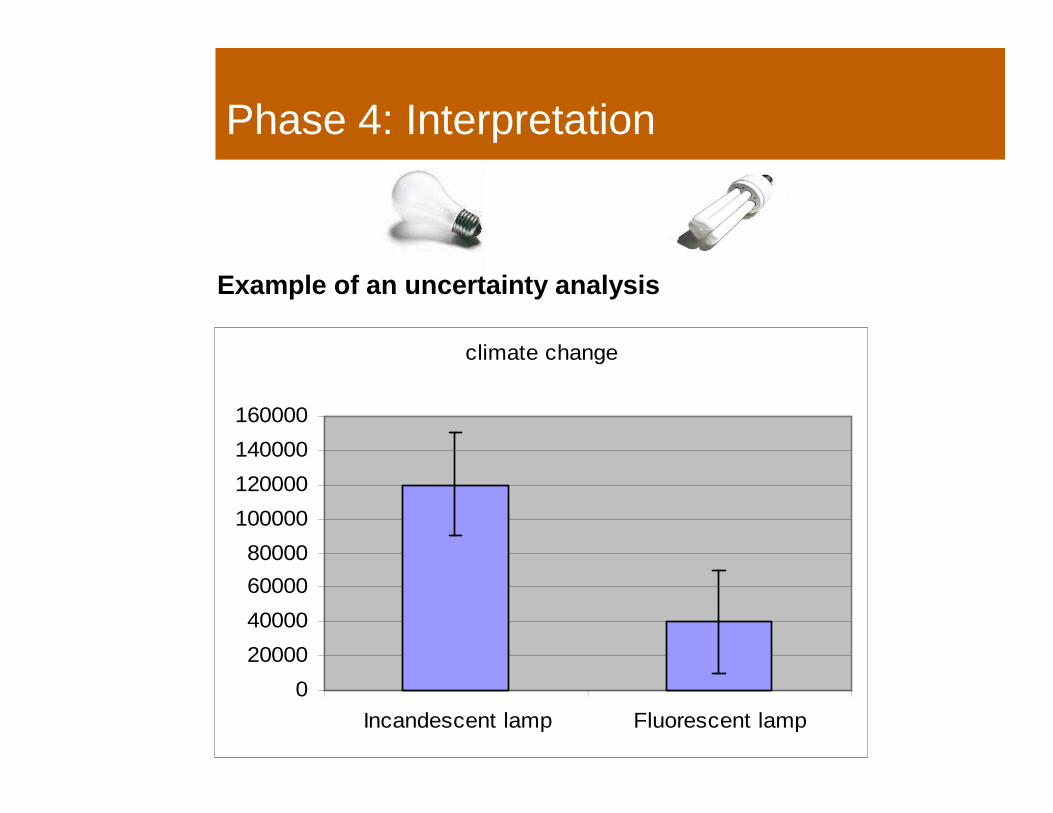
Phase 4: Interpretation
Example of an uncertainty analysis
climate change
0
20000
40000
60000
80000
100000
120000
140000
160000
Incandescent lamp Fluorescent lamp
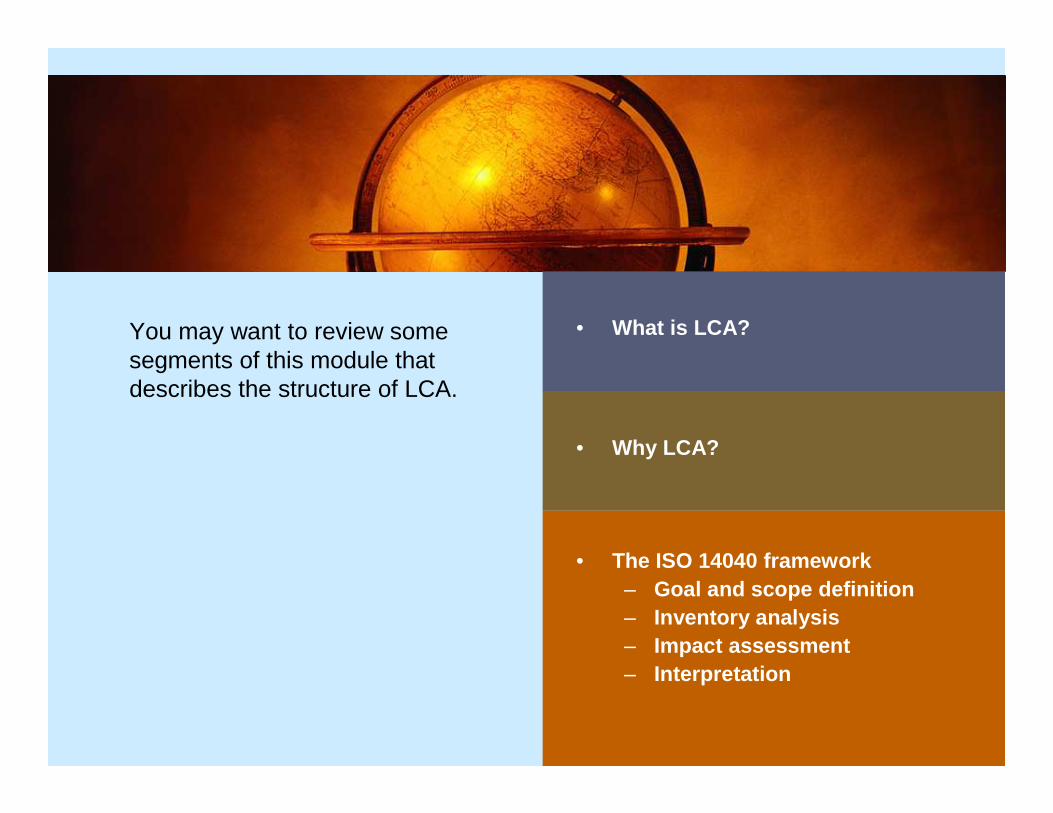
You may want to review some segments of this module that describes the structure of LCA.
• What is LCA?
• Why LCA?
• The ISO 14040 framework– Goal and scope definition– Inventory analysis– Impact assessment– Interpretation
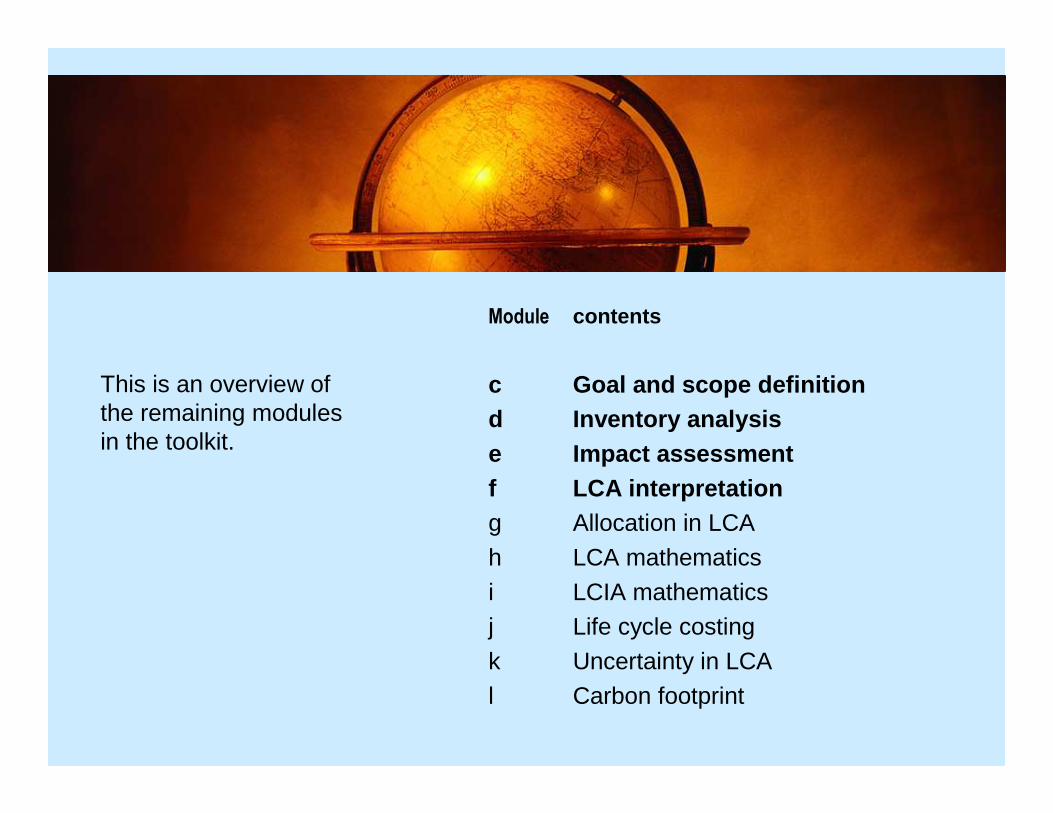
This is an overview of the remaining modules in the toolkit.
Module contents
c Goal and scope definitiond Inventory analysise Impact assessmentf LCA interpretationg Allocation in LCA
h LCA mathematics
i LCIA mathematicsj Life cycle costing
k Uncertainty in LCA
l Carbon footprint