Embed Size (px)
Citation preview

LIFE-CYCLE AND RESILIENCE ANALYSIS OF RC BUILDINGS IN
BUCHAREST, ROMANIA
Florin PAVEL1, Dan STANESCU2, Radu VACAREANU3, Veronica COLIBA4, Ionut CRACIUN5
ABSTRACT
This paper focuses on the life-cycle and resilience analysis for three RC frame structures. The three seven-story
RC structures are designed for three levels of design peak ground acceleration corresponding to different mean
return periods. Multiple-stripe analyses are performed in order to assess the fragility parameters of the analyzed
structures. The seismic resilience and life-cycle assessment are based on the results of a seismic risk analyses
performed using both the site-specific seismic hazard curve, as well as a Monte-Carlo simulated earthquake catalog
for the Vrancea intermediate-depth seismic source. Moreover, the collapse fragility is also evaluated based on
several methodologies proposed in the literature. The results of the seismic resilience and the life-cycle analysis
show smaller losses during the life-cycle of the analysis for the structure designed for the largest considered peak
ground acceleration and a faster recovery of the functionality for the same structure.
Keywords: pushover analysis; epistemic uncertainty; aleatory variability; fragility curves; ground motion
recordings
1. INTRODUCTION
In this paper, an assessment of the life-cycle costs and of the resilience is performed for three seven
story RC frame structures situated in Bucharest (Romania). The difference between the three frame
structures is that each one was designed using a different peak ground acceleration so as to mimic the
evolution of the Romanian seismic design code. Three random variables, namely concrete and steel
strength, as well as the gravitational loading are taken into consideration. Both nonlinear static, as well
as dynamic time-history analyses are performed using the SeismoStruct code. The nonlinear time-
history analyses are performed using a dataset of ground motions recorded during the Vrancea
earthquakes of March 1977 (moment magnitude MW = 7.4 and focal depth h = 94 km), August 1986
(MW = 7.1, h = 131 km) and May 1990 (MW = 6.9, h = 91 km). Multiple-stripe analyses (Jalayer and
Cornell, 2009) are performed in order to evaluate the seismic fragility of the analyzed structures. The
fragility assessment for several damage states including collapse for the structure designed using the
current version of the Romanian seismic design code P100-1/2013 (2014) is performed using several
approaches given in the literature. The seismic resilience and life-cycle analyses are based on the results
of a seismic risk analysis performed using as input both the site-specific seismic hazard curve, as well
as the ground motion amplitudes derived from a Monte-Carlo simulated earthquake catalog coupled
with a ground motion model, approach previously used by Pavel et al. (2017).
1Lecturer, Technical University of Civil Engineering Bucharest, Bucharest, Romania, [email protected] 2Engineer, Technical University of Civil Engineering Bucharest, Bucharest, Romania,
[email protected] 3Professor, Technical University of Civil Engineering Bucharest, Bucharest, Romania, [email protected] 4PhD student, Technical University of Civil Engineering Bucharest, Bucharest, Romania, [email protected] 5PhD student, Technical University of Civil Engineering Bucharest, Bucharest, Romania, [email protected]

2
2. DESCRIPTION OF STRUCTURES
The three RC frame structures have a doubly symmetrical section (18.0 x 18.0 m) consisting of columns
and beams. The thickness of the RC slab is 15 cm. A concrete class C30/37 and steel grade S500 are
used for all the structural elements. The structural design was performed according to the current version
of the Romanian seismic design code P100-/2013 (2014) which follows the EN 1998-1/2004 (2004)
format. The design peak ground acceleration was 0.24 g (value corresponding to a mean return period
of 100 years as in the 2006 version of the Romanian seismic design code), 0.30 g (value corresponding
to a mean return period of 225 years as in the 2014 version of the Romanian seismic design code) and
0.36 g (value corresponding to a mean return period of 475 years). P100-1/2013 (2014) is based on a
performance-based approach with two fundamental requirements: damage control (serviceability limit
state SLS) and life safety (ultimate limit state ULS). Contrary to EN 1998-1/2004 (2004), in the
Romanian seismic code the inter-story drifts are checked for both performance levels. The mean return
period of the seismic action associated to the two limit states is 40 years for SLS and 225 years for ULS.
The structural design was performed for ductility class high (DCH) with a behavior factor q = 6.75. The
three structures will be denoted hereafter as S1 (deign peak ground acceleration of 0.24 g), S2 (design
peak ground acceleration of 0.30 g) and S3 (design peak ground acceleration of 0.36 g).
The planar view of the analyzed structures is shown in Figure 1. The cross-section of the columns is
55x55 cm and is similar for all three structures (the reinforcement is larger for structures S2 and S3)
while the beam cross-section increases from 25x50 cm for S1 to 25x55 cm for S2 and 30x60 cm for S3.
As such, the reinforcement pattern does not change too much from structure to structure. The shear
reinforcement in both columns and beams was computed so as to avoid any brittle shear failure
(considering also the minimum requirements specified by the current seismic design code). Due to its
symmetry, it was decided to perform the pushover analyses on a simplified structure, namely a planar
frame also highlighted in Figure 1.
Due to the shape of the design response spectrum from the Romanian code P100-1/2013 (2014) which
has a long constant acceleration plateau up to the control period TC = 1.6s, the resulting design spectral
accelerations are 0.66 g for structure S1, 0.75 g for structure S2 and 0.90 g for structure S3.
Figure 1. Planar view of the analyzed structures
Three random variables, namely the concrete compressive strength fc, steel strength fy and gravitational
loading on beams Q are considered in the analyses as sources of epistemic uncertainties. The mean
values of the three considered random variables are: fc = 38 MPa, fy = 550 MPa and Q = 35 kN/m, while
their associated coefficients of variation are 0.15, 0.05 and 0.40, respectively.
The pushover analyses were performed firstly using mean values of the strengths of materials and
3
gravitational loading. A comparison of the three pushover curves obtained using SeismoStruct code is
shown in Figure 2. A bilinear model was used for the reinforcement, while for concrete the Mander et
al. (1988) model was applied.
Figure 2. Comparison of pushover curves for the three analyzed structures
3. NONLINEAR TIME-HISTORY ANALYSES
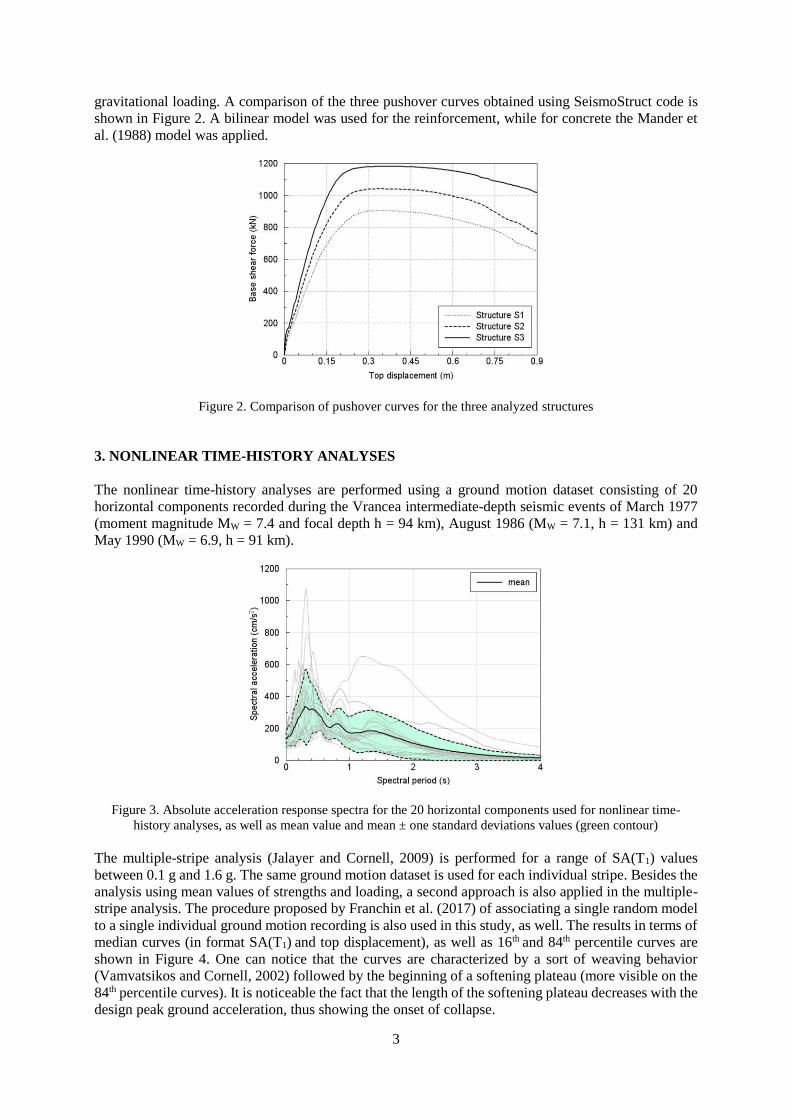
The nonlinear time-history analyses are performed using a ground motion dataset consisting of 20
horizontal components recorded during the Vrancea intermediate-depth seismic events of March 1977
(moment magnitude MW = 7.4 and focal depth h = 94 km), August 1986 (MW = 7.1, h = 131 km) and
May 1990 (MW = 6.9, h = 91 km).
Figure 3. Absolute acceleration response spectra for the 20 horizontal components used for nonlinear time-
history analyses, as well as mean value and mean ± one standard deviations values (green contour)
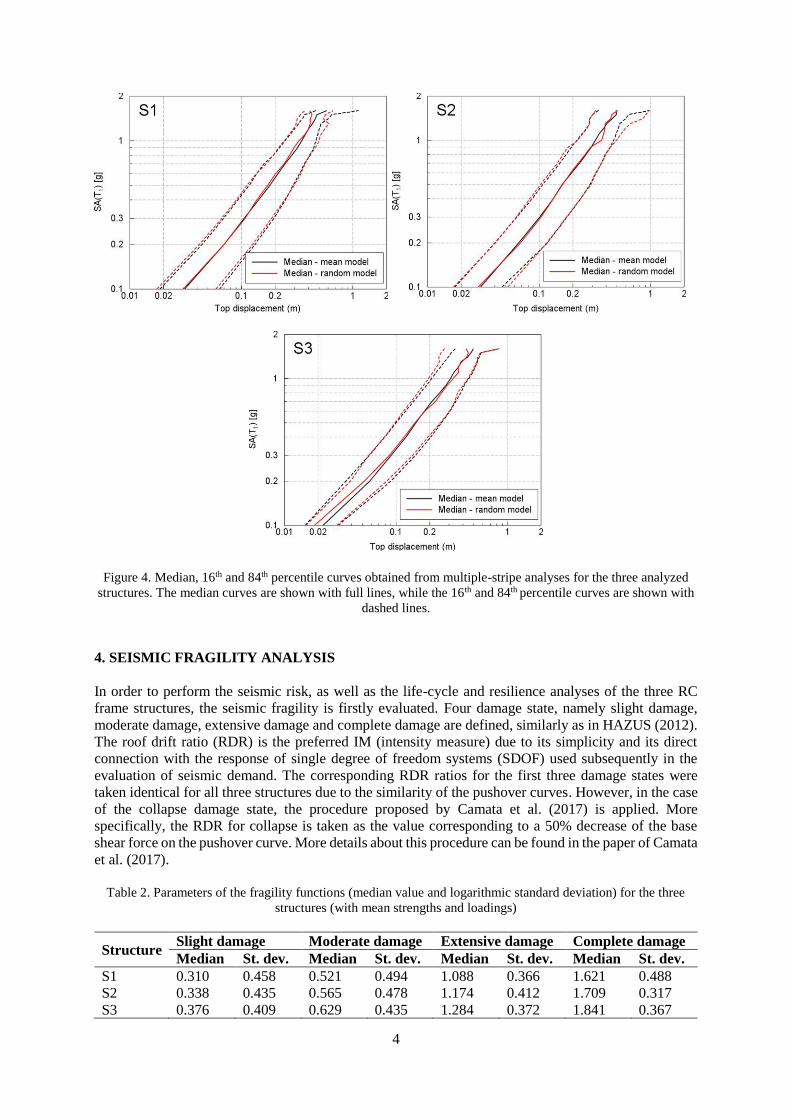
The multiple-stripe analysis (Jalayer and Cornell, 2009) is performed for a range of SA(T1) values
between 0.1 g and 1.6 g. The same ground motion dataset is used for each individual stripe. Besides the
analysis using mean values of strengths and loading, a second approach is also applied in the multiple-
stripe analysis. The procedure proposed by Franchin et al. (2017) of associating a single random model
to a single individual ground motion recording is also used in this study, as well. The results in terms of
median curves (in format SA(T1) and top displacement), as well as 16th and 84th percentile curves are
shown in Figure 4. One can notice that the curves are characterized by a sort of weaving behavior
(Vamvatsikos and Cornell, 2002) followed by the beginning of a softening plateau (more visible on the
84th percentile curves). It is noticeable the fact that the length of the softening plateau decreases with the
design peak ground acceleration, thus showing the onset of collapse.
4
Figure 4. Median, 16th and 84th percentile curves obtained from multiple-stripe analyses for the three analyzed
structures. The median curves are shown with full lines, while the 16th and 84th percentile curves are shown with
dashed lines.
4. SEISMIC FRAGILITY ANALYSIS
In order to perform the seismic risk, as well as the life-cycle and resilience analyses of the three RC
frame structures, the seismic fragility is firstly evaluated. Four damage state, namely slight damage,
moderate damage, extensive damage and complete damage are defined, similarly as in HAZUS (2012).
The roof drift ratio (RDR) is the preferred IM (intensity measure) due to its simplicity and its direct
connection with the response of single degree of freedom systems (SDOF) used subsequently in the
evaluation of seismic demand. The corresponding RDR ratios for the first three damage states were
taken identical for all three structures due to the similarity of the pushover curves. However, in the case
of the collapse damage state, the procedure proposed by Camata et al. (2017) is applied. More
specifically, the RDR for collapse is taken as the value corresponding to a 50% decrease of the base
shear force on the pushover curve. More details about this procedure can be found in the paper of Camata
et al. (2017).
Table 2. Parameters of the fragility functions (median value and logarithmic standard deviation) for the three
structures (with mean strengths and loadings)
Structure Slight damage Moderate damage Extensive damage Complete damage
Median St. dev. Median St. dev. Median St. dev. Median St. dev.
S1 0.310 0.458 0.521 0.494 1.088 0.366 1.621 0.488
S2 0.338 0.435 0.565 0.478 1.174 0.412 1.709 0.317
S3 0.376 0.409 0.629 0.435 1.284 0.372 1.841 0.367
5
The fragility parameters for the three structures with mean strengths and loadings and which are to be
employed in the seismic risk analysis are given in Table 2. The annual collapse frequency of the analyzed
structure is obtained by convolving the structural fragility with the corresponding seismic hazard curves
for SA(T1). The seismic hazard curves for each SA(T1) for Bucharest are based on the results from Pavel
and Vacareanu (2017).
5. SENSITIVITY ANALYSIS
A sensitivity analysis is subsequently conducted in order to evaluate the impact of varying the values of
the random variables on the results obtained from multiple-stripe analysis. Only structure S2 is
considered in the analysis, since it is designed using the current version of the Romanian seismic deisgn
code.
Some results for structure S2 are shown in Figure 5 in which the median, 16th and 84th percentile curves
are compared for the models in which the concrete strength, steel strength and gravitational loading on
beams are taken as the mean value ± one standard deviation.
Figure 5. Median, 16th and 84th percentile curves obtained from multiple-stripe analyses for the models with
mean ± 1 standard deviation strengths and loadings. The median curves are shown with full lines, while the 16 th
and 84th percentile curves are shown with dashed lines.
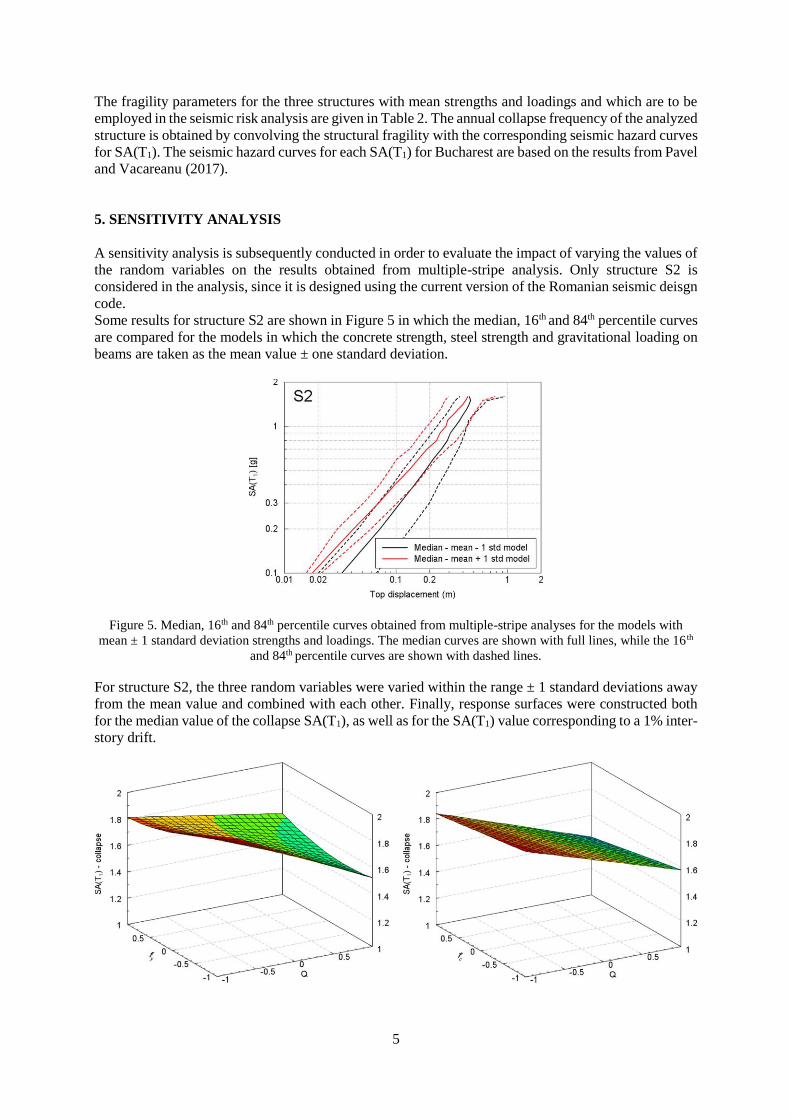
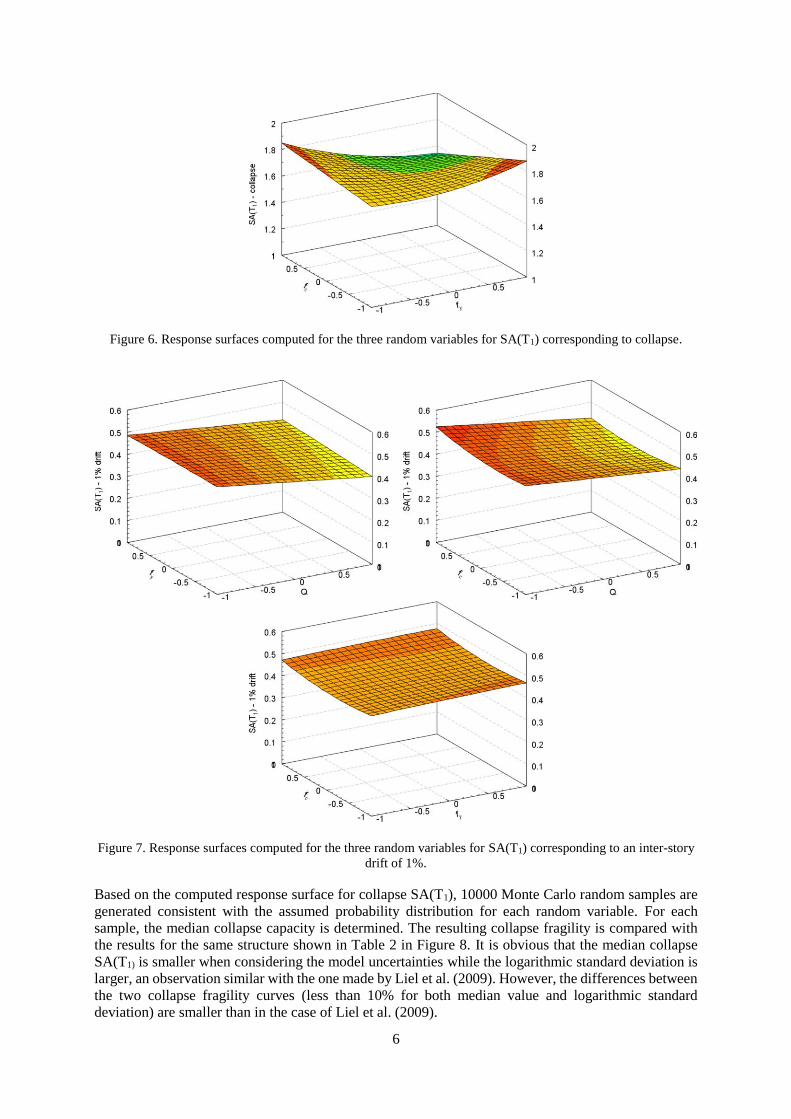
For structure S2, the three random variables were varied within the range ± 1 standard deviations away
from the mean value and combined with each other. Finally, response surfaces were constructed both
for the median value of the collapse SA(T1), as well as for the SA(T1) value corresponding to a 1% inter-
story drift.
6
Figure 6. Response surfaces computed for the three random variables for SA(T1) corresponding to collapse.
Figure 7. Response surfaces computed for the three random variables for SA(T1) corresponding to an inter-story
drift of 1%.
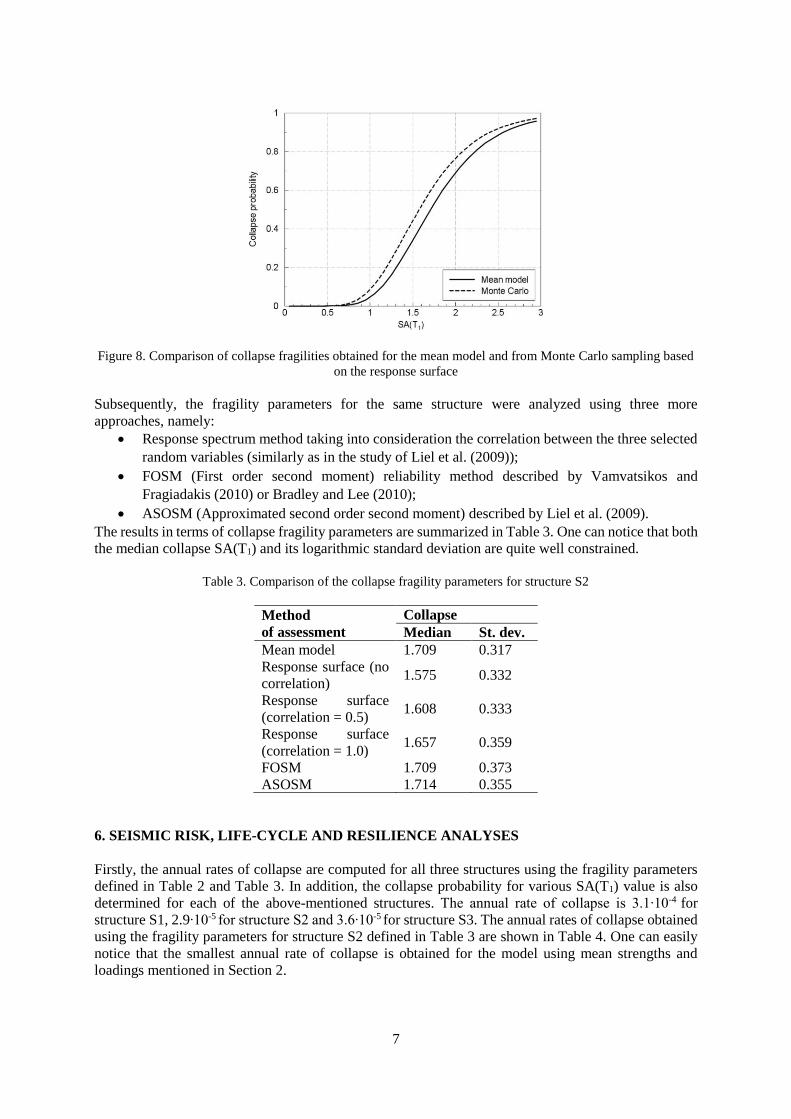
Based on the computed response surface for collapse SA(T1), 10000 Monte Carlo random samples are
generated consistent with the assumed probability distribution for each random variable. For each
sample, the median collapse capacity is determined. The resulting collapse fragility is compared with
the results for the same structure shown in Table 2 in Figure 8. It is obvious that the median collapse
SA(T1) is smaller when considering the model uncertainties while the logarithmic standard deviation is
larger, an observation similar with the one made by Liel et al. (2009). However, the differences between
the two collapse fragility curves (less than 10% for both median value and logarithmic standard
deviation) are smaller than in the case of Liel et al. (2009).
7
Figure 8. Comparison of collapse fragilities obtained for the mean model and from Monte Carlo sampling based
on the response surface
Subsequently, the fragility parameters for the same structure were analyzed using three more
approaches, namely:
• Response spectrum method taking into consideration the correlation between the three selected
random variables (similarly as in the study of Liel et al. (2009));
• FOSM (First order second moment) reliability method described by Vamvatsikos and
Fragiadakis (2010) or Bradley and Lee (2010);
• ASOSM (Approximated second order second moment) described by Liel et al. (2009).
The results in terms of collapse fragility parameters are summarized in Table 3. One can notice that both
the median collapse SA(T1) and its logarithmic standard deviation are quite well constrained.
Table 3. Comparison of the collapse fragility parameters for structure S2
Method
of assessment
Collapse
Median St. dev.
Mean model 1.709 0.317
Response surface (no
correlation) 1.575 0.332
Response surface
(correlation = 0.5) 1.608 0.333
Response surface
(correlation = 1.0) 1.657 0.359
FOSM 1.709 0.373
ASOSM 1.714 0.355
6. SEISMIC RISK, LIFE-CYCLE AND RESILIENCE ANALYSES
Firstly, the annual rates of collapse are computed for all three structures using the fragility parameters
defined in Table 2 and Table 3. In addition, the collapse probability for various SA(T1) value is also
determined for each of the above-mentioned structures. The annual rate of collapse is 3.1‧10-4 for
structure S1, 2.9‧10-5 for structure S2 and 3.6‧10-5 for structure S3. The annual rates of collapse obtained
using the fragility parameters for structure S2 defined in Table 3 are shown in Table 4. One can easily
notice that the smallest annual rate of collapse is obtained for the model using mean strengths and
loadings mentioned in Section 2.

8
Table 4. Comparison of the annual collapse rates for the structures defined in Table 3
Method
of assessment
Annual rate of
collapse
Mean model (S2) 2.9‧10-5
Response surface (no
correlation) 6.3‧10-5
Response surface
(correlation = 0.5) 5.6‧10-5
Response surface
(correlation = 1.0) 6.6‧10-5
FOSM 6.5‧10-5
ASOSM 4.9‧10-5
Next, the annual frequency of collapse in terms of mean value and its corresponding standard deviations
conditioned on the value of SA(T1) is assessed, using the relations given by Baker and Cornell (2008).
The results are summarized in Table 5. One can notice that the mean collapse rate corresponding to the
design spectral acceleration is of the order 10-2…10-3, while in the case of a 50% increase of SA(T1), the
collapse rate is of the order 1.6…2.0‧10-1.
Table 5. Conditional rate of collapse for structures S1 – S3
SA(T1)
Conditional rate of collapse Structure S1 Structure S2 Structure S3 Mean Std. deviation Mean Std. deviation Mean Std. deviation
0.20 g 9.0‧10-6 1.0‧10-3 6.5‧10-12 8.7‧10-7 7.3‧10-10 9.2‧10-6 0.40 g 2.1‧10-3 1.5‧10-2 2.3‧10-6 5.2‧10-4 1.6‧10-5 1.4‧10-4 0.60 g 2.1‧10-2 4.9‧10-2 4.8‧10-4 7.4‧10-3 1.1‧10-3 1.1‧10-2 0.80 g 7.4‧10-2 9.2‧10-2 8.3‧10-3 3.1‧10-2 1.2‧10-2 3.7‧10-2 1.00 g 1.6‧10-1 1.4‧10-1 4.6‧10-2 7.2‧10-2 4.8‧10-2 7.4‧10-2 1.20 g 2.7‧10-1 1.8‧10-1 1.3‧10-1 1.2‧10-1 1.2‧10-1 1.2‧10-1 1.40 g 3.8‧10-1 2.1‧10-1 2.7‧10-1 1.7‧10-1 2.3‧10-1 1.6‧10-1
Subsequently, in order to evaluate the seismic resilience and the life-cycle analysis, the annual seismic
losses are obtained for structures S1 – S3 using the fragility parameters from Table 2. Two approaches
are applied in order to derive the annual seismic losses, namely the convolution between the seismic
fragility and the site-specific seismic hazard curve and by using a Monte-Carlo simulated earthquake
catalog (with a duration of 50000 years and containing only MW ≥ 6.0 events) for the Vrancea
intermediate-depth seismic source. The latter approach has also been employed in the seismic risk study
of Pavel et al. (2017). The results in terms of mean annual losses are shown in Table 6. One can observe
that the results derived from the seismic hazard curve are slightly larger than the one based on Monte-
Carlo simulations. However, in the case of the standard deviations, the results from Monte-Carlos
simulations are more than four times larger as compared to their corresponding mean values.
Table 6. Comparison of mean annual losses obtained for structures S1 – S3
Structure
Annual loss Hazard curve Monte-Carlo simulation Mean Std. deviation Mean Std. deviation
S1 0.63% 0.14% 0.57% 2.45%
S2 0.53% 0.11% 0.46% 2.15%
S3 0.38% 0.06% 0.33% 1.66%

9
The seismic loss curves for the three structures are computed using the results from the two approaches.
The two approaches show good agreement for annual rates of exceedance of up to 10-3.
Figure 9. Comparison of the loss hazard curves computed for the three structures
Subsequently, the loss conditioned on various SA(T1) levels is evaluated for the three structures using
also the relations provided by Baker and Cornell (2008). The results show, as expected, an increasing
trend for the mean relative losses with the increase of SA(T1) and a capping of the corresponding
standard deviations for SA(T1) in excess of 1.0 g.
Figure 9. Comparison of the mean loss curves (left) and their corresponding standard deviation (right)
conditioned on various SA(T1) values
Based on the results of the above-mentioned seismic risk analyses, the resilience and the life-cycle costs
10
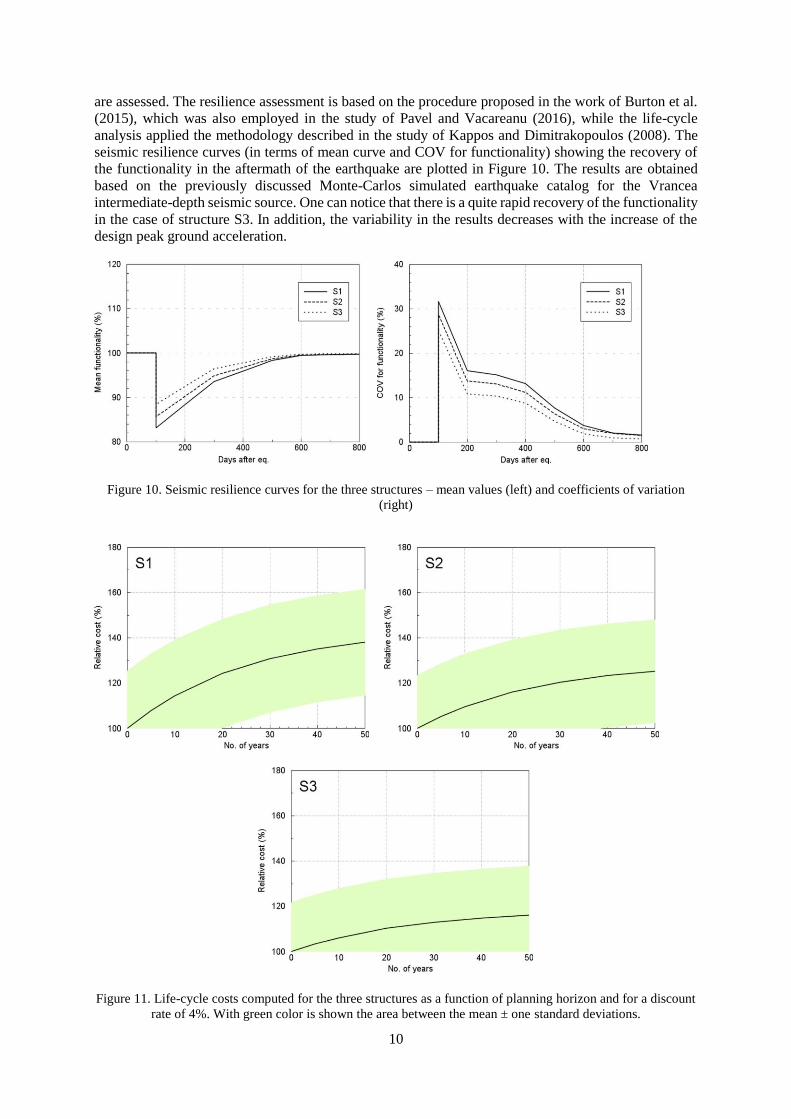
are assessed. The resilience assessment is based on the procedure proposed in the work of Burton et al.
(2015), which was also employed in the study of Pavel and Vacareanu (2016), while the life-cycle
analysis applied the methodology described in the study of Kappos and Dimitrakopoulos (2008). The
seismic resilience curves (in terms of mean curve and COV for functionality) showing the recovery of
the functionality in the aftermath of the earthquake are plotted in Figure 10. The results are obtained
based on the previously discussed Monte-Carlos simulated earthquake catalog for the Vrancea
intermediate-depth seismic source. One can notice that there is a quite rapid recovery of the functionality
in the case of structure S3. In addition, the variability in the results decreases with the increase of the
design peak ground acceleration.
Figure 10. Seismic resilience curves for the three structures – mean values (left) and coefficients of variation
(right)
Figure 11. Life-cycle costs computed for the three structures as a function of planning horizon and for a discount
rate of 4%. With green color is shown the area between the mean ± one standard deviations.

11
The life-cycle analyses of the three structures is shown in Figure 11. The mean expected relative cost
with respect to the initial value of the structures, as well as the corresponding standard deviations are
obtained using the procedure of Kappos and Dimitrakopoulos (2008) and for a discount rate of 4%.
7. CONCLUSIONS
In this paper, a life-cycle and resilience analysis are performed for three RC frame structures situated in
Bucharest (Romania) and which were designed for three levels of design peak ground acceleration
corresponding to mean return periods of 100 years, 225 years and 475 years. The effects of varying three
random variables (concrete compressive strength, steel yield strength and gravitational loading on
beams) on the nonlinear seismic response are assessed using the response surface approach. Firstly, a
fragility assessment based on multiple-stripe analyses using a ground motion database of 20 horizontal
components recorded during the Vrancea intermediate-depth seismic events of March 1977, August
1986 and May 1990 is performed. The SA(T1) – top displacement curves computed using mean values
are similar with the ones obtained thorough an approach in which a distinct ground motion recording is
coupled with a distinct structural model. The collapse fragility for the structure designed for a peak
ground acceleration of 0.30 g is assessed using several approaches given in the literature and the results
show quite well-constrained median SA(T1) and corresponding logarithmic standard deviations. The
seismic losses in terms of annual exceedance rates and conditional on SA(T1) are determined using two
procedures for the evaluation of the ground motion amplitudes, namely the site-specific seismic hazard
curve and a Monte-Carlo simulated earthquake catalog coupled with a ground motion model, a
procedure previously used in the study of Pavel et al. (2017). The seismic resilience and the life-cycle
analysis show smaller losses during the life-cycle of the analysis for the S3 structure (designed for the
largest considered peak ground acceleration) and a faster recovery of the functionality for the same
structure.
8. REFERENCES
Baker JW, Cornell CA (2008). Uncertainty propagation in probabilistic seismic loss estimation. Structural Safety,
30: 236-252.
Bradley BA, Lee DS (2010). Accuracy of approximate methods of uncertainty propagation in seismic loss
estimation. Structural Safety, 32: 13-24.
Burton HV, Deierlein G, Lallemant D, Lin T (2015). Framework for incorporating probabilistic building
performance in the assessment of community seismic resilience. Journal of Structural Engineering, 142: paper no.
C4015007.
Camata G, Celano F, De Risi MT, Franchin P, Magliulo G, Manfredi V et al. (2017). RINTC project: nonlinear
dynamic analyses of Italian code-conforming reinforced concrete buildings for risk of collapse assessment. In:
Papadrakakis M, Fragiadakis M, editors. COMPDYN 2017 - 6th ECCOMAS Thematic Conference on
Computational Methods in Structural Dynamics and Earthquake Engineering; Rhodes Island, Greece.
European Standard EN 1998-1 (2004). Design of structures for earthquake resistance - Part 1: General rules,
seismic actions and rules for buildings. CEN, Brussels, Belgium.
Federal Emergency Management Agency (2012). Multi-hazard loss estimation methodology. Earthquake model—
HAZUS MH 2.1. In: Technical manual, Washington, USA.
Franchin P, Mollaioli F, Noto F (2017). RINTC project: influence of structure-related uncertainties on the risk of
collapse of Italian code-conforming reinforced concrete buildings. In: Papadrakakis M, Fragiadakis M, editors.
COMPDYN 2017 - 6th ECCOMAS Thematic Conference on Computational Methods in Structural Dynamics and
Earthquake Engineering; Rhodes Island, Greece.
Jalayer F, Cornell C (2009). Alternative non-linear demand estimation methods for probability-based seismic
assessments. Earthquake Engineering & Structural Dynamics, 38(8): 951-972.
Kappos AJ, Dimitrakopoulos EG (2008). Feasibility of pre-earthquake strengthening of buildings based on cost-
benefit and life-cycle cost analysis, with the aid of fragility curves. Natural Hazards 45: 33-54.

12
Liel AB, Haselton CB, Deierlein GG, Baker JW (2009) Incorporating modeling uncertainties in the assessment of
seismic collapse risk of buildings. Structural Safety, 31: 197-211.
Mander JB, Priestley MJN, Park R (1988). Theoretical stress-strain model for confined concrete. Journal of
Structural Engineering, 114: 1804-1826.
P100-1/2013 (2014). Code for seismic design – Part I – Design prescriptions for buildings. Ministry of Regional
Development and Public Administration, Bucharest, Romania.
Pavel F, Vacareanu R (2016). Scenario-based earthquake risk assessment for Bucharest, Romania. International
Journal of Disaster Risk Reduction, 20: 138-144.
Pavel F, Vacareanu R (2017). Ground motion simulations for seismic stations in southern and eastern Romania
and seismic hazard assessment. Journal of Seismology, 21(5): 1023-1037.
Pavel F, Vacareanu R, Calotescu I, Sandulescu AM, Arion C, Neagu C (2017). Impact of spatial correlation of
ground motions on seismic damage for residential buildings in Bucharest, Romania. Natural Hazards, 87: 1167-
1187.
Seismosoft, SeismoStruct (2016). A computer program for static and dynamic nonlinear analysis of framed
structures. Available from http://www.seismosoft.com.
Vamvatsikos D, Cornell CA (2002). Incremental dynamic analysis. Earthquake Engineering & Structural
Dynamics, 31(3): 491-514.
Vamvatsikos D, Fragiadakis M (2010). Incremental dynamic analysis for estimating seismic performance
sensitivity and uncertainty. Earthquake Engineering & Structural Dynamics 39: 141-163.