Embed Size (px)
Citation preview
Life Cycle Analysis: Uber vs. Car Ownership
Valerie Carranza Kenyon Chow Huyen Pham
Elizabeth Roswell Peilun Sun
Environment 159 Professor Rajagopal
June 2, 2016
1

Table of Contents
1. Executive Summary ………………………………………………………………… 3
2. Goals & Scope .........………………………………………………………………… 4
3. Literature Review ….………………………………………………....……………… 5
4. Functional Unit & Flow Diagram ….………………………………………………. 6
5. Life Cycle Inventory ….…....…………………………………………………………7
6. Impact Analysis ……....……………………………………………………………… 8
7. Sensitivity & Uncertainty Analysis ………………..……………………………… 9
8. Summary of Results & Conclusion ….……………………………………..…… 10
9. Limitations ………….…………………………………………..…………………… 11
10. References ………………………..…………………...…………………………… 12
11. Contribution ……………....………………………...……………………………… 13
12. Appendix ……………….…………………………………………………………… 14
2

1. Executive Summary Globally, ridesharing services like Uber and Lyft have become popular alternative modes
of transportation for city dwellers. These services free the consumer from financial commitments that comes with owning a car, as well as freeing their time and hands. Consumers now have the opportunity to take this extra time, that would’ve been dedicated to driving, and convert it into more productive time (answering calls, texting, emailing, reading). Furthermore, by promoting carpooling, these ridesharing services claim to alleviate traffic congestion and thus less CO2 is emitted into the atmosphere. As ridesharing services continue to rise, Uber/Lyft may have the potential to replace car ownership. Our project attempts to assess whether Uber, specifically, is a viable substitute for car ownership, both economically and environmentally. A lifecycle analysis (LCA) will be performed to compare ridesharing services versus car ownership. We will compare permile average cost and CO2 emissions with (1) travelling same mileage (2) over the average lifespan of a car and (3) in the same location (e.g. Los Angeles City).
In order to measure the environmental and individual economic viability impacts, we chose miles driven as our functional unit which allowed us to analyze CO2 emissions and the costs of owning a car. Moreover, we chose a fixed average mileage driven a year with an assumption of 15 years being a car’s lifetime and calculated average costs for car maintenance, repairs, insurance, gas and registration. We used Economic InputOutput LifeCycle Assessment (EIOLCA) to gather our base values and performed a sensitivity analysis to determine the most prominent factor affecting the environmental and economic cost between using Uber and owning a car.
For each impact category, we came up with three different cases (a total of 6 cases). These cases explore different ways of travelling: solely using Uber, using Uber with a higher fuel economy, splitting half of their travels using Uber and the other half using own car and, finally, solely using own car. These cases examine the amount of CO2 emissions an individual is responsible for due to miles driven, and the economic advantages and disadvantages of the two impact categories. We found that by solely using Uber with a higher fuel economy, CO2 is reduced significantly by 92.7% compared to the highest CO2 emitting case which was splitting travels in half between Uber and driving own car making it the most favorable travelling substitute environmentally. From an economic perspective, we’ve concluded that it cost 35% less for an individual to drive their own car in contrast to the most expensive alternative — solely using uber.
Future studies of other impacts are needed to determine which case is the best substitute both environmentally and economically. Even though both Uber and owning a car fulfill the basic need of mobility, there are social and psychological needs that Uber may not address. According to an Uber article, that compares car ownership to Uber, the desire to own a car partly stems from the perception of high social status. Therefore, merely looking at the environmental impact and economic cost cannot determine the “perfect” substitute — it depends on the individual’s priorities.
3
2. Goal & Scope In recent years, the emerging sharing economy has seen rapid growth. By offering a
convenient mobile app, services like Uber and Lyft have become a popular alternative way of transportation that offers realtime, locationbased ridesharing. This replaces the need for individual car ownership and, in turn, takes its expenses with it. By promoting carpooling and freeing an individual from the responsibility of owning a car, ridesharing services claim that their services are cheaper and more environmentallyfriendly than owning a car.
The goal of this life cycle analysis is to determine whether ridesharing services are a viable substitute for owning a car by comparing permile average cost and CO2 emissions with (1) traveling same mileage and (2) over the average lifespan of a car in Los Angeles. We used a specific location (i.e. Los Angeles) to ensure a higher level of accuracy in numbers such as gas prices. Points of analysis will be automobile manufacturing and postproduction usage (e.g. miles driven, CO2 emissions). We will also take into account of other components of the total lifecycle cost of owning a car, including maintenance, insurance, registration and most importantly gas usage.
3. Literature Review Due to its relative newness, there has been little research done on ridesharing services.
However, from the research we did find, the success of ridesharing services has been mainly linked to convenience. From a survey of over 380 respondents, 86% of the responses claimed that convenience (i.e. ease of payment, easy to call car and short wait time) is the reason they opt for ridesharing services (Rayle et al., 2014). 21% claimed they didn’t want to drive after drinking and 18% claimed the hassle of parking turned them to ridesharing (Rayle et al., 2014). Ridesharing is becoming an increasingly attractive option by allowing users to compare prices with other services, including realtime ride updates (i.e. location of driver) and providing the option to lower the fare cost by sharing rides with others with similar destinations.
Empirical evidence suggests that ridesharing can provide social and environmental benefits. The idea of ridesharing is to have less vehicles on the road, therefore reducing traffic density and simultaneously reducing fuel consumption per person and mile. This indirectly decreases the impact on the environment by reducing greenhouse gases, noise and waste (e.g. used oil, salvaged car parts). Although the exact magnitude of these impacts is not fully understood, one report estimated that by 2020, 70 to 190 million metric tons of carbon dioxide emissions could be reduced by using communication and information technology to optimize logistics of individual road transport (SMART 2020, 2008). To put it in perspective, that’s conservatively equivalent to the CO2 emissions of 9.6 million homes’ annual electricity use (EPA, 2014).
Multiple papers and technology blogs have calculated the cost of owning a car versus using ridesharing services. Majority of them have concluded that using services like Uber will not only save an individual money but it’ll also save time (Myhrvoid, 2016). An individual’s opportunity cost decreases while their productivity increases. Individually, ridesharing participants benefit from less commute stress, shared travel costs, and savings in traveltime due to less vehicles on the road (Chen, 2015).
4
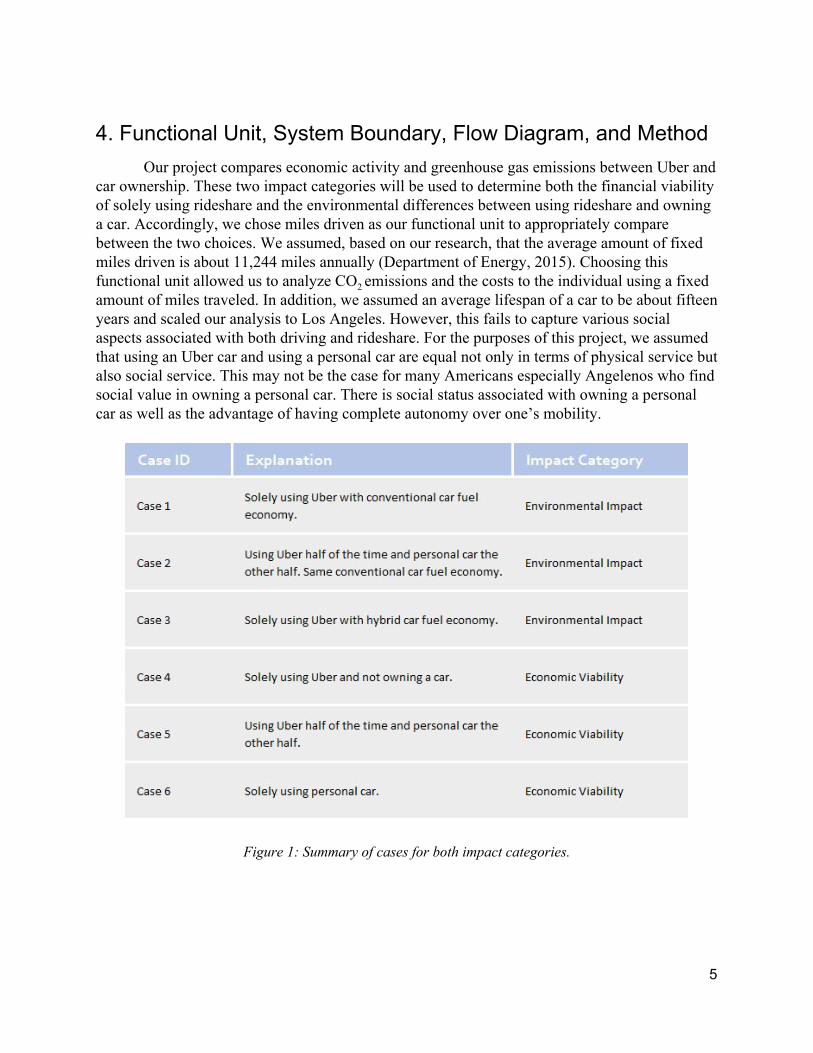
4. Functional Unit, System Boundary, Flow Diagram, and Method Our project compares economic activity and greenhouse gas emissions between Uber and
car ownership. These two impact categories will be used to determine both the financial viability of solely using rideshare and the environmental differences between using rideshare and owning a car. Accordingly, we chose miles driven as our functional unit to appropriately compare between the two choices. We assumed, based on our research, that the average amount of fixed miles driven is about 11,244 miles annually (Department of Energy, 2015). Choosing this functional unit allowed us to analyze CO2 emissions and the costs to the individual using a fixed amount of miles traveled. In addition, we assumed an average lifespan of a car to be about fifteen years and scaled our analysis to Los Angeles. However, this fails to capture various social aspects associated with both driving and rideshare. For the purposes of this project, we assumed that using an Uber car and using a personal car are equal not only in terms of physical service but also social service. This may not be the case for many Americans especially Angelenos who find social value in owning a personal car. There is social status associated with owning a personal car as well as the advantage of having complete autonomy over one’s mobility.
Figure 1: Summary of cases for both impact categories.
5

4.1. Environmental Impact We assessed how three different cases affect CO2 emissions in Los Angeles. For case 1,
all Angelenos travel in Ubers with an average fuel economy. In case 2, Angelenos use their own car half the time and Uber the other half, given that both have the same average fuel economy. In case 3, we examined the effect of replacing car ownership with Ubers that have hybrid car fuel economy.
For our lifecycle analysis, we set our system boundary to stage 0 with our main concern being the total emissions of a process, as the context of our analysis is comparing the differences across cases for the same processes. We determined our base values based on the 2002 EIOLCA tool, in which we gathered greenhouse gas data from two broad sectors: (1) automobile manufacturing and (2) automobile maintenance and operations. We also collected greenhouse gases emission data from vehicle fuel combustion since it is not covered in the broad sector of automobile maintenance and operations. As for our economic input, we assumed the default $1 million. For automobile fuel combustion, we determined CO2 emissions based on conversions from U.S. Environmental Protection Agency’s Greenhouse Gases Equivalencies Calculator (EPA).
Case 1
For case 1, we assumed every individual will bear 1% of the burden of automobile manufacturing and automobile maintenance and operations, based on the estimates of the entire Los Angeles population (3.8 million) and the current Uber supply (>20,000 cars). The process of driving remained at a constant 100% under case 1 since the burden from greenhouse gas emissions is directly attributed to the individuals and therefore does not change if all Angelenos commuted with Uber. Moreover, Uber cars in this case operate with an average conventional car fuel economy and are assumed to not significantly affect CO2 emissions from driving.
Case 2
For case 2, we assumed a change of 101% for automobile manufacturing since there will be an increase in car manufacturing given that Angelenos still own a car and are also using Uber. However, for automobile maintenance and operations a change of 50% was assumed given that the burden of the pollution is only partially on the consumer. This was based on the assumption that a car owner will put less wear on their own car and therefore be responsible for less of the pollution burden associated with automobile maintenance. Lastly, the process of driving remained constant at 100%. Case 3
For case 3, we also varied automobile manufacturing and automobile maintenance and operations to 1% since the burden of these two sectors is shared among the Los Angeles population. We assumed that the process of driving varies by 63% given that all Uber cars have a higher than average fuel economy. This was determined by dividing 21.4 mpg (Dept. of
6

Transportation, 2016), the average fuel economy of a conventional vehicle, by 33.9 mpg (Dept. of Transportation, 2016), average fuel economy from a hybrid vehicle.
4.2. Economic Viability For economic activity, we also used a case system to examine the different costs of three
common lifestyles. Case 4 is solely relying on Uber for all the miles used in a year, which averaged at about 11,244 miles/year. Case 5 is using Uber for half the amount of miles in a year (which we calculated would be around 5,622 miles/year), owning a personal car and using the personal car for the other half of miles per year. Case 6 is owning and using a personal car only.
Case 4
For case 4, we used the average value for cost per mile for an Uber ride which according to Uber is around 90 cents. We multiplied this value times the average, total amount of miles driven per year, which is around 11,244 mi/yr. Then to scale up to the average lifetime of a car, we multiplied this by 15 years. This gave us a total cost of $151,794 for 11,244 miles driven a year for 15 years. The customer does not pay for the price of owning and maintaining a car, intial car cost or the gas associated with driving. Case 5
Next, we examined an even more common scenario, using Uber half the time while owning and driving a personal car for the other half. In this case, the price of using Uber was the average cost per mile (90 cents) times half the amount of miles driven on average in a year, assumed to be around 5,622 mi/yr. Again, we multiplied this number by 15 years.
Since the Uber user in this case also uses and owns a car, we had to add the initial price of a car and the discounted, total price of owning a car for 15 years. The initial cost of buying a car was around $34,000 according to Kelley Blue Book. The discounted cost of using a car for 15 years includes the insurance, registration and the gas used for half the amount of miles driven in a year (5,622 mi/yr). Considering that the original value we found for the cost of a car included the cost of gas for the total amount of miles driven a year, we had to take the cost of gas and divide in half. The total value we computed with the manipulation for half the cost of gas gave us $7898. We then discounted this number at a 5% discount rate for 15 years which resulted in about a $81,978 cost. The summation of all these numbers gave us $191,875. Case 6
Lastly, we looked at the cost of using solely a personal car without ever using Uber. For this, we used the same initial cost of an average car, $34,000. We then calculated the cost of owning and driving a car for the full miles (11,244 mi/yr) a year for 15 years. This included insurance, registration and the cost of gas for driving the full amount of miles. We discounted this cost at a rate of 5% over the time period of 15 years. This computation resulted in the total cost of $90,282. Added to the initial cost of the car, the total cost of owning and driving a car for 15 years at 11,244 miles per year is $124,282.
7

5. Life Cycle Inventory For the purposes of our project, we used Economic InputOutput LifeCycle Assessment
(EIOLCA) to gather our base values. Since we had two different impact categories, economic and environmental, we also looked at two different EIOLCA categories, economic activity and greenhouse gas emissions. We also used various other sources described in Figures 2 and 3.
5.1. Environmental Impact Going beyond our base values, we looked at the emissions from both car manufacturing
and gasoline. In addition to using EIOLCA, we also utilized data from U.S Energy Information Administration (EIA). We did this in the interest of comparing the environmental impact of using a shared vehicle rather than manufacturing a personal car. As mentioned before, we assumed that an Uber car stationed in Los Angeles was shared among the Los Angeles population leaving the environmental burden split equally among everyone. We also used fuel economy as a factor due to Uber driver’s frequent use of hybrid cars rather than conventional ones. We gathered the average conventional fuel economy and average hybrid fuel economy from U.S Department of Transportation.
Figure 2: Life cycle inventory for environmental impact.
5.2. Economic Viability In order to understand the economic viability of using uber, we needed to understand the
cost of owning and maintaining a car including normal maintenance, repair, gasoline, insurance and registration. We gathered these values from sources such as Kelley Blue Book, U.S. Department of Transportation and Uber itself. In addition, we needed to know the average cost
8

of using an Uber per mile, which was 90 cents according to Uberestimate.com. Since our initial analysis was based in various scenarios rather than subcategories of the lifecycle, we did not take into account anything past stage 0. We did this because we were more interested in these values from the point of the consumer rather than the company.
Figure 3: Life cycle inventory for economic viability.
6. Impact Analysis
6.1. Environmental Impact Base Scenario
The base scenario provides a rough estimate of CO2 emissions from three different processes in the automobile sector. According to the 2002 EIOLCA tool, automobile manufacturing emits 412 tCO2e and automobile maintenance and operations emits a total of 268 tCO2e. Based on our assumption that the average car travels 11,244 miles annually, a conventional car emits a total amount of 77.4 tCO2e. The base scenario values are affected in each of the following cases. Case 1
In case 1, CO2 emissions from car manufacturing dropped to 4.1 tCO2e, a percent decrease of 99%. Moreover, car maintenance and operations also decreased by 99% to 2.7 tCO2e. Lastly, emissions from driving remained constant. Case 2
9

In case 2, CO2 emissions from car manufacturing actually increased by 1% to 416.1 tCO2e. In this case, emissions from car maintenance and operations lowered by 50% to 134.9 tCO2e. Emissions from driving was not affected since it remained unchanged. Case 3
Case 3 also yielded the same emission reductions as Case 1 for automobile manufacturing and automobile maintenance and operations. In this case, driving emissions did drop to 48.9 tCO2e, a 36.9% decrease.
As shown in Figure 4, case 3 has the most significant environmental impact; the total amount of CO2 emissions decreased from 759.1 tCO2e to 55.7 tCO2e. This is a 92.7% decrease from the base scenario. That is if all Angelenos did not own a car, and instead traveled in Ubers with higher than average fuel economy, there would be a significant reduction of CO2 emissions in the city. However, commuting solely in Ubers with an average fuel economy also yields a substantial reduction in CO2 emissions by 88.9%. The least favorable scenario is case 2, in which the total amount of CO2 emissions is only reduced to 628.4 tCO2e, a 17.2% decrease.
Figure 4: Environmental Impact Results
6.2. Economic Viability Case 4
10

In case 4, consumers solely use Uber and do not own a car. As a result, only the expense of using Uber is considered. The price of Uber per mile is fixed to be 0.9 $/mile (Dough, 2015). It is assumed that total miles driven using Uber is 11,244 mile/year (U.S Department of Energy, 2016). The result of calculation indicates that the total cost for case 4 is $151,794. Case 5
In case 5, consumers spend 50% of the time using Uber, 50% of the time using car owned by person. In this case, expenses from both Uber and owning a car is considered. The price of Uber per mile is still fixed to be 0.90 /mile. And total miles driven using Uber is still 11,244 miles per year. However, in calculation a factor of 50% is multiplied due to using only 50% of the total time. The discounted cost of owning a car while only using it for 50% of the time is $81,978 (Kelley Blue Book, 2016). It is assumed that the price of a car is fixed to be $34,428 (Kelley Blue Book, 2016). The result of calculation increases to $191, 875 in comparison with case 4. Case 6
In case 6, consumers solely use car owned by person and do not use Uber. Thus, only the expense of owning a car is considered. The discounted cost of owning a car while only using it for 50% of the time is $90,282. It is assumed that the price of a car is still fixed to be $34,428 (Kelley Blue Book, 2016). The result of calculation decreases to $124,282 in comparison with case 4 and 5.
Figure 5: Economic Viability Results
11
As shown in Figure 5, Case 5 has the highest cost for consumer; the total amount of cost summed up to $191,875. Case 6 has the lowest cost for consumer, which only summed up to $124,282. Thus, from an economic viability perspective, Case 4 is the most favorable.
7. Sensitivity Analysis
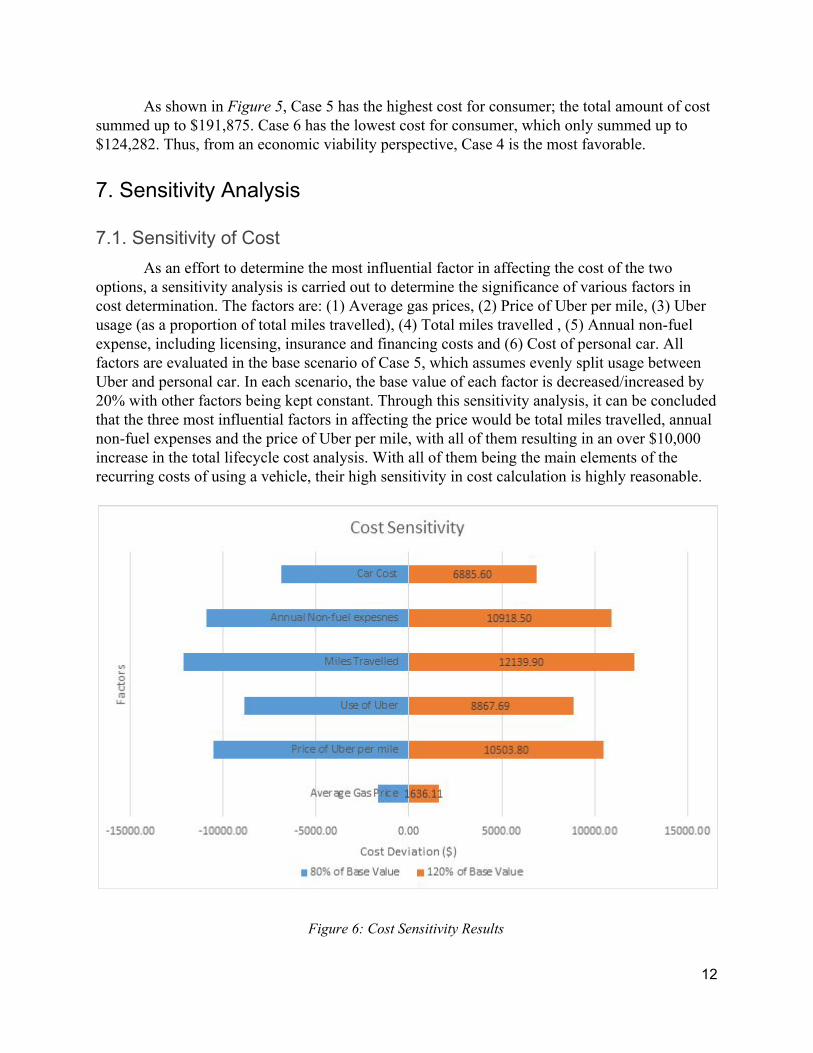
7.1. Sensitivity of Cost As an effort to determine the most influential factor in affecting the cost of the two
options, a sensitivity analysis is carried out to determine the significance of various factors in cost determination. The factors are: (1) Average gas prices, (2) Price of Uber per mile, (3) Uber usage (as a proportion of total miles travelled), (4) Total miles travelled , (5) Annual nonfuel expense, including licensing, insurance and financing costs and (6) Cost of personal car. All factors are evaluated in the base scenario of Case 5, which assumes evenly split usage between Uber and personal car. In each scenario, the base value of each factor is decreased/increased by 20% with other factors being kept constant. Through this sensitivity analysis, it can be concluded that the three most influential factors in affecting the price would be total miles travelled, annual nonfuel expenses and the price of Uber per mile, with all of them resulting in an over $10,000 increase in the total lifecycle cost analysis. With all of them being the main elements of the recurring costs of using a vehicle, their high sensitivity in cost calculation is highly reasonable.
Figure 6: Cost Sensitivity Results
12

7.2. Sensitivity of Greenhouse Gas Emissions In our analysis, the three main factors influencing greenhouse gas emissions would be
Uber usage, as a proportion of total miles travelled, fuel economy of the vehicle and the total miles travelled over the lifetime of the vehicle. Increasing Uber usage would reduce the wear and tear of the personal car and thus driving down the carbon emissions of the process of carbon maintenance and operations, while having a higher fuel economy rating of a car would reduce the carbon emissions in the driving process. To evaluate the impact of Uber usage, a threshold of Case 5 (evenly split usage of Uber and personal car) is employed and a 20% decrease/increase in Uber usage is applied with other factors kept constant. When determining the effect of fuel economy and total miles travelled, the base scenario is Case 4 (100% Uber) and the fuel economy and miles travelled is changed one at a time. Through this analysis, it can be concluded that Uber usage is the most influential factor in affecting the greenhouse gas emissions. Considering the stark difference in greenhouse gas emissions between using Uber and driving a personal car, it is not a surprising result to have Uber usage being the most sensitive input.
Figure 7: Greenhouse Gases Sensitivity Results
7.3. Uncertainty Analysis In the context of our analysis, there is little uncertainty concerning greenhouse gas
emissions as the both Uber and using personal car is essentially using the same product, a passenger vehicle, and the procedures of determining the emissions of a vehicle is wellestablished and the variation is insignificant. However, regarding cost calculations, there are
13
numerous uncertain elements that are difficult to address due to our analysis being a simplification of reality. Most notably, the consideration of ridesharing is disregarded in our analysis, which would potentially reduce both the cost per mile of Uber and personal vehicle significantly. However, we decided to ignore ridesharing for simplicity since evaluating the average number of passengers per vehicle and/or per trip is a complex and highly variable process and the extent of cost reduction for Uber and personal car would be similar.
In addition, in determining the cost per mile of driving a personal car, we decided to omit the costs of parking. While parking costs potentially represents a significant portion of the total cost of owning a car, costs of parking is prone to huge spatial and temporal fluctuations, with one’s geographical location, travelling/commute schedule and possession of a parking spot all heavily influencing one’s costs of parking. Thus, obtaining an average parking cost is a highly uncertain process and beyond the scope of our analysis.
Last but not least, in the process of calculating the costs of using Uber, we disregarded the phenomenon of surges, which refers to Uber pricing spikes during peak hours or times of high demand. While surges would potentially inflate the Uber costs, there is insufficient data to truly estimate the impact of surges on the total Uber costs due to the unpredictability of surges. Theoretically, as long as the the supply of Uber is assumed to be unlimited, pricing spikes due to increased demand would be minimal. Thus, if our assumptions for the study is held true, Uber price surges would have a limited impact on the total costs of usage and can be disregarded.
8. Summary of Results & Conclusion Our LCA showed that the total amount of CO2 emissions created by solely using Uber
with normal fuel economy and not owning a car is 84.2 tons of CO2 equivalent. The total amount of CO2 emissions created by 50% of the time using Uber and 50% using car owned by person with both cars having same fuel economy is 628.4 tons of CO2 equivalent. And the total amount of CO2 emissions created by solely using Uber with higher fuel economy and not owning a car is 55.7 tons of CO2 equivalent. The result shows that the most favorable scenario is case 3 (solely using Uber with higher fuel economy and not owning a car.) since this scenario generates the least CO2 emissions. Comparing with the base scenario of 759.1 tons of CO2 equivalent, case 3 has a 92.7% decrease from the base scenario. In other words, if people in Los Angeles solely travel with Uber with higher than average fuel economy, there would be a significant reduction of CO2 emissions in the city.
Our LCA also showed that the total cost of for consumer created by solely using Uber and not owning a car is $151,794. The total cost of for consumer created by 50% of the time using Uber and 50% using car owned by person is $191,875. And the total cost of for consumer created by solely using car owned by person is $124,282. The result surprisingly shows that case 4 (solely using car owned by person) is the most favorable since this scenario has the least total cost for consumers.
Through our sensitivity analysis, we found that the total lifecycle cost is most sensitive to changes in the amount of total miles travelled, annual nonfuel expenses and the price of Uber per mile. This is mainly due to all of them being the main components of the recurring variable costs of using a car. We also found that total greenhouse gas emission is most sensitive to changes in Uber usage, which Uber is the more environmentallyfriendly option . Because of this result, it is clear through our LCA that reducing Uber usage can greatly decrease the CO2
14
emissions and reducing total miles traveled can reduce the total cost. This could be done by encouraging more car sharing and carpooling so that the total Uber usage and total mile traveled can be splitted between more people.
In conclusion, based on our assumptions, using 50% Uber and 50% owned is the least desirable scenario. Between the two better scenarios, using Uber alone will be costlier than owning a car on an individual level. However, owning a car has higher environmental impact than using Uber. The result somehow contrast our assumption that using Uber and owned car leave the environmental burden split equally among everyone. More detailed study is recommended to be carried out in order to get a more concrete result.
9. Limitations The key foundation of our analysis lies on Uber being a perfect substitute for owning a
car. In order to directly compare their cost and CO2 emissions per mile, a future study needs to evaluate the relative fulfillment of Uber and driving personal car, i.e. travelling, going places. In reality, however, owning a personal car does not only fulfill one’s need of travelling but also produces substantial utility that is intrinsically desirable, but that is also difficult to assign a monetary value. For example, in the context of individuals of high social status, their desire to own a personal car might not be solely to fulfill travel needs but also to enjoy the social and psychological satisfaction of owning a luxury car. In the context of longdistance travelers, they desire the ability of a personal car to carry cargo and to travel over long distances, which Uber cannot provide. For individuals who travel frequently, the stability and reliability of owning a personal car would be more preferable than Uber, which is susceptible to surges and limited supply of drivers. In all of the above cases, owning a personal car, and consequently its value, extends beyond travelling and categorizing Uber, which satisfies the demand of travelling only, as the perfect substitute of personal car is inappropriate. In future works, a comprehensive evaluation of the total utility of owning a personal vehicle must be carried out and the perfect substitute for personal car, which ideally would include a range of products and services including Uber, should fulfill all niches satisfied by owning a personal car.
15
10. References
1. Chen, Zhen. “Impact of RideSourcing Services on Travel Habits and Transportation Planning.” Graduate Dissertation for Swanson School of Engineering at Beijing Jiaotong University. 7 July 2015.
2. Dough. “How Much Does Uber Cost? Uber Fare Estimator.” Ridesharing Driver. 2 Dec
2015.
3. Environmental Protection Agency (EPA). “Greenhouse Gas Equivalencies Calculator.” EPA. April 2014
4. Greenblatt, Jeffery B. Shaheen, Susan. “Automated Vehicles, OnDemand Mobility, and
Environmental Impacts.” Current Sustainable/Renewable Energy Reports. 21 July 2015.
5. Global eSustainability Initiative. “SMART 2020: Enabling the Low Carbon Economy in the Information Age. United States Report Addendum.” 2008.
6. Kelly Blue Book. “Record NewCar Transaction Prices Reported In December 2015.”
Kelly Blue Book. 5 Jan 2016.
7. Myhrvoid, Conor. “It’s a Beautiful (Pool) Day in the Neighborhood.” Uber. 16 April 2015. Web. 7 May 2016
8. Rayle, Lisa, Shaheen, Susan, Chan, Nelson, Dai, Danielle and Cervero, Robert.
“AppBased, OnDemand Ride Services: Comparing Taxi and Ridesourcing Trips and User Characteristics in San Francisco.” University of California Transportation Center (UCTC). Nov. 2014.
9. U.S. Department of Energy. Alternative Fuels Data Center. Retrieved June 01, 2016,
from http://www.eia.gov/tools/faqs/faq.cfm?id=307
10. U.S. Department of Transportation. Retrieved June 01, 2016, from http://www.rita.dot.gov/bts/sites/rita.dot.gov.bts/files/publications/national_transportation_statistics/html/table_04_23.html
11. U.S. Energy Information Administration. (2016, May 06). Independent Statistics and
Analysis. Retrieved June 01, 2016, from http://www.eia.gov/tools/faqs/faq.cfm?id=307
12. Vyotek. “How Do Car Ownership Costs Compare to Using Uber?” Uber. 4 March 2013. Web. 7 May 2016.
16

11. Author Contributions Valerie Carranza Functional Unit, System Boundary, Flow diagram and Method section, Impact Analysis Kenyon Chow Sensitivity and Uncertainty Analysis, Limitations Huyen Pham Executive Summary, Overview of Literature Elizabeth Roswell Functional Unit, System Boundary, Flow diagram and Method section, Life Cycle Inventory Peilun Sun Impact Analysis, Conclusion
17
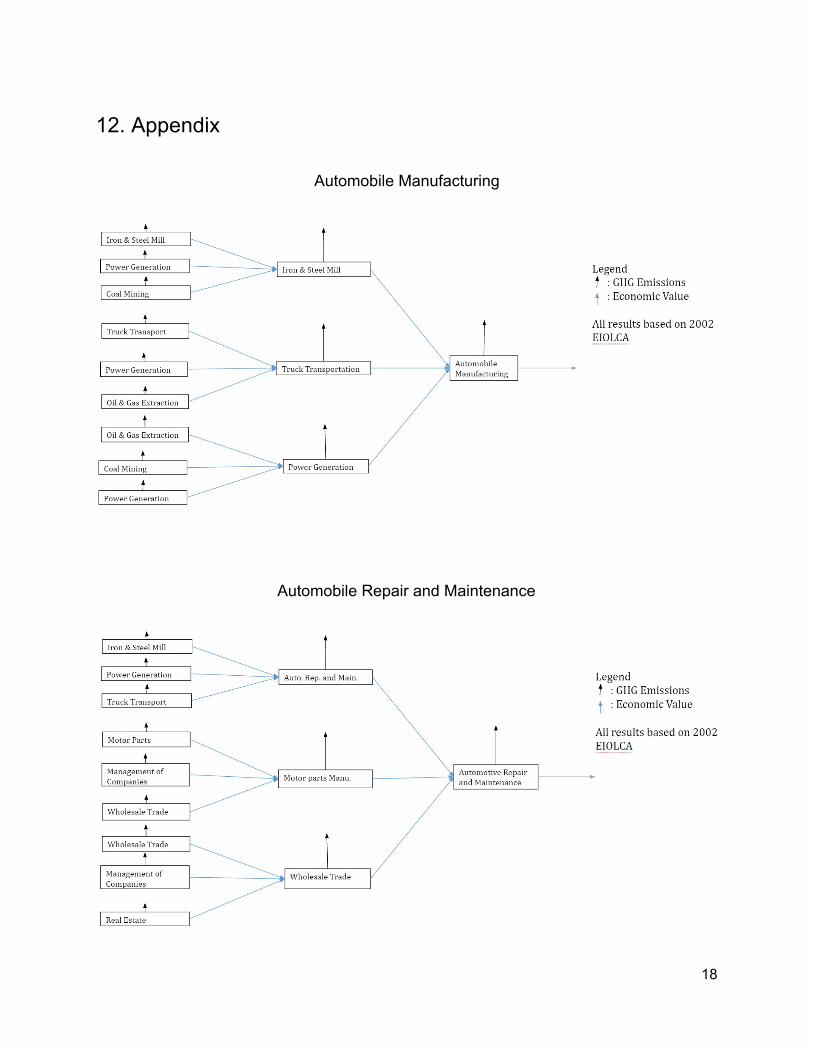
12. Appendix
Automobile Manufacturing
Automobile Repair and Maintenance
18

19


![Life Cycle Presentation2[1] - holtcat.com Cycle Presentation2[1].pdf · 1. Equipment Selection 2. Ownership Plan Construction 3. Distribution of Roles, Responsibilities & Risk 4](https://img.pdfslide.us/doc/110x75/5edc5ea3ad6a402d666700fe/life-cycle-presentation21-cycle-presentation21pdf-1-equipment-selection.jpg)