Embed Size (px)
Citation preview

11
Life Cycle Analysis of Battery and Fuel Cell Vehicles
Risø International Energy Conference 200914. -16. September 2009
Prof. Dr.-Ing. U. WagnerDipl.-Ing. M. BeerDipl.-Volksw. J. Habermann
Forschungsstelle für Energiewirtschaft e.V.Am Blütenanger 7180995 Münchenwww.ffe.dewww.wiba.de

2
Overview1. Cumulative Energy Demand (CED)2. Electricity Production in Germany3. Supply of Hydrogen5. CED of different drive technologies6. Summary and Conclusion
3
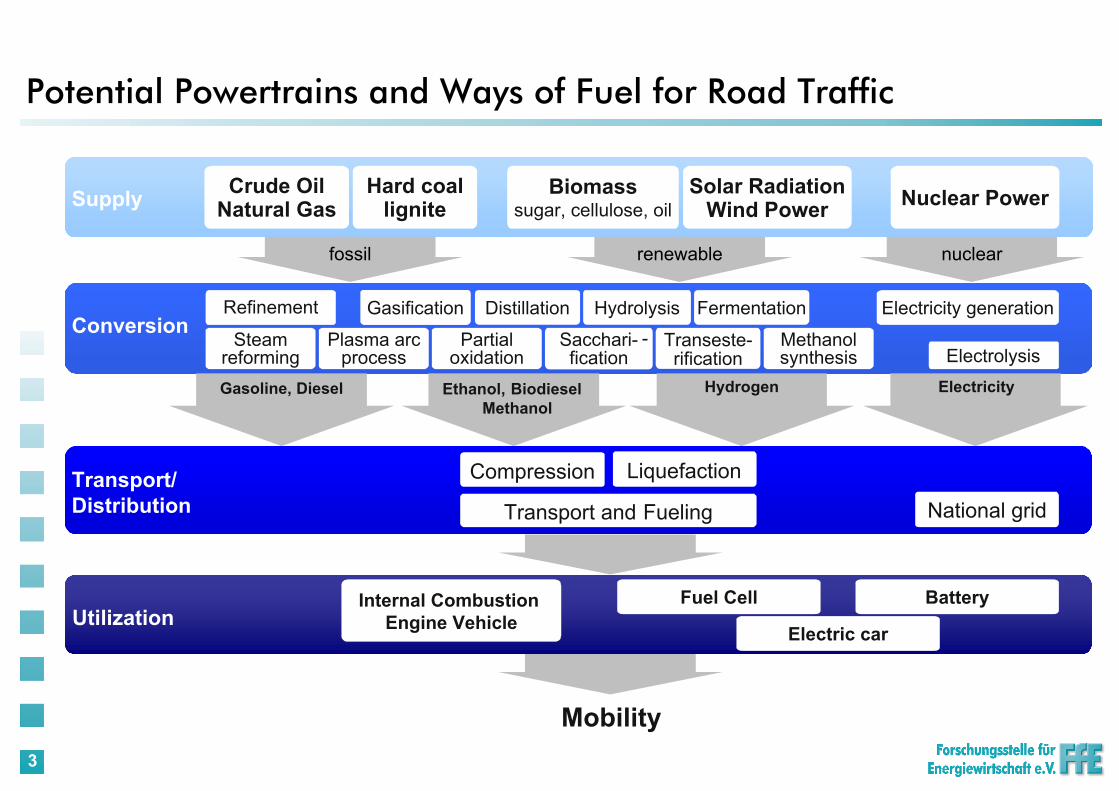
Potential Powertrains and Ways of Fuel for Road Traffic
Conversion
Transport/Distribution
Utilization
Supply
Fuel CellInternal Combustion Engine Vehicle
Mobility
Crude OilNatural Gas
Gasoline, Diesel
Solar RadiationWind Power
Electrolysis
Electricity generation
Hydrogen
Biomasssugar, cellulose, oil
Ethanol, BiodieselMethanol
Methanolsynthesis
-GasificationGasification
Sacchari-fication
Hydrolysis- Transeste-
rification
FermentationDistillation
LiquefactionCompression
Transport and Fueling
Refinement
Nuclear PowerHard coallignite
Steamreforming
Plasma arcprocess
Partialoxidation
Electricity
fossil renewable nuclear
National grid
Battery
Electric car

4
Definition: Cumulative Energy Demand (CED)
Indices:P: productionU: useD: disposal
DUP CEDCEDCEDCED ++=
CNREDCREDCED +=
Cumulative regenerativeenergy demand
Cumulative non-regenerativeenergy demand
5
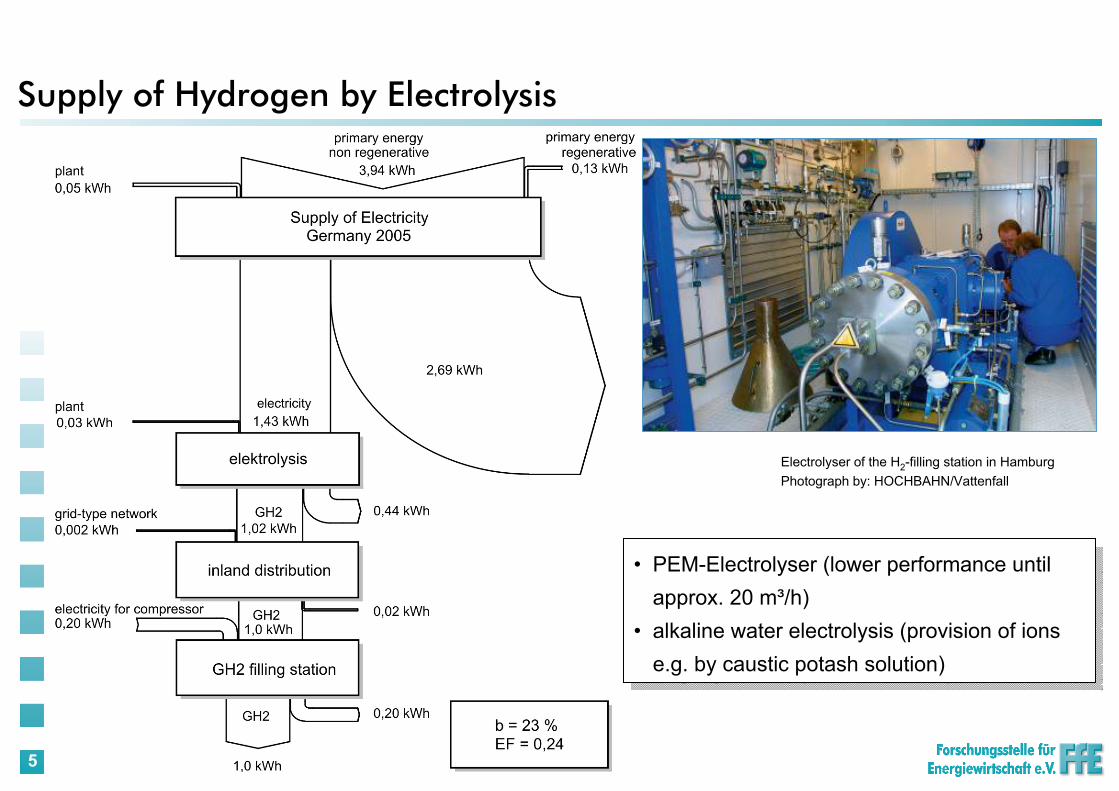
Supply of Hydrogen by Electrolysis
• PEM-Electrolyser (lower performance until approx. 20 m³/h)
• alkaline water electrolysis (provision of ions e.g. by caustic potash solution)
• PEM-Electrolyser (lower performance until approx. 20 m³/h)
• alkaline water electrolysis (provision of ions e.g. by caustic potash solution)
Electrolyser of the H2-filling station in HamburgPhotograph by: HOCHBAHN/Vattenfall

6
Steam Reforming of Natural Gas to provide Hydrogen
• 70 % to 80 % efficiency• Disadvantage: Reforming fossil natural gas
produces the same amount of CO2 that would have been emitted by combustion
• 70 % to 80 % efficiency• Disadvantage: Reforming fossil natural gas
produces the same amount of CO2 that would have been emitted by combustion
Hydrogen production plant (steam reformer)Photograph by: Linde AG

7
Cumulative Energy Demand of Production
gasolineengine forliquid fuels
gasolineengine forgaseous
fuels
dieselengine
PEFC+ el.motor
PEFC+reformer+el.motor
gasolineengine forliquid fuels
gasolineengine forgaseous
fuels
dieselengine
PEFC+el.motor
PEFC+reformer+el.motor
0
200
400
600
800
1000
1200
1400
1600
1800
0
20
40
60
80
100
120
140
GJkgvehicle mass CEDP
gasolineengine forliquid fuels
gasolineengine forgaseous
fuels
dieselengine
PEFC+ el.motor
PEFC+reformer+el.motor
gasolineengine forliquid fuels
gasolineengine forgaseous
fuels
dieselengine
PEFC+ el.motor
PEFC+reformer+el.motor
gasolineengine forliquid fuels
gasolineengine forgaseous
fuels
dieselengine
PEFC+el.motor
PEFC+reformer+el.motor
gasolineengine forliquid fuels
gasolineengine forgaseous
fuels
dieselengine
PEFC+el.motor
PEFC+reformer+el.motor
base vehiclecar bodychassiselectrical equipmentaccessories
powertrain
ICEFC systemelectric motorgearbox and miscellaneous
balance of plant
production facilitiestransport
car bodychassiselectrical equipmentaccessories
ICEFC systemelectric motorgearbox and miscellaneous
0
200
400
600
800
1000
1200
1400
1600
1800
0
20
40
60
80
100
120
140
GJkgvehicle mass CEDP
8
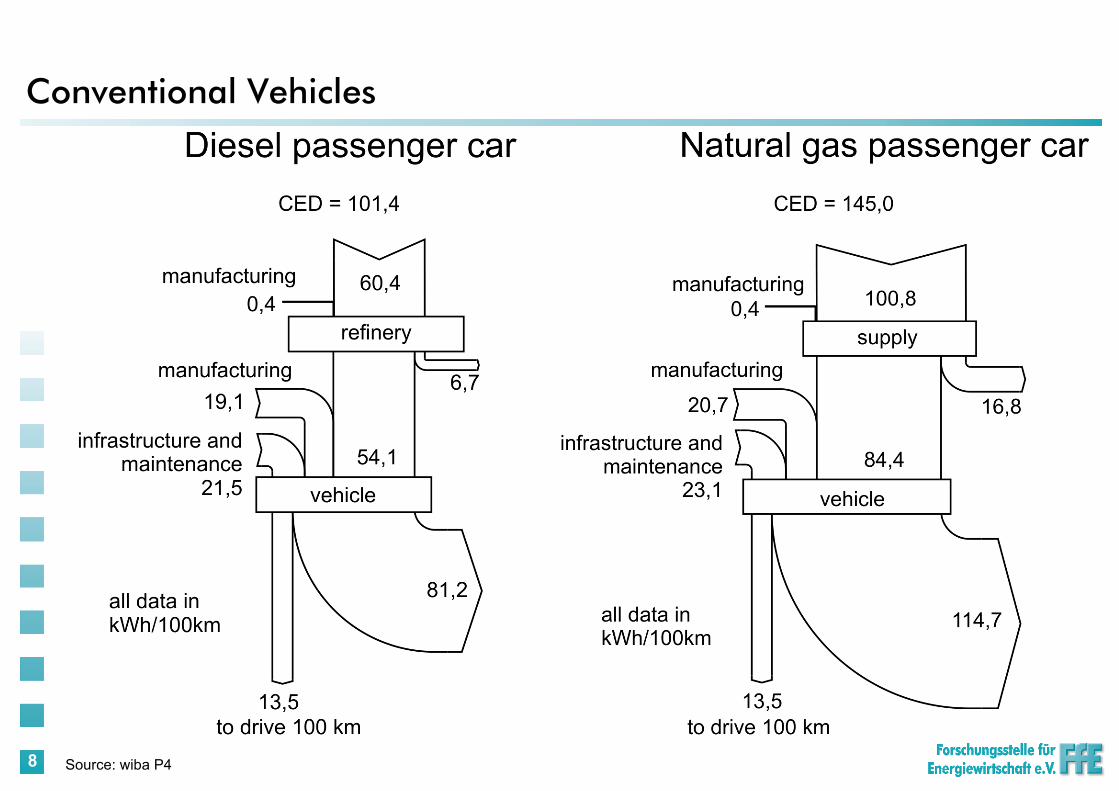
Conventional Vehicles
Source: wiba P4

9
Electric Vehicles
Source: wiba P4

10
Cumulative non-regenerative Energy Demand of considered Drive Technologies
0
20
40
60
80
100
120
140
160
CNRED inkWh/100 km
manufacturing utilisation
Otto engineOtto engine
Gasoline Natural gas
(CNG)
Liquefiedgas
(LPG)
Diesel RMEwithby-
products
ElectricityGermany-
Mix
LH2from
naturalgas
LH2 fromwind power
0
20
40
60
80
100
120
140
160Diesel engineDiesel engine EVEV FCVFCV
11
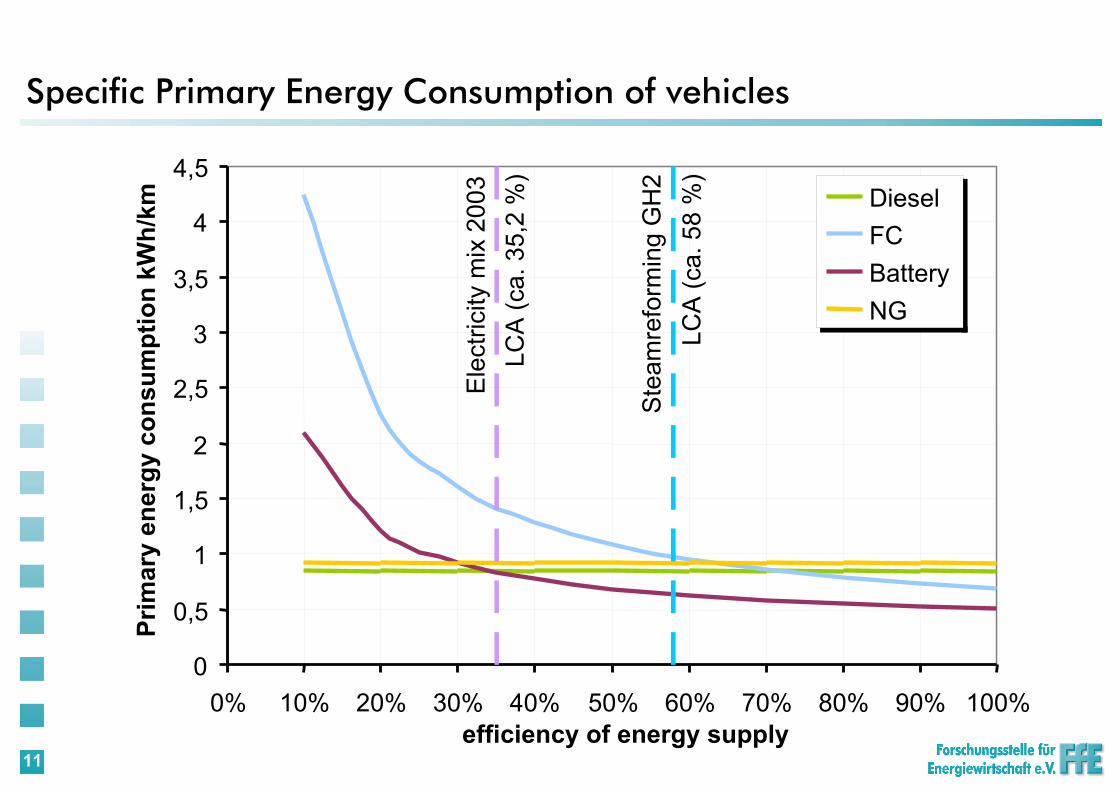
Specific Primary Energy Consumption of vehicles
0
0,5
1
1,5
2
2,5
3
3,5
4
4,5
0% 10% 20% 30% 40% 50% 60% 70% 80% 90% 100%efficiency of energy supply
Prim
ary
ener
gy c
onsu
mpt
ion
kWh/
km DieselFCBatteryNG
Ele
ctric
ity m
ix 2
003
LCA
(ca.
35,
2 %
)
Ste
amre
form
ing
GH
2LC
A (c
a. 5
8 %
)

12
Summary and Conclusion
H2-FC-vehicles have a similar efficiency as natural gas or diesel-fuelled cars provided an overall efficiency of hydrogen supply of about 65 to 70 %.
Electric cars supplied with batteries are more efficient than diesel driven cars provided an overall efficiency for the electricity supply chain of 35 %.
Both technologies (H2- and electric-cars) have their advantages:
Emission free at the site of use (central sequestration of CO2),
Diversification of primary energy carriers for transportation,
Storage of electricity produced by fluctuating energy sources,
Ability to meet future challenges for the energy economy,
New fields of business for high-tech companies.

13
Thank you very much for your attention!
Prof. Dr.-Ing. U. WagnerDipl.-Ing. M. BeerDipl.-Volksw. J. Habermann
Research Institute for Energy EconomyAm Blütenanger 7180995 München
Please visit us at: www.ffe.dewww.wiba.de