Embed Size (px)
Citation preview

LIFE COURSE CENTRE WORKING PAPER SERIES
Rewarding Commitment to Attend School: A Field Study with
Indigenous Australian High School Students
Azhar Hussain Potia
Institute of Social Science Research,
The University of Queensland
Juliana Silva-Goncalves
School of Economics,
University of Sydney
Benno Torgler
School of Economics,
Queensland University of Technology
Uwe Dulleck
School of Economics,
Queensland University of Technology
No. 2019–27
December 2019

NON-TECHNICAL SUMMARY
There is clear evidence of a significant gap in education achievement between Indigenous
and non-Indigenous Australians, with the Australian Government introducing its ‘Closing
the Gap’ policy in 2008 partly to address inequality in education. As part of the policy,
various incentive-based programs were devised to improve educational outcomes,
including school attendance, academic grades and classroom behaviour, among
Indigenous students. In line with this policy agenda, the Former Origin Greats (FOGS)
introduced a commitment-based program known as the FOGS Promise Program aiming at
decreasing the gap in school absenteeism between Indigenous and non-Indigenous
Australian students.
We assess the effectiveness of the FOGS Promise Program with a field study involving
Indigenous students from six Queensland high schools, divided into two groups. Students
in the ‘standard program’ group receive a reward only once they achieve a minimum
school attendance rate of 90 percent for the term and, subsequently, the semester.
Students in the ‘promise program’ group are given the option at the outset to commit to
put their best effort to achieve a minimum 90 percent attendance rate over the school
term and semester, and are rewarded upfront for this commitment. Rewarding an effort
commitment as opposed to rewarding actual achievement is a novel concept that we put
to the test in this study.
We find significantly fewer unexplained absences – that is, absences with no valid excuse
– among students involved in the ‘promise program’ versus students in the ‘standard
program’. At the same time, there is no difference between the ‘promise program’ and
‘standard program’ when it comes to reducing overall school absences – that is,
unexplained and explained absences combined. These results indicate that voluntary
promises for which participants are rewarded can influence behaviour, however further
research is needed to determine the most effective program design for reducing school
absenteeism overall.

ABOUT THE AUTHORS
Azhar Hussain Potia is a postdoctoral research fellow at the Institute of Social Science
Research (ISSR) and a Fellow in the Life Course Centre (LCC) at The University of
Queensland. He completed his PhD in March 2019 in behavioural and experimental
economics from Queensland University of Technology (QUT). He is an applied economist
and his research interests include Behavioural Economics and Labour Economics focused
mainly on understanding and addressing social disadvantage and real world issues. Email:
Juliana Silva-Goncalves is a postdoctoral research fellow in Economics at the University
of Sydney. Her research focuses on behavioural and experimental economics applied to
educational outcomes, discrimination and inequality. Her work has been published in the
Journal of Economic Behavior & Organization, Journal of Economic Psychology, Economic
Letters and Economic Record. Email: [email protected]
Benno Torgler is Professor of Economics at the Queensland University of Technology
(QUT). Torgler is also a former ARC Future Fellow and has been elected into the European
Academy of Sciences and Arts which consists of leading European scholars. He is a Fellow
of the CESifo Research Network that brings together leading economists from all over the
world, and a CREMA Research Fellow. He is one of most cited economists in Australia
(Google Scholar: 13,835; h-index 58) and has published more than 200 studies across
several disciplines such as economics, psychology, sociology, or biology while also
publishing in general science journals such as Nature, PNAS, and PLoS ONE. Email:
Uwe Dulleck is a professor of Economics at the Queensland University of Technology
(QUT) and Honorary Professor of Behavioural Economics at the Crawford School of Public
Policy at ANU. His publications can be found in the American Economic Review, Journal
of Economic Literature, Economic Journal, Journal of Public Economics, and
International Journal of Industrial Organization among others. His research has been
discussed in the Economic Focus of ‘The Economist’, the Sydney Morning Herald, among
others. Email: [email protected]

Acknowledgments: We acknowledge the funding provided by the Former Origin Greats (FOGS) and
the Australian Research Council (ARC) Linkage Projects grant (ARC LP150100897). We particularly
like to thank the FOGS ARTIE program directors Gene Miles and Debra Miles, manager Jess
Cuthbertson and FOGS project coordinators Hamish McLaughlin, Hayley Moloney, Drina Stewart,
Mark Lennon and Daniel Rogers for their support on the project. We are also deeply grateful to the
Queensland Department of Education, and the school principals and teachers for their support on
this study. We also acknowledge Professor Anita Lee Hong for her guidance and support on this
project. We would also like to thank the participants at the Alison Booth Fest (Canberra) and SABE
conference (Newcastle) for their valuable feedback.
DISCLAIMER: The content of this Working Paper does not necessarily reflect the views and opinions of the Life Course Centre. Responsibility for any information and views expressed in this Working
Paper lies entirely with the author(s).

ABSTRACT
We introduce a novel incentive program aimed at decreasing school absenteeism based
on the effect of voluntary promises in motivating desirable behaviour. In contrast to a
standard program, in which students receive a reward conditional on having achieved a
school attendance rate of at least 90 percent, in the promise program, they receive the
reward up front, conditional on their commitment to invest their best efforts to reach
the attendance target. We assess the effectiveness of the promise program through a
field study involving Indigenous Australian high school students, a population who tends
to have lower education achievement and socioeconomic advantage than their non-
Indigenous counterparts. We find that the promise program significantly decreased
unexplained absences compared to the standard program but that it did not influence
overall school absences. Our findings suggest that voluntary promises coupled with small
gifts are effective in influencing behaviour of disadvantaged students. At the same time,
we need further research on how to best design such programs to achieve positive effects
in reducing school absenteeism.
Keywords: school absenteeism; promises; upfront rewards; Aboriginal and Torres Strait
Islander students; Australia
Suggested citation: Potia, A. H., Silva-Goncalves, J., Torgler, B., & Dulleck, U. (2019).
‘Rewarding Commitment to Attend School: A Field Study with Indigenous Australian High
School Students’. Life Course Centre Working Paper Series, 2019-27. Institute for Social
Science Research, The University of Queensland.

1
1 Introduction
Given the importance of education for personal development and employment opportunities, many
governmental and non-governmental programs aim at encouraging high effort and achievement in
school typically targeting low achieving socioeconomically disadvantaged students. Many of these
programs use rewards that are conditional on achieving a specific goal.1 We assess the impact of
a novel encouragement program based on the positive motivational effect of making a voluntary
promise to achieve regular school attendance, coupled with a small gift awarded just after the
promise is made. In this setting, the promise is a soft commitment since there are no consequences,
beyond the potential psychological cost, from not sticking to one’s promise. Nonetheless, great
emphasis is given to the fact that making the promise means making a genuine commitment to put
one’s best efforts to reach the school attendance target. We evaluate the effect of this novel
program with a field study with Indigenous students in Australian high schools.
We compared the effectiveness of the promise program to a standard program, both introduced by
the Former of Origin Greats (henceforth FOGS), a non-governmental organisation which runs
incentive-based programs addressing low school attendance and providing encouragement and
learning support for Aboriginal and Torres Strait Islander students.2 In Australia there are large
disparities in education outcomes between Indigenous and non-Indigenous students and many
programs aim at reducing this gap (Bath and Biddle, 2011; Gray and Beresford, 2008). The gap in
education outcomes is particularly evident with regards to school attendance, with Indigenous
students’ attendance rates consistently falling short of the target established under the Federal
Government’s Closing the Gap initiative (Commonwealth of Australia, 2019). On average,
attendance rates for Indigenous students continue to remain far below the government’s 90 percent
minimum attendance benchmark throughout primary and secondary school. According to the
Closing the Gap report (2019), national school attendance rate for Indigenous students was
approximately 82 percent as compared to 93 percent for non-Indigenous students. Moreover, the
disparity between Indigenous and non-Indigenous students’ attendance rates increases throughout
1 For studies on financial incentives (see Angrist et al., 2002; Angrist and Lavy, 2009; Bettinger, 2012; Fryer, 2011);
for studies on in kind-incentives (see Baumert and Demmrich, 2001; Jalava et al., 2015; Levitt et al., 2016); and for
studies on combinations of programs and information based programs (see Angrist et al., 2009; Dulleck et al., 2016;
Rodrigues-Planas, 2012).
2 The terms Indigenous Australian and Aboriginal and Torres Strait Islander people are used interchangeably throughout
this paper.

2
the educational trajectory, contributing to the large gap in high school completion rates between
Indigenous and non-Indigenous students (65 percent versus 89 percent in 2016, respectively).3
High absenteeism rates are associated with early school dropout as well as long-term
unemployment, welfare dependency and low socioeconomic standing (Beatton et al., 2018;
Hjalmarsson, 2008; Rothman, 2001). Therefore, achieving regular school attendance of
Indigenous students and more generally, low achieving socioeconomically disadvantaged
students, is an important goal to decrease the persistent inequality in education and labour market
outcomes.
This study was conducted in six schools across three districts in South-East Queensland, with one
school in each district randomly assigned to the promise program and another to the standard
program.4 Students in schools randomly assigned to the promise program received a small reward
at the beginning of the school term conditional on promising to try their best to achieve an
attendance rate of at least 90 percent. We compare the effectiveness of the promise program in
reducing school absences to a conditional “business as usual” reward scheme - the standard
program -, in which students received the reward at the end of the school term upon having
achieved the attendance target. All other elements of the program were as similar as possible across
the two different program groups. All six schools have similar characteristics, including a low
indicator of socioeconomic advantage and a large Indigenous student enrolment. In each school,
the program began with students attending a beginning-of-term school assembly with the school
principal teacher (or senior school representative) and FOGS staff members who explained the
program goals, as well as a role model, typically an Aboriginal person encouraging students to
attend school by telling them about his or her experienced challenges while in school and the
importance of putting effort in school for success in life. In schools receiving the promise program,
students were given the option to make the promise by signing a promissory document. Great
emphasis was given to the fact that making the promise meant adhering to a commitment of
attending school regularly. Students who chose to make the promise were given a small reward
just after having made the promise. In schools receiving the standard program, students also
received an explanation of the end-of-term goal and the reward that would be given conditional on
3 According to the Closing the Gap Report (2019), year 12 or equivalent attainment rates have increased for Indigenous
students since the introduction of the Closing the Gap policy initiative in 2008. Even so, a lot more still needs to be
done to close this critical gap between Indigenous and non-Indigenous Australian students.
4 Both program initiatives were designed and implemented by FOGS. The role of the research team was focused on the
evaluation.

3
achieving the school attendance target.
We find significantly lower unexplained absence rates, i.e. absences with no valid excuse, among
students in the promise program than among those in the standard program. However, we find no
significant difference between the two programs in their impact on overall school absences. To the
best of our knowledge, this is the unique study on the effectiveness of voluntary promises coupled
with a small gift in increasing school attendance of disadvantaged students. We introduce a novel
program which, unlike most existing programs, does not offer students a reward conditional on
observed achievement, but conditional on the commitment to put one’s best efforts towards
achieving an ambitious goal. Our findings suggest that this approach was effective in influencing
the behaviour of socioeconomically disadvantaged students, by making them more likely to
provide a valid justification for missing school. Further research is needed on the design of such
programs that are successful in decreasing school absenteeism and improving education outcomes
of disadvantaged students.
The paper proceeds as follows. In Section 2 we review the economic literature on incentive-based
programs in education and the effect of promises and upfront rewards to motivate desirable
behaviour. In Section 3 we detail the study design. In Sections 4 and 5 we describe the data and
empirical method. In Section 6 we present our results and in Section 7 we discuss the implications
of our findings.
2 Background
We describe how our study relates and contributes to three fields of research, namely the design
and evaluation of incentive-based programs in education and the effectiveness of voluntary soft
commitments and upfront rewards in encouraging desirable behaviour.
2.1 Incentive-based programs in education
The literature on the design and evaluation of incentive-based programs to increase education
outcomes of low achieving, and often socioeconomically disadvantaged students, is very large
(see, for example, Angrist et al., 2002, 2006; Bettinger, 2012; Fryer, 2011; Kremer et al., 2009).
Many studies evaluate programs offering financial rewards conditional on the achievement of an
education target and provide a mixed assessment of their effectiveness (Gneezy et al., 2011). Some

4
studies find that financial incentives are effective in increasing education outcomes such as high
school graduation rates, school attendance, test scores and college enrolments (Angrist et al., 2009;
Angrist and Lavy, 2009; Cornwell et al., 2006), while other studies find no effects (Fryer, 2011;
Rodriguez-Planas, 2012). Some studies also report a positive impact from monetary incentives for
specific groups of students only. For instance, several studies report that incentives are more
effective among girls than boys. This is the case of a program in Colombia evaluated by Angrist
et al. (2002, 2006), which offered financial vouchers for private schooling to low-income
secondary school students conditional on favourable academic grades (see also Kremer at al.,
2009, for positive effects of similar financial incentives among school girls in Kenya). A study
conducted in the Netherlands by Leuven et al. (2010) shows that financial incentives for academic
achievement can have positive effects among high-ability university students, whereas they
discourage low-ability students. With a very large field experiment in the US, Levitt et al. (2016)
show that large and immediate rewards are effective, whereas small and delayed rewards are not.
Finally, there is also evidence that offering financial incentives to parents is effective in increasing
compliance with enrolment and regular school attendance of young children (Schultz, 2004).
Some programs have combined financial incentives with peer academic support and advice, such
as the Student Achievement and Retention (STAR) project in Canada. Angrist et al. (2009) find
that peer support had positive effects on academic scores of female high school students and, when
combined with financial incentives, there was a long-lasting effect on academic scores one year
after the program.
Like our study, other studies have looked at the impact of incentive-based programs beyond
financial rewards. These include mentoring and motivational talks, as well as gifts, trophies and
certificates (Jalava et al., 2015; Levitt et al., 2016). Among these is the FOGS ARTIE standard
program, which forms the benchmark in our analysis of the promise program. An earlier evaluation
of the standard program, which offered Indigenous Australian students learning support, strong
encouragement for school achievement through role models and motivational speakers, as well as
small gifts conditional on achievement, has shown that it improved behaviour and academic grades
and reduced absenteeism among girls (albeit only those from intact families) whilst also improving
standardised national assessment test scores among boys (Dulleck et al., 2016).
Our study contributes to the large literature on incentive-based programs in education by

5
investigating the impact of a novel non-monetary incentive, namely voluntary promises coupled
with a small upfront gift, among a population of low achieving and socioeconomically
disadvantaged high school students in Australia.
2.2. Voluntary promises and upfront rewards to motivate desirable behaviour
Several studies have investigated the impact of voluntary promises in encouraging desirable
behaviour (see, for example, Belot et al., 2010; Koessler et al., 2019). General findings from the
psychology and economics literature indicate that the exchange of promises creates a sense of
commitment, which can drive improved cooperation and increased trust between promise-makers
and promise-takers (Charness and Dufwenberg, 2006; Vanberg, 2008).5 There are two leading
explanations for this effect. One is based on guilt aversion whereby individuals wish to avoid the
negative feelings that come from breaking promises and/or falling short of others’ expectations
(Battigalli and Dufwenberg, 2007).6 The other explanation regards promises as contractual
agreements to which promise-makers are bound in order to maintain consistency and fulfil their
commitment (Ellingsen and Johannesson, 2004; Vanberg, 2008).
Among the studies using voluntary promises to encourage desirable behaviour, the one that is the
most related to our study is a recent experiment conducted by Himmler et al. (2019). The authors
in this study asked first-year students at a German university to make a voluntary, non-binding
promise that they would comply with the regular exam schedule (that is, they would enrol and sit
at least five exams per semester). They show that giving students the option to make this promise
led to an increase in the number of exams completed as well as actual achievement, compared to
a control group of students who were not given the option to make the promise. Our studies are
conceptually related since in both cases students do not promise to reach a given academic
performance target (such as grades). Instead they promise to adopt a specific behaviour they can
control, and that is positively associated with learning outcomes. In Himmler et al. (2019), students
could promise that they would sign up for at least five exams, and in our case, students promise
that they will come to school regularly. However, our study is conducted in a very different context
and with a very different population, as we focus on a socioeconomically disadvantaged student
5 See also (Ederer and Stremitzer, 2017; Ellingsen and Johannesson, 2004; Kerr and Kaufman-Gilliland, 1994; Ostrom
et al., 1992).
6 See also (Dufwenberg and Gneezy, 2000; Ellingsen et al., 2010).

6
population at risk of dropping out of high school.
In our study, students in the promise program receive an upfront small reward, conditional on
making the promise. This procedure was adopted for two reasons. The first reason is that the
reward would constantly remind students of their commitment throughout the school term. The
second reason is the evidence that people respond to others’ actions in a reciprocal manner (Fehr
and Gächter, 2000b).7 Therefore, it was expected that giving students a gift would motivate them
to put their best effort to achieve the attendance target they committed to. Falk (2007) demonstrates
the powerful effect of upfront rewards in a field experiment. The author tested if giving a gift
upfront to potential donors to a charitable organisation could increase donations. Some people
received standard letters with information on the charitable project (the control group), whilst
letters given to a second group were accompanied by a small gift, and a large gift was given with
each of the letters to a third group. Results show that, compared to the control (no gift) group, the
relative frequency of donations in response to the charitable appeal increased by 17 percent for the
small gift group and 75 percent for the large gift group. This result demonstrates that gifts given
upfront motivate desirable behaviour.8
3 Study design
Promise program
Aboriginal and Torres Strait Islander people are among the most socioeconomically disadvantaged
groups in Australia (Bath and Biddle, 2011; Gray and Beresford, 2008). Regarding school
attendance, 79.3% of non-Indigenous students attain a 90% attendance rate, while this is the case
for only 49% of Indigenous students (Commonwealth of Australia, 2017). To address this issue,
FOGS introduced the Achieving Results Through Indigenous Education (henceforth, ARTIE)
program consisting of in-school activities and reward schemes to improve the educational
outcomes of Indigenous students.9 The program provides support through tutoring in literacy and
numeracy and brings to the school motivational speakers to serve as role models and stress the
importance of school attendance and academic achievement. Participating schools are selected
7 See also (Berg et al., 1995; Charness, 2004; Falk, 2007; Falk and Fischbacher, 2006; Fehr and Falk, 2002; Fehr and
Gächter, 2000a).
8 See also Berry and Kanouse (1987).
9 FOGS ARTIE program is funded by the Australian federal government.

7
primarily for their large number of Indigenous students. Moreover, the index of socioeconomic
advantage across all schools in the ARTIE program is similar and well below the national average,
indicating that these schools tend to have a socioeconomically disadvantage student population.
In term 1 2015, one school in each of the three urban districts in South-East Queensland where the
ARTIE program is in place was randomly selected for a new initiative, the promise program, while
another school in each of the districts was randomly assigned to the ARTIE standard program.
Randomization occurred at the school rather than the classroom level to avoid any spillover effects
from one program to students assigned to the other program. For instance, students in the standard
program could have considered it unfair that other students in the same school received the reward
upfront (those in the promise program) and felt demotivated, which would have biased the results.
In all six schools, every student self-identifying as Indigenous was invited to a beginning-of-term
assembly at which the school principal (or senior school representative), FOGS staff, and an
invited Indigenous role model encouraged school attendance and stressed the importance of
completing high school for success in life. These are standard proceedings of the ARTIE program
and implemented every term in each school.
In the three schools selected for the promise program, FOGS staff distributed the promise
agreements (appendix Figure A.1) during the assembly meeting, and students had to decide
whether to sign the commitment to put their best effort to achieve a school attendance rate of at
least 90%. The students were told that those choosing to make the promise would have their
commitment rewarded with a gift (a watch and a jumper).10 Great emphasis was given to the fact
that the promise was voluntary but that the commitment had to be adhered to.11 Since the choice
was made during an assembly with no restrictions on student discussion, the decision was
individual but not private. To focus attention on both the goal and the commitment (which the
reward was intended to reinforce), those choosing to promise had to hand-write the word
“promise” on the agreement together with the target they were expected to achieve.12 Students
who did not attend the assembly meeting and wanted to sign the promise statement were given one
week to provide a valid reason for their absence. If able to supply one within this period, they were
10 Both gifts had a low monetary value.
11 Evidence from social psychology shows that a commitment has a stronger impact if it is made voluntarily,
expressed publicly, and/or costless to the commitment maker (Cialdini, 1987; Kiesler, 1971).
12 See Joule and Beauvois (1997) and Koessler et al. (2019).
8
informed by a FOGS staff member about the program’s targets and expectations and allowed to
participate.
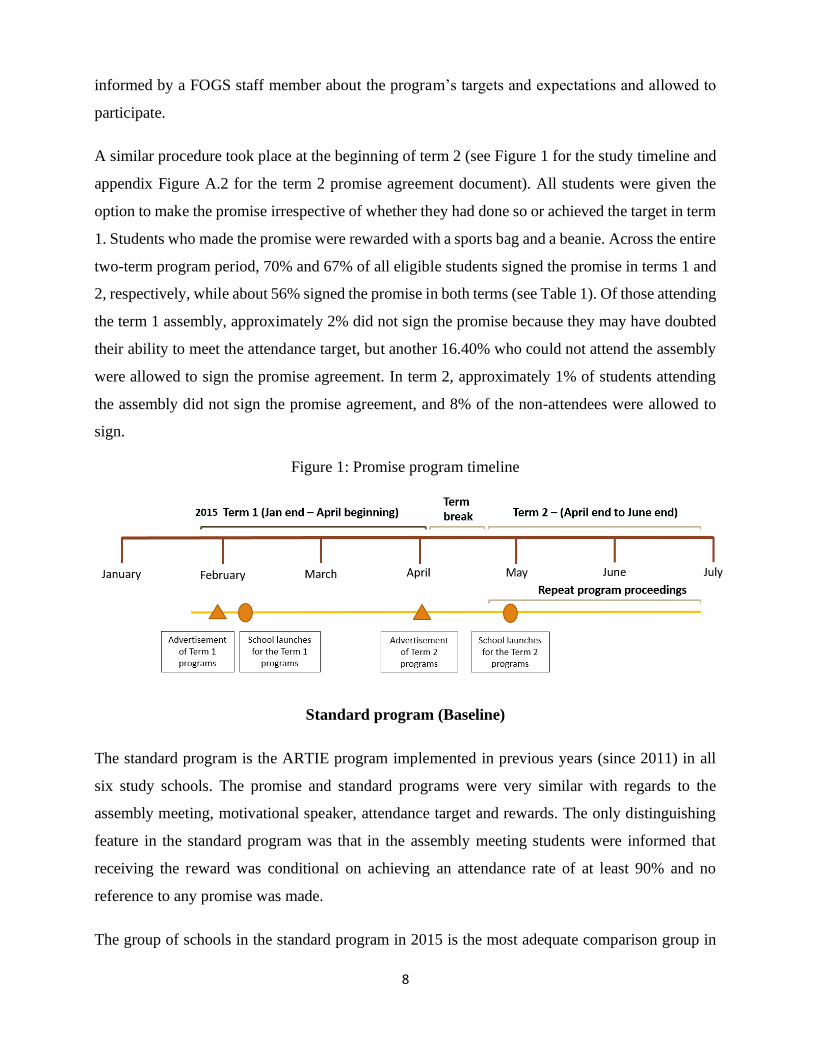
A similar procedure took place at the beginning of term 2 (see Figure 1 for the study timeline and
appendix Figure A.2 for the term 2 promise agreement document). All students were given the
option to make the promise irrespective of whether they had done so or achieved the target in term
1. Students who made the promise were rewarded with a sports bag and a beanie. Across the entire
two-term program period, 70% and 67% of all eligible students signed the promise in terms 1 and
2, respectively, while about 56% signed the promise in both terms (see Table 1). Of those attending
the term 1 assembly, approximately 2% did not sign the promise because they may have doubted
their ability to meet the attendance target, but another 16.40% who could not attend the assembly
were allowed to sign the promise agreement. In term 2, approximately 1% of students attending
the assembly did not sign the promise agreement, and 8% of the non-attendees were allowed to
sign.
Figure 1: Promise program timeline
Standard program (Baseline)
The standard program is the ARTIE program implemented in previous years (since 2011) in all
six study schools. The promise and standard programs were very similar with regards to the
assembly meeting, motivational speaker, attendance target and rewards. The only distinguishing
feature in the standard program was that in the assembly meeting students were informed that
receiving the reward was conditional on achieving an attendance rate of at least 90% and no
reference to any promise was made.
The group of schools in the standard program in 2015 is the most adequate comparison group in

9
the analysis of the effect of the promise program, since prior to 2015 all schools in the promise
program received the standard program. Moreover, all six schools are selected based on the same
criteria (number of Indigenous students enrolled, low socioeconomic advantage indicators,
geographical proximity) and exposed to all other components of the ARTIE program (including
tutoring sessions for the lowest achieving students).
Table 1: Assembly meetings attendance an and signing promise
Standard Program Promise Program
Attended assembly Attended assembly Signed promise
Term 1 61.40% 59.67% 69.70%
Term 2 54.10% 62.47% 67.13%
Both terms 43.77% 47.09% 55.71%
At least one term 71.73% 75.06% 81.12%
Note: These percentages are calculated based on the 758 students from year level 7 to 12 in 2015 who were
eligible to be part of the ARTIE program. All students who signed the promise agreement regardless of
whether they attended or did not attend the assembly meeting have been recorded in this table. A slightly
higher proportion of students signing the promise means that more students who did not attend the
assembly meeting could sign the promise.

10
4 Data
Data description
The data is provided by the Queensland Department of Education and consists of
sociodemographic details at the individual level as well as education outcomes for all students
enrolled in Year 9 to Year 12 (aged 14 to 18) at participating schools. The sociodemographic data
includes students’ gender, Indigenous status, year level, academic enrolment status (full- or part-
time), disability status and their parents’ level of education.13 Seven-hundred and fifty eight
Indigenous students across all six high schools in either the promise or the standard program were
eligible and had the possibility to participate in the ARTIE (promise or standard) program in 2015.
Among these, 275 students enrolled in the first two years of high school, Year 7 and Year 8, are
excluded from our analysis. The reasons for excluding these students relate to restrictions on data
availability in addition to an education policy change in Queensland schools, affecting our ability
to obtain data on baseline outcomes (prior to 2015) for students who in 2015 were enrolled in Year
7 and Year 8. Prior to 2015, primary school in Queensland covered Year 1 to Year 7 and high
school covered Year 8 to Year 12. Starting in 2015, Year 7 was no longer part of primary school
but became part of high school. Since we could obtain data from the Department of Education on
high school students only, even though we have data on school outcomes in 2015 for all students
enrolled in Year 7 to Year 12, we do not have data prior to 2015 for students enrolled in Year 7
and Year 8 (in 2015) as they were in primary school. Therefore, our data on education outcomes
for the baseline year (2014) covers all students who in 2015 were enrolled in Year 9 and above.
The transition from primary to high school has been found to affect education outcomes, as
students need to adjust to new teachers, higher learning autonomy, more challenging learning
content, new peers and social dynamics. These stressors are known to negatively affect education
outcomes, including school attendance, in particular among at-risk students (Benner, 2011; Eccles
et al., 1993; Goldstein et al., 2015). Therefore, even though it would have been interesting to study
the impact of the promise program among students who have just experienced the transition to
high school, any potential impact of the promise program among these students might not
generalise to high school students.
13 The education level of students’ fathers is largely missing or unknown in the data, so we exclude this variable from
our regression analysis.

11
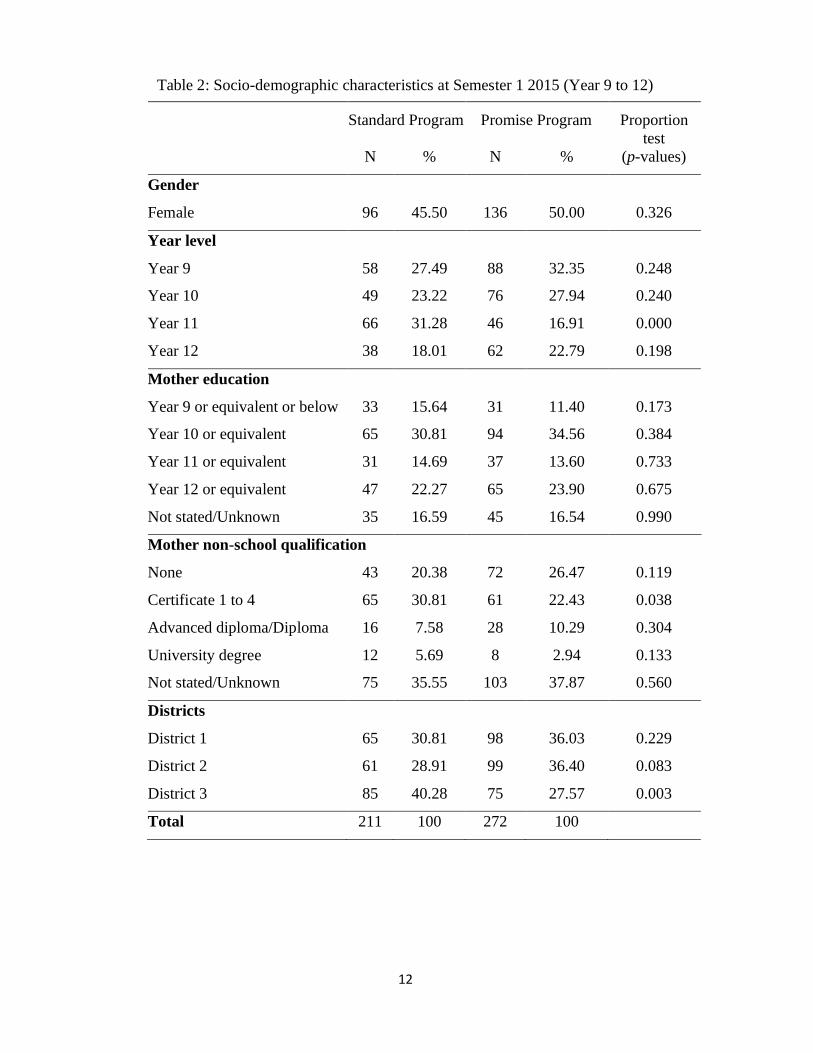
We report socio-demographic characteristics of our sample in Table 2. All students in our analysis
identify as Indigenous. Across the promise and standard program schools alike, approximately
67% of students’ mothers had accomplished 10 years of schooling at most, with slightly fewer
than a quarter reaching 12 years of school. Less than 6% and 3% of students’ mothers had
university education in the standard and promise groups respectively. These statistics are
consistent with the typically low level of educational attainment among Indigenous women in
Australia.14 In addition to the socio-demographic characteristics, we have data on daily school
absences with information on whether those absences are explained or unexplained (with the latter
defined as a student missing school for a leisure activity or for some other reason deemed
unsatisfactory by a school principal or teacher).15
14 The Year 12 or equivalent completion rate for Indigenous women between the ages of 30 and 49 in Australia is
approximately 36%; for non-Indigenous women in the same age bracket, the completion rate is approximately 74%
(ABS, 2016). Likewise, university completion rates for Indigenous and non-Indigenous women in Australia between
the ages of 30 and 49 are approximately 9% and 35% respectively. Even though the comparison of the national
statistics for Indigenous women with the data in our sample (recorded by the Department of Education) suggests that
women in our sample have lower educational attainment than the national average for Indigenous women, we note
that this could be influenced by a much larger non-response rate in the Department of Education data compared to the
national statistics.
15 The analysis considers student absence rates rather than attendance rates because schools record daily absences but
not student attendance. Although a lack of recorded absences could mean 100% attendance, this outcome could also
result from other scenarios, including withdrawal from school during the term.
12
Table 2: Socio-demographic characteristics at Semester 1 2015 (Year 9 to 12)
Standard Program Promise Program Proportion
test
N % N % (p-values)
Gender
Female 96 45.50 136 50.00 0.326
Year level
Year 9 58 27.49 88 32.35 0.248
Year 10 49 23.22 76 27.94 0.240
Year 11 66 31.28 46 16.91 0.000
Year 12 38 18.01 62 22.79 0.198
Mother education
Year 9 or equivalent or below 33 15.64 31 11.40 0.173
Year 10 or equivalent 65 30.81 94 34.56 0.384
Year 11 or equivalent 31 14.69 37 13.60 0.733
Year 12 or equivalent 47 22.27 65 23.90 0.675
Not stated/Unknown 35 16.59 45 16.54 0.990
Mother non-school qualification
None 43 20.38 72 26.47 0.119
Certificate 1 to 4 65 30.81 61 22.43 0.038
Advanced diploma/Diploma 16 7.58 28 10.29 0.304
University degree 12 5.69 8 2.94 0.133
Not stated/Unknown 75 35.55 103 37.87 0.560
Districts
District 1 65 30.81 98 36.03 0.229
District 2 61 28.91 99 36.40 0.083
District 3 85 40.28 75 27.57 0.003
Total 211 100 272 100

13
Pre-promise program differences
Baseline period (Semester 1 2014)
Even though the assignment of the promise and standard programs between the two schools in
each of the three districts was random since our study comprises a very small number of schools,
it is plausible that differences in relevant characteristics may exist between the two program groups
in the baseline period. We examine the extent to which the schools assigned to each group are
comparable prior to the introduction of the promise program, by looking at their similarity in terms
of student sociodemographic characteristics and our outcomes of interest (school absenteeism).
We report in Table 3 pre-promise program differences in student sociodemographic
characteristics, including gender, disability status and mother’s education, using a regression
analysis. Since we have a small number of clusters in our regression, the t-test-based cluster robust
standard errors may over reject the null hypothesis (Colin Cameron et al., 2008). To address the
issue of small cluster sizes, throughout the paper, we estimate the p-values using a subcluster
bootstrapping method proposed by MacKinnon and Webb (2018).16 Looking at the regression
analysis in table 3, we observe no statistically significant differences in sociodemographic
characteristics between the two program groups.
Table 3: Pre-promise program differences in demographics
Male Mother
Education
Mother
non-school
qualification
Disability
Promise
program -0.0315 -0.1117 -0.1072 0.0055
p-value [0.5546] [0.3934] [0.7958] [0.8298]
N 400 400 400 400 Note: * p>0.10; ** p>0.05; *** p>0.01; Standard errors are clustered at the
school the student attended in 2014. In square brackets we report score wild
cluster bootstrap p-values generated using boottest command in Stata
(Roodman et al., 2019) using 999 reps and webb weights (Webb, 2013).
16 In practice, this draws on the stata-based command boottest as developed by Roodman et al. (2019). Consistent with
the author’s suggestions, we do not compute the standard errors and instead only report the p-values in all our tables.

14
We test for potential pre-promise program differences, in semester 1 2014, in our outcome
variables of interest − total, explained and unexplained absences − by estimating the following
model:
𝑌𝑖𝑗 = 𝛽0 + 𝛽1𝑃𝑟𝑜𝑚𝑖𝑠𝑒𝑖𝑗 + 𝛽2𝑋𝑖𝑗 + 𝜀𝑖𝑗 (1)
where 𝑌𝑖𝑗 is the pre-treatment outcome for student 𝑖 in school 𝑗, 𝑋𝑖𝑗 are individual and school-level
control variables (gender, mother education, disability status, year level and school) and 𝜀𝑖𝑗 is the
student-level error term clustered at the school students attended in 2014. 𝑃𝑟𝑜𝑚𝑖𝑠𝑒𝑖𝑗 is an indicator
variable which takes on the value 1 if the student is in a promise program school and 0 if the
student is in a standard program school in 2015. Our sample in this analysis consists of all students
enrolled in Year 8 to Year 11 in 2014, who were part of the promise or standard program in 2015
and enrolled in Year 9 to Year 12 in that year.
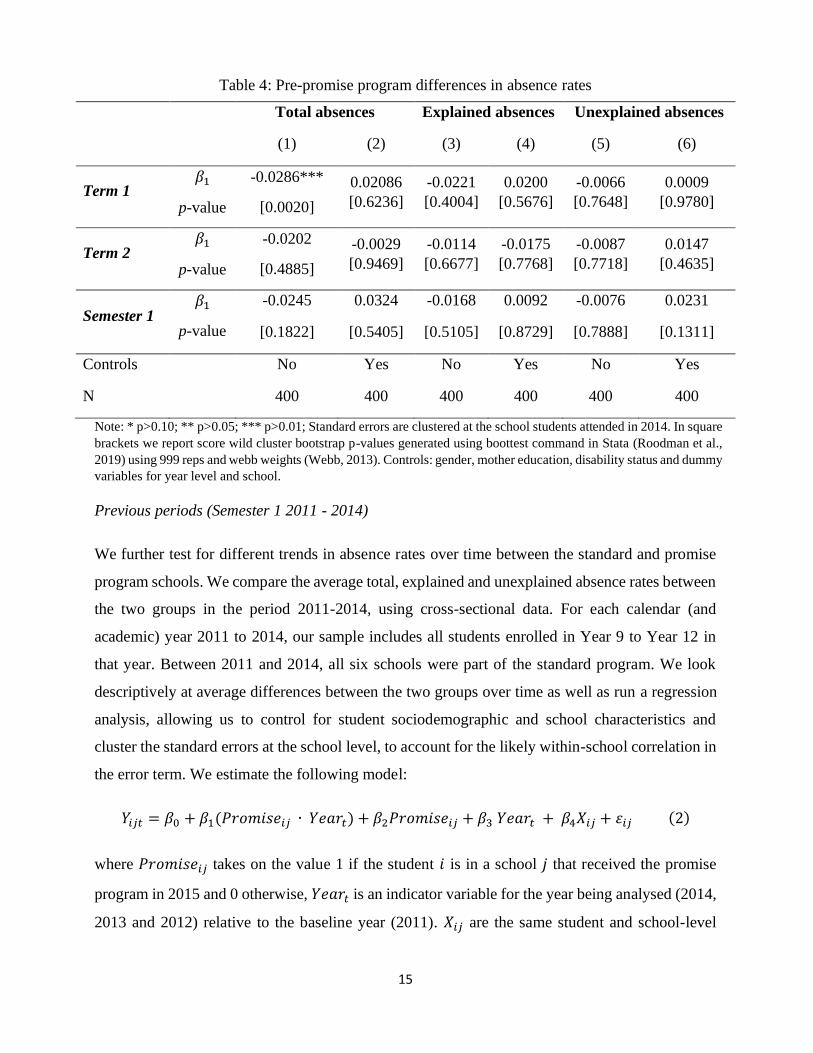
As shown in Table 4, we observe no statistically significant difference between the two program
groups in total, explained and unexplained absences across all periods when controlling for
individual socio-demographic and school characteristics (columns 2, 4, 6). However, there is a
statistically significant difference (at the 1% level) in total absence in term 1 between the two
groups when we do not control for additional variables (column 1). This difference is no longer
statistically significant at conventional levels across the entire semester 1 (which includes term 1
and term 2). We prefer the full specification (with control variables) to the basic one (without
control variables) given our relatively small sample size and number of schools.
15
Table 4: Pre-promise program differences in absence rates
Total absences Explained absences Unexplained absences
(1) (2) (3) (4) (5) (6)
Term 1 𝛽1
p-value
-0.0286***
[0.0020]
0.02086
[0.6236]
-0.0221
[0.4004]
0.0200
[0.5676]
-0.0066
[0.7648]
0.0009
[0.9780]
Term 2 𝛽1
p-value
-0.0202
[0.4885]
-0.0029
[0.9469]
-0.0114
[0.6677]
-0.0175
[0.7768]
-0.0087
[0.7718]
0.0147
[0.4635]
Semester 1 𝛽1
p-value
-0.0245
[0.1822]
0.0324
[0.5405]
-0.0168
[0.5105]
0.0092
[0.8729]
-0.0076
[0.7888]
0.0231
[0.1311]
Controls No Yes No Yes No Yes
N 400 400 400 400 400 400
Note: * p>0.10; ** p>0.05; *** p>0.01; Standard errors are clustered at the school students attended in 2014. In square
brackets we report score wild cluster bootstrap p-values generated using boottest command in Stata (Roodman et al.,
2019) using 999 reps and webb weights (Webb, 2013). Controls: gender, mother education, disability status and dummy
variables for year level and school.
Previous periods (Semester 1 2011 - 2014)
We further test for different trends in absence rates over time between the standard and promise
program schools. We compare the average total, explained and unexplained absence rates between
the two groups in the period 2011-2014, using cross-sectional data. For each calendar (and
academic) year 2011 to 2014, our sample includes all students enrolled in Year 9 to Year 12 in
that year. Between 2011 and 2014, all six schools were part of the standard program. We look
descriptively at average differences between the two groups over time as well as run a regression
analysis, allowing us to control for student sociodemographic and school characteristics and
cluster the standard errors at the school level, to account for the likely within-school correlation in
the error term. We estimate the following model:
𝑌𝑖𝑗𝑡 = 𝛽0 + 𝛽1(𝑃𝑟𝑜𝑚𝑖𝑠𝑒𝑖𝑗 ∙ 𝑌𝑒𝑎𝑟𝑡) + 𝛽2𝑃𝑟𝑜𝑚𝑖𝑠𝑒𝑖𝑗 + 𝛽3 𝑌𝑒𝑎𝑟𝑡 + 𝛽4𝑋𝑖𝑗 + 𝜀𝑖𝑗 (2)
where 𝑃𝑟𝑜𝑚𝑖𝑠𝑒𝑖𝑗 takes on the value 1 if the student 𝑖 is in a school 𝑗 that received the promise
program in 2015 and 0 otherwise, 𝑌𝑒𝑎𝑟𝑡 is an indicator variable for the year being analysed (2014,
2013 and 2012) relative to the baseline year (2011). 𝑋𝑖𝑗 are the same student and school-level
16
characteristics as in model (1). We are interested in the estimate and statistical significance of the
coefficient 𝛽1, indicating whether there are important trend differences in absenteeism between
the schools assigned to the promise program and the standard program in 2015, in the years prior
to the program (2011 to 2014).
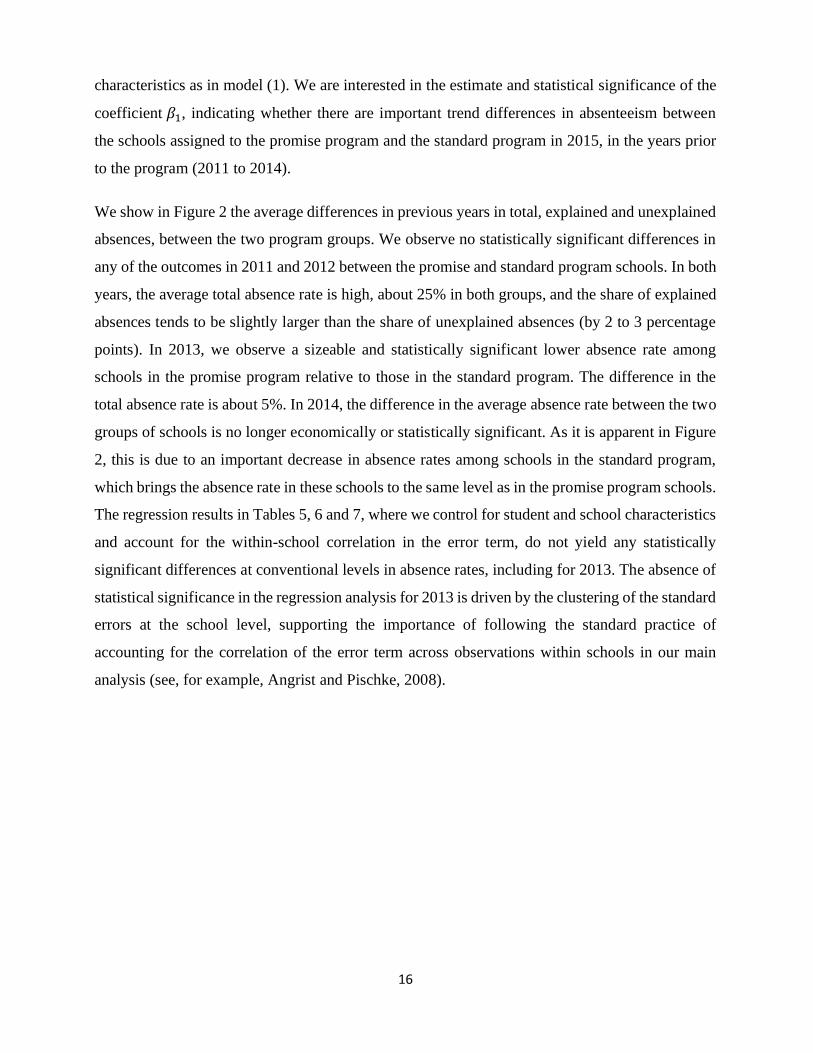
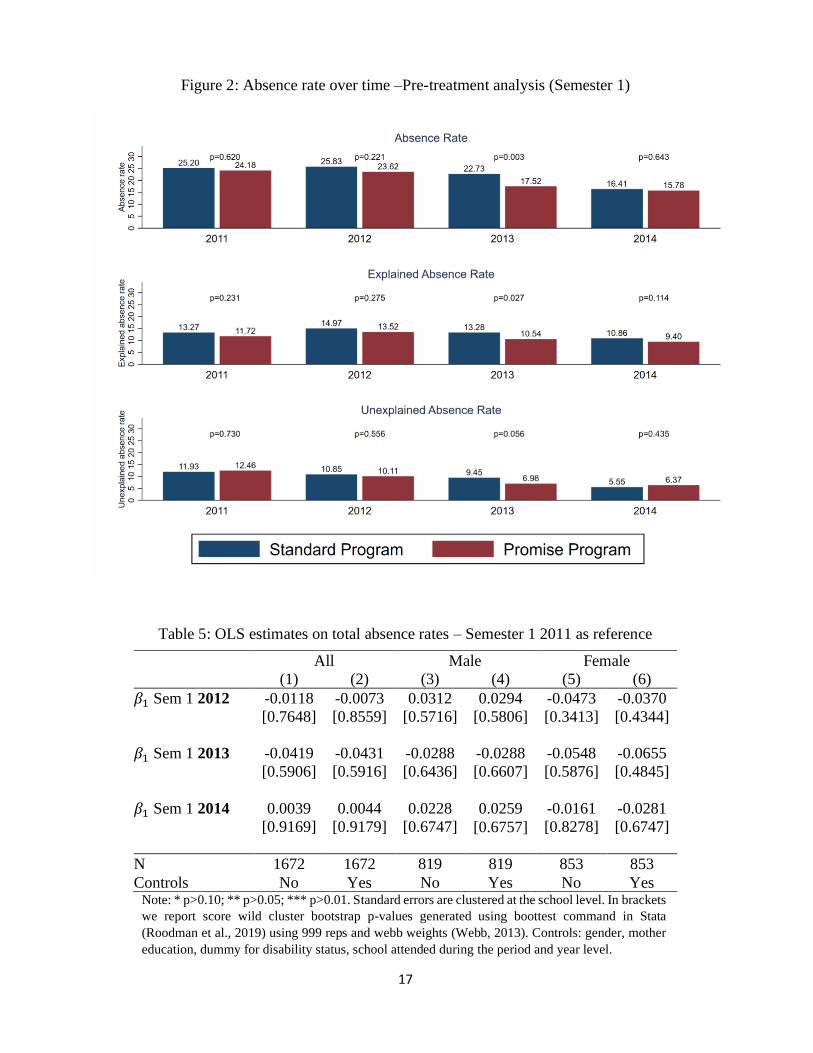
We show in Figure 2 the average differences in previous years in total, explained and unexplained
absences, between the two program groups. We observe no statistically significant differences in
any of the outcomes in 2011 and 2012 between the promise and standard program schools. In both
years, the average total absence rate is high, about 25% in both groups, and the share of explained
absences tends to be slightly larger than the share of unexplained absences (by 2 to 3 percentage
points). In 2013, we observe a sizeable and statistically significant lower absence rate among
schools in the promise program relative to those in the standard program. The difference in the
total absence rate is about 5%. In 2014, the difference in the average absence rate between the two
groups of schools is no longer economically or statistically significant. As it is apparent in Figure
2, this is due to an important decrease in absence rates among schools in the standard program,
which brings the absence rate in these schools to the same level as in the promise program schools.
The regression results in Tables 5, 6 and 7, where we control for student and school characteristics
and account for the within-school correlation in the error term, do not yield any statistically
significant differences at conventional levels in absence rates, including for 2013. The absence of
statistical significance in the regression analysis for 2013 is driven by the clustering of the standard
errors at the school level, supporting the importance of following the standard practice of
accounting for the correlation of the error term across observations within schools in our main
analysis (see, for example, Angrist and Pischke, 2008).
17
Figure 2: Absence rate over time –Pre-treatment analysis (Semester 1)
Table 5: OLS estimates on total absence rates – Semester 1 2011 as reference
All Male Female
(1) (2) (3) (4) (5) (6)
𝛽1 Sem 1 2012 -0.0118
[0.7648]
-0.0073
[0.8559]
0.0312
[0.5716]
0.0294
[0.5806]
-0.0473
[0.3413]
-0.0370
[0.4344]
𝛽1 Sem 1 2013 -0.0419
[0.5906]
-0.0431
[0.5916]
-0.0288
[0.6436]
-0.0288
[0.6607]
-0.0548
[0.5876]
-0.0655
[0.4845]
𝛽1 Sem 1 2014 0.0039
[0.9169]
0.0044
[0.9179]
0.0228
[0.6747]
0.0259
[0.6757]
-0.0161
[0.8278]
-0.0281
[0.6747]
N 1672 1672 819 819 853 853
Controls No Yes No Yes No Yes Note: * p>0.10; ** p>0.05; *** p>0.01. Standard errors are clustered at the school level. In brackets
we report score wild cluster bootstrap p-values generated using boottest command in Stata
(Roodman et al., 2019) using 999 reps and webb weights (Webb, 2013). Controls: gender, mother
education, dummy for disability status, school attended during the period and year level.

18
Table 6: OLS estimate effects on explain absence rates – Semester 1 2011 as reference
All Male Female
(1) (2) (3) (4) (5) (6)
𝛽1 Sem 1 2012 0.0009
[0.9620]
0.0085
[0.7067]
0.0140
[0.6336]
0.0260
[0.3924]
-0.0084
[0.6907]
-0.0040
[0.8378]
𝛽1 Sem 1 2013 -0.0119
[0.7908]
-0.0042
[0.9299]
-0.0229
[0.6286]
-0.0080
[0.8589]
-0.0023
[0.9479]
-0.0023
[0.9540]
𝛽1 Sem 1 2014 0.0009
[0.9850]
0.0070
[0.8539]
-0.0114
[0.7978]
0.0022
[0.9459]
0.0126
[0.7367]
0.0104
[0.8198]
N 1672 1672 819 819 853 853
Controls No Yes No Yes No Yes Note: * p>0.10; ** p>0.05; *** p>0.01. Standard errors are clustered at the school level. In brackets
we report score wild cluster bootstrap p-values generated using boottest command in Stata (Roodman
et al., 2019) using 999 reps and webb weights (Webb,2013). Controls: gender, mother education,
dummy for disability status, school attended during the period and year level.
Table 7: OLS estimate effects on unexplained absence rates – Semester 1 2011 as reference
All Male Female
(1) (2) (3) (4) (5) (6)
𝛽1 Sem 1 2012 -0.0127
[0.5746]
-0.0158
[0.5686]
0.0172
[0.5035]
0.0034
[0.9059]
-0.0389
[0.2292]
-0.0331
[0.3153]
𝛽1 Sem 1 2013 -0.0300
[0.4434]
-0.0389
[0.4064]
-0.0059
[0.7788]
-0.0208
[0.5646]
-0.0526
[0.3664]
-0.0631
[0.3353]
𝛽1 Sem 1 2014 0.0029
[0.9449]
-0.0026
[0.9479]
0.0342
[0.4464] 0.0238
[0.6537]
-0.0287
[0.5666]
-0.0385
[0.3944]
N 1672 1672 819 819 853 853
Controls No Yes No Yes No Yes Note: * p>0.10; ** p>0.05; *** p>0.01. Standard errors are clustered at the school level. In brackets
we report score wild cluster bootstrap p-values generated using boottest command in Stata (Roodman
et al., 2019) using 999 reps and webb weights (Webb,2013). Controls: gender, mother education,
dummy for disability status, school attended during the period and year level.

19
5 Empirical Strategy
We estimate the effect of the promise program using a differences-in-differences strategy in which
the standard program is the baseline condition. This strategy allows us to control for existing pre-
treatment differences between the two program groups and provides us with an estimate of the
differences in the progression of school attendance between the two groups before and after the
introduction of the promise program. This is a standard method allowing to control for potential
confounding factors in the absence of perfect randomization and/or small sample sizes (Duflo et
al., 2007).
All Indigenous students in the six schools were eligible to take part in the ARTIE program.
Therefore, we include in the analysis all students who identify as Indigenous, regardless of whether
they actually participated in the program (i.e. attended the assembly and were aware of the
program) and estimate the intention-to-treat (ITT) effect as follows:
𝑌𝑖𝑗𝑡 = 𝛽0 + 𝛽1𝑃𝑟𝑜𝑚𝑖𝑠𝑒𝑗 + 𝛽2𝑌𝑒𝑎𝑟2015 + 𝛽3(𝑃𝑟𝑜𝑚𝑖𝑠𝑒𝑗 ∙ 𝑌𝑒𝑎𝑟2015) + 𝛽4𝑋𝑖𝑗𝑡 + 𝜀𝑖𝑗 (3)
where, 𝑌𝑖𝑗𝑡 denotes the outcome variable of interest for student 𝑖 – total, explained and unexplained
absence rates - in school 𝑗 at time 𝑡, 𝑃𝑟𝑜𝑚𝑖𝑠𝑒𝑗 is an indicator variable which takes on the value 1
if the student is in a promise program school and 0 if he or she is in a standard program school.
𝑌𝑒𝑎𝑟2015 is a time indicator variable which takes on the value 1 if the outcome is observed in
semester 1 2015 (i.e. post promise program) and 0 if observed in semester 1 2014 (pre promise
program). 𝑋𝑖𝑗𝑡 are individual level control variables and school dummies and 𝜀𝑖𝑗 is the random
error clustered by the school students attended in 2015.
The coefficient 𝛽3 is the intention-to-treat effect of the promise program in absence rates relative
to the standard program. The differences-in-differences estimation method assumes that in the
absence of the treatment, the average outcomes for the treated and control groups would have
followed parallel trends over time (Abadie, 2005). In our setting, if the promise program would
not have been introduced, all schools would have continued with the standard program. Therefore,
in the absence of other factors heterogeneously affecting school attendance in a subsample of one
or more schools which are part of our analysis, we would expect no differences in the trends
between the two groups of schools in 2015. This assumption is reasonable since we observe no
systematic differences in absenteeism between the two program groups several periods prior to

20
2015, when following the standard practice of accounting for the within-school non-independence
of the error term across observations (see discussion in Section 4.2).
6 Results
Descriptive results
We start by presenting descriptive statistics on total, explained and unexplained absence rates in
Figures 3 and 4 for terms 1 and 2, respectively, before and upon the introduction of the promise
program. Looking at total absences, students in the standard program group had higher absence
rates than those in the promise program group in 2014 by about 3 and 2 percentage points in term
1 and term 2, respectively. This difference is statistically significant at conventional levels for term
1 only, which is consistent with our regression results discussed in section 4.2 (Table 4). Moreover,
this gap is larger for explained absences than unexplained absences. None of the pre-promise
program in term 2 are statistically significant at conventional levels.
In 2015 with the introduction of the promise program, we observe sizeable and statistically
significant differences between the two groups in student absences in both term 1 and term 2, with
lower absence rates in the promise program schools compared to the standard program schools.
The gap is about 3 percentage points in both terms 1 and 2, and statistically significant at the 5%
level. This effect is mainly driven by a substantial gap in unexplained absence rates between the
two groups, both in term 1 and 2. Unexplained absence rates in 2015 are almost twice as large in
the standard program schools than in the promise program schools (p-values<0.01). This is
observed among boys and girls. Moreover, we observe an increase in unexplained absences in
2015 among schools in the standard program which largely contributes to the observed gap.
The descriptive analysis suggests that the promise program may have decreased overall school
absenteeism, by reducing unexplained school absences, or rather counteracting the increasing
trend in unexplained absences among promise program schools. However, this analysis does not
account for differences in absenteeism prior to the promise program between the two groups,
heterogeneity across schools as well as relevant student characteristics. All these factors are
potentially very relevant given our modest sample size. Our regression results reported in the next
section, allow for a more rigorous analysis of the impact of the promise program on attendance,
by taking account these potential confounding factors.

21
Figure 3: Total, explained and unexplained absence rates (Semester 1 term 1)

22
Figure 4: Total, explained and unexplained absence rates (Semester 1 term 2)
23
Regression results
We present the regression results on the effect of the promise program on total, explained
and unexplained school absences in Tables 8, 9 and 10, respectively. We systematically
report the results for the entire sample, and for boys and girls separately. We also always
report the estimates of the effect of the promise program obtained with the basic
specification (without any student or school-level control variables) (in columns 1, 3 and 5)
and with our preferred specification, which includes additional control variables (in
columns 2, 4 and 6).
Our results show that the promise program did not differently affect total school absences
compared to the standard program. Even though the estimates are consistently negative
(with the exception of term 1 for female students), they are very small and never statistically
significant at conventional levels (see Table 8). The estimates of the promise program effect
on the explained absence rate, despite not being statistically significant at conventional
levels, are consistently positive and large across the two specifications and samples (see
Table 9). This is suggestive of the fact that the promise program may have increased
explained absences relative to the standard program. With regards to unexplained absences,
we find a systematically negative effect of the promise program compared to the standard
program, which is statistically significant at conventional levels in most specifications (see
Table 10). Our estimates indicate that the promise program decreased unexplained absences
by about 3 percentage points, in both terms 1 and 2, an effect which is statistically
significant at the 10 percent level, when looking at the effect by term, and at the 5 percent
level, when looking at the overall semester effect. The coefficient estimates are slightly
larger and more statistically significant among male students compared to female students,
but this gender difference is not statistically significant at conventional levels (p-value>0.1
in all cases).
Overall, our results suggest that the promise program was not more effective than the
standard program in decreasing school absences. However, it decreased unexplained
absence rates. Our descriptive and regression analyses suggest that the promise program
was effective in curbing an increasing trend in unexplained absences. Therefore, even
though the promise program did not influence actual school absenteeism, it seems to have

24
influenced students’ behaviour by increasing the likelihood they would provide a valid
justification for their absence.
Table 8: OLS estimate effects on total absence rate
All Male Female
(1) (2) (3) (4) (5) (6)
Term 1 𝛽3
p-value
-0.0026
[0.9119]
-0.0081
[0.7628]
-0.0157
[0.6907]
-0.0222
[0.5586]
0.0118
[0.6096]
0.0062
[0.7658]
Term 2 𝛽3
p-value
-0.0099
[0.7487]
-0.0173
[0.5576]
-0.0064
[0.8348]
-0.0099
[0.7427]
-0.0136
[0.5506]
-0.0279
[0.3243]
Semester
1
𝛽3
p-value
-0.0062
[0.6740]
-0.0138
[0.3694]
-0.0108
[0.5820]
-0.0166
[0.4810]
-0.0010
[0.9580]
-0.0118
[0.5880]
Controls
N
No Yes No Yes No Yes
861 861 460 460 401 401
Note: * p>0.10; ** p>0.05; *** p>0.01. Standard errors are clustered at the school level. In brackets we report score wild
cluster bootstrap p-values generated using boottest command in Stata (Roodman et al., 2019) using 999 reps and webb weights
(Webb, 2013). Controls: gender, mother education, dummy for disability status, whether student attended a different school
during the baseline, student attended at least one term launch, school attended during the treatment period and year level.

25
Table 9: OLS estimate effects on explained absence rate
All Male Female
(1) (2) (3) (4) (5) (6)
Term 1 𝛽3
p-value
0.0259
[0.2152]
0.0225
[0.3373]
0.0200
[0.5656]
0.0150
[0.6877]
0.0328
[0.1241]
0.0305
[0.1051]
Term 2 𝛽3
p-value
0.0163
[0.4024]
0.0106
[0.5255]
0.0292
[0.3123]
0.0252
[0.4444]
0.0018
[0.8298]
-0.0067
[0.6557]
Semester
1
𝛽3
p-value
0.0212
[0.1632]
0.0162
[0.3504]
0.0248
[0.3504]
0.0200
[0.5375]
0.0173
[0.1111]
0.0114
[0.3303]
Controls
N
No Yes No Yes No Yes
861 861 460 460 401 401
Note: * p>0.10; ** p>0.05; *** p>0.01. Standard errors are clustered at the school level. In brackets we report score wild
cluster bootstrap p-values generated using boottest command in Stata (Roodman et al., 2019) using 999 reps and webb weights
(Webb, 2013). Controls: gender, mother education, dummy for disability status, whether student attended a different school
during the baseline, student attended at least one term launch, school attended during the treatment period and year level.
Table 10: OLS estimate effects on unexplained absence rate
All Male Female
(1) (2) (3) (4) (5) (6)
Term 1 𝛽3
p-value
-0.0285*
(0.0881)
-0.0311*
(0.0871)
-0.0357
(0.1512)
-0.0372*
(0.0831)
-0.0210
(0.2032)
-0.0242
(0.1471)
Term 2 𝛽3
p-value
-0.0262
(0.1071)
-0.0280*
(0.0971)
-0.0356
(0.2202)
-0.0353
(0.1932)
-0.0154
(0.2613)
-0.0212*
(0.0871)
Semester 1 𝛽3
p-value
-0.0274**
(0.0110)
-0.0300**
(0. 0120)
-0.0356***
(0.0050)
-0.0365***
(0.0080)
-0.0184
(0.1662)
-0.0232*
(0.0881)
Controls
N
No Yes No Yes No Yes
861 861 460 460 401 401
Note: * p>0.10; ** p>0.05; *** p>0.01. Standard errors are clustered at the school level. In brackets we report score wild cluster
bootstrap p-values generated using boottest command in Stata (Roodman et al., 2019) using 999 reps and webb weights (Webb,
2013). Controls: gender, mother education, dummy for disability status, whether student attended a different school during the
baseline, student attended at least one term launch, school attended during the treatment period and year level.

26
7 Discussion
In 2009 the Australian government announced its goal of reducing the school attendance
gap between Indigenous and non-Indigenous Australian students.17 In this paper, we
assessed the effectiveness of a novel program based on the positive motivational effect of
voluntary promises coupled with a small gift aiming at encouraging regular school
attendance among Indigenous students. The promise program differs from existing in-
school incentive-based programs which typically reward students upon observing their
achievement. In the promise program students are rewarded up front for future effort,
following their commitment to put their best efforts to achieve an ambitious goal.
We studied the effectiveness of the promise program with a differences-in-differences
design, by comparing student absenteeism between schools randomly assigned to the
promise program and schools assigned to a standard program, rewarding students upon
their achievement of the school attendance target. Our intention-to-treat results indicate
that the promise program was successful in decreasing unexplained absences among
Indigenous students by 3% on average. However, we find no differential effect between
the promise and the standard program on total absences.
Our findings indicate that students in the promise program were more likely to provide a
valid justification for their absence but did not miss less days of school than those in the
standard program. Students in the promise program, who made a promise and received
the reward up front, may have felt more compelled to provide a justification for their
absence than those in the standard program who only received the reward at the end of the
school term conditional on having achieved the attendance target. Our findings are
encouraging since we show that the promise program was effective in influencing the
behaviour of disadvantaged students, by motivating them to provide a justification for
being absent from school, even though it did not influence actual school attendance. Our
findings also suggest a substantial scope for further research to study how to effectively
design programs using promises and upfront rewards to improve school attendance and
education achievement of disadvantaged students.
17 For more information on the ‘Closing the Gap’ policy initiative please see:
http://closingthegap.pmc.gov.au/.

27
We believe our study is the first to introduce promises coupled with upfront rewards as a
potential effective tool to improve education outcomes of low achieving
socioeconomically disadvantaged students. Therefore, we make an important contribution
to the literature on the design of programs aiming at decreasing inequality in education.
Our study also contributes to the emerging literature on the behavioural consequences of
voluntary promises outside of the laboratory (see, for example, Himmler et al., 2019). At
the same time, we acknowledge several weaknesses in our study and believe that trying
to address them offers interesting avenues for future research. The first caveat is our
modest sample size which may raise concerns with respect to the general validity of our
findings. To try to minimise this concern, the random assignment of the programs was
stratified by district, so that in each district, one school received the standard program and
the other the promise program. The student population in schools in the same district share
the same sociodemographic characteristics, which makes them more similar than schools
in different districts. Another weakness in the generalisability of our results is that the
programs are conducted by an organisation which follows unique proceedings (for
instance, having a role model and a strong positive emphasis on being part of the
Indigenous community). We tried to address the potential for confounding factors
associated with the ARTIE program to influence our results by assessing the promise
program using as a comparison group the schools in the standard program, which is
administered by the same organisation and subject to the same general proceedings. This
allows us to measure the impact of the promise combined with the upfront reward, net of
other relevant aspects which are part of the ARTIE program.
Finally, it is also important for future research to investigate the effect of related programs
targeting different student populations from Indigenous Australian students. Moreover,
following the more recent trend in the literature evaluating the impact of programs in
education, future research should aim at studying the sustained effects of programs based
on promises, beyond their immediate effects.
28
8 References
Abadie, A. (2005). Semiparametric difference-in-differences estimators. Review of
Economic Studies, 72(1), 1–19.
Angrist, J., Bettinger, E., Bloom, E., King, E., & Kremer, M. (2002). Vouchers for private
schooling in Colombia: Evidence from a randomized natural experiment. American
Economic Review, 92(5), 1535–1558.
Angrist, J., Bettinger, E., & Kremer, M. (2006). Long-term educational consequences of
secondary school vouchers: Evidence from administrative records in Colombia. American
Economic Review, 96(3), 847–862.
Angrist, J. D., & Pischke, J. S. (2008). Mostly harmless econometrics: An empiricist's
companion. Princeton university press.
Angrist, J., Lang, D., & Oreopoulos, P. (2009). Incentives and services for college
achievement: Evidence from a randomized trial. American Economic Journal: Applied
Economics, 1(1), 136–163.
Angrist, J., & Lavy, V. (2009). The effects of high stakes high school achievement awards:
Evidence from a randomized trial. American Economic Review, 99(4), 1384–1414.
Australian Bureau of Statistics (2016). 2016 Census – Employment, Income and
Education, TableBuilder. Findings based on use of ABS TableBuilder data.
Bath, M. J., & Biddle, N. (2011). Measures of indigenous wellbeing and their determinants
across the lifecourse. CAEPR Lecture Series, The Australian National University.
Battigalli, P., & Dufwenberg, M. (2007). Guilt in games. American Economic Review,
97(2), 170–176.
Baumert, J., & Demmrich, A. (2001). Test motivation in the assessment of student skills:
The effects of incentives on motivation and performance. European Journal of Psychology
of Education, 16(3), 441–462.
Beatton, T., Kidd, M. P., Machin, S., & Sarkar, D. (2018). Larrikin youth: Crime and
29
Queensland’s Earning or Learning reform. Labour Economics, 52, 149–159.
Belot, M., Bhaskar, V., & van de Ven, J. (2010). Promises and cooperation: Evidence
from a TV game show. Journal of Economic Behavior & Organization, 73(3), 396–405.
Benner, A. D. (2011). The Transition to High School: Current Knowledge, Future
Directions. Educational Psychology Review, 23, 299–328.
Berg, J., Dickhaut, J., & McCabe, K. (1995). Trust, reciprocity, and social history. Games
and Economic Behavior, 10(1), 122–142.
Berry, S. H., & Kanouse, D. E. (1987). Physician response to a mailed survey: An
experiment in timing of payment. Public Opinion Quarterly, 51(1), 102–114.
Bettinger, E. P. (2012). Paying to learn: The effect of financial incentives on elementary
school test scores. Review of Economics and Statistics, 94(3), 686–698.
Charness, G. (2004). Attribution and reciprocity in an experimental labor market. Journal
of Labor Economics, 22(3), 665–688.
Charness, G., & Dufwenberg, M. (2006). Promises and partnership. Econometrica, 74(6),
1579–1601.
Cialdini, R. B. (1987). Influence (Vol. 3). A. Michel Port Harcourt.
Colin Cameron, A., Gelbach, J. B., & Miller, D. L. (2008). Bootstrap-based improvements
for inference with clustered errors. Review of Economics and Statistics, 90(3), 414–427.
Commonwealth of Australia. (2017). Closing the Gap Prime Minister’s Report 2017. In
Department of the Prime Minister and Cabinet.
Commonwealth of Australia. (2019). Closing the Gap Prime Minister’s Report 2019. In
Department of the Prime Minister and Cabinet.
Cornwell, C., Mustard, D. B., & Sridhar, D. J. (2006). The Enrollment Effects of Merit-
Based Financial Aid: Evidence from Georgia’s HOPE Program. Journal of Labor
Economics, 24(4), 761–786.

30
Duflo, E., Glennerster, R., and Kremer, M. (2007). Using randomization in development
economics research: A toolkit. In Schultz, T. P. and Strauss, J. A., editors, Handbook of
Development Economics, 4, 3895–3962.
Dufwenberg, M., & Gneezy, U. (2000). Measuring beliefs in an experimental lost wallet
game. Games and Economic Behavior, 30(2), 163–182.
Dulleck, U., Silva-Goncalves, J., & Torgler, B. (2016). Evaluation of an incentive
program on educational achievement of Indigenous students. Economic Record, 92(298),
329–347.
Eccles, J. S., Midgley, C., Wigfield, A., Buchanan, C. M., Reuman, D., Flanagan, C., &
Mac Iver, D. (1993). Development During Adolescence: The Impact of Stage-
Environment Fit on Young Adolescents’ Experiences in Schools and in Families.
American Psychologist, 48(2), 90–101.
Ederer, F., & Stremitzer, A. (2017). Promises and expectations. Games and Economic
Behavior, 106, 161–178.
Ellingsen, T., & Johannesson, M. (2004). Promises, Threats and Fairness. Economic
Journal, 114(495), 397–420.
Ellingsen, T., Johannesson, M., Tjøtta, S., & Torsvik, G. (2010). Testing guilt aversion.
Games and Economic Behavior, 68(1), 95–107.
Falk, A. (2007). Gift exchange in the field. Econometrica, 75(5), 1501–1511.
Falk, A., & Fischbacher, U. (2006). A theory of reciprocity. Games and Economic
Behavior, 54(2), 293–315.
Fehr, E., & Falk, A. (2002). Psychological foundations of incentives. European Economic
Review, 46(4), 687–724.
Fehr, E., & Gächter, S. (2000a). Cooperation and punishment in public goods
experiments. The American Economic Review, 90(4), 980–994.
Fehr, E., & Gächter, S. (2000b). Fairness and retaliation: The economics of reciprocity.

31
Journal of Economic Perspectives, 14(3), 159–181.
Fryer, R. G. (2011). Financial Incentives and Student Achievement: Evidence from
Randomized Trials. Quarterly Journal of Economics, 126(4), 1755–1798.
Gneezy, U., Meier, S., & Rey-Biel, P. (2011). When and why incentives (don’t) work to
modify behavior. The Journal of Economic Perspectives, 25(4), 191–209.
Goldstein, S. E., Boxer, P., & Rudolph, E. (2015). Middle School Transition Stress: Links
with Academic Performance, Motivation, and School Experiences. Contemporary School
Psychology, 19(1), 21–29.
Gray, J., & Beresford, Q. (2008). A “formidable challenge”: Australia’s quest for equity
in indigenous education. Australian Journal of Education, 52(2), 197–223.
Himmler, O., Jäckle, R., & Weinschenk, P. (2019). Soft commitments, reminders, and
academic performance. American Economic Journal: Applied Economics, 11(2), 114–
142.
Hjalmarsson, R. (2008). Criminal justice involvement and high school completion.
Journal of Urban Economics, 63(2), 613–630.
Jalava, N., Joensen, J. S., & Pellas, E. (2015). Grades and rank: Impacts of non-financial
incentives on test performance. Journal of Economic Behavior & Organization, 115, 161–
196.
Joule, R.-V., & Beauvois, J.-L. (1997). Cognitive dissonance theory: a radical view.
European Review of Social Psychology, 8(1), 1–32.
Kerr, N. L., & Kaufman-Gilliland, C. M. (1994). Communication, commitment, and
cooperation in social dilemma. Journal of Personality and Social Psychology, 66(3), 513–
529.
Kiesler, C. A. (1971). The psychology of commitment: Experiments linking behavior to
belief. Academic Press.
Koessler, A. K., Torgler, B., Feld, L. P., & Frey, B. S. (2019). Commitment to pay taxes:

32
Results from field and laboratory experiments. European Economic Review, 115, 78–98.
Kremer, M., Miguel, E., & Thornton, R. (2009). Incentives to learn. Review of Economics
and Statistics, 91(3), 437–456.
Leuven, E., Oosterbeek, H., & Klaauw, B. (2010). The Effect of Financial Rewards on
Student’s Achievement: Evidence From a Randomized Experiment. Journal of the
European Economic Association, 8(6), 1243–1265.
Levitt, S. D., List, J. A., Neckermann, S., & Sadoff, S. (2016). The behavioralist goes to
school: Leveraging behavioral economics to improve educational performance. American
Economic Journal: Economic Policy, 8(4), 183–219.
MacKinnon, J. G., & Webb, M. D. (2018). The wild bootstrap for few (treated) clusters.
Econometrics Journal, 21(2), 114–135.
Ostrom, E., Walker, J., & Gardner, R. (1992). Covenants with and without a sword: Self-
governance is possible. American Political Science Review, 86(2), 404–417.
Rodriguez-Planas, N. (2012). Longer-term impacts of mentoring, educational services,
and learning incentives: Evidence from a randomized trial in the United States. American
Economic Journal: Applied Economics, 4(4), 121–139.
Roodman, D., MacKinnon, J. G., Nielsen, M. Ø., & Webb, M. D. (2019). Fast and wild:
Bootstrap inference in Stata using boottest. Stata Journal, 19(1), 4–60.
Rothman, S. (2001). School absence and student background factors: A multilevel
analysis. International Education Journal, 2(1), 59–68.
Schultz, T. P. (2004). School subsidies for the poor: evaluating the Mexican Progresa
poverty program. Journal of Development Economics, 74(1), 199–250.
Vanberg, C. (2008). Why do people keep their promises? an experimental test of two
explanations. Econometrica, 76(6), 1467–1480.
Webb, M. D. (2013). Reworking Wild Bootstrap Based Inference for Clustered Errors.
Queen’s Economics Department Working Paper, 1315, 1–23.

33
9 Appendix
Figure
Figure A.1: Promise document (Term 1)

34
Figure A.2: Average absence rate