Embed Size (px)
Citation preview
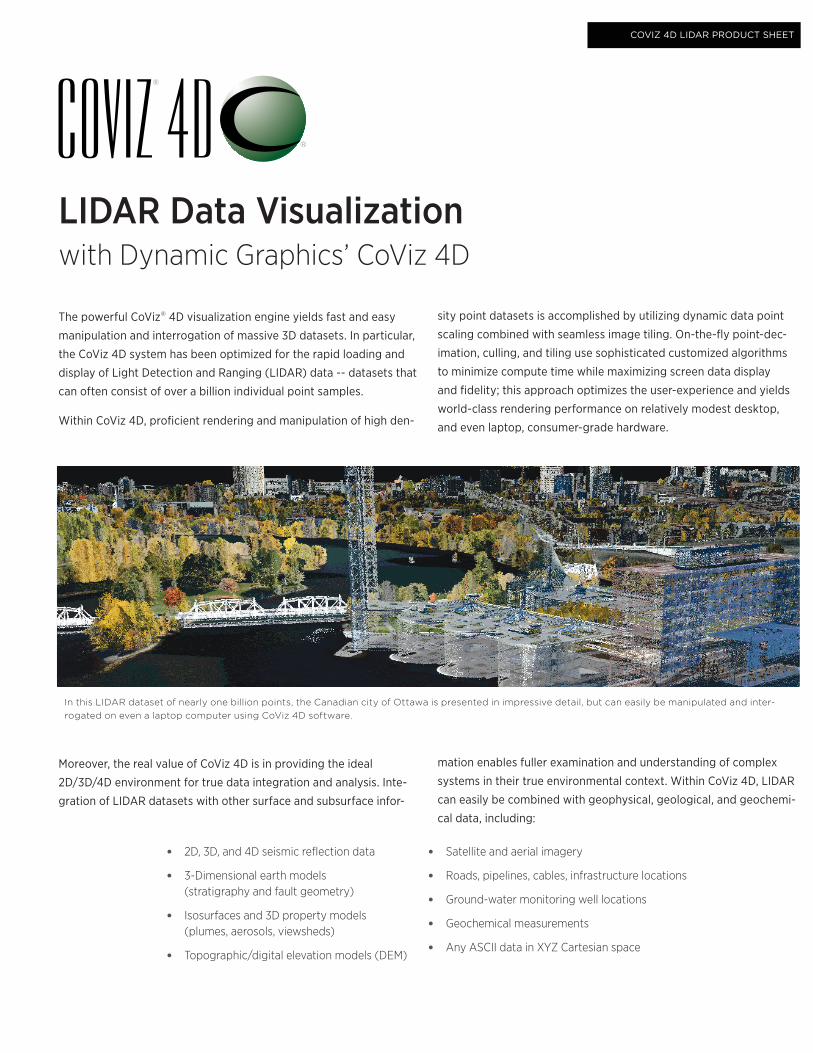
In this LIDAR dataset of nearly one billion points, the Canadian city of Ottawa is presented in impressive detail, but can easily be manipulated and inter-rogated on even a laptop computer using CoViz 4D software.
LIDAR Data Visualization
The powerful CoViz® 4D visualization engine yields fast and easy
manipulation and interrogation of massive 3D datasets. In particular,
the CoViz 4D system has been optimized for the rapid loading and
display of Light Detection and Ranging (LIDAR) data -- datasets that
can often consist of over a billion individual point samples.
Within CoViz 4D, profi cient rendering and manipulation of high den-
sity point datasets is accomplished by utilizing dynamic data point
scaling combined with seamless image tiling. On-the-fl y point-dec-
imation, culling, and tiling use sophisticated customized algorithms
to minimize compute time while maximizing screen data display
and fi delity; this approach optimizes the user-experience and yields
world-class rendering performance on relatively modest desktop,
and even laptop, consumer-grade hardware.
• 2D, 3D, and 4D seismic refl ection data
• 3-Dimensional earth models(stratigraphy and fault geometry)
• Isosurfaces and 3D property models(plumes, aerosols, viewsheds)
• Topographic/digital elevation models (DEM)
Moreover, the real value of CoViz 4D is in providing the ideal
2D/3D/4D environment for true data integration and analysis. Inte-
gration of LIDAR datasets with other surface and subsurface infor-
mation enables fuller examination and understanding of complex
systems in their true environmental context. Within CoViz 4D, LIDAR
can easily be combined with geophysical, geological, and geochemi-
cal data, including:
• Satellite and aerial imagery
• Roads, pipelines, cables, infrastructure locations
• Ground-water monitoring well locations
• Geochemical measurements
• Any ASCII data in XYZ Cartesian space
with Dynamic Graphics’ CoViz 4D
COVIZ 4D LIDAR PRODUCT SHEET
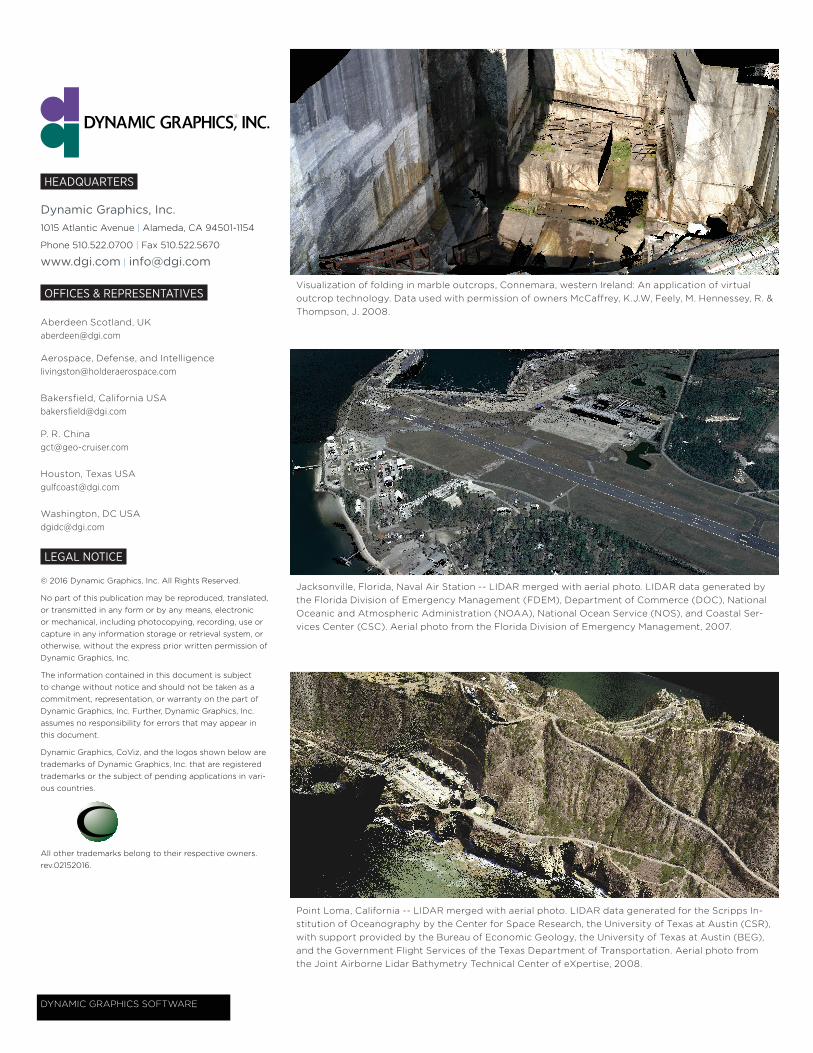
Visualization of folding in marble outcrops, Connemara, western Ireland: An application of virtual outcrop technology. Data used with permission of owners McCaff rey, K.J.W, Feely, M. Hennessey, R. & Thompson, J. 2008.
Jacksonville, Florida, Naval Air Station -- LIDAR merged with aerial photo. LIDAR data generated by the Florida Division of Emergency Management (FDEM), Department of Commerce (DOC), National Oceanic and Atmospheric Administration (NOAA), National Ocean Service (NOS), and Coastal Ser-vices Center (CSC). Aerial photo from the Florida Division of Emergency Management, 2007.
Point Loma, California -- LIDAR merged with aerial photo. LIDAR data generated for the Scripps In-stitution of Oceanography by the Center for Space Research, the University of Texas at Austin (CSR), with support provided by the Bureau of Economic Geology, the University of Texas at Austin (BEG), and the Government Flight Services of the Texas Department of Transportation. Aerial photo from the Joint Airborne Lidar Bathymetry Technical Center of eXpertise, 2008.
HEADQUARTERS
Dynamic Graphics, Inc.1015 Atlantic Avenue | Alameda, CA 94501-1154
Phone 510.522.0700 | Fax 510.522.5670
www.dgi.com | [email protected]
OFFICES & REPRESENTATIVES
Aberdeen Scotland, [email protected]
Aerospace, Defense, and [email protected]
Bakersfield, California USAbakersfi [email protected]
P. R. [email protected]
Houston, Texas [email protected]
Washington, DC [email protected]
LEGAL NOTICE
© 2016 Dynamic Graphics, Inc. All Rights Reserved.
No part of this publication may be reproduced, translated, or transmitted in any form or by any means, electronic or mechanical, including photocopying, recording, use or capture in any information storage or retrieval system, or otherwise, without the express prior written permission of Dynamic Graphics, Inc.
The information contained in this document is subject to change without notice and should not be taken as a commitment, representation, or warranty on the part of Dynamic Graphics, Inc. Further, Dynamic Graphics, Inc. assumes no responsibility for errors that may appear in this document.
Dynamic Graphics, CoViz, and the logos shown below are trademarks of Dynamic Graphics, Inc. that are registered trademarks or the subject of pending applications in vari-ous countries.
All other trademarks belong to their respective owners. rev.02152016.
DYNAMIC GRAPHICS SOFTWARE


![Cloud-Based LiDAR Visualization and ExploitationLD09]-paper.pdf · Cloud-Based LiDAR Visualization and Exploitation ... afforded by cloud computing will expand the industry's ability](https://img.pdfslide.us/doc/110x75/5ab302c07f8b9a284c8df910/cloud-based-lidar-visualization-and-ld09-paperpdfcloud-based-lidar-visualization.jpg)