Embed Size (px)
Citation preview

LiDAR Data and Point Clouds: From Scan to Plan with AutoCAD® Civil 3D® Matt Miyamoto, P.E. - Ideate, Inc. CI3853 This class is designed for the surveyor, engineer, or planner who is interested in finding out more about the ground-mounted LiDAR scanning process. Technological advancements have made it much easier for engineers and developers to gain access to LiDAR data. In this class, we will take a look at some of the tools for LiDAR data collection and discuss how ground-mounted data is collected, processed, and incorporated into an AutoCAD® Civil 3D® drawing via AutoCAD® Civil 3D® point cloud functionality. Additionally, we will see how an AutoCAD® Civil 3D® point cloud object can be used to create an existing ground model for use in design or further evaluated in Autodesk® Navisworks®. If you are interested in LiDAR technology, or have been working with LiDAR data and wonder where your data comes from, this class is for you.
LearningObjectivesAt the end of this class, you will be able to:
Describe how ground-mounted LiDAR data is collected and processed Import a dataset and create a point cloud in AutoCAD® Civil 3D® Create an AutoCAD® Civil 3D® surface object from point cloud data Explain what processed point cloud data looks like in Autodesk® Navisworks® Manage
AbouttheSpeaker
Matt is an application specialist in the Ideate, Inc., Seattle office. He has a BS in mechanical engineering and is a licensed civil engineer. Prior to joining Ideate, Matt worked as a civil design engineer, using AutoCAD® Civil 3D® on a variety of projects including site development, roadway improvements and infrastructure design. With 10 years of experience in the civil engineering industry, he uses his real-world knowledge to provide training, consulting, technical support developing implementation strategies for organizations using Autodesk® products.
[email protected] Twitter: MattM_PE

LiDAR and Point Clouds: From Scan to Plan with AutoCAD® Civil 3D®
2
BackgroundCheck:LiDARData,PointClouds&Autodesk®Applications
LIDARDATA
1. Lidar data is collected by Laser Scanners and may also be referred to as Laser Scan data. 2. There are many different types of scanners and scanning methods available. The most common
these days are Aerial, Ground Mounted and Vehicular Mounted scanners. 3. Lidar data files are generally raw data (lots and lots of numbers) that need to be processed or
indexed before they will appear in a drawing file 4. Lidar Data files are usually very large and contain thousands, or millions, or billions of points. 5. There are many different file formats for Lidar Data. Not all formats work with all programs. 6. Lidar data files often include more data than necessary. Different applications may be used to
filter the data before importing it into your file. Some applications from scanner manufacturers may include the ability to process raw data and output a Point Cloud file.
7. Scanners on today's market now include color sensitive lasers. Color information can be included with a scan to assign a color to each point, creating a more realistic appearance for the point cloud.
POINTCLOUDS
1. Point Clouds are created from Lidar and other point data sources. They are typically in database format for Autodesk® applications.
2. Common Point Cloud files used in Autodesk® products are .PCG and .ISD (ISD files also have associated PRMD and IATI files).
3. The latest releases of AutoCAD® Civil 3D® will process raw Lidar data, allowing users to create a point cloud database (ISD format). AutoCAD® based products, Autodesk ® Revit® products and Autodesk® Navisworks® can also process some forms of raw data.
4. AutoCAD® Civil 3D® runs a different processing engine from the rest of the Autodesk® applications. Results will vary depending on what application is used, even if the same source file is used.
5. AutoCAD® Civil 3D® Surfaces can be created from Point Cloud data 6. Point Clouds may appear in color if the scanned data included color readings.
The following page provides file types and processing capabilities for a range of Autodesk® applications.

LiDAR and Point Clouds: From Scan to Plan with AutoCAD® Civil 3D®
3

LiDAR and Point Clouds: From Scan to Plan with AutoCAD® Civil 3D®
4
3DLaserScanWorkflowGround modeling begins with data collection. Ground mounted LiDAR scanners provide a combination of traditional survey and the latest advancements in laser scanning technology. There are many different laser scanners out on the market today, and users should evaluate all options to determine the best scanner that meets their needs.
Scanners are available for a wide range of uses, from scanning existing ground features to building interiors and even people. This section provides an overview of the workflow process for collecting data used to create an AutoCAD® Civil 3D® point cloud and surface.
ProjectResearch(PriortoScanning)Prior to scanning, background information should be collected for the site. Locations of existing known points should be documented for use as Control Point and Backsight locations during scanning. If known points are to be used as Control Points, the point locations providing the best overall angles for scanning should be identified.
ScannerSetupLocations of existing points should be used for equipment setup with ties to known points. Heights should also be measured for calibration and triangulation purposes. The use of existing point information allows measurements to be triangulated relative to those points in the coordinate system. If research does not include any known points for equipment setup, a local coordinate system with user defined points can also be used.
Backsight located on Known Point
The ability to input control points of a local coordinate system now provides users the ability to combine traditional survey methods with the latest technological advancements in laser scanning.
ScanningTo achieve the best results, scanning should be done from multiple angles. Much like a photograph, a scanner can only collect information from objects within a direct line of sight. To get full 3D information for a point cloud, scans must be done from multiple vantage points, allowing for true 3D data collection.

LiDAR and Point Clouds: From Scan to Plan with AutoCAD® Civil 3D®
5
Research should be done prior to scanning to ensure the best angles are used for the major features in each project.
Once the scanner is set up and calibrated, the handheld control device is used to determine the angular range of the scan and the limits of the scan boundary. An interactive display allows users to see the area within range of the scanner and provide an outline of the area of interest. This allows a much more fine-tuned approach to data collection.
Handheld Controller – Trimble Access
DataProcessingAfter scanning is complete, data must be processed for use with additional applications like AutoCAD® Civil 3D®. Trimble® Realworks® Survey allows users to quickly analyze and filter data collected using Trimble 3D laser scanners. With this application, users are able to quickly visualize, explore, and modify point cloud data collected with Trimble® scanners. Trimble® Realworks® also includes the ability to create 3D geometry, profiles and sections from point cloud information, automatically generating CAD compliant linework in the output files.
Data cleanup prior to importing into AutoCAD® Civil 3D® should be completed with this or similar software from your scanner’s manufacturer. During this process, residual points, error shots, and points collected from interfering objects should be removed from the dataset. Output files should then be generated from modified point cloud data for incorporation into AutoCAD® Civil 3D® drawings. If this process is not intended to be completed in-house, the scope of work should included specifics on file format and data to be included in the output file. Output files can be generated in compatible AutoCAD®, Microstation®, Text, Microsoft® Word® and Excel® formats.
OutputUsers intending to create AutoCAD® Civil 3D® Point Cloud objects from scanned data should request files in text format. Data properties should also be specified or provided, ensuring that information is accurately translated from the collector to the drawing file. Small discrepancies in translated data can lead to large errors in drawing files. AutoCAD® Civil 3D® comes with a wide range of predefined file formats in the out-of-box template and also provides users with the ability to create additional custom file formats.

LiDAR and Point Clouds: From Scan to Plan with AutoCAD® Civil 3D®
6
Pre‐ImportDataReductionwithMicrosoft®Access®The exported data file from Trimble® Realworks® normally still contains much more information than necessary for creating a ground model in AutoCAD® Civil 3D®. In order to reduce the dataset further, Microsoft® Access® provides a quick and easy way to import data, delete unwanted values and re-export to ASCII text format.
WhyNotUseaSpreadsheet?As of the 2007 release of Microsoft® Office®, the maximum number of rows in a Microsoft® Excel® spreadsheet is 1,048,567 (source: www.office.microsoft.com; Excel Specifications and Limits). Lidar datasets often include upwards of one million data points, exceeding the row limitation of a spreadsheet.
CreatingtheDatabaseThe first step in data reduction using Microsoft® Access® is to populate the database with the information from your Lidar dataset. Once the database has been populated, unwanted data columns can be deleted through the right-click options.
StepsforCreatingaNewMicrosoft®Access®Database&ImportingLidarData
To begin, launch Microsoft® Access® and select the new Blank Database option.
Provide a name and location for the database (.ACCDB) to be saved and click Create.
The new blank database is created, and includes a blank table named Table1 by default.
Right-click on the table tab and Close the default table.

LiDAR and Point Clouds: From Scan to Plan with AutoCAD® Civil 3D®
7
We can now import our dataset. This process creates a new table automatically, so the default table closed in the previous step is not needed.
In the External Data tab Import panel of the Ribbon, click on Text File
*.TXT, .CSV, .TAB, and .ASC files all fall under the Text File category
Browse to the location of the text file and select it for import.
Select the Import the source data into a new table in the current database option and click OK
In the Import Text Wizard, verify the data format as delimited or fixed width, and specify the delimiter type (Tab, Semicolon, Comma, Space or Other). The option for specifying the first row content also appears on the second page of the wizard.
The Advanced… button that appears in the bottom left corner of the Import Text Wizard can be used to modify the Field Names according to what they represent. Click OK to return to the Import Text Wizard after renaming the fields.

LiDAR and Point Clouds: From Scan to Plan with AutoCAD® Civil 3D®
8
Verify the information on the remaining pages of the Import Text Wizard, and be sure to select the No Primary Key option at the top of page 4.
This prevents an unnecessary column from being created in the new table.
Provide a name for the new table on the last page of the Import Text Wizard and click Finish.
*Table named Full Dataset
CreatingDataSub‐Sets
Now that a table has been created using the Full Dataset, we can create additional tables containing filtered subsets.
Start by creating a copy of the Full Dataset Table using the right-click Copy and Paste options in the Navigator Pane.
*New table named NEZ Only

LiDAR and Point Clouds: From Scan to Plan with AutoCAD® Civil 3D®
9
The copied table contains all values from the original dataset.
Right-click and delete the columns containing Intensity, RGB and Normal values.
The remaining columns should include only N, E and Z.
Only N, E and Z values are required to create a Point Cloud and Surface in AutoCAD® Civil 3D®.
*Additional copies of the original table can be created and filtered for more subsets. Some styles in AutoCAD® Civil 3D® are able to use Intensity and RGB values as well.
ExportingDatatoASCIIFormat(.TXT)
After the data has been filtered in the new tables, the subsets can be exported to ASCII .TXT format for Point Cloud creation in AutoCAD® Civil 3D®.
Right-click on the NEZ Only table to use the Export Text File option
The Export dialog box and Export Text Wizard provides a series of dialog boxes for specifying name, property and format information for the exported data.

LiDAR and Point Clouds: From Scan to Plan with AutoCAD® Civil 3D®
10
Specify the File Name, location for the file, and Export Options and click OK.
*When exporting from a table, no additional export options are necessary.
On the first page of the Export Text Wizard, verify the format of the dataset. The choice of character delimited or fixed width fields is available here.
Select Delimited for comma delimited output or Fixed Width for space or tab delimited output and click Next
On the second page of the wizard, specify the delimiter and click Next
On the final page of the wizard, verify the export location and click Finish
LiDAR and Point Clouds: From Scan to Plan with AutoCAD® Civil 3D®
11
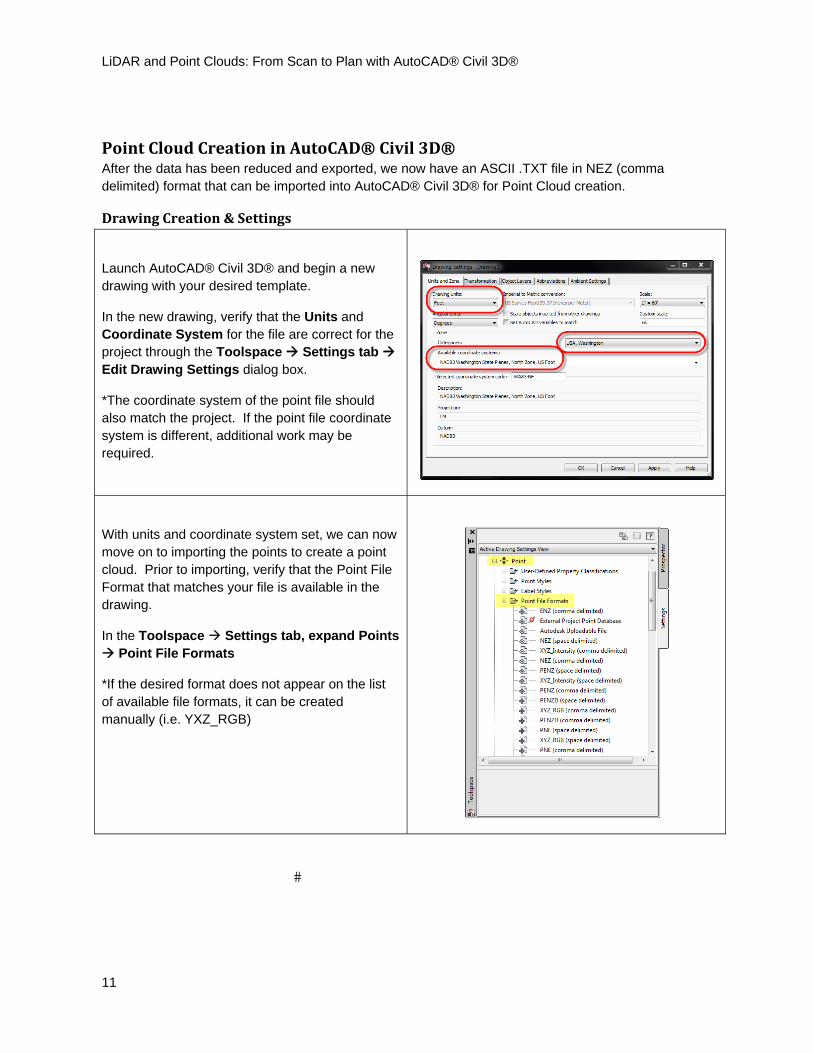
PointCloudCreationinAutoCAD®Civil3D®After the data has been reduced and exported, we now have an ASCII .TXT file in NEZ (comma delimited) format that can be imported into AutoCAD® Civil 3D® for Point Cloud creation.
DrawingCreation&Settings
Launch AutoCAD® Civil 3D® and begin a new drawing with your desired template.
In the new drawing, verify that the Units and Coordinate System for the file are correct for the project through the Toolspace Settings tab Edit Drawing Settings dialog box.
*The coordinate system of the point file should also match the project. If the point file coordinate system is different, additional work may be required.
With units and coordinate system set, we can now move on to importing the points to create a point cloud. Prior to importing, verify that the Point File Format that matches your file is available in the drawing.
In the Toolspace Settings tab, expand Points Point File Formats
*If the desired format does not appear on the list of available file formats, it can be created manually (i.e. YXZ_RGB)
�

LiDAR and Point Clouds: From Scan to Plan with AutoCAD® Civil 3D®
12
DefiningaCustomFileFormat(YXZ_RGBcommadelimited)The process for creating a custom file format is similar to that of creating a new style. Users can copy and modify an existing file format, or start from scratch through the right click options.
To start from scratch, right-click on the Point File Formats heading and select New.
Select the User Point File option and click OK
In the Format Name section of the Point File Format dialog box, specify a Name for the new file format (YXZ_RGB)
In the Default File Extension section, specify the extension to be associated with the new point file format.
If the desired extension is not available in the drop down list, it can be typed in manually (i.e. .ASC)
In the Format Options section, specify Columnated or Delimited By and define the character for delimitation.

LiDAR and Point Clouds: From Scan to Plan with AutoCAD® Civil 3D®
13
The bottom of the Point File Format dialog box contains columns that must be defined by the user. Click on the column headings to specify the values that each column will represent.
In this case Y (Northing), X (Easting), Z (Point Elevation), RGB-R, RGB-G, and RGB -B
Columns can be dragged/dropped to rearrange their order if an existing format is being modified.
With all options specified, click OK to complete the process.
The new user defined Point File Format appears on the list in the Settings tab of the Toolspace.
CreatinganAutoCAD®Civil3D®PointCloudWith a drawing file created, units and coordinate system set, and point file format defined, we are now ready to create a Point Cloud object in the drawing.
There are multiple methods for accessing the Create Point Cloud command within AutoCAD® Civil 3D®. In this example, the Ribbon Interface will be referenced.
Click on the Create Point Cloud command from the extended section of the Home tab Create Ground Data panel in the Ribbon.
The Create Point Cloud Wizard walks users through the process on three separate pages.
The Information page allows users to specify a Name for the Point Cloud and select a Point Cloud Object Style.

LiDAR and Point Clouds: From Scan to Plan with AutoCAD® Civil 3D®
14
The Source Data page allows users to specify the File Format and select the Point File containing the source data.
Also included on this page are options to use an existing point cloud database (.ISD) format. AutoCAD® also supports .PCG files that can be loaded through the POINTCLOUD command Attach option.
The Summary page allows users to verify Information and Source Data specifications of the previous pages. Click Finish on this page to complete the process.
*Point Clouds are processed in the background, allowing users to continue working in the drawing while the data is being processed and indexed. Time of processing varies depending on the amount of data in the source files.

LiDAR and Point Clouds: From Scan to Plan with AutoCAD® Civil 3D®
15
The sample point file contains approximately 1.75 Million points and took just under 3 minutes for processing on a 2.5 GHZ Dual Core CPU running 64-bit Windows 7 with 8 GB of RAM.
CreatingAutoCAD®Civil3D®SurfacesfromPointCloudDataIn the 2010 release of AutoCAD® Civil 3d®, the ability to generate Point Cloud objects was included in a Subscription Advantage Pack. In the 2011 and 2012 releases, the feature is included in the application and enhanced with the capability of adding point cloud points to a surface model.
With the new enhanced Point Cloud functionality, users can now review point cloud data prior to generating a surface model, and can also specify boundaries for the extent of the data to be included. Once the surface is created, standard surface editing commands also apply.
To begin, left-click on the Point Cloud object to activate the contextual ribbon tab.

LiDAR and Point Clouds: From Scan to Plan with AutoCAD® Civil 3D®
16
Use the Point Density bar to adjust the percentage of Point Cloud points displayed. The density value also controls the percentage of points used when adding points to a Surface model.
*Processing is faster if users manually type in the value instead of using the slider bar.
The Add Points to Surface option is also on the Point Cloud Tools panel.
After specifying the Point Density, click on Add Points to Surface to begin the process.
The Add Points to Surface Wizard provides three pages to complete the Surface Creation process using Point Cloud data.
On the Surface Options page, specify the Name and Style for the surface or select an existing surface to add the point cloud data to.
The Region Options page allows users to specify a selection set within the point cloud data to use. Point Cloud Extents, Window, Window Polygon and existing Objects can all be used for the selection set.

LiDAR and Point Clouds: From Scan to Plan with AutoCAD® Civil 3D®
17
The Summary page provides users with detailed information produced by the specified options. It also shows the number of points within the region specified on the previous page.
Higher point density values should produce a larger number of points, even when using the same region.
Click Finish to complete the process after verifying the information on the Summary page.
With the process complete, a Surface should now be visible in the drawing file. As always, be sure to evaluate the resulting surface model, and apply edits or modify the data as needed to produce the most accurate model possible.
Standard surface edits like Delete Point and Delete Line can be used on the resulting surface. The Simplify Surface edit is also very useful, allowing users to control the percentage of points and impact on the surface model to determine if points are filtered.
NOTE: Points must be displayed in both Plan and Model View Directions in order to use the Delete Point surface edit through a 3D perspective view.

LiDAR and Point Clouds: From Scan to Plan with AutoCAD® Civil 3D®
18
PointClouds&Autodesk®Navisworks®The release of Autodesk’s® Infrastructure Design Suites has made access to additional products like Autodesk® Navisworks® Simulate and Manage much more affordable.
Autodesk® Navisworks® Simulate comes with the Standard and Premium packages of the Infrastructure Design Suite, and the Ultimate package comes with Autodesk® Navisworks® Manage.
The Autodesk® Navisworks® family of products supports a variety of Point Cloud file formats that can be opened directly by the application. For a list of compatible file formats, see page 3.
Along with opening point files directly, Autodesk® Navisworks® can also open drawing (.DWG) files containing Point Cloud objects. Additionally, point cloud objects can be used with the Clash Detection features available in Autodesk® Navisworks® Manage.
OpeningaPointFileinAutodesk®Navisworks®ManageOpening a Point File in Autodesk® Navisworks® Manage follows the same process as opening a standard file with the application. From the Open dialog box, select the proper file type, and navigate your way to the location of the file. Select the file and click Open to complete the process.
Once the file is loaded, the Point Cloud appears in the drawing window.
One drawback to using this method is that the predefined file formats in Autodesk® Navisworks® Manage are set for ENZ or XYZ format with the X (Easting) values represented by the first value in the row. In many cases, files are exported in NEZ or YXZ format with the Y (Northing) value first. This produces an inaccurate point cloud with X and Y values switched.
*The Point Cloud processing engine in Autodesk® Navisworks® is different from that of AutoCAD® Civil 3D®. Because of this, the resulting Point Clouds may be different in the respective programs even if the same source file is used. For consistent results across both applications, it is best to process the point cloud in AutoCAD® Civil 3D® first, save it as a drawing file, then open the drawing file in Autodesk® Navisworks® instead of the point file.
ResolvingtheXY/YXIssueA simple solution can be applied to fix this issue. When working with the Microsoft® Access® database, the column order can be rearranged prior to exporting using drag and drop methods. Changing the order of the Northing and Easting columns in the database prior to exporting will produce a file with values in the default order found in Autodesk ® Navisworks®.
Alternately, processing the point cloud in AutoCAD® Civil 3D® and saving it as a drawing (.DWG) file then opening the .DWG in Autodesk® Navisworks® bypasses the issue all together. The Point Cloud object from the AutoCAD® Civil 3D® drawing function appears in the file along with the other drawing objects.
PointCloudReviewToolsinAutodesk®Navisworks®ManageOnce the point cloud appears in the drawing, the built in review and analysis tools can be applied.
Autodesk® Navisworks® Manage includes a variety of tools, three of which come to mind when working with Point Clouds.

LiDAR and Point Clouds: From Scan to Plan with AutoCAD® Civil 3D®
19
SectioningToolsThe Sectioning tools found in the Viewpoint tab Sectioning panel allow users to quickly view cross sections of the Point Cloud through use of a Sectioning Plane or Box. Viewpoints can also be saved through this tool.
To activate the Sectioning Tools, switch to the Viewpoint panel and click on the Enable Sectioning button. Select from the Plane or Box options in the Mode panel of the contextual tab and use Transform panel along with the multi-colored USC Icon to control the location of the sections.
Section Plane
Section Box
Walk&FlyToolThe Walk and Fly tools are found in the Navigate panel of the Viewpoint tab. These tools allow users to create a simulated flythrough or walkthrough of their Autodesk® Navisworks® drawing.
To activate Walk or Fly, click on the button in the Navigate panel. The Fly option is available in the
dropdown menu along with Walk. Once activated, the cursor icon will change to a pair of shoes or
paper airplane . Hold down the left mouse button and slide the mouse left/right/up/down to navigate around the model.
ClashDetectiveClash Detective is only available in Autodesk® Navisworks® Manage, and can be used to identify areas where different model objects intersect with one another. The feature also includes the ability to specify clash rules, view results, and output reports of the resulting clashes.

LiDAR and Point Clouds: From Scan to Plan with AutoCAD® Civil 3D®
20
In the case of Point Clouds, the Clash Detective can be a useful tool for finding areas where drawing model and scanned model data intersect, or where proposed model objects may interfere with existing objects located by the scan.
To activate Clash Detective, use the icon in the Home tab Tools panel. In the Clash Detective dialog box, set the Batch information and Rules, and then use the Select tab to choose the items for comparison.
Click Start to begin the clash test, and view the results on the Results tab when completed.
The Report tab provides users with the option to export the results of the test to XML, HTML, and Text format or export the results as Viewpoints.

LiDAR and Point Clouds: From Scan to Plan with AutoCAD® Civil 3D®
21
SomeBestPractice&NotesfromtheField
Scanning1. Scanning should be avoided during wet weather or on wet or reflective surfaces. Scanners are
waterproof; however reflective surfaces can affect results. 2. Some colors also tend to absorb light more than others. Some distortion can be expected from
scanning objects and items of a certain color range. 3. Some current scanners require power supply, which can be provided by a generator on site.
Additional models are battery powered, but may require recharging, depending on the length of use.
4. Pre-scan research should be done to locate any known points that can be used for the location of scanner and backsight setup. Tying in to known points allows scanned data to be associated with a known coordinate system.
5. Regardless of how much you try, people and objects tend to get in the way. Post-scan processing of data points allows users to filter out unwanted points that may be collected by people/animals/vehicles that drive through the scanned area.
Processing1. Specify the file format and content of the data to be provided by the surveyor. Requesting a copy
of the raw dataset also doesn’t hurt. 2. If scanning is done in-house, a third-party application or application from the scanner’s
manufacturer may also be handy for post-scanning processing of the data points. 3. Microsoft® Access® databases are a useful tool for data reduction and re-organizing of points
when working with datasets. Queries can also be created in Microsoft® Access® to further filter datasets or transform them to different coordinate systems.
4. Be careful when modifying datasets. Once data has been modified from its original form, its accuracy is reduced.
5. When exporting files, eliminate unnecessary information. Files are already fairly large based on the amount of data they contain. Things like point numbers, column headings and row numbers are not necessary for creating point clouds in Autodesk® products.
AutoCAD®Civil3D®1. The drawing settings for Coordinate System, Units, and Zone should all be set prior to creating a
Point Cloud. 2. Pre-defined Point File Formats are available in the out-of-box product, but additional custom file
formats can also be defined. 3. There is a POINTCLOUD Attach command within the application that allows users to access
.PCG files. The Create Point Cloud command only recognizes .ISD files as existing databases. 4. Always verify the order of the data within the point file. Small oversights like switching the
Northing and Easting values can lead to costly errors down the road. 5. RGB and Intensity values are recognized by AutoCAD® Civil 3D®, and can be used to create
color point clouds IF data is formatted properly. 6. Surfaces can be created from Point Cloud data using the Add Points to Surface option in the
Point Cloud contextual ribbon tab.

LiDAR and Point Clouds: From Scan to Plan with AutoCAD® Civil 3D®
22
7. The Point Cloud Density setting in the contextual tab adjusts the amount of points displayed in the drawing and also affects the amount of points added to the surface. Enter values manually rather than using the slide bar when adjusting density.
8. After the surface is created, standard surface edits apply. Delete Points, Delete Lines, and Simplify Surface are all effective edits to apply.
9. As always, don’t forget to SAVE often when working with Point Clouds.
Autodesk®Navisworks®1. Autodesk® Infrastructure Design Suite Standard and Premium editions come with Autodesk®
Navisworks® Simulate. Only the Ultimate edition includes Autodesk® Navisworks® Manage. 2. Point files can be opened directly in Autodesk® Navisworks®, but the order that data is presented
does make a difference. The default order is E, N, Z (Easting, Northing, Point Elevation). 3. Drawing Files containing Point Cloud objects can also be opened in Autodesk® Navisworks®.
This produces the most consistent result across both applications. 4. Sectioning, Fly, Walk and Clash Detective are all useful tools available once the point cloud is
loaded into the Autodesk® Navisworks® file. 5. Clash Detective is only available in Autodesk® Navisworks® Manage.
FinalThoughtsThe increasing technological advancements in the field of laser scanning have helped to incorporate the use of Lidar into the surveying, planning, design, and development industry. The speed, detail and accuracy at which Lidar data is collected is always advancing. Data that was once collected by airplane or helicopter with bulky equipment is now available in a highly mobile, tripod mounted form.
I look forward to seeing what’s next in this exciting industry, and hope you do as well.
Until next time, Happy Scanning!

LiDAR and Point Clouds: From Scan to Plan with AutoCAD® Civil 3D®
23
Appendix
Ideate,Inc.–ContactInformation Ideate, Inc. San Francisco San Jose Sacramento Portland Seattle 888.662.7238 www.ideateinc.com
Geoline,Inc.–ContactInformation Nick Fifarek Outside Sales Representative (Pacific Northwest) Geoline, Inc. – Bellevue, WA (www.geoline.com)
SiteInformationLocation: Geoline, Inc., Bellevue, Washington Feature: Parking Lot with Curb Islands Area: Approx. 6500 SF Total Points Scanned: 1,746,768 Time of Scan: Approx. 3 hours (including equipment setup and breakdown)
EquipmentInformationAutoCAD® Civil 3D 2012® Autodesk® Navisworks® Manage 2012
Trimble® GX 3D Laser Scanner Trimble® REALWORKS® Survey Trimble® REALWORKS® Viewer *Detailed specifications for Trimble® products available online at www.trimble.com
Thanks&AcknowledgementsThank you to everyone that attended this session, both live and virtual.
Thanks to all of the attendees of AU2011, and of the opportunity to be a presenter again this year.
Thanks also to Nick Fifarek at Geoline, Inc. in Bellevue, WA for time and energy scanning and processing the sample dataset used in this presentation.


![Vehicle detection in aerial LiDAR point clouds · Börcs Attila and Benedek Csaba A marked point process model for vehicle detection in aerial LIDAR point clouds [Conference] // ISPRS](https://img.pdfslide.us/doc/110x75/5f15c6e5e6c73e20576de4d1/vehicle-detection-in-aerial-lidar-point-clouds-brcs-attila-and-benedek-csaba-a.jpg)