Embed Size (px)
Citation preview
LICOS Discussion Paper Series
Discussion Paper 350/2014
Perceptions, impacts and rewards of row planting of teff
Joachim Vandercasteelen, Mekdim Dereje, Bart Minten, and Alemayehu Seyoum Taffesse
Faculty of Economics and Business LICOS Centre for Institutions and Economic Performance Waaistraat 6 – mailbox 3511 3000 Leuven BELGIUM
TEL:+32-(0)16 32 65 98 FAX:+32-(0)16 32 65 99 http://www.econ.kuleuven.be/licos
Perceptions, impacts and rewards
of row planting of teff
Joachim Vandercasteelen*, Mekdim Dereje**, Bart Minten‡, and Alemayehu Seyoum Taffesse‡‡
ABSTRACT
This study analyzes the perceptions, impacts, and rewards of farmers who adopted row planting for the production of
teff as a result of being exposed to a technology promotion campaign for row planting of teff in the Oromia region of
Ethiopia. Our three main findings are as follows. First, despite a positive attitude towards row planting (and reduced
seed rates in general) and a belief in the (large) yield increasing potential of row planting, exposed farmers only put a
relatively small part of their plots aside for row planting in the next planting season. This indicates concerns with the
additional labor requirement and possibly the need for more knowledge and experience with the new technology.
Second, by implementing row planting, farmers experienced an increase in teff yield in the first year of implementation,
but there was also a substantial increase in labor input requirements. A cost-benefit analysis shows that the increase in
teff yield outweighs the cost of the extra labor in the first year of adoption when yields increase by 8 percent or more.
Third, suitable mechanization for row planting would change the cost-benefit picture significantly and is shown to be an
investment with possible high returns.
Keywords: Ethiopia, teff yield, labor productivity, row planting, technology adoption, cost benefit
* Collaborator, Ethiopia Strategy Support Program, Development Strategy and Governance Division, International Food Policy Research Institute and PhD student at LICOS center of excellence, KU Leuven
** Research Officer, Ethiopia Strategy Support Program, Ethiopian Development Research Institute
‡ Program Leader and Sr. Research Fellow, Development Strategy and Governance Division, International Food Policy Research
Institute
‡‡ Sr. Research Fellow, Development Strategy and Governance Division, International Food Policy Research Institute
1. INTRODUCTION
Teff is Ethiopia’s most important staple crop. Teff has the largest value in terms of both production and consumption in
Ethiopia and the value of the commercial surplus of teff is second only to coffee (Minten et al. 2013).1 However,
despite its importance in Ethiopia, teff yields are low. In the production year 2012-2013, yields were 1.4 metric tons
(mt) per hectare (ha), significantly lower than other cereals, such as maize (3.1 mt/ha), sorghum and wheat (both 2.1
mt/ha) (CSA 2013). This low teff yield is seemingly explained by the limited knowledge about possible avenues for
improving teff productivity, combined with problems inherent to teff botany. Teff research has received limited
national and international attention, the latter presumably because of its localized importance in Ethiopia (Berhane et
al. 2011, Fufa et al. 2011). Moreover, teff yields are low because of agronomic constraints that include lodging, low
modern input use, and high post-harvest losses (Habtegebrial et al. 2007, Berhe et al. 2011, Fufa et al. 2011).
Recently it has been argued that the traditional sowing technology is a major constraint to increased teff productivity
(Berhe et al. 2011). Farmers typically plant teff by broadcasting, scattering teff seed by hand at a high seed rate.
Alternative planting methods, such as row planting seeds or transplanting seedlings, in which the seed rate is reduced
and more space between plants is given, are seen as being superior to traditional broadcasting (Berhe et al. 2011, Fufa
et al. 2011). Experiments on these alternative planting methods in controlled settings have shown large and positive
impacts on teff yields (Berhe et al., 2011, Fufa et al. 2011). As a consequence, in 2013 the Ethiopian government rolled
out a nationwide campaign to promote the use of improved technologies for teff production, including row planting,
aiming to scale up their adoption to almost 2.5 million teff farmers.
However, the impacts of the widespread promotion campaign of row planting of teff, in particular, on land and labor
productivity are unknown. This is mainly due to a lack of reliable and objective farm level data. Moreover, no
systematic effort has yet been put into examining farmers’ perceptions after they experimented with the new sowing
techniques. The contribution of this paper is to analyze the impact of the promotion campaign of row planting of teff
on land and labor productivity and infer farmers’ perception about the new planting technique and the promotion
thereof. In order to do so, we collected data during the ‘pre-scale-up’ phase of the promotion campaign in 2012-13 by
surveying almost 1,000 farmers from 36 villages exposed to the promotion campaign. The survey was implemented as a
large-scale randomized control trial (RCT), randomly selecting teff farmers to implement either row planting or
broadcasting of teff seed on an experimental plot. Moreover, while modern inputs were given for free in the ‘pre-scale-
up’ phase of the promotion campaign and as this was not the case in the teff technology packages that were extended
to farmers when the program was scaled up, we focus our analysis on isolating the effect of the new row planting part
of the teff technology package only.
We find that the promotion program of row planting led to increased teff yields at farm level, but the yield benefits
(from 2 to 12 percent) are lower than those realized in well managed on-station research trials and on demonstration
plots (ATA 2013c) and are lower than expected by farmers. Moreover, due to the increased labor requirement, labor
productivity decreased compared to the traditional broadcast planting. As a consequence, depending on the yield
increase achieved, the adoption of row planting is profitable only when the benefits associated with row planting
outweigh its cost. These results seemingly explain why most farmers exposed to row planting of teff continued row
planting in the year afterwards, but only on a small part of their teff lands. In addition, we analyzed the sensitivity of
our findings to the yield effect of learning by doing and scenarios where mechanized row planters would reduce labor
requirements. In such scenarios, adopting of row planting would become much more beneficial for farmers.
1 More than 6 million farmers obtained a total teff output of almost 4 million mt during the 2012-13 main Meher cropping season, accounting for
16 percent of all grain output in the country. Teff’ grain has a high content of protein, fiber and complex carbohydrates, and is gluten free
(Berhane et al. 2011, ATA 2013c). It accounts for 11 to 15 percent of all calories consumed and 23 percent of urban food consumption (Berhane
et al. 2011, ATA 2013c). Almost two thirds of the Ethiopian population uses teff as a daily staple food. It is estimated that per capita consumption
grew by four percent over the last five years (ATA, 2013c).
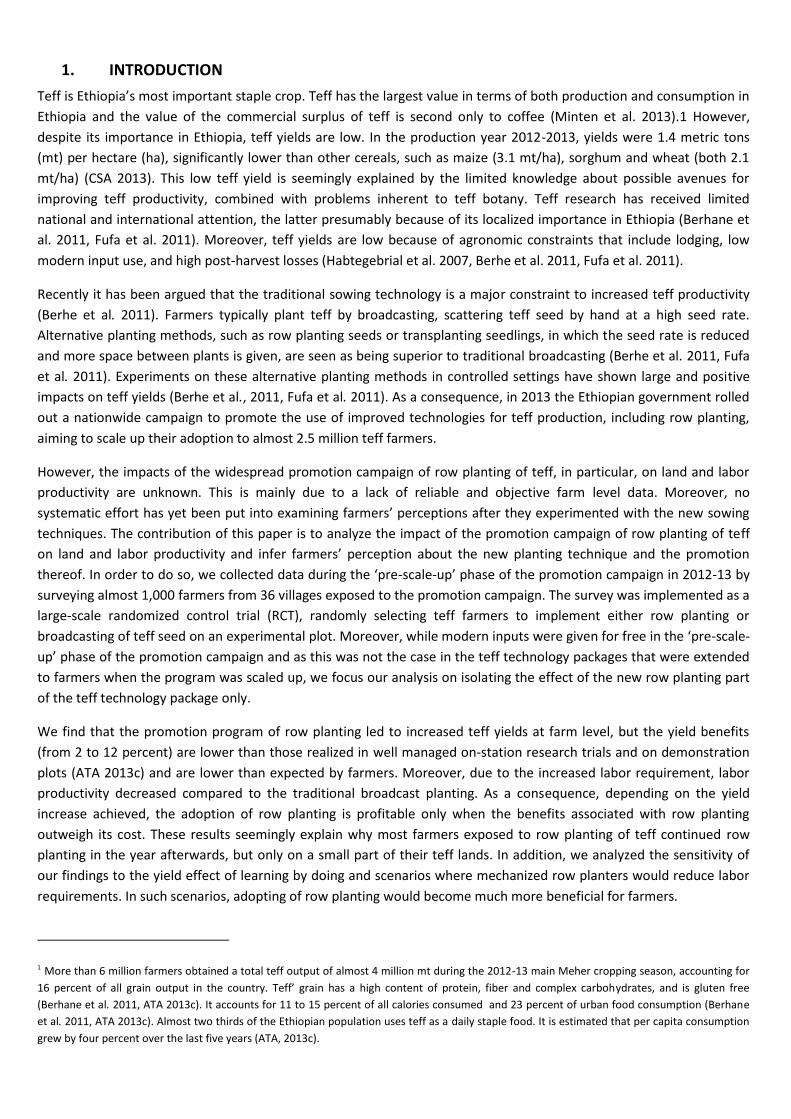
2. REDUCED SEED RATE TECHNOLOGIES
Traditionally, farmers broadcast teff seed using a high seed rate of between 25 and 50 kg per hectare (ATA 2013c). It is
argued that this practice (Figure 2.1) reduces yield because the uneven distribution of seed increases competition
between teff plants for water, light, and nutrients, and makes weeding more difficult once the plants have matured
(Fufa et al. 2011). As a solution, it is recommended to reduce the seed rates and to plant in rows (Figure 2.1) or,
alternatively, to transplant seedlings from a nursery plot. Reducing the seed rate to 2.5–3.0 kg per hectare reduces
competition between seedlings and allows for optimal tillering or branching out of the plants. By row planting or
transplanting, land management and especially weeding can be done more easily. The incidence of lodging is also
found to be reduced, as the stem of row planted teff is better able to support the weight of the filled head of grain
(Berhe et al. 2011, Chanyalew and Assefa 2013).
Figure 2.1 Teff sowing practice using traditional broadcasting (left) versus row planting (right)
The belief in the potential of reduced seed rate technologies to increase teff productivity is the outcome of on-station
agronomic research. Experiments on-station showed that when teff was planted in rows and appropriate types of
fertilizer were used, teff yields were on average three times higher than yields obtained from traditional broadcasting
(Berhe et al. 2011, ATA 2012). Given these positive results, programs to promote the technologies to teff farmers at a
large scale were rolled out by the government (ATA 2013a). A technology package was promoted to farmers that
included: planting of seed or transplanting seedlings in rows, a reduction of the seed rate to 5 kg/ha, a sowing depth of
2-3 cm, use of improved seed (Quncho variety), and the application of recommended levels of chemical fertilizer (DAP
and urea).
In 2011, the Ministry of Agriculture (MoA), with the support of the Agricultural Transformation Agency (ATA), provided
this package and extension to 1,400 farmers. On-farm experiments were done in 90 Farm Training Centers (FTC) at the
local, kebele administrative level in the four main teff producing regions of Ethiopia of Tigray, Oromia, Amhara and
Southern Nations, Nationalities, and Peoples (SNNP). The results of this promotion campaign showed an increase of 75
percent in teff yield (ATA 2013). In 2012, this experiment was extended to almost 70,000 farmers from 1,337 FTCs. Data
collected from 15,800 households that participated in this “pre-scale-up” phase indicated that teff yields had increased
by 70 percent over the national average (Berhe et al. 2011, ATA 2013c). In 2013, the program was rolled out nationwide
to reach 2.5 million farmers (ATA 2013c).2
2 Overall, agronomic research tends to find positive effects of row planting (even if it is scaled up), but several small-scale trials with farmers showed lower effects which were sometimes statistically not significant. Moreover, the results from agronomic research conducted by the Ethiopian Institute of Agricultural Research (EIAR) showed that yield increases from implementing row planting were small and that changing seed rates, planting depths, and plant spacing did not affect teff yields significantly (Chanyalew and Assefa 2013).
3. DESIGN OF THE INTERVENTION
3.1. Design and methodology
Our experiment evaluates the impact of the “pre-scale-up” program of promotion of teff row-planting implemented in
2012 through which reduced seed rate technologies – as part of a package – were extended to a selected number of
farmers. The design of the evaluation is in line with the roll-out of the program by MoA in that year, done with the
support of ATA. However, some modifications were done to the roll-out in order to ensure that the selection of farmers
to be studied was done randomly and that an appropriate control group was constructed. The sample design followed a
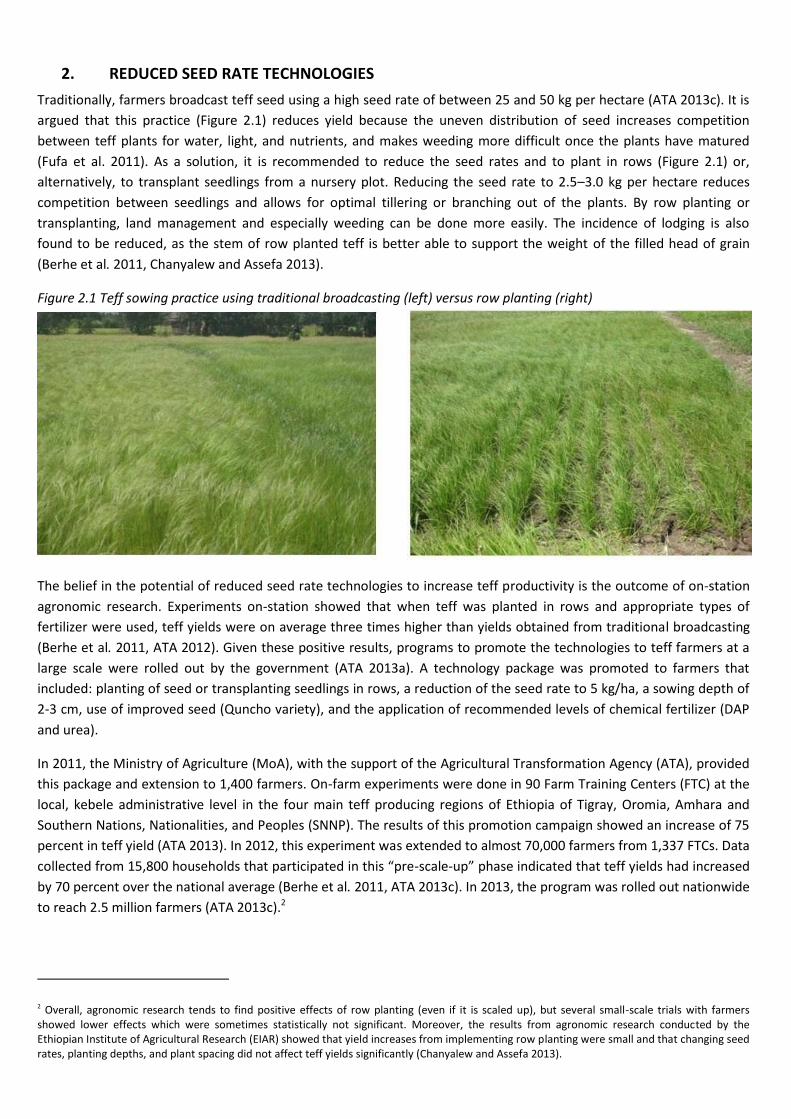
two-stage randomization approach. First, from the 23 Agricultural Growth Program (AGP)3 woredas (district-level
administrative unit) in Oromia region, ten woredas were randomly selected (Figure 3.1). Four FTCs were then randomly
selected out of all FTCs within the selected woredas. From a total of 60 randomly selected farmers in each FTC, 25
farmers were randomly selected to be interviewed for the survey. In the second stage, farmers were randomly
allocated over treatment and control groups for the study and 10 farmers were selected to do either row planting or
broadcasting.4 The farmers in our sample are all progressive, so-called model farmers with whom agricultural extension
agents, the Development Agents (DA), work relatively closely, as they are the target farmers of the promotion
campaign.
Figure 3.1 Map of the intervention woredas
Note: One of the selected woredas dropped out and is not indicated on the map.
3 AGP is a five-year program aimed at reducing poverty by increasing agricultural productivity and improving market access for small holders in 83 woredas in Amhara, Oromia, SNNP, and Tigray (Berhane et al. 2011). 4 As few farmers showed interest in transplanting, due to the heavy workload associated with the planting technique, farmers were purposefully selected to implement transplanting. Given the small sample, we do not present the results of the analysis of transplanting in this paper.
We cooperated closely with the local DAs in each FTC for selecting, training, and assisting farmers who participated in
the experiment. As the objective was to evaluate the impact of the program, no additional assistance to DAs was
provided, but they received extra training on the inclusion of control farmers into the study. DAs instructed all farmers
to grow teff using the allocated sowing technology on a small experimental plot of 300 m². Farmers assigned to the row
planting treatment group received 150 grams (5 kg per hectare) of improved teff seed (Quncho) for free, while farmers
in the control group received 900 grams (30 kg per hectare) of the same seed, also for free. Finally, all groups received
at no cost identical fertilizer packages (3 kg of both urea and DAP) to ensure that the same amount of inputs was used
on the designated experimental plot for each farmer involved in the study.
The selected farmers in our survey area were visited three times. First, the baseline survey of October 2012 collected
data on the experimental plot characteristics and teff production for the production year of 2011-2012. Second,
farmers were re-visited just before harvesting between November 2012 and January 2013 by enumerators from the
Central Statistical Agency (CSA) to measure teff output from the experimental plot. Finally, an impact survey was
fielded after the teff harvest in February 2013, similar to the baseline survey, with additional information collected on
teff production and management practices on the experimental plot. However, despite clear instructions, the
assignment of farmers to the different technologies by the DAs was not done randomly everywhere. As a consequence,
instead of the targeted 36 FTCs, we were only able to collect randomized data from 19 FTCs.5 This quantitative
information was further complemented with qualitative investigations and a community questionnaire that was
administered at the same time as the impact survey to understand the perceptions of these new technologies held by
participating and non-participating farmers.
The survey design described above provides a robust framework within which we can measure the impact of row
planting on teff productivity. We are interested in the effect of implementing row planting on teff productivity for an
individual farmer (i) in our sample. Ti is defined as the treatment variable: Ti=1 for a row planting farmer and 0
otherwise. Yi(Ti) indicates teff productivity (either land or labor) given the treatment: Yi(1) is teff productivity when a
farmer implements row planting, while Yi(0) is teff productivity when the farmer uses traditional broadcasting to plant
teff seed. The impact of implementing row planting on the teff productivity of the experimental plot of a farmer i is
then the difference in teff productivity between the treatments: Δi = Yi(1)- Yi(0). This effect is measured by the Average
Treatment effect on the Treated (ATT), the average gain in teff productivity a farmer realizes from using row planting
for row planters:
{ } { ( )} { ( )}
In general, the yield a row planting farmer would obtain from implementing traditional broadcasting (the
counterfactual), is not observed for row planting farmers as they were assigned to row planting only. However, the
random assignment of farmers to different sowing practices and the identical input distribution implies that all farmers
in our sample are statistically identical in their characteristics relevant to teff production. Hence, we can use the
observed teff productivity from traditional broadcasters to identify the counterfactual of row planters. Randomization
ensures that the difference in teff yield between the traditional broadcasting and row planting farmers can be
attributed solely to the sowing method. As a consequence, taking the expected mean difference between the two
groups will give us an estimate of the effect of row planting on teff yield. The ATT6 is defined as the expected teff
productivity difference at the farm level between a row planting farmer and a broadcasting farmer.
5 See the full working paper (Vandercasteelen et al. 2013) for a complete overview of the survey implementation problems and results of analysis on non-randomly collected data. 6 The ATT is subject to self-selection as farmers that implement row planting when assigned to do so, might systematically differ from those that refuse or are unable to adopt. By including the latter, the Intention-To-Treat (ITT) framework measures the effect of row planting on teff yield for those farmers who were initially selected to participate in the experiment, irrespective of the actual implementation of the assigned technology on their experimental plot. If initial selection is used as an instrument for actual participation, then the Local Average Treatment Effect (LATE)
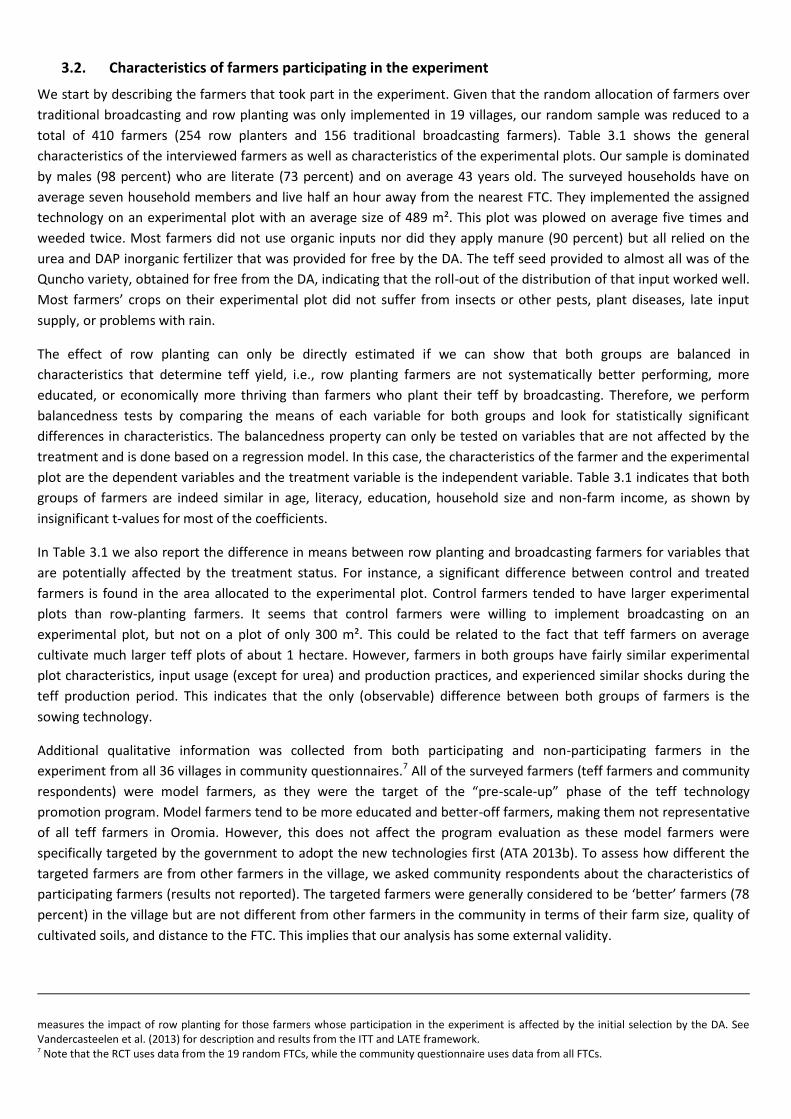
3.2. Characteristics of farmers participating in the experiment
We start by describing the farmers that took part in the experiment. Given that the random allocation of farmers over
traditional broadcasting and row planting was only implemented in 19 villages, our random sample was reduced to a
total of 410 farmers (254 row planters and 156 traditional broadcasting farmers). Table 3.1 shows the general
characteristics of the interviewed farmers as well as characteristics of the experimental plots. Our sample is dominated
by males (98 percent) who are literate (73 percent) and on average 43 years old. The surveyed households have on
average seven household members and live half an hour away from the nearest FTC. They implemented the assigned
technology on an experimental plot with an average size of 489 m². This plot was plowed on average five times and
weeded twice. Most farmers did not use organic inputs nor did they apply manure (90 percent) but all relied on the
urea and DAP inorganic fertilizer that was provided for free by the DA. The teff seed provided to almost all was of the
Quncho variety, obtained for free from the DA, indicating that the roll-out of the distribution of that input worked well.
Most farmers’ crops on their experimental plot did not suffer from insects or other pests, plant diseases, late input
supply, or problems with rain.
The effect of row planting can only be directly estimated if we can show that both groups are balanced in
characteristics that determine teff yield, i.e., row planting farmers are not systematically better performing, more
educated, or economically more thriving than farmers who plant their teff by broadcasting. Therefore, we perform
balancedness tests by comparing the means of each variable for both groups and look for statistically significant
differences in characteristics. The balancedness property can only be tested on variables that are not affected by the
treatment and is done based on a regression model. In this case, the characteristics of the farmer and the experimental
plot are the dependent variables and the treatment variable is the independent variable. Table 3.1 indicates that both
groups of farmers are indeed similar in age, literacy, education, household size and non-farm income, as shown by
insignificant t-values for most of the coefficients.
In Table 3.1 we also report the difference in means between row planting and broadcasting farmers for variables that
are potentially affected by the treatment status. For instance, a significant difference between control and treated
farmers is found in the area allocated to the experimental plot. Control farmers tended to have larger experimental
plots than row-planting farmers. It seems that control farmers were willing to implement broadcasting on an
experimental plot, but not on a plot of only 300 m². This could be related to the fact that teff farmers on average
cultivate much larger teff plots of about 1 hectare. However, farmers in both groups have fairly similar experimental
plot characteristics, input usage (except for urea) and production practices, and experienced similar shocks during the
teff production period. This indicates that the only (observable) difference between both groups of farmers is the
sowing technology.
Additional qualitative information was collected from both participating and non-participating farmers in the
experiment from all 36 villages in community questionnaires.7 All of the surveyed farmers (teff farmers and community
respondents) were model farmers, as they were the target of the “pre-scale-up” phase of the teff technology
promotion program. Model farmers tend to be more educated and better-off farmers, making them not representative
of all teff farmers in Oromia. However, this does not affect the program evaluation as these model farmers were
specifically targeted by the government to adopt the new technologies first (ATA 2013b). To assess how different the
targeted farmers are from other farmers in the village, we asked community respondents about the characteristics of
participating farmers (results not reported). The targeted farmers were generally considered to be ‘better’ farmers (78
percent) in the village but are not different from other farmers in the community in terms of their farm size, quality of
cultivated soils, and distance to the FTC. This implies that our analysis has some external validity.
measures the impact of row planting for those farmers whose participation in the experiment is affected by the initial selection by the DA. See Vandercasteelen et al. (2013) for description and results from the ITT and LATE framework. 7 Note that the RCT uses data from the 19 random FTCs, while the community questionnaire uses data from all FTCs.
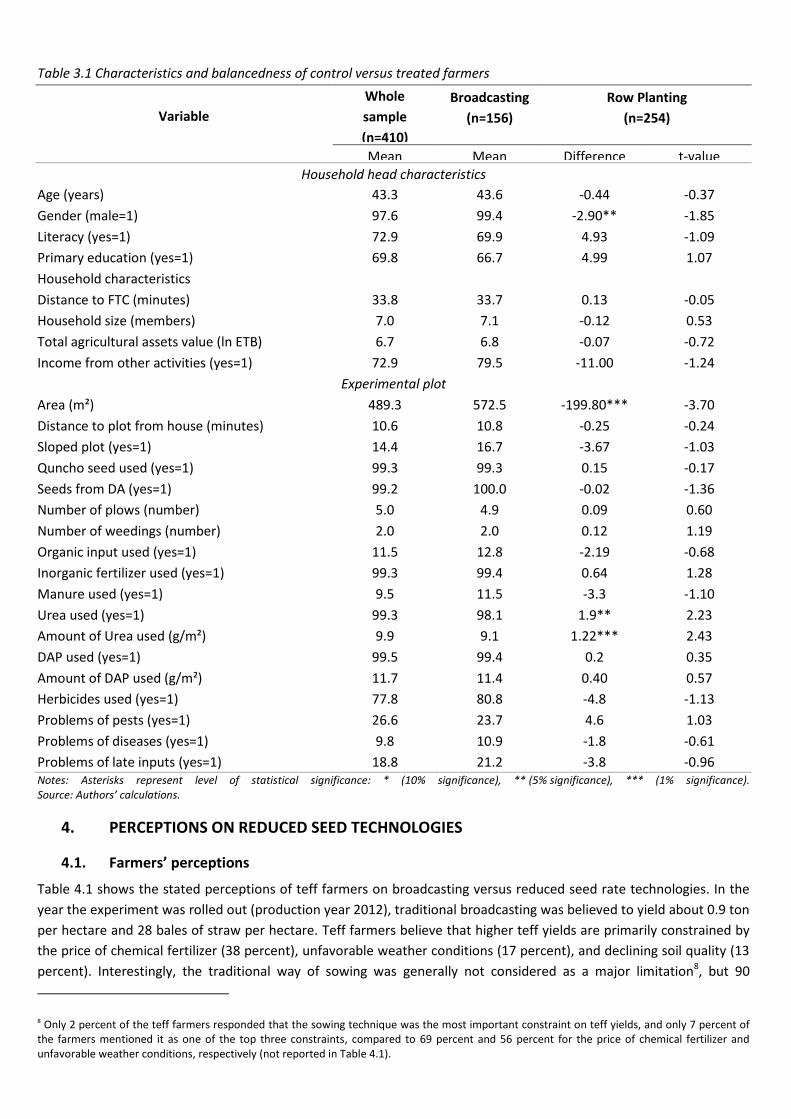
Table 3.1 Characteristics and balancedness of control versus treated farmers
Variable
Whole
sample
(n=410)
Broadcasting
(n=156)
Row Planting
(n=254)
Mean Mean Difference t-value Household head characteristics
Age (years) 43.3 43.6 -0.44 -0.37
Gender (male=1) 97.6 99.4 -2.90** -1.85
Literacy (yes=1) 72.9 69.9 4.93 -1.09
Primary education (yes=1) 69.8 66.7 4.99 1.07
Household characteristics
Distance to FTC (minutes) 33.8 33.7 0.13 -0.05
Household size (members) 7.0 7.1 -0.12 0.53
Total agricultural assets value (ln ETB) 6.7 6.8 -0.07 -0.72
Income from other activities (yes=1) 72.9 79.5 -11.00 -1.24
Experimental plot
Area (m²) 489.3 572.5 -199.80*** -3.70
Distance to plot from house (minutes) 10.6 10.8 -0.25 -0.24
Sloped plot (yes=1) 14.4 16.7 -3.67 -1.03
Quncho seed used (yes=1) 99.3 99.3 0.15 -0.17
Seeds from DA (yes=1) 99.2 100.0 -0.02 -1.36
Number of plows (number) 5.0 4.9 0.09 0.60
Number of weedings (number) 2.0 2.0 0.12 1.19
Organic input used (yes=1) 11.5 12.8 -2.19 -0.68
Inorganic fertilizer used (yes=1) 99.3 99.4 0.64 1.28
Manure used (yes=1) 9.5 11.5 -3.3 -1.10
Urea used (yes=1) 99.3 98.1 1.9** 2.23
Amount of Urea used (g/m²) 9.9 9.1 1.22*** 2.43
DAP used (yes=1) 99.5 99.4 0.2 0.35
Amount of DAP used (g/m²) 11.7 11.4 0.40 0.57
Herbicides used (yes=1) 77.8 80.8 -4.8 -1.13
Problems of pests (yes=1) 26.6 23.7 4.6 1.03
Problems of diseases (yes=1) 9.8 10.9 -1.8 -0.61
Problems of late inputs (yes=1) 18.8 21.2 -3.8 -0.96 Notes: Asterisks represent level of statistical significance: * (10% significance), ** (5% significance), *** (1% significance). Source: Authors’ calculations.
4. PERCEPTIONS ON REDUCED SEED TECHNOLOGIES
4.1. Farmers’ perceptions
Table 4.1 shows the stated perceptions of teff farmers on broadcasting versus reduced seed rate technologies. In the
year the experiment was rolled out (production year 2012), traditional broadcasting was believed to yield about 0.9 ton
per hectare and 28 bales of straw per hectare. Teff farmers believe that higher teff yields are primarily constrained by
the price of chemical fertilizer (38 percent), unfavorable weather conditions (17 percent), and declining soil quality (13
percent). Interestingly, the traditional way of sowing was generally not considered as a major limitation8, but 90
8 Only 2 percent of the teff farmers responded that the sowing technique was the most important constraint on teff yields, and only 7 percent of the farmers mentioned it as one of the top three constraints, compared to 69 percent and 56 percent for the price of chemical fertilizer and unfavorable weather conditions, respectively (not reported in Table 4.1).
percent of the teff farmers believe that the reduced seed technologies will improve teff production. For those who
believe these positive impacts, they expect the new technologies to save seed (100 percent), make weeding easier (85
percent), and improve productivity (98 percent). Table 4.1 further reports the high yield increases expected by teff
farmers when implementing row planting (93 percent higher), broadcasting at reduced seed rate (63 percent higher),
and transplanting (93 percent higher).
Table 4.1 Farmers’ perception on teff production and row planting
number of
observations
Percentage or
unit stated
* What is the teff yield (in ton per hectare) you can obtain from:
Traditional broadcasting? 410 0.9
Broadcasting at reduced seed rate? 240 1.5
Row planting? 358 1.8
Transplanting? 132 1.8
* What is the straw yield (in bales per hectare) you can obtain from:
Traditional broadcasting? 409 28
Broadcasting at reduced seed rate? 240 27
Row planting? 354 26
Transplanting? 128 21
* The most limiting factor of higher teff yields is: 409
Price of chemical fertilizer
38
Unfavorable weather conditions
17
Declining soil quality
13
Access to improved seeds
10
Traditional sowing technique
2
* The labor requirement will increase when implementing (yes=1): 410
Broadcasting at reduced seed rate?
10
Row planting?
95
Transplanting?
77
* Are there benefits of reduced seed rate technologies (yes=1)? 409 90
* The main benefit of reduced seed rate technologies is: 367
Saving seeds
100
Better weeding
85
Higher productivity
98
The results reported above reflect farmers’ overall beliefs on reduced teff seed rate technologies. These beliefs refer to
advantages and disadvantages of reduced seed rate technologies in general and do not necessarily represent the
experience of farmers on their own experimental plot. When asked about general beliefs, farmers take into account
results they witnessed on the teff fields of other (often more successful) farmers in the village. Farmers’ opinions might
also be influenced by information they receive from extension agents, media, and training. In all instances, farmers
were told that it was possible to achieve large yield increases if the reduced seed rate technologies were implemented
correctly.
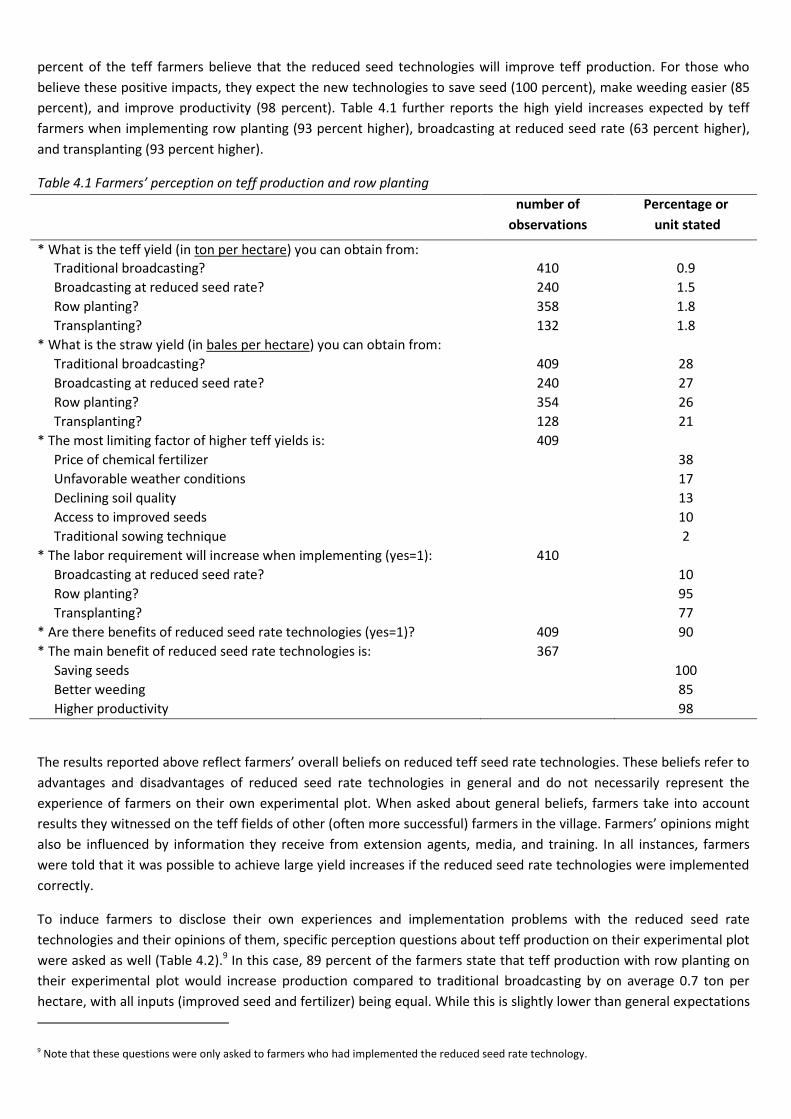
To induce farmers to disclose their own experiences and implementation problems with the reduced seed rate
technologies and their opinions of them, specific perception questions about teff production on their experimental plot
were asked as well (Table 4.2).9 In this case, 89 percent of the farmers state that teff production with row planting on
their experimental plot would increase production compared to traditional broadcasting by on average 0.7 ton per
hectare, with all inputs (improved seed and fertilizer) being equal. While this is slightly lower than general expectations
9 Note that these questions were only asked to farmers who had implemented the reduced seed rate technology.
(when not referring solely to their experimental plot) of 0.9 ton per hectare, these numbers still illustrate the high
expectations farmers have of improved teff productivity with the use of row planting. However, this also indicates that
farmers have experienced themselves lower benefits on their experimental plots, possibly related to implementation
problems. A major concern mentioned was the increase in labor requirements associated with the use of row planting:
the majority of farmers assessed the labor inputs with the planting technique to be significantly higher for men,
women, and children by, on average, 12, 3, and 2 person-hours, respectively, for the experimental plot as a whole
(Table 4.2).10
Table 4.2 Farmers’ perception questions of the effect of row planting on the experimental plot
Percentage or
unit stated
Number of
observations
* Compared to traditional broadcasting and using the same seed type, inputs; etc.
Teff production would be higher (yes=1)? 89 250
How much (in mt/ha)? 0.7 222
Straw production would be higher (yes=1)? 54 250
How much (in bales per ha)? 1.2 136
* Compared to traditional broadcasting, labor increased (yes=1)? 92 250
* What would be the increase in labor for (in hours) for:
Male 12 230
Female 3 229
Children 2 226
4.2. Community focus groups’ perceptions
Given that farmers believe that (i) traditional broadcasting limits teff yield and (ii) reduced seed rate technologies
benefit teff production, all but one community focus group indeed expected row planting to increase teff yields (Table
4.3).11 The sowing technique is generally not considered as a major limiting factor of teff production, but when explicitly
asked whether traditional broadcasting constrains teff production, 86 percent of the community focus groups agreed
that the traditional practice of broadcasting seed impeded teff productivity. When asked about the advantages of
reduced seed rate technologies12, all community focus groups mentioned higher teff yields, while two-thirds of the
community focus groups considered the lower seed rate to be the major advantage of row planting (this was similar for
broadcasting at a reduced seed rate and for transplanting).
As reduced seed rate techniques are expected to bring about teff productivity benefits, community respondents were
further asked to assess the magnitude of the potential yield levels that they expect (Table 4.3). Compared to the
0.8 mt/ha that they envisioned could be obtained when using broadcasting, row planting is expected to increase yield
on average by 136 percent to a level of 2.0 mt/ha. Broadcasting at reduced seed rate is expected to increase yield by
124 percent (1.9 mt/ha) and transplanting by 163 percent (2.2 mt/ha). A similar assessment was requested with respect
to straw yield changes. Compared to the 28 bales of straw per hectare that can be obtained from traditional
broadcasting, only transplanting is expected to decrease straw yield (by 31 percent). Teff farmers expect straw yield to
be the same for broadcasting at a reduced seed rate and for row planting.
10 For females, 50 percent of the farmers think that labor input will increase (by an average of 3 person-hours); while for children, 62 percent of the farmers expect labor input to increase (by an average of 2 person-hours). 11 Similar results hold for broadcasting at reduced seed rate (61 percent) and transplanting (69 percent). 12 Community respondents were asked to give the top three major advantages of the reduced seed rate technologies A list of nine possible answers was provided: higher teff yields, higher straw yields, lower seed rate, less wastage of fertilizer, less weeding, reduced crop damage during weeding, good branching out of plants, less labor needed, and other (specify).
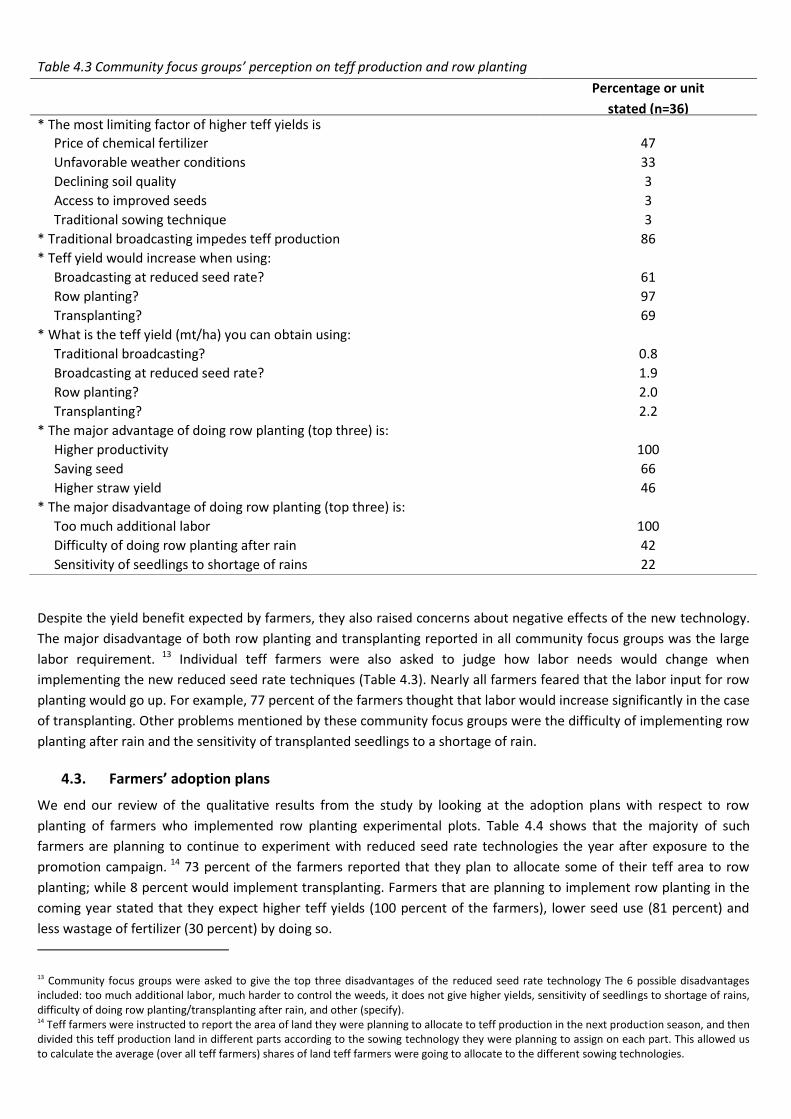
Table 4.3 Community focus groups’ perception on teff production and row planting
Percentage or unit
stated (n=36) * The most limiting factor of higher teff yields is
Price of chemical fertilizer 47
Unfavorable weather conditions 33
Declining soil quality 3
Access to improved seeds 3
Traditional sowing technique 3
* Traditional broadcasting impedes teff production 86
* Teff yield would increase when using:
Broadcasting at reduced seed rate? 61
Row planting? 97
Transplanting? 69
* What is the teff yield (mt/ha) you can obtain using:
Traditional broadcasting? 0.8
Broadcasting at reduced seed rate? 1.9
Row planting? 2.0
Transplanting? 2.2
* The major advantage of doing row planting (top three) is:
Higher productivity 100
Saving seed 66
Higher straw yield 46
* The major disadvantage of doing row planting (top three) is:
Too much additional labor 100
Difficulty of doing row planting after rain 42
Sensitivity of seedlings to shortage of rains 22
Despite the yield benefit expected by farmers, they also raised concerns about negative effects of the new technology.
The major disadvantage of both row planting and transplanting reported in all community focus groups was the large
labor requirement. 13 Individual teff farmers were also asked to judge how labor needs would change when
implementing the new reduced seed rate techniques (Table 4.3). Nearly all farmers feared that the labor input for row
planting would go up. For example, 77 percent of the farmers thought that labor would increase significantly in the case
of transplanting. Other problems mentioned by these community focus groups were the difficulty of implementing row
planting after rain and the sensitivity of transplanted seedlings to a shortage of rain.
4.3. Farmers’ adoption plans
We end our review of the qualitative results from the study by looking at the adoption plans with respect to row
planting of farmers who implemented row planting experimental plots. Table 4.4 shows that the majority of such
farmers are planning to continue to experiment with reduced seed rate technologies the year after exposure to the
promotion campaign. 14 73 percent of the farmers reported that they plan to allocate some of their teff area to row
planting; while 8 percent would implement transplanting. Farmers that are planning to implement row planting in the
coming year stated that they expect higher teff yields (100 percent of the farmers), lower seed use (81 percent) and
less wastage of fertilizer (30 percent) by doing so.
13 Community focus groups were asked to give the top three disadvantages of the reduced seed rate technology The 6 possible disadvantages included: too much additional labor, much harder to control the weeds, it does not give higher yields, sensitivity of seedlings to shortage of rains, difficulty of doing row planting/transplanting after rain, and other (specify). 14 Teff farmers were instructed to report the area of land they were planning to allocate to teff production in the next production season, and then divided this teff production land in different parts according to the sowing technology they were planning to assign on each part. This allowed us to calculate the average (over all teff farmers) shares of land teff farmers were going to allocate to the different sowing technologies.
Yet, the share of land that farmers are planning to allocate to row planting is limited. Farmers plan to plant the largest
part (80 percent) of their teff lands using broadcasting (i.e. just over half of their teff area using traditional broadcasting
and 27 percent using broadcasting at a reduced seed rate). Only 19 percent of the teff area of these farmers will be
allocated to row planting and 1 percent to transplanting. All of the teff farmers that were reluctant to implement row
planting or transplanting, when asked why, responded that row planting requires too much additional labor, while 25
percent of the farmers responded that implementing the technology was too difficult after rainfall.
These findings reinforce the conclusion of the previous section. It seems that farmers are willing to continue to
experiment with row planting, but only on a relatively small part of their teff land. While farmers believe in the general
yield increasing potential of row planting teff, they restrict their adoption of the planting technique to small areas.
Table 4.4 Farmers’ planning strategies for the next production year
percentage number of
observations
* Will you allocate some part of your teff area to (yes=1): 410
Traditional broadcasting? 75
Broadcasting at reduced seed rate? 56
Row planting? 73
Transplanting? 10
* Share of total teff production land allocated to: 407
Traditional broadcasting? 53
Broadcasting at reduced seed rate? 27
Row planting? 19
Transplanting? 1
Total 100
* The major reason for not doing row planting next year (top three) is: 112
Too much additional labor 96
Difficulty of doing row planting after rain 25
It does not give higher yields 16
* The major reason for doing row planting next year (top three) is: 294
Higher productivity 98
Saving seed 83
Less wastage of fertilizer 30
* Would you do row planting if inputs (teff seeds and fertilizer) were: 409
Not given for free? 75
Given at a discounted price? 80
Given for free? 85
Not given for free but you had access to a row planter? 75
Finally, given that inputs were provided for free during the experiment, it is possible that the composition of the
provided package, or part of it, drives the decision of farmers to adopt row planting next year. That is, it is not certain
whether it is the technology itself or the other elements in the technology package that cause farmers to be willing to
experiment with the technology in the following year. Farmers were therefore asked if they would do row planting the
year after if the proposed technology package (teff seed and fertilizer) provided to farmers was changed. If inputs were
given at a discounted price or for free, more than 80 percent of the farmers indicated that they would do row planting
next year. If inputs were not given for free, still three quarters of the farmers indicated that they would implement row
planting the next season. Surprisingly, having access to a row planting machine seemingly did not give an extra
incentive to implement row planting. This might be because few of the farmers had been exposed to such a machine at
the time of the survey.
5. IMPACT OF THE PROMOTION CAMPAIGN OF ROW PLANTING OF TEFF
In the previous section, we presented the qualitative data on farmers’ perceptions about the newly promoted reduced
seed rate technologies for teff. In this section, we present the results of our quantitative analysis of the productivity
impacts from being exposed to the promotion campaign.
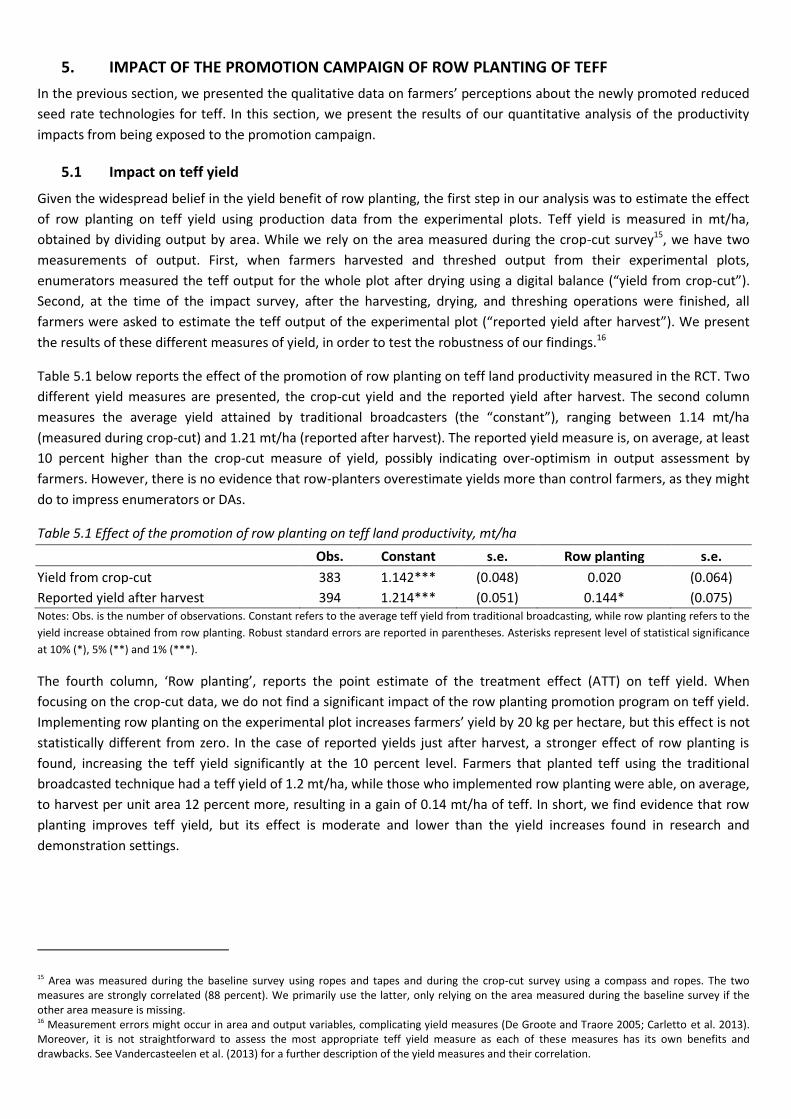
5.1 Impact on teff yield
Given the widespread belief in the yield benefit of row planting, the first step in our analysis was to estimate the effect
of row planting on teff yield using production data from the experimental plots. Teff yield is measured in mt/ha,
obtained by dividing output by area. While we rely on the area measured during the crop-cut survey15, we have two
measurements of output. First, when farmers harvested and threshed output from their experimental plots,
enumerators measured the teff output for the whole plot after drying using a digital balance (“yield from crop-cut”).
Second, at the time of the impact survey, after the harvesting, drying, and threshing operations were finished, all
farmers were asked to estimate the teff output of the experimental plot (“reported yield after harvest”). We present
the results of these different measures of yield, in order to test the robustness of our findings.16
Table 5.1 below reports the effect of the promotion of row planting on teff land productivity measured in the RCT. Two
different yield measures are presented, the crop-cut yield and the reported yield after harvest. The second column
measures the average yield attained by traditional broadcasters (the “constant”), ranging between 1.14 mt/ha
(measured during crop-cut) and 1.21 mt/ha (reported after harvest). The reported yield measure is, on average, at least
10 percent higher than the crop-cut measure of yield, possibly indicating over-optimism in output assessment by
farmers. However, there is no evidence that row-planters overestimate yields more than control farmers, as they might
do to impress enumerators or DAs.
Table 5.1 Effect of the promotion of row planting on teff land productivity, mt/ha
Obs. Constant s.e. Row planting s.e.
Yield from crop-cut 383 1.142*** (0.048) 0.020 (0.064)
Reported yield after harvest 394 1.214*** (0.051) 0.144* (0.075) Notes: Obs. is the number of observations. Constant refers to the average teff yield from traditional broadcasting, while row planting refers to the
yield increase obtained from row planting. Robust standard errors are reported in parentheses. Asterisks represent level of statistical significance
at 10% (*), 5% (**) and 1% (***).
The fourth column, ‘Row planting’, reports the point estimate of the treatment effect (ATT) on teff yield. When
focusing on the crop-cut data, we do not find a significant impact of the row planting promotion program on teff yield.
Implementing row planting on the experimental plot increases farmers’ yield by 20 kg per hectare, but this effect is not
statistically different from zero. In the case of reported yields just after harvest, a stronger effect of row planting is
found, increasing the teff yield significantly at the 10 percent level. Farmers that planted teff using the traditional
broadcasted technique had a teff yield of 1.2 mt/ha, while those who implemented row planting were able, on average,
to harvest per unit area 12 percent more, resulting in a gain of 0.14 mt/ha of teff. In short, we find evidence that row
planting improves teff yield, but its effect is moderate and lower than the yield increases found in research and
demonstration settings.
15 Area was measured during the baseline survey using ropes and tapes and during the crop-cut survey using a compass and ropes. The two measures are strongly correlated (88 percent). We primarily use the latter, only relying on the area measured during the baseline survey if the other area measure is missing. 16 Measurement errors might occur in area and output variables, complicating yield measures (De Groote and Traore 2005; Carletto et al. 2013). Moreover, it is not straightforward to assess the most appropriate teff yield measure as each of these measures has its own benefits and drawbacks. See Vandercasteelen et al. (2013) for a further description of the yield measures and their correlation.
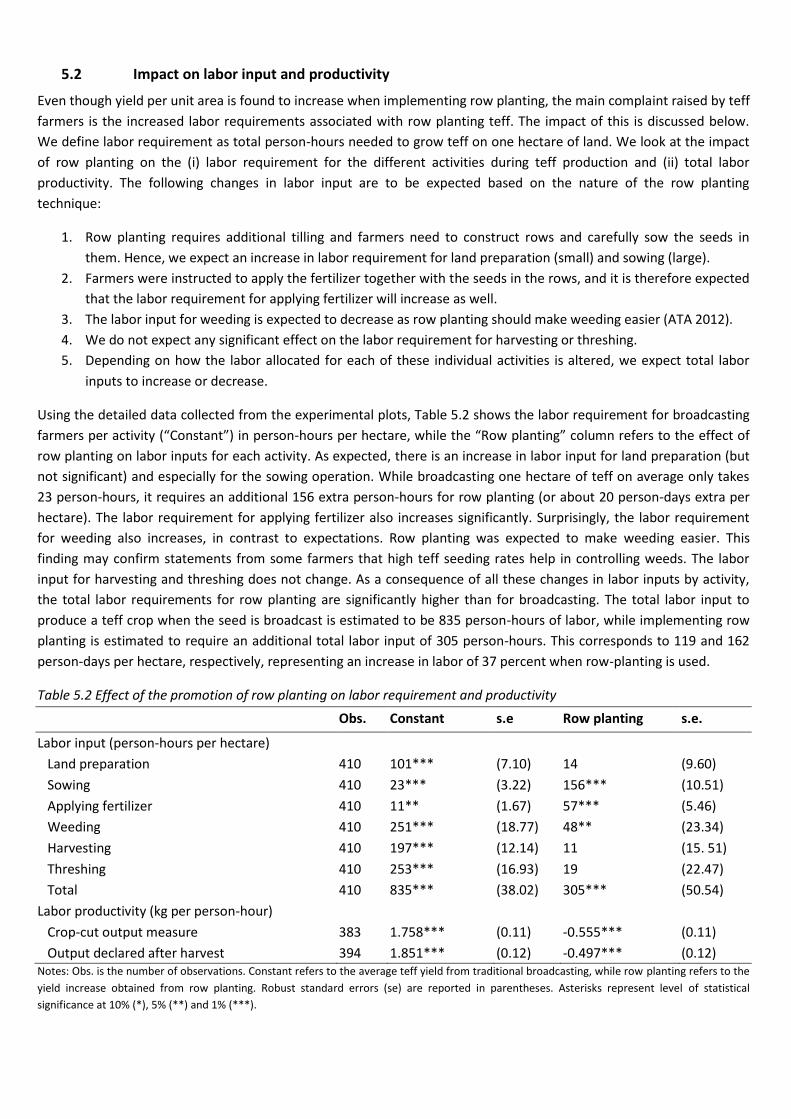
5.2 Impact on labor input and productivity
Even though yield per unit area is found to increase when implementing row planting, the main complaint raised by teff
farmers is the increased labor requirements associated with row planting teff. The impact of this is discussed below.
We define labor requirement as total person-hours needed to grow teff on one hectare of land. We look at the impact
of row planting on the (i) labor requirement for the different activities during teff production and (ii) total labor
productivity. The following changes in labor input are to be expected based on the nature of the row planting
technique:
1. Row planting requires additional tilling and farmers need to construct rows and carefully sow the seeds in
them. Hence, we expect an increase in labor requirement for land preparation (small) and sowing (large).
2. Farmers were instructed to apply the fertilizer together with the seeds in the rows, and it is therefore expected
that the labor requirement for applying fertilizer will increase as well.
3. The labor input for weeding is expected to decrease as row planting should make weeding easier (ATA 2012).
4. We do not expect any significant effect on the labor requirement for harvesting or threshing.
5. Depending on how the labor allocated for each of these individual activities is altered, we expect total labor
inputs to increase or decrease.
Using the detailed data collected from the experimental plots, Table 5.2 shows the labor requirement for broadcasting
farmers per activity (“Constant”) in person-hours per hectare, while the “Row planting” column refers to the effect of
row planting on labor inputs for each activity. As expected, there is an increase in labor input for land preparation (but
not significant) and especially for the sowing operation. While broadcasting one hectare of teff on average only takes
23 person-hours, it requires an additional 156 extra person-hours for row planting (or about 20 person-days extra per
hectare). The labor requirement for applying fertilizer also increases significantly. Surprisingly, the labor requirement
for weeding also increases, in contrast to expectations. Row planting was expected to make weeding easier. This
finding may confirm statements from some farmers that high teff seeding rates help in controlling weeds. The labor
input for harvesting and threshing does not change. As a consequence of all these changes in labor inputs by activity,
the total labor requirements for row planting are significantly higher than for broadcasting. The total labor input to
produce a teff crop when the seed is broadcast is estimated to be 835 person-hours of labor, while implementing row
planting is estimated to require an additional total labor input of 305 person-hours. This corresponds to 119 and 162
person-days per hectare, respectively, representing an increase in labor of 37 percent when row-planting is used.
Table 5.2 Effect of the promotion of row planting on labor requirement and productivity
Obs. Constant s.e Row planting s.e.
Labor input (person-hours per hectare)
Land preparation 410 101*** (7.10) 14 (9.60)
Sowing 410 23*** (3.22) 156*** (10.51)
Applying fertilizer 410 11** (1.67) 57*** (5.46)
Weeding 410 251*** (18.77) 48** (23.34)
Harvesting 410 197*** (12.14) 11 (15. 51)
Threshing 410 253*** (16.93) 19 (22.47)
Total 410 835*** (38.02) 305*** (50.54)
Labor productivity (kg per person-hour)
Crop-cut output measure 383 1.758*** (0.11) -0.555*** (0.11)
Output declared after harvest 394 1.851*** (0.12) -0.497*** (0.12) Notes: Obs. is the number of observations. Constant refers to the average teff yield from traditional broadcasting, while row planting refers to the
yield increase obtained from row planting. Robust standard errors (se) are reported in parentheses. Asterisks represent level of statistical
significance at 10% (*), 5% (**) and 1% (***).
As was done for assessing land productivity, we assess the change in labor productivity using different output
measurements. Labor productivity is measured as total teff output (in kg) divided by total labor input (in person-hours)
for producing teff. This allows us to estimate the effect of row planting on respectively “labor productivity from crop-
cut” and “reported labor productivity after harvest” in the last two rows of Table 5.2. Row planting is shown to have a
strong and highly significant negative effect on labor productivity. Using the traditional broadcasting practice, farmers
are able to produce between 1.7-1.9 kg of teff for each person-hour of labor. When implementing row planting, this is
reduced to between 1.2 and 1.4 kg per person-hour. We find that row planting therefore decreases labor productivity
by between 27 and 35 percent.
6. TOWARDS UNDERSTANDING THE DETERMINANTS OF FARMERS’ ADOPTION OF ROW PLANTING
6.1 Cost-Benefit Analysis of row planting versus broadcasting
Farmers will switch from traditional broadcasting to row planting of teff only if the benefit of doing so outweighs the
costs. Implementing row planting tends to have a positive – yet moderate – yield effect, but it also requires
substantially more labor. Both effects can be combined in a simple cost-benefit-analysis (CBA) framework to analyze
whether it is profitable for the farmers in our sample to adopt row planting or not. This is done by comparing profits
(benefits minus costs) in each scenario. As found in our impact assessment, the benefits of row planting are increased
yield and reduced seed cost, while labor costs are higher. It is assumed that the use of other inputs (such as fertilizer) is
the same when implementing either row planting or broadcasting. The first column of Table 6.1 gives an overview of
the different changes in benefits and costs that are considered in this CBA. The output is valued at the market prices of
teff in Ethiopian birr (ETB).17 Farmer using row planting and those using traditional broadcasting face different costs
associated with different levels of use of labor and seed.
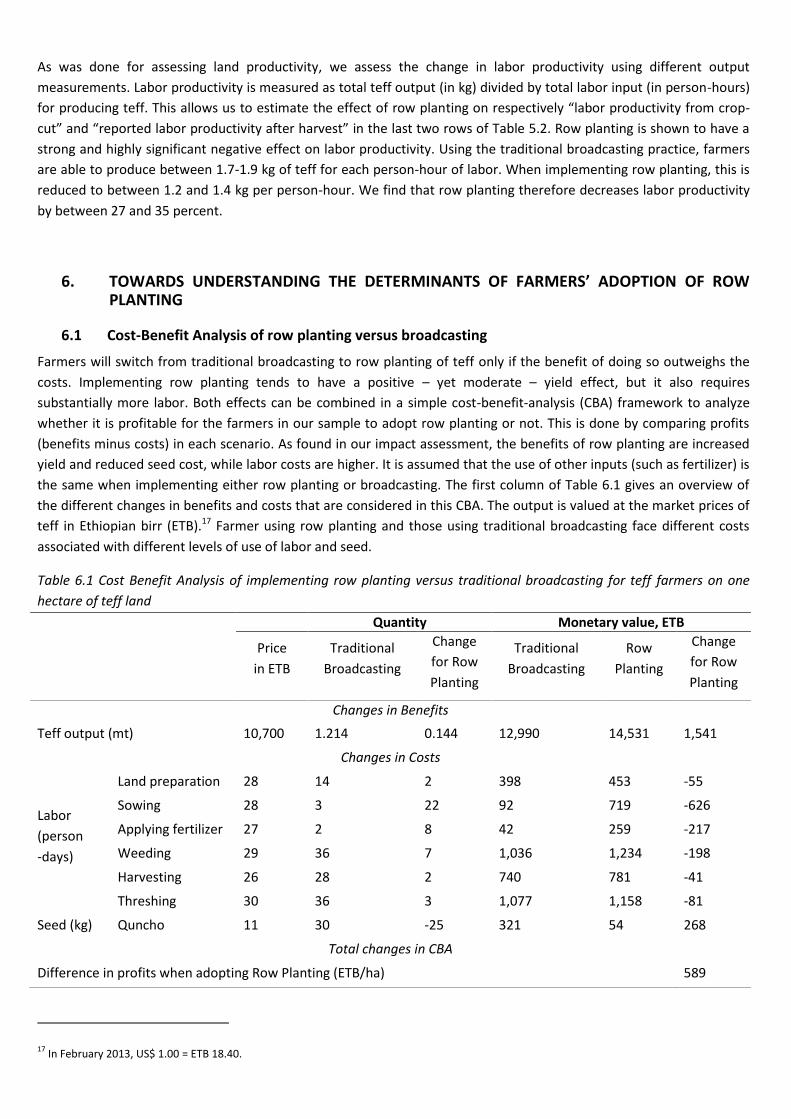
Table 6.1 Cost Benefit Analysis of implementing row planting versus traditional broadcasting for teff farmers on one
hectare of teff land
Quantity Monetary value, ETB
Price
in ETB
Traditional
Broadcasting
Change
for Row
Planting
Traditional
Broadcasting
Row
Planting
Change
for Row
Planting
Changes in Benefits
Teff output (mt) 10,700 1.214 0.144 12,990 14,531 1,541
Changes in Costs
Labor
(person
-days)
Land preparation 28 14 2 398 453 -55
Sowing 28 3 22 92 719 -626
Applying fertilizer 27 2 8 42 259 -217
Weeding 29 36 7 1,036 1,234 -198
Harvesting 26 28 2 740 781 -41
Threshing 30 36 3 1,077 1,158 -81
Seed (kg) Quncho 11 30 -25 321 54 268
Total changes in CBA
Difference in profits when adopting Row Planting (ETB/ha) 589
17 In February 2013, US$ 1.00 = ETB 18.40.
To measure profits in monetary values, we collected information about input and output prices from the AGP
community questionnaires for the AGP villages in Oromia. Average prices in ETB (per unit stated) across the different
villages in the AGP survey are presented in column 2. Teff prices refer to the price of one metric ton of white teff during
year prior to the survey, while wages are average daily wages for each production activity during the same year over all
villages. As prices were reported in person-days, we converted the unit of labor input into person-days (by assuming a
workday of 7 hours). As no information on the price of Quncho seed was collected at the time of planting, we
estimated this to be ETB 11 (based on the average CSA producer price data collected at that time of year).
We calculate the changes in monetary value of teff production for both sowing technologies for one hectare of land. To
do so, Table 6.1 reports the quantities of output obtained and input needed in teff production when using the
traditional broadcasting and row planting technologies, respectively. Output and labor data are the observed average
values taken from Table 5.1 (for reported yield after harvest) and Table 5.2. The seed rate for farmers who broadcast is
fixed at 30 kg/ha and for those who use row planting at 5 kg/ha. The final column of Table 6.1 then reports the
difference in ETB for each benefit or cost associated with teff production when planting is done by row planting rather
than traditional broadcasting, by multiplying prices by quantities.
The results in Table 6.1 show that, given the costs in teff production considered here and assuming a farmer reported
yield increase of 12 percent, the adoption of row planting is profitable for teff farmers. This is because the increase in
the monetary value of output sales (ETB 1,541) combined with seed saving (ETB 268) compensates for the costs
associated with the additional labor (ETB 1,219) required when implementing row planting.
However, when this analysis is done using the alternative yield data from the experimental plots that was obtained
using crop-cuts for which the average yield difference between the two planting techniques is much less, row planting
is shown not to be beneficial for teff farmers. Farmers using row planting would incur a loss of more than ETB 700 per
ha. Using the crop-cut yield data on teff output, the labor cost of row planting (ETB 1,219) outweighs the benefits of
row planting associated with slightly higher output sales (ETB 214) and seed saving (ETB 268). Hence, the yield increase
achieved by farmers using row planting together with the labor requirements for doing so determine whether row
planting is more profitable for teff farmers than the traditional broadcast method of planting. Therefore, the next
sections look at two potential interventions that might make the adoption of row planting more assuredly beneficial to
teff farmers by the means of a sensitivity analysis of the above CBA.
6.2 Learning by doing
When farmers adopt new technologies, the efficient implementation of those technologies to lead to higher yield
benefits and lower labor costs over time requires some learning over time as the farmers get more familiar with the
technology. This could explain why studies of various teff planting techniques in more supervised and controlled
settings (McGuire 2013) found teff yield increases under row planting of at least twice those obtained when traditional
broadcasting was used. In such studies, farmers were more intensively trained and assisted by private extension agents
on the correct implementation of the row planting technology. To illustrate the effects of differential yield increases
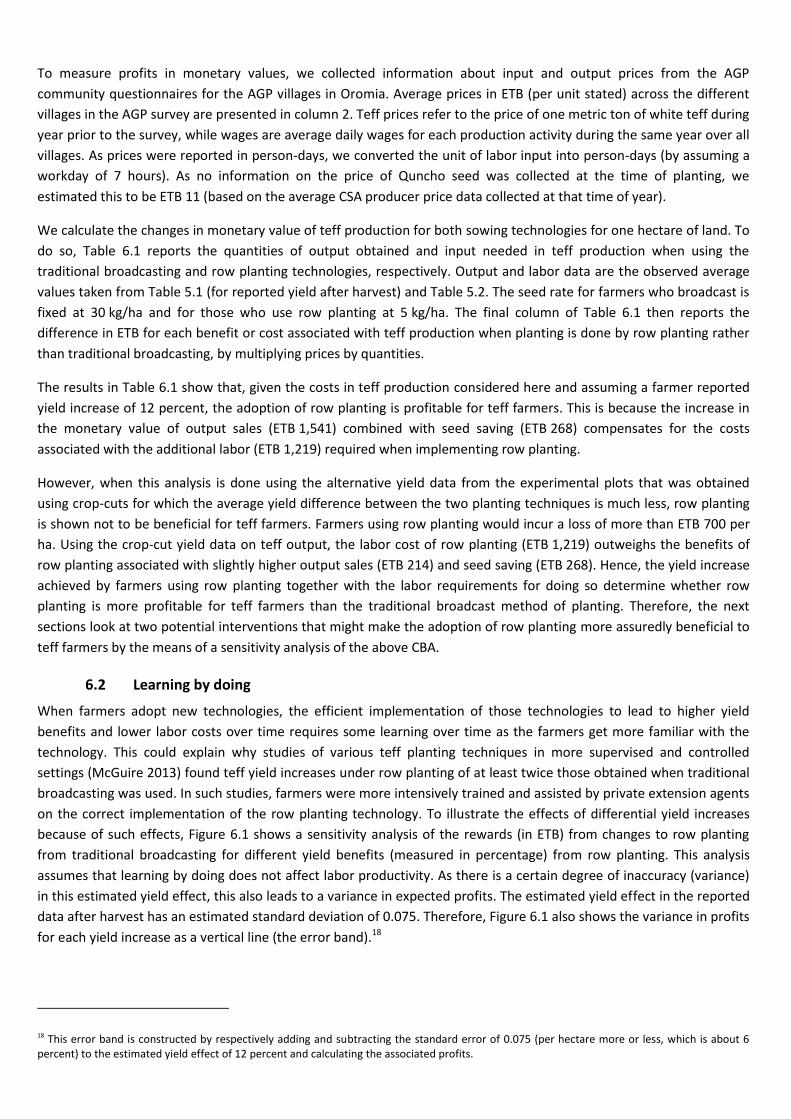
because of such effects, Figure 6.1 shows a sensitivity analysis of the rewards (in ETB) from changes to row planting
from traditional broadcasting for different yield benefits (measured in percentage) from row planting. This analysis
assumes that learning by doing does not affect labor productivity. As there is a certain degree of inaccuracy (variance)
in this estimated yield effect, this also leads to a variance in expected profits. The estimated yield effect in the reported
data after harvest has an estimated standard deviation of 0.075. Therefore, Figure 6.1 also shows the variance in profits
for each yield increase as a vertical line (the error band).18
18 This error band is constructed by respectively adding and subtracting the standard error of 0.075 (per hectare more or less, which is about 6 percent) to the estimated yield effect of 12 percent and calculating the associated profits.
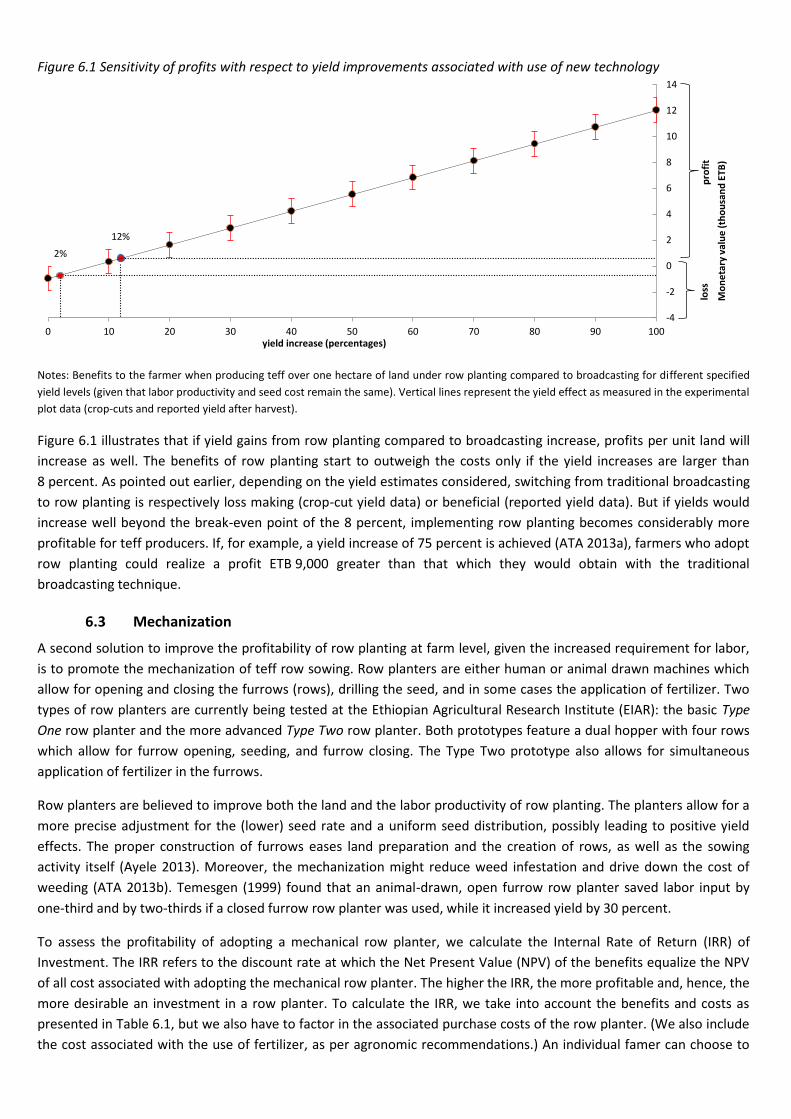
Figure 6.1 Sensitivity of profits with respect to yield improvements associated with use of new technology
Notes: Benefits to the farmer when producing teff over one hectare of land under row planting compared to broadcasting for different specified
yield levels (given that labor productivity and seed cost remain the same). Vertical lines represent the yield effect as measured in the experimental
plot data (crop-cuts and reported yield after harvest).
Figure 6.1 illustrates that if yield gains from row planting compared to broadcasting increase, profits per unit land will
increase as well. The benefits of row planting start to outweigh the costs only if the yield increases are larger than
8 percent. As pointed out earlier, depending on the yield estimates considered, switching from traditional broadcasting
to row planting is respectively loss making (crop-cut yield data) or beneficial (reported yield data). But if yields would
increase well beyond the break-even point of the 8 percent, implementing row planting becomes considerably more
profitable for teff producers. If, for example, a yield increase of 75 percent is achieved (ATA 2013a), farmers who adopt
row planting could realize a profit ETB 9,000 greater than that which they would obtain with the traditional
broadcasting technique.
6.3 Mechanization
A second solution to improve the profitability of row planting at farm level, given the increased requirement for labor,
is to promote the mechanization of teff row sowing. Row planters are either human or animal drawn machines which
allow for opening and closing the furrows (rows), drilling the seed, and in some cases the application of fertilizer. Two
types of row planters are currently being tested at the Ethiopian Agricultural Research Institute (EIAR): the basic Type
One row planter and the more advanced Type Two row planter. Both prototypes feature a dual hopper with four rows
which allow for furrow opening, seeding, and furrow closing. The Type Two prototype also allows for simultaneous
application of fertilizer in the furrows.
Row planters are believed to improve both the land and the labor productivity of row planting. The planters allow for a
more precise adjustment for the (lower) seed rate and a uniform seed distribution, possibly leading to positive yield
effects. The proper construction of furrows eases land preparation and the creation of rows, as well as the sowing
activity itself (Ayele 2013). Moreover, the mechanization might reduce weed infestation and drive down the cost of
weeding (ATA 2013b). Temesgen (1999) found that an animal-drawn, open furrow row planter saved labor input by
one-third and by two-thirds if a closed furrow row planter was used, while it increased yield by 30 percent.
To assess the profitability of adopting a mechanical row planter, we calculate the Internal Rate of Return (IRR) of
Investment. The IRR refers to the discount rate at which the Net Present Value (NPV) of the benefits equalize the NPV
of all cost associated with adopting the mechanical row planter. The higher the IRR, the more profitable and, hence, the
more desirable an investment in a row planter. To calculate the IRR, we take into account the benefits and costs as
presented in Table 6.1, but we also have to factor in the associated purchase costs of the row planter. (We also include
the cost associated with the use of fertilizer, as per agronomic recommendations.) An individual famer can choose to
-4
-2
0
2
4
6
8
10
12
14
0 10 20 30 40 50 60 70 80 90 100
Mo
ne
tary
val
ue
(th
ou
san
d E
TB)
yield increase (percentages)
pro
fit
loss
2%
12%
adopt the cheaper Type One or more expensive Type Two row planter priced at ETB 5,000 and ETB 8,000, respectively.
We assume that both types achieve (at least) the same yield increase over broadcast seeding of 2 or 12 percent, i.e.,
the same yield increment from implementing row planting by hand.19 As the main benefit of row planting by machine is
the reduction in workload and labor cost compared to row planting by hand, we allow the row planter to achieve
different levels of labor input savings, i.e., the number of person-hours that can be saved when using a mechanical row
planter instead of doing row planting by hand.20
Figure 6.2 shows the high IRR that farmers can achieve when adopting a row planter for different labor use inputs (in
percentages). Figure 6.2 distinguishes between the Type One and Type Two row planter and between the two yield
increases measured in our data. 21 Due to its lower initial cost, the Type One row planter has a higher IRR than the Type
Two. If a labor input reduction of 50 percent is achieved and the row planter has a timespan of 5 years, the IRR for the
Type One row planter is 163 percent while the IRR for the Type Two row planter is 102 percent. Figure 6.2 also shows
that the IRR increases if the adoption of the row planter achieves a higher reduction in labor input. Finally, the effect of
higher yield levels is illustrated by comparing the IRR based on both the yield increases measured in the crop-cut and
reported yield data. As expected, the higher yield increase measured in the reported data implies a higher IRR for the
row planters.
Figure 6.2 Sensitivity of Internal Rate of Return to row planter type and labor input saving when buying a row planter
Notes: Internal Rate of Return (IRR) for the farmer when buying a Type One row planter (at ETB 5,000: above two lines) or a Type Two row planter
(at ETB 8,000: below two lines) when farming one hectare of teff under row planting. For each type, the upper (straight) line assumes the yield
increase of 12 percent measured in the reported yield data, while the lower (dotted) line assumes a yield increase of 2 percent as measured in the
crop-cut yield data. Different levels of input saving are assumed as well as a depreciation rate of 5 years.
19 This is likely an underestimation of the yield effect of the row planter, as it should allow for additional yield improvements over row planting by hand. Moreover, the Type Two row planter allows for simultaneous application of seeds and fertilizer and should therefore have additional yield and labor effects. Figure 6.1 illustrates the effect of different yield levels on the profitability of a row planter, including those much higher than 2 or 12 percent. As we expect the row planter to achieve higher yield levels than 2 or 12 percent, these numbers can be interpreted as lower bounds for assessing the actual profitability of the row planters. 20 The labor saving effect of the row planting should be expressed in constructing the rows as well as weeding and applying fertilizer. We thereby assume that the row planter affects both planting and land preparation and general cultivation. For simplicity, we assume that the row planter affects both activities in the same way (e.g. a 10 percent increase in labor input, corresponds to 30 person-hours less for sowing and 36 person-hours less for cultivation). 21
A depreciation rate of 5 years is assumed. Assuming a depreciation rate of 10 years has a small positive effect on the IRR (about two percent).
50
70
90
110
130
150
170
190
210
230
250
0 10 20 30 40 50 60 70 80 90 100
Inte
rnal
Rat
e o
f R
etu
rn (
%)
Labor input saving (%)
Typ
e O
ne
Typ
e Tw
o
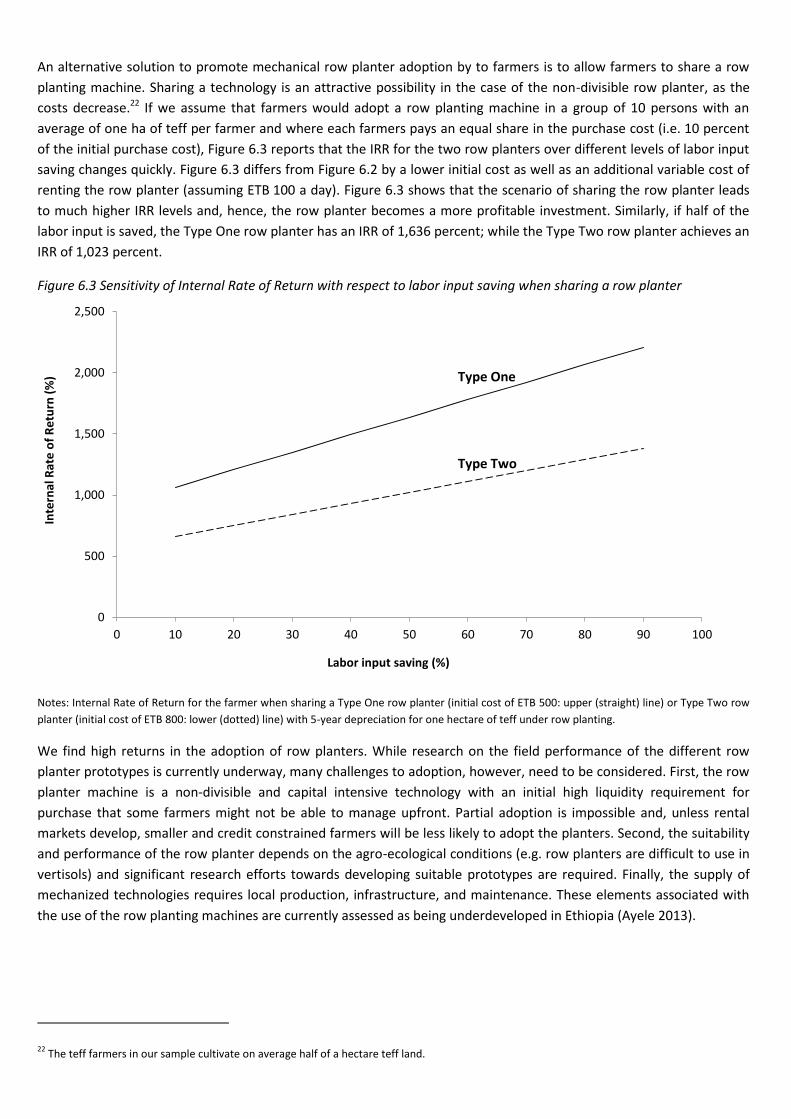
An alternative solution to promote mechanical row planter adoption by to farmers is to allow farmers to share a row
planting machine. Sharing a technology is an attractive possibility in the case of the non-divisible row planter, as the
costs decrease.22 If we assume that farmers would adopt a row planting machine in a group of 10 persons with an
average of one ha of teff per farmer and where each farmers pays an equal share in the purchase cost (i.e. 10 percent
of the initial purchase cost), Figure 6.3 reports that the IRR for the two row planters over different levels of labor input
saving changes quickly. Figure 6.3 differs from Figure 6.2 by a lower initial cost as well as an additional variable cost of
renting the row planter (assuming ETB 100 a day). Figure 6.3 shows that the scenario of sharing the row planter leads
to much higher IRR levels and, hence, the row planter becomes a more profitable investment. Similarly, if half of the
labor input is saved, the Type One row planter has an IRR of 1,636 percent; while the Type Two row planter achieves an
IRR of 1,023 percent.
Figure 6.3 Sensitivity of Internal Rate of Return with respect to labor input saving when sharing a row planter
Notes: Internal Rate of Return for the farmer when sharing a Type One row planter (initial cost of ETB 500: upper (straight) line) or Type Two row
planter (initial cost of ETB 800: lower (dotted) line) with 5-year depreciation for one hectare of teff under row planting.
We find high returns in the adoption of row planters. While research on the field performance of the different row
planter prototypes is currently underway, many challenges to adoption, however, need to be considered. First, the row
planter machine is a non-divisible and capital intensive technology with an initial high liquidity requirement for
purchase that some farmers might not be able to manage upfront. Partial adoption is impossible and, unless rental
markets develop, smaller and credit constrained farmers will be less likely to adopt the planters. Second, the suitability
and performance of the row planter depends on the agro-ecological conditions (e.g. row planters are difficult to use in
vertisols) and significant research efforts towards developing suitable prototypes are required. Finally, the supply of
mechanized technologies requires local production, infrastructure, and maintenance. These elements associated with
the use of the row planting machines are currently assessed as being underdeveloped in Ethiopia (Ayele 2013).
22 The teff farmers in our sample cultivate on average half of a hectare teff land.
0
500
1,000
1,500
2,000
2,500
0 10 20 30 40 50 60 70 80 90 100
Inte
rnal
Rat
e o
f R
etu
rn (
%)
Labor input saving (%)
Type One
Type Two
7. CONCLUSIONS AND IMPLICATIONS
Given the limits on suitable arable land and a rapidly growing population, Ethiopia will need to scale up the adoption of
yield-increasing technical innovations to ensure continued agricultural growth and to safeguard national food security.
We study here the case of row planting of teff in Ethiopia with the aim to gain more insights into how the promotion of
improved technologies can possibly increase farmers’ teff production. Teff is Ethiopia’s most important staple crop, but
the national yield levels are low. Traditionally, teff seed is broadcasted at high seed rates (typically 30 kg per hectare). It
is believed that this impedes teff production because the uneven seed distribution makes weeding more difficult and
increases competition between seedlings. By planting seed in rows at a low seed rate instead, yields have been shown
to improve significantly in agronomic trials conducted on research stations. Field demonstrations of row planting
showed that teff yields increased on average by 70 percent compared to the national average (ATA 2013). As a
consequence, these new technologies have been promoted to Ethiopian teff farmers on a large scale. However, there is
a lack of reliable and objective data to measure the impact of widespread promotion campaigns of such improved teff
technologies.
The goal of this analysis is to fill this gap and provide evidence on the impact of the promotion of row planting of teff at
farm level. We combine quantitative and qualitative data to assess the effect of the promotion campaign on teff
farmers. Our main findings are the following. First, exposed farmers are found to have a positive attitude towards row
planting (and reduced seed rates in general) and believe that row planting has a large yield increasing potential. Many
plan to adopt row planting, but only on a relatively small part of their plots, seemingly indicating that they are
concerned with the labor requirement and that they need more knowledge and experience in implementing the
technology.
Second, by implementing row planting, farmers experienced an increase in teff yield of between 2 and 12 percent, on
average, depending on the measure of yield used. While these results are promising, they are in contrast with the
larger impacts measured in more controlled settings (ATA 2013b, McGuire 2013, Abayu 2012, Tolosa 2012) or with
farmers’ expectations. Our results cannot be directly compared to other sources, but they seem to be in line with
farmers’ perceptions in the field (Assefa 2014). An intensive support program to significantly raise teff yields with use of
the new technologies, as provided in the experimental settings, would require public resources that are not readily
available. As such, the results of our impact evaluation are likely to approach the impact that would be achieved if a
national program were to be rolled out along these lines.
The low magnitude of the estimated yield effect of row planting of teff, in our case, is seemingly related to farmer field
conditions and the design of the experiment. The previous high yield benefits were measured at research stations or on
demonstration plots, while our yield benefits reflect the effect of a promotion program at farm level, which takes into
account farm level realities and possible deficiencies in the extension program. Farmers might face different constraints
in implementing new technologies on their farms than in research settings, and they might lack technical support
because of implementation problems with the promotion campaign. Our yield benefits further measure the direct
effect of row planting, as we were able to separate the sowing effect from other benefits related to the package or
other factors that may confound the effect of row planting. In contrast with other assessments, farm level data were
further collected by independent enumerators; the row planting treatment was randomized over similar farmers, all
participating farmers received the same inputs; and safeguards were put in place to control farmers’ inaccurate yield
assessment, exaggerated expectations, and possible influence by extension agents and media.
Third, we find that there is a substantial increase in labor input in the case of row planting. As expected, additional
labor input is needed for sowing the seeds in rows and applying the fertilizer. The total person-hours needed to row
plant one hectare of teff is more than one third higher than in the case of traditional broadcasting, and it is estimated
that row planting requires about 43 person-days of extra work per hectare compared to traditional broadcasting. We
also found that row planting not only increases total labor requirements, but also significantly decreases labor
productivity by between 28 percent and 35 percent. This implies that farmers need to invest more labor in teff
production to obtain the same output that they would get from broadcasting. This finding is crucial, as the most
important yardstick for farmers’ adoption is not increased land productivity, but labor productivity (Moser and Barrett
2006).
Fourth, we combine both the land and labor productivity effects in a Cost-Benefit Analysis (CBA) for a comparison of
the adoption of row planting with traditional broadcasting. As the cost of the additional labor requirement is
compensated by the benefits teff farmers receive from implementing row planting, they earn ETB 589 in the self-
reported yield data and incur a loss of ETB 700 in the crop-cut data. The CBA shows that the increase in teff yield
outweighs the cost of the extra labor in the first year of adoption if yields increase by more than 8 percent and makes
the investments worthwhile. Moreover, our results also suggest that the adoption of suitable and functional row
planters have high returns to investments and that farmers with access to such row planter would be able to reduce
their labor requirements for the implementation of row planting (and possibly have an additional yield increasing effect
as well).
Our study points to a number of policy recommendations. First, it seems that more effort should be put into the design
and implementation of the promotion campaigns for improved teff technologies. There is often a big gap between the
supply of new technologies and their efficient adoption, since innovations spread slowly and require different
management skills (Moser and Barrett 2006, Duflo et al. 2008, Collier and Dercon 2011). Farmers need to be allowed to
learn, therefore continuous efforts in the extension of field assistance to farmers are needed. Correct implementation
of the technology is expected to bring about larger yield increases, as illustrated by the agronomic research results in
controlled settings (and our CBA). Second, the extra cost of labor requirements is not sufficiently taken into account in
the current program design. The development of a suitably adapted mechanical row planter to stimulate the adoption
of row planting should have large rates of return and lead to higher adoption rates. Third, on-farm constraints towards
adoption should be further assessed with careful monitoring, learning, and evaluation, all of which are required to
improve extension approaches for successful scaling-up of adoption of the row planting technology for teff.
8. REFERENCES
Abayu, B. 2012. “Agronomic and Economic Effects of Blended Fertilizers under Planting Method on Yield And Yield
Components of Tef In Wereda Laelay Maychew, Central Tigray, Ethiopia”. Master thesis. Mekelle University,
Mekelle, Ethiopia.
Assefa, K., S. Aliye, G. Belay, G. Metaferia, H. Tefera, and M. E. Sorrells. 2011. “Quncho: The First Popular Tef Variety in
Ethiopia.” International Journal of Agricultural Sustainability 9(1): 25–34.
Assefa, K. 2014. "Personal communication".
Ayele, S. 2013. "Improved access and use of mechanization in the tef value chain". Presentation made for the
conference on 'Improved evidence towards better policies for the tef value chain'. Addis Ababa, Ethiopia.
ATA (Agricultural Transformation Agency). 2012. "Annual Report: Transforming Agriculture in Ethiopia”. Addis Ababa,
Ethiopia.
ATA (Agricultural Transformation Agency). 2013a. “Value Chain Programs: Tef.”
http://www.ata.gov.et/programs/value-chain-programs/tef/ [accessed online on 15/07/2013].
ATA (Agricultural Transformation Agency). 2013b. “Working Strategy for Strengthening Ethiopian’s Tef Value Chain
Vision, Systemic Challenges, and Prioritized Interventions”. Addis Ababa, Ethiopia.
ATA (Agricultural Transformation Agency). 2013c. “Results of 2012 New Tef Technologies Demonstration Trials Draft
Report”. Addis Ababa, Ethiopia.
Berhane, G., Z. Paulos, and K. Tafere. 2011. Foodgrain Consumption and Calorie Intake Patterns in Ethiopia. ESSP II
Working Paper 23. International Food Policy Research Institute (IFPRI). Addis Ababa, Ethiopia.
Berhe, T., Z. Gebretsadik, S. Edwards, and H. Araya. 2011. “Boosting Tef Productivity Using Improved Agronomic
Practices and Appropriate Fertilizer.” In Achievements and Prospects of Tef Improvement. Proceedings of the
Second International Workshop, November 7-9, 2011, Debre Zeit, Ethiopia, edited by K. Assefa, T. Solomon,
and Z. Chanyalew, 133–140.
Carletto, C., S. Savastano, and A. Zezza. 2013. “Fact or Artifact: The Impact of Measurement Errors on the Farm Size–
productivity Relationship.” Journal of Development Economics 103: 254–261.
Collier, P., and S. Dercon. 2011. “African Agriculture in 50 Years: Smallholders in a Rapidly Changing World?” In Expert
Meeting on How to Feed the World in 2050. University of Oxford. Oxford, England.
CSA (Central Statistical Agency). 2013. “Agricultural Sample Survey: Area and Production of Major Crops, Meher
Season”. Vol. I. Addis Ababa, Ethiopia.
De Groote, H., and O. Traoré. 2005. “The Cost of Accuracy in Crop Area Estimation.” Agricultural Systems 84 (1): 21–38.
Duflo, E., M. Kremer, and J. Robinson. 2008. “How High Are Rates of Return to Fertilizer ? Field Experiments in Evidence
from Kenya.” The American Economic Review 98(2): 482–488.
Fufa, B., B. Behute, R. Simons, and T. Berhe. 2011. “Tef Diagnostic Report: Strengthening the Tef Value Chain in
Ethiopia”. Addis Ababa, Ethiopia.
Habtegebrial, K., B.R. Singh, and M. Haile. 2007. “Impact of Tillage and Nitrogen Fertilization on Yield, Nitrogen Use
Efficiency of Tef (Eragrostis Tef (Zucc.) Trotter) and Soil Properties.” Soil and Tillage Research 94(1): 55–63.
IDEO, 2014. "Building a low cost teff seed planter". IDEO.org [http://www.ideo.org/projects/building-a-low-cost-teff-
seed-planter]
McGuire, T. 2013. “Personal Communication.”
Minten, B., S. Tamru, E. Engida, and T. Kuma. 2013. Ethiopia’s Value Chains on the Move : The Case of Teff. ESSP II
Working Paper 52. International Food Policy Research Institute (IFPRI). Addis Ababa, Ethiopia.
Moser, C.M., and C. B. Barrett. 2006. “The Complex Dynamics of Smallholder Technology Adoption: The Case of SRI in
Madagascar.” Agricultural Economics 35(3): 373–388.
Temesgen, M. 1999. "Animal-drawn implements for improved cultivation in Ethiopia: participatory development and
testing." Improving Farmers’ Animal Traction. Proceedings of the Workshop of the Animal Traction Network for
Eastern and Southern Africa (ATNESA). Mpumalanga, South Africa.
Tolosa, S. 2012. “Effects of Inorganic Fertilizer Types and Sowing Methods of Variable Seed Rates on Yield and Yield
Components of Tef [Eragrostis Tef (zucc.)Trotter] in Ada’a Woreda, Central Ethiopia”. Master thesis. Haramaya
University. Haramaya, Ethiopia.
Vandercasteelen, J., Dereje, M., Minten, B., and A. S. Taffesse. 2013. Scaling-up adoption of improved technologies: The
impact of the promotion of row planting on farmers’ teff yields in Ethiopia. ESSP II Working Paper 60.
International Food Policy Research Institute (IFPRI). Addis Ababa, Ethiopia.