Embed Size (px)
Citation preview
LICOS Discussion Paper Series
Discussion Paper 268/2010
How the East Was Won:
The Foreign Take-Over of the Eastern European Brewing Industry
Johan F.M. Swinnen and Kristine Van Herck
Katholieke Universiteit Leuven LICOS Centre for Institutions and Economic Performance Waaistraat 6 – mailbox 3511 BELGIUM TEL:+32-(0)16 32 65 98 FAX:+32-(0)16 32 65 99
http://www.econ.kuleuven.be/licos
1
How the East Was Won:
The Foreign Take-Over of the
Eastern European Brewing Industry
Johan F.M. Swinnen and Kristine Van Herck
LICOS Centre for institutions and Economic Performance
Catholic University of Leuven (KUL)
(Version: October 2010)
2
1 Introduction
Eastern Europe is an important player in the European and even in the world beer market.
In 2008, the whole of Europe accounted for 32% of total beer production in the world and
Eastern Europe accounted for more than half of this (17%). Within Eastern Europe, Russia,
Ukraine, Poland and the Czech Republic are the major beer producers and consumers. Russia, by
itself, is the third largest producer of beer in the world and accounted for more than 6% of the
world beer production in 2009.
The beer market, like all markets in the former communist countries, has been strongly
affected by the economic reforms in the beginning of the 1990s. Beer production and
consumption was high and strongly regulated under the communist system. But since the 1990s,
the brewing industry in Eastern Europe went through dramatic changes.
The economic and political reforms in the early 1990s led to major disruptions in the
economic system. Consumption fell with declining incomes and high inflation. At the production
side, the combination of price liberalizations, cuts in subsidies, the introduction of hard budget
constraints and a weak legal environment caused a substantial decline in the production of barley,
malt and beer in the first years after transition.
However, the brewery sector soon attracted much interest from foreign investors. The
combination of a substantial beer consumer market, privatization of the brewing companies,
liberalization of the investment regimes, and closeness to the (West) European home market
induced a massive inflow of foreign investment by mostly Western European brewing
companies. In fact, in a few years time all the main breweries in Eastern Europe were taken over
by foreign brewing companies.
3
When foreign breweries invested in the Eastern European beer industry, they faced a
problem sourcing sufficient high quality malt in order to produce high quality beer. The local
financially distressed malting companies and farms were not able to produce the high quality
malt and barley that was needed. Therefore, foreign brewers initially imported malt from their
traditional Western European suppliers. However soon afterwards, they started investing in
innovative contracts with local malt producers and, further upstream, with barley farms and seed
companies. In doing so, they reintroduced vertical coordination in the supply chain to obtain malt
and barley that consistently met their quality requirements. Contracts often included assistance
programs to barley farms such as the provision of inputs, technical assistance and credit.
Since the late 1990s economic growth and later the accession to the EU led to substantial
improvement of incomes, better functioning market institutions, and subsidies to farms in the new
EU member states. In combination, these factors reduced constraints in the supply chains. This,
in turn, reduced the need for brewers and malting companies to provide credit or inputs to farms,
and hence led to a decrease in vertical coordination.
This chapter describes and analyzes this dramatic restructuring of the beer industry and its
supply chain over the past two decades. First, we analyze changes in the consumption and
production in the region. Next, we discuss how different factors have affected the supply chain in
the Eastern European beer market and document these general changes with comparative data
and detailed case study evidence from the Slovakian beer and malting industry. Finally, we draw
some conclusions.
4
2 The Eastern European Beer Market
2.1 Communist Period
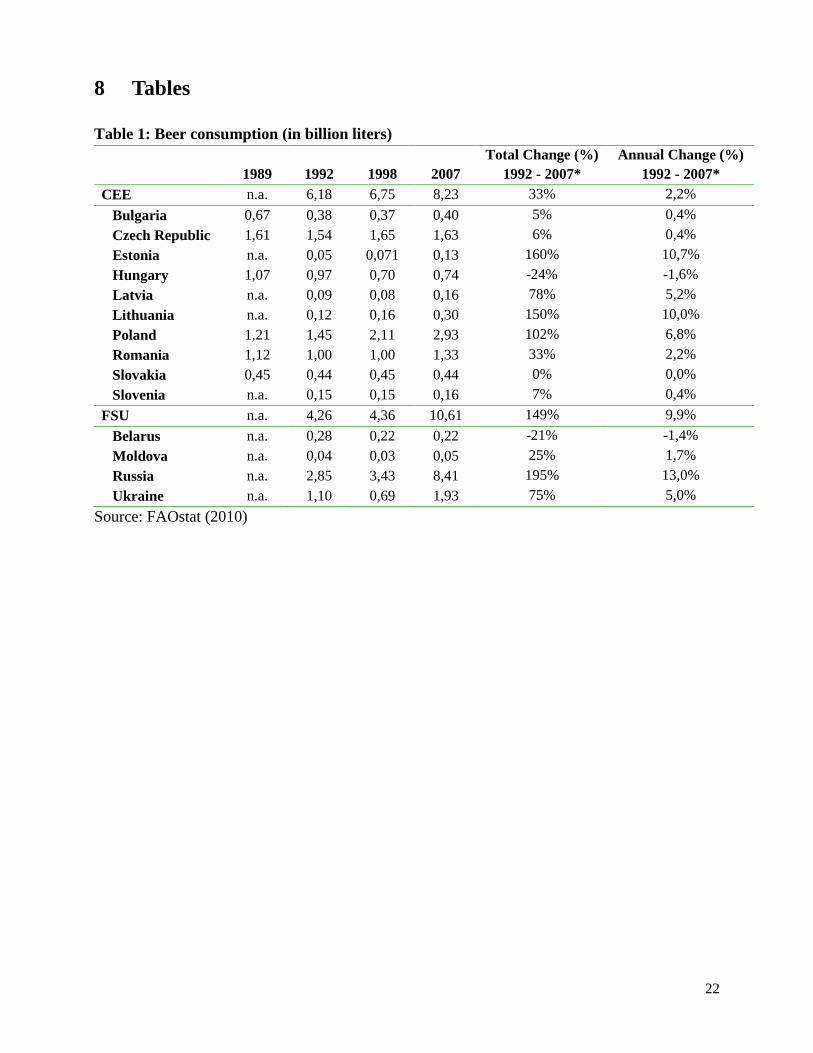
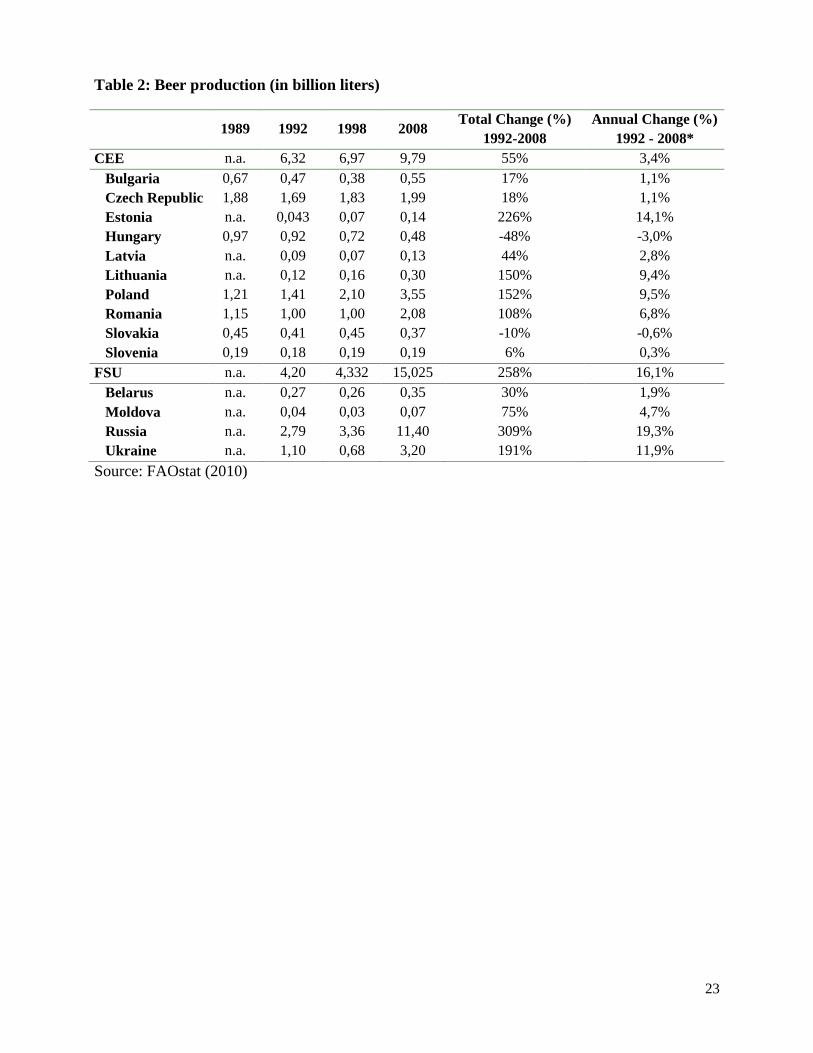
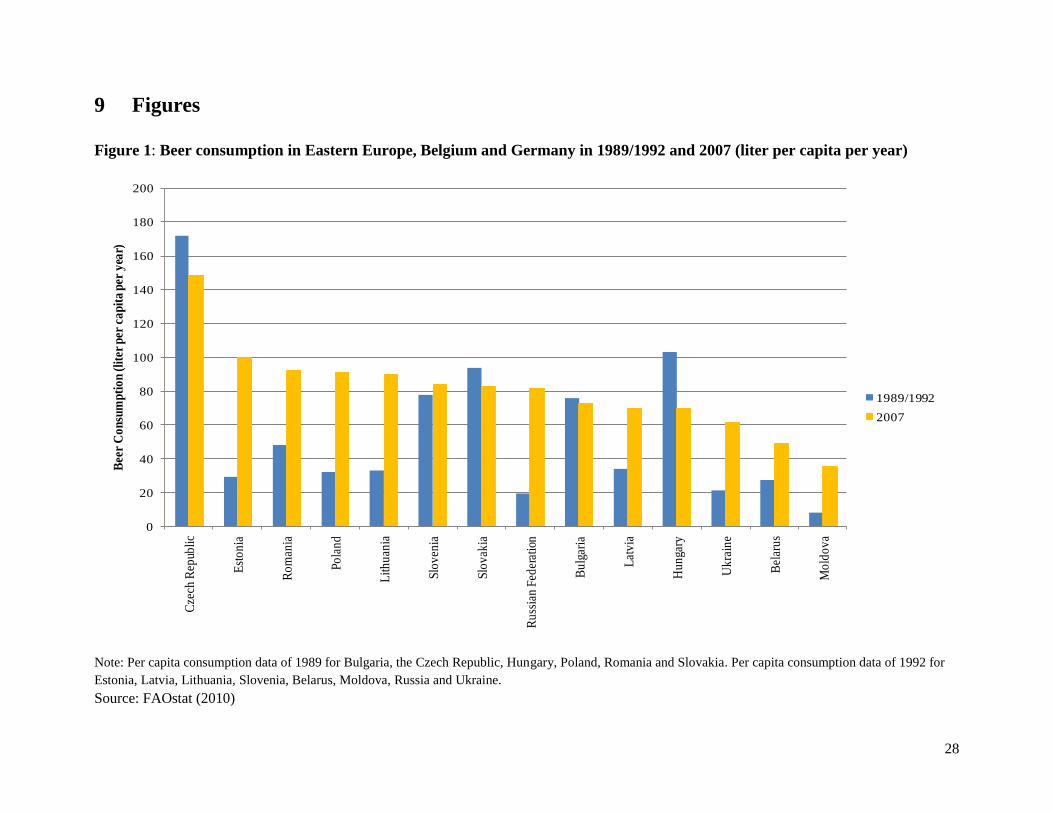
In 1989, before the reforms started, beer consumption and production was the highest in
Russia, followed by the Czech Republic (Table 1 and Table 2). The main driver for high
consumption and production in Russia was not so much high per capita consumption, but its large
market size. In contrast, in the Czech Republic consumption per capita was very high (Figure 1).
In the Czech Republic, per capita consumption of beer was the highest in Eastern Europe and
even in the world. In 1989, the average Czech citizen consumed around 170 liters beer per capita.
In Hungary and Slovakia, beer consumption per capita was respectively 103 and 94 liters per
capita. These consumption levels are comparable with per capita consumption in traditional beer-
loving countries in the EU15, such as Belgium and Germany, where per capita consumption in
1989 was respectively approximately 120 and 140 liters per capita. In Poland and Russia, these
figures were considerably lower, around 30 liters per capita in Poland and 20 liters per capita in
Russia1.
2.2 Reform and Transition
The beer market, like all markets in the former communist countries, has been strongly
affected by the economic reforms in the beginning of the 1990s. However, the reforms did not
affect the beer markets in the different Eastern European countries in the same way. We can
distinguish several patterns (Larimo et al., 2006) (Table 1 and Table 2).
1 Per capita consumption was 20 liters in the USSR in 1989 and 19 liters in Russia and 21 liters in Ukraine in 1992 -
the first year for which data are available for the ex-USSR countries.
5
First, there are countries in which consumption and production decreased slightly in the
first years of transition, but recovered rapidly and remained relatively stable at the pre-transition
levels. Examples are countries with high per capita consumption, such as the Czech Republic and
Slovakia.
Second, in some countries consumption and production declined strongly during transition.
For example, in Hungary beer consumption declined annually by 1,6% and beer production by
3,0% since the beginning of the 1990s. Also in Bulgaria consumption and production decreased
sharply.
Third, in some countries consumption and production increased strongly, sometimes even
dramatically. For example, Polish beer consumption more than doubled. In 1989, it was 1,2
billion liters, while in 2007 it was 2,9 billion liters. Also Polish beer production strongly
increased and in past two decades beer production tripled.
In many countries of the Former Soviet Union (FSU), including the Baltic states, Russia,
Ukraine and also Romania, consumption and production increased strongly in recent years, but
after a temporary decline in the mid 1990s. For example, in Russia beer consumption in 1992 was
2,9 billion liters and after an initial decline in the mid 1990s, consumption started to increase
rapidly. By 2007, consumption was three times higher than the 1992-level. Russian beer
production shows a similar pattern: in 1992 production was approximately 2,8 billion liters and
after an initial decline, production started to increase by more than 19% per year. In 2008,
production was approximately four times higher than the production in 1992. Similar results hold
for the Baltic states, Ukraine and Romania, but consumption and production growth were more
moderated compared to Russia, except for Estonia where production and consumption increased
by respectively 14% and 11% per year.
6
2.3 The Current Situation
Despite a small decline compared to 1989, beer consumption per capita in the Czech
Republic is still the highest in all of Europe, in the range of 145 liters per capita in 2007 (Figure
1)2. In the other high income countries in region, such as Slovenia, Slovakia, Hungary and
Poland, per capita consumption ranges between more than 80 liters per capita in Slovenia and 70
liters per capita in Hungary. In Russia and Ukraine, consumption per capita more than tripled
compared to consumption in 1992 and currently, consumption in Russia and Ukraine exceeds
respectively 80 and 60 liters per capita. In Belarus and Moldova, the poorest countries in the
region, per capita consumption is low and ranges between 50 liters per capita in Belarus and only
slightly more than 35 liters per capita in Moldova.
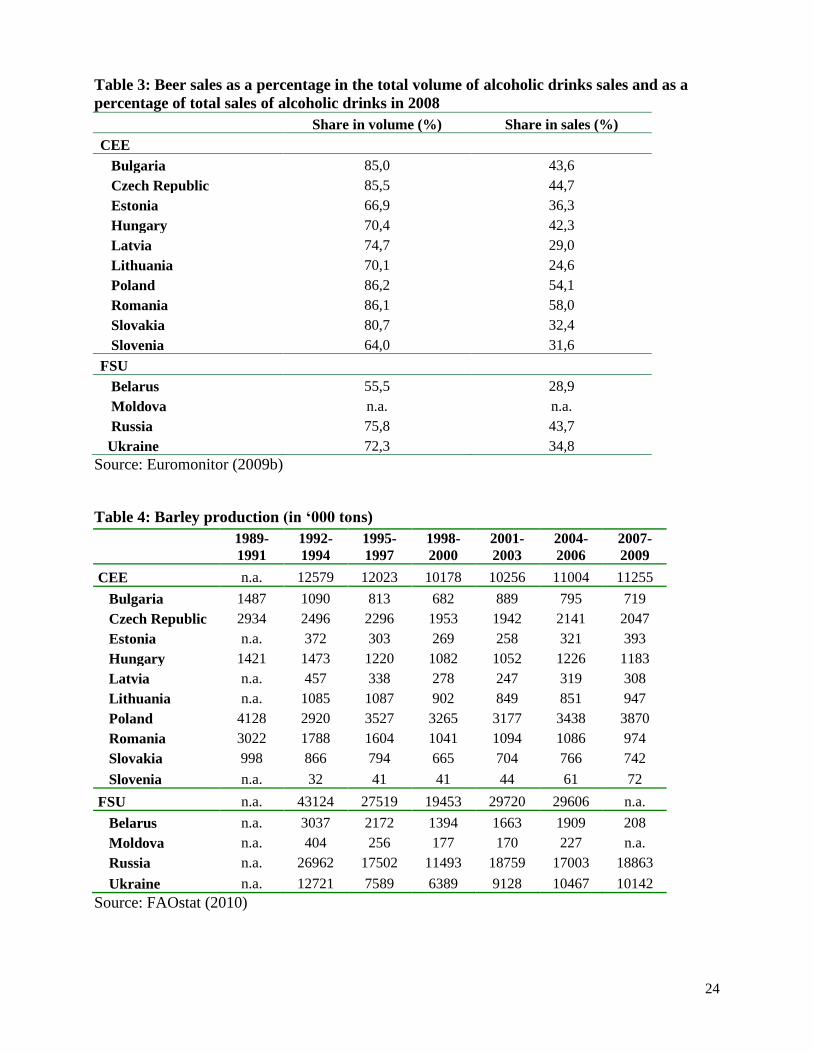
The sales of beer represent more than half of the total volume of alcoholic drinks that are
sold in all countries in 2008 (Table 3). However, there are important differences between
countries. In Poland, the Czech Republic, Slovakia, Romania and Bulgaria this percentage
exceeds 80%. In the Russia and Ukraine, where strong spirits such as vodka are the traditional
alcoholic drinks, beer represents respectively 76% and 72% of the total sales volume of alcoholic
drinks. Also in the Baltic states, the share of beer is relatively low due to the popularity of strong
spirits (Euromonitor, 2009b).
The share of beer sales in the value of sales of alcoholic drinks is lower than its share in
volume (Table 3). In Romania and Poland, beer sales represent more than 50% of the total value
of alcoholic drinks sales. In Lithuania and Latvia, the share of beer sales in the total value of
alcoholic drinks sales is the lowest in Eastern Europe, namely respectively 25% and 29%.
2 This is considerably more than the consumption in Belgium and Germany, where consumption per capita is
currently approximately 100 liters per capita.
7
Russia is an interesting case as there has been a dramatic shift from consumption of vodka
to beer over the past fifteen years (Deconinck and Swinnen, 2010). The share of beer is now
around 75% in volume terms and 45% in value terms, much higher than in the Communist
period. The sharp increase of beer consumption has turned Russia into one of the largest beer
markets in the world.
3 Privatization and Disintegration of the Beer Chain in the 1990s
Before 1989, beer production, like all agricultural and food production systems in the
former communist countries, was fully integrated and state-controlled (Rozelle and Swinnen,
2004). Every step in the supply chain, from barley production to malting and brewing and to
retailing, was organized by the central command system. In general, barley production was
organized in large cooperative or state farms, except for Poland and former Yugoslavia. Central
planning organized the provision of inputs to these farms and they sold the produced barley to
state owned malting and brewing enterprises which had a monopoly position in beer sales in the
region.
In the beginning of the 1990s the former communist countries liberalized their economies.
This had a substantial impact on the entire supply chain. The industrial organization of the supply
chain underwent tremendous changes (Gow and Swinnen, 1998).
First, with privatization of the industry the previous vertically integrated supply chains
were split into autonomous enterprises, which were independent in setting production targets and
were free in deciding with whom they exchanged inputs and outputs. In a second stage, these
firms were privatized, for example through voucher privatization programs or by selling them off
8
(OECD, 1997). In Slovakia, the privatization process resulted in the establishment of 13
independent Slovakian malting and brewing companies.
Second, prior to the reforms companies and farms were directly and indirectly subsidized.
As a consequence, price liberalization, subsidy cuts, and hard budget constraints caused dramatic
price adjustment. For example, the terms of trade in agriculture fell between 30% in Hungary and
70% in Russia in the 1990s (Macours and Swinnen, 2002).
Third, in the first years after transition, the legal system was not adjusted to a market
economy. In addition, legal actions were not commonly used because of high costs associated
with going to court, ineffective contract law and the potential loss of a trading partner.
The combination of these reforms caused major contract enforcement problems, which
often took the form of delayed payments along the supply chain (Cungu et al., 2009; Noev et al.,
2009). In 1998, Gorton et al. (2000) find that late payments by customers were the most
important obstacle to firm growth of food processing companies in Eastern Europe.
In combination with the “normal” credit market constraints and the macroeconomic
instability, contract enforcement problems constrained companies and farms‟ access to credit. In
the short run, this reduced access to inputs. In the long term, it reduced investments in fixed
assets and affected the long term profitability of the sector. This resulted in decline of input use
and consequently a decrease in the quantity and quality of production.
These problems affected the production of beer directly and indirectly. An important direct
effect was on the supply of malt and barley. Barley production and yields decreased substantially
in the first years of transition. In the 1990s, barley production decreased by 10%-30% in the
Baltic states, Czech Republic, Slovakia, Hungary and Poland, and by 50% - 60% in the other
countries (Table 4).
9
4 The Foreign Take-Over of the Brewing Industry
The opening of East European markets and the privatization of breweries attracted a huge
interest from foreign investors. The rich beer tradition, high consumption levels, relatively high
incomes and geographic and cultural proximity to the EU made Eastern Europe a very attractive
market for Western brewers once the system opened up. The privatization and liberalization of
the foreign investment regulations, the need for upgrading production facilities and marketing
strategies, combined with strong capital market constraints for domestic investors resulted in
massive inflow of foreign capital in the East European beer industry.
In fact, the beer industry was one of the first economic sectors to attract substantial FDI. In
1991, Interbrew (now AB Inbev) was the first foreign company that invested in the Eastern
European brewing industry as they bought the brewery “Borsodi Sörgyar” in Hungary (Hübner,
1999). In the following years also Heineken, SABMiller and Carlsberg invested heavily in the
Eastern European malting and brewing industry.
There are several reasons why foreign investors entered the Eastern European markets by
FDI rather than by exporting or licensing (Marinov and Marinova, 2001; Arnold et al., 2000).
First, initially there was only limited demand for foreign beer because of the consumer preference
for local brands and the declined purchasing power of the majority of the population. Second,
there was only limited scope for exports to Eastern Europe because of the restrictive import taxes
in some countries.
Hence, the main drivers of foreign investments in the beer industry were market-seeking
motives and strategic asset-seeking motives (the ownership of local brands) (Hübner, 1999;
Larimo et al. 2006). In addition also efficiency motives played an important role as the
production costs in the region were substantially lower than in their home markets and some
10
countries had already an interesting investment climate in the early years of transition (Marinov
and Marinova, 2002).
In the early and mid 1990s, investments were concentrated in the more economic advanced
countries, such as Hungary, Czech Republic, Slovakia and Poland. Interbrew and Heineken were
the first to invest in the Czech, Hungarian and Slovakian markets. Later also SAB Miller started
their activities in these countries. For example, in Slovakia, foreign investments in the malting
and brewing industry started in 1995 when the Dutch brewer Heineken took over the Zlatý bažant
brewery. Later they also bought Corgoň (1997), Martiner (1999) and Gemer (1999). SABMiller
was the second foreign investor that entered the Slovakian market when it bought Pivovar Šariš
in 1997 and later added Pivovar Topolčany (2006). Together these two foreign companies control
almost 80% of the Slovakian malt and beer market.
When the economic and institutional environment also improved in the less advanced
countries, foreign investors started to invest also in Romania, Bulgaria, Russia and Ukraine. An
exception to this was the Baltic Beverages Holding (BBH), which was established in 1991 as a
joint venture between the Swedish-Norwegian Pripps Ringnes and Finnish Hartewell breweries,
and entered the Russian market in 19923. By comparison, Interbrew and Heineken entered the
Russian market in respectively 1998 and 20024. In Ukraine, the first multinational breweries that
entered the local market were BBH and Interbrew, which both started their investments in 1996.
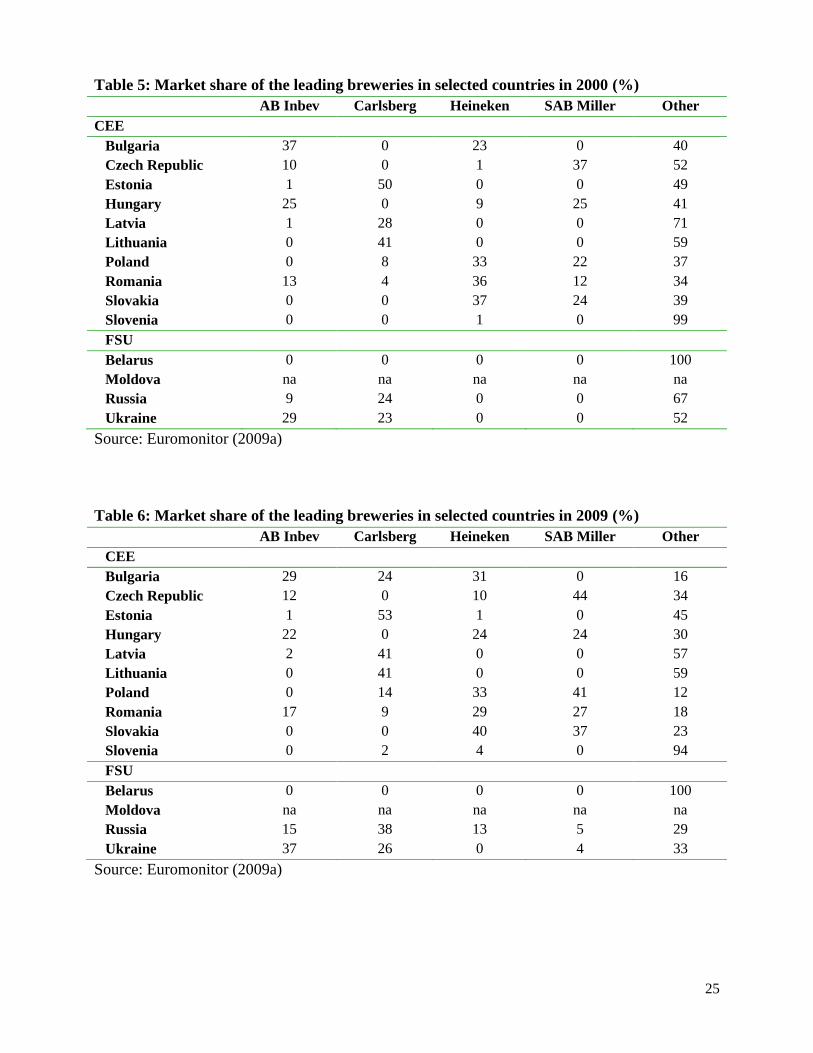
Between 1990 and 2005, the worlds‟ four largest multinational brewing companies - AB
Inbev, SAB Miller, Heineken and Carlsberg - invested heavily in the region by purchasing
domestic breweries and the combined market share of these four breweries rapidly increased in
3 These investments aimed at creating entry barriers for low cost exports from Baltic and Russian production to
protect their domestic markets from low cost imports. Initially, these protectionist motives were the main drivers for
investments by BBH in the Eastern European beer industry and market seeking reasons were only of secondary
importance. However, from the mid 1990s, market seeking motives became also the main driver of investments by
BBH (Arnold et al., 2000). 4 For a detailed discussion on FDI in the Russian beer market, see Deconink and Swinnen (2010).
11
all countries. In 2000, the market share represented by these four breweries was already more
than 50% in six out of the thirteen countries in the region for which we have data, and in 2009,
the number of countries with a combined market share of more than 50%, increased to nine
countries (Table 5 and Table 6). In all countries in the region, expect for Slovenia and Belarus,
the market leader is a foreign investor. Heineken and Carlsberg are each market leader in four out
of thirteen countries, SAB Miller is market leader in two countries and AB Inbev is market
leaders in one country. The strong concentration is illustrated by the market shares in tables 5 and
6. For example, in Estonia, Carlsberg alone has a market share of 53% in 2009 and also in Latvia
and Lithuania, the market share of Carlsberg is very high (41%). In the Czech Republic and
Poland, the South African brewer, SAB Miller, has a market share of respectively 44% and 41%.
5 Quality Demands and Vertical Coordination in the Beer Chain
After foreign investors entered the market, they were faced with the problem of obtaining a
sufficient quantity of high quality malt and high quality barley to produce high quality beer. In
general, the quality of the malt that was locally produced in the 1990s did not meet the quality
standards of the foreign investors.
In response, foreign investors initially imported malt and barley from their traditional
channels in Western Europe (Cocks and Gow, 2003). In the long run, however, the development
of a local supply base was more beneficial because of tariffs and exchange rate fluctuations , and
for logistical and operational reasons. Therefore they invested in long term relationships with
malting companies and producers and reintroduced vertical coordination along the supply chain
(World Bank, 2006).
12
Besides to increase the quality of the malt and barley, there is also a second reason why
vertically coordinated supply chains emerged in the brewing industry. While brewing and malting
companies in the West tend to work together under contractual relationships but as separate
companies, brewing and malting companies in Eastern Europe were often privatized as a single
“package”. Hence, foreign brewery companies often ended up owning malting companies as they
took over the Eastern brewing (cum malting) companies (Cocks and Gow, 2003; Gits, 2006). In
the beginning, foreign investors were not interested in the malting or farming activities as this
was not their “core business”. However, quality problems with their raw materials forced them to
also engage not just in solving the malting company problems but even further up the supply
chain into farming and the provision of seeds5.
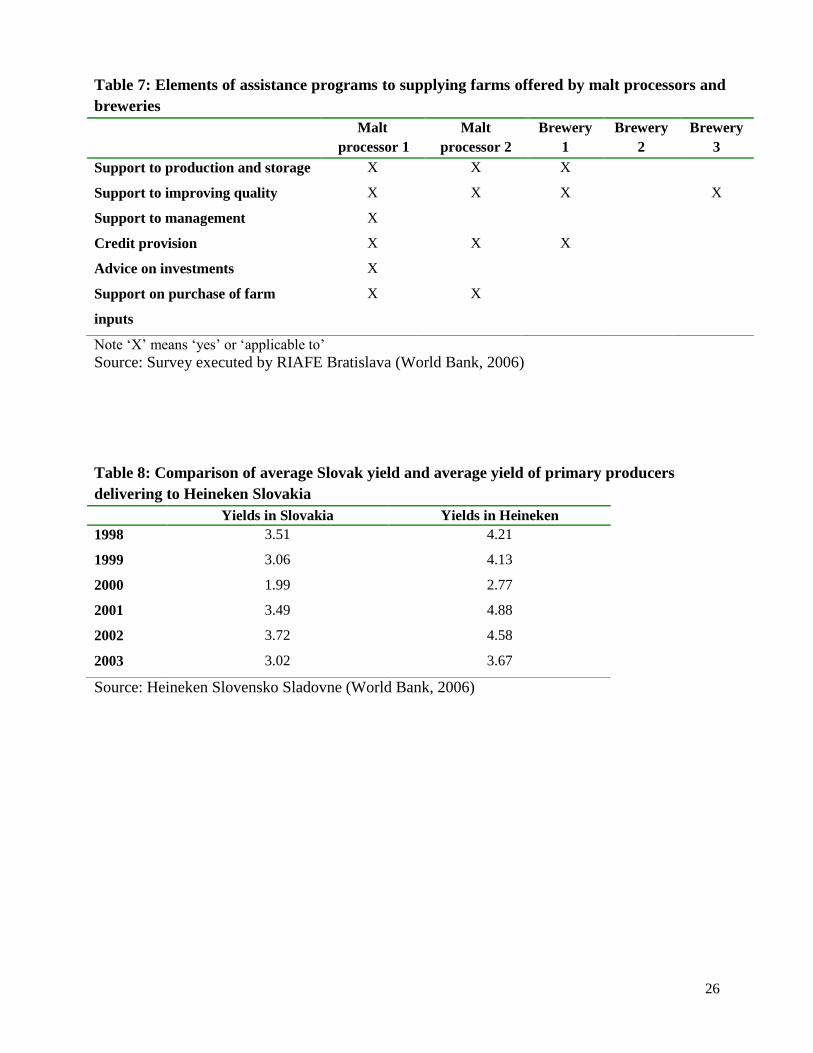
Brewing companies developed vertical coordination mechanisms to build up long-term
relationships with farms and seed suppliers. Part of these relationships include sophisticated
contracts with assistance to farms6. Examples of such assistance programmes were seed selection
and supply schemes, credit provision, investment loans, technical assistance and advance
payments. By reducing farms‟ credit constraints and improve their access to quality inputs and
credit, these assistance programs were targeted to improve the supply of high quality malt barley
production. Table 7 documents how in Slovakia in 2003, support to improve quality, support to
production and storage, and credit provision were the three most common used assistance
programmes to suppliers in the Slovakian beer chain.
5 Later, a typical strategy of the Western brewing companies was to bring in Western malting companies to sell them
the malting companies and to engage in traditional Western-style purchasing contracts with these malting companies. 6 Case studies show that throughout the food industry such FDI introduced vertical integration contributed to an
improvement of the access to credit or inputs and productivity growth of their suppliers (Gow et al., 2000; Dries and
Swinnen, 2004; 2010). One of the main drivers to improved credit access were farm assistance programs offered by
the processor. These programs included input supply programs, credit and investment assistance programs, bank loan
guarantees and extension services.
13
The impacts of these vertically coordinated programs has been very important, both
generally and in the beer chain specifically (World Bank, 2006). Besides an effect on quality, the
farms‟ improved access of input markets has also an effect on efficiency. For example,
companies in the Slovakian beer and malting industry, such as Heineken, stated that barley
producers with a contractual relationship with the company had higher yields than the Slovak
average (World Bank, 2006). This is illustrated in Table 8. Partly, these differences reflect
selection: Heineken mostly deals with producers from the more productive regions in Slovakia,
but Heineken also confirmed that its farm assistance programmes - such as assistance in selecting
the appropriate seed variety, plant protection and nutrition and advising in post harvest storage
and treatment - enhanced quality and productivity.
Even more striking is the evolution of the supply of malt in Russia. In 2001, only 0.5
million tons malt or 49% of the total domestic demand for malt was purchased locally, while in
2007, this increased to more than 1 million tons or 85%. This change was mainly driven by large,
foreign investors who invested in their own malting activities and introduced malting barley
breeding programmes to enhance the quality the locally produced barley (FAO, 2009).
However, vertical coordination has reduced in intensity and extent over time. Gradually,
when things improved, brewing companies have started to disassociate themselves from barley
and malt activities and returned to their core business, e.g. brewing and selling beer. They started
buying the malt from the malting companies via more traditional contracts. The malting company
is now responsible for the quality of the malt. For example, in Hungary, Interbrew bought in 1991
the brewery and malting company, Borsodi Sörgyar. Initially, they engaged themselves in the
malting company and offered contracts and assistance to the farmers producing high quality
malting barley. However, at the end of the 1990s, Interbrew sold their malting activities to the
14
German malting company, Weissheimer, and engaged in a traditional, “Western style” contract
with Weissheimer.
There are similar developments in Romania, Russia and Ukraine, where currently malting
companies are heavily investing in expanding the malting capacity. International malting
companies have become increasingly active. A number of projects have been successfully
implemented by Soufflet, Champagne Céréals and other multinational malting companies. In
many cases, they continue to work with farms trough interlinked contracts. For example, in
Russia, Group Soufflet invested heavily in extension services to improve local malting barley
varieties and in Ukraine, Champagne Céréals helped farms to finance the input provision of farms
(seeds and fertilizer) trough interlinked contracts (FAO, 2009).
Overall economic growth and the benefits from EU accession also contributed to a
reduction of vertical coordination, and an industrial organization of the supply chain which is
closer to the West European model with independent companies producing malt and beer - albeit
with contracting - and more spot market transactions in the barley and seed markets.
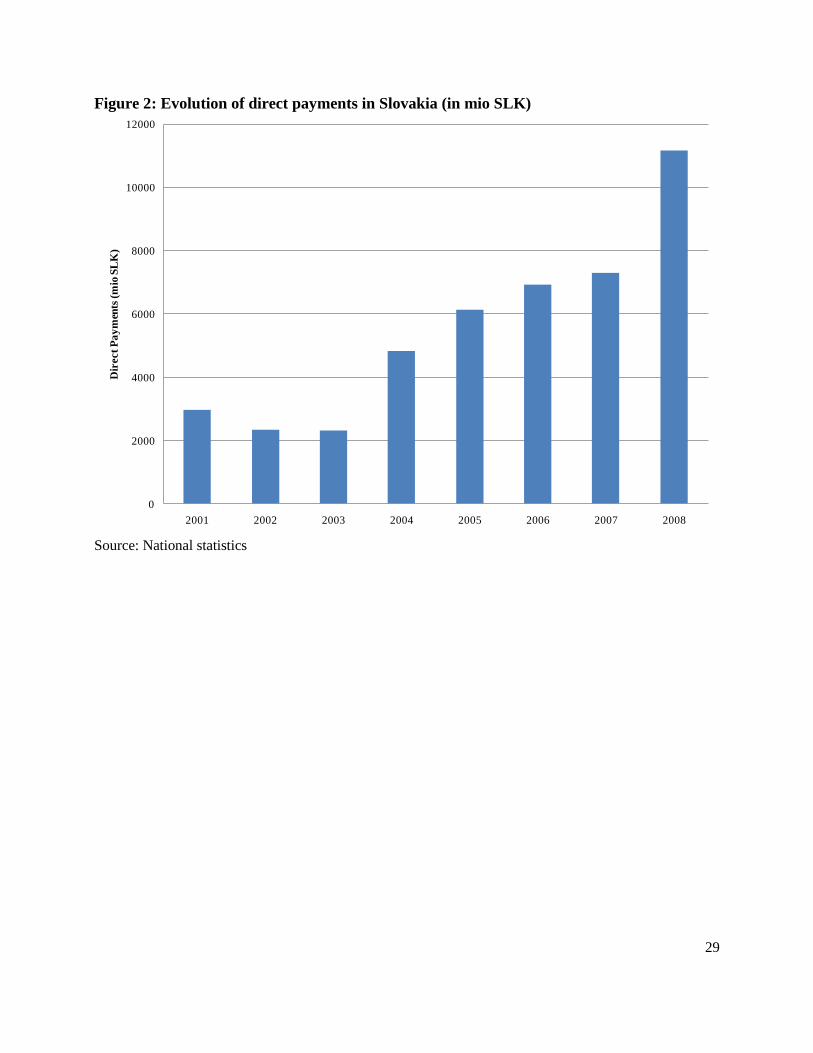
Between 2004 and 2007, ten Eastern European countries joined the European Union. The
accession process implied a lot of changes and economic effects. As a consequence these
countries now receive substantial farm subsidies from the EU‟s Common Agricultural Policy
(CAP). These subsidies have a significant effect on farmers‟ income and credit constraints.
Figure 2 presents the evolution of the most important form of subsidies, i.e. direct payments to
farms, in Slovakia before and after accession to the EU.
The accession to the EU has both direct and indirect effects on the beer supply chain.
Directly, the CAP subsidies not only increase farms‟ income, but also improve farms‟ access to
credit. Financial institutions are more willing to give loans to farmers because they can use the
direct payments as loan collateral (Ciaian and Swinnen, 2009). Indirectly, the accession to the EU
15
improved institutions and the general working of input markets. Both effects reduced the need for
vertically coordinated farm assistance programmes.
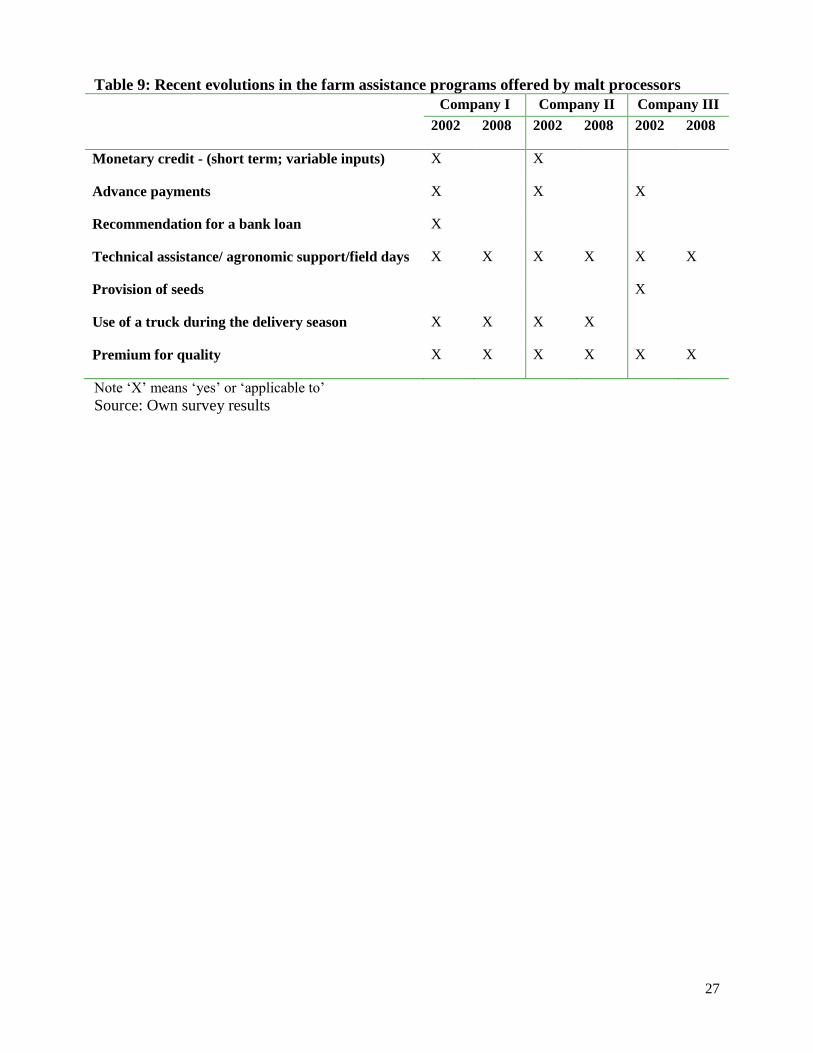
In 2008, we interviewed three Slovakian malting companies7 on the evolution of farm
assistance programs before and after accession to EU. The results, summarized in Table 9, show
that all companies stopped providing their credit assistance programmes after EU accession. In
2002, two companies offered monetary credit for the purchase of variable inputs while the other
company offered seeds. In addition, one company offered bank loan guarantees. Two companies
stopped their credit programmes, while the third processor stopped offering its credit programme
in 2007. The latter one is located in the east of Slovakia, which is a poorer region of Slovakia. All
three companies indicated that the most important reason for halting these programmes was that
farms have now better access to commercial loans due to the fact that financial institutions accept
direct payments as collateral. The malting companies still offer extension services to guarantee
and improve the quality of the production.
6 Conclusion
In Eastern Europe, economic and institutional reforms had an important impact on barley,
malt and beer production and consumption. In most Eastern European countries, beer production
and consumption decreased in the first years after transition, but in most countries production and
consumption recovered in the second half of the 1990s and the beginning of the 2000s. In Russia,
for example, after an initial decline in beer production, production increased by more than 19%
per year and by 2008, production was approximately four times higher than the production in
1992. Russian beer consumption tripled over the same period. This pattern reflects important
7 Two of the malting companies are completely foreign owned, while the third one is domestically owned. They
represent a market share of more than 80%.
16
changes that have affected the supply chain of all food products, including beer, since the
economic reforms of the beginning of the 1990s.
In the beginning of the 1990s, the economic reforms led to major disruptions in beer
production and consumption. Beer production declined due a combination of privatization, price
liberalization and poor legal enforcement systems. Also further upstream, these factors influenced
the production of barley and malt as in combination with the “normal” rural credit constraints,
farms produced less (high quality) barley and consequently, malting companies produced less
(high quality) malt. At the same time, demand for beer also decreased because of lower
disposable consumer incomes and high inflation.
Soon after the start of liberalizations, the Eastern European brewery industry attracted
foreign investors. The first countries to attract investments were those with highest incomes and
most advanced reform processes, such as Hungary, the Czech Republic, Slovakia and Poland.
Later, foreign investors went further east and south and invested in the less economic advanced
countries, such as Romania, Russia and Ukraine. Foreign investors ended up regionally dividing
the Eastern European beer market among the four largest international beer companies, AB
Inbev, SAB Miller, Heineken and Carlsberg. Currently, these four foreign investors have a
market share of more than 50% in all countries, except for Slovenia, where a local producer still
dominates the market.
When foreign breweries started their activities in Eastern Europe, they faced a problem
sourcing sufficient high quality malt in order to produce high quality beer. The local financially
distressed malting companies and farms were in many cases not able to produce the high quality
malt and barley that is needed. In order to avoid the higher costs associated with importing malt,
foreign brewers invested in the supply chain and introduced innovative contracts with malting
companies and farms to help them produce malt and barley that met their quality requirements.
17
These contracts led to important improvements in efficiency and quality in the production of
barley and malt.
Since the late 1990s rapid economic growth and later the accession to the EU caused a
substantial improvement in disposable income, better functioning markets and institutions and the
introduction of subsidies to farms. This resulted in a reduction of farms‟ credit constraints and,
hence, a decline in the need to offer assistance to malting companies and farms. This is illustrated
by case study evidence from Slovakia, where vertical coordination in the beer supply chain
reduced as the three largest malting companies stopped providing credit programs to barley farms
after EU accession. The industrial organization of the supply chains are thus gradually moving
towards those of developed market economies.
18
7 References
Arnold, S., Larimo, J., Miljan, M., Virvilaite, R., Frize, E. and N. Starshinova (2000), “A
Comparative Analysis of the Beer Market in Selected European Countries: Estonia,
Finland, Lithuania, Russia and the UK”, in Chadraba, P. and R. Springer (Eds.),
Proceedings of the 8th
Annual Conference on Marketing Strategies in Central and Eastern
Europe, Vienna, December, pp. 7-25.
Ciaian, P. and J.F.M. Swinnen (2009), “Credit Market Imperfections and the Distribution of
Policy Rents,” American Journal of Agricultural Economics, Vol. 91(4), pp. 1124-1139.
Cocks, J. and H.R. Gow (2003), “Supplier Relationship Development in the Food Industry of
Transition Economies: The Case of Interbrew”, Journal of Food Distribution Research,
Vol. 34(1), March.
Cungu, A. Gow, H.R., Vranken, L. and J.F.M. Swinnen (2008), “Investment with weak contract
enforcement: evidence from Hungary during transition”, European Review of Agricultural
Economics, Vol. 35(1), pp. 75-91.
Deconick, K. and J.F.M. Swinnen (2010), “From Vodka to Baltika: A Perfect Storm in the
Russian Beer Market”, In Swinnen, J.F.M. (ed.), …. [TO BE COMPLETED]
Dries, L. and J.F.M. Swinnen (2004), “Foreign Direct Investment, Vertical Integration, and Local
Suppliers: Evidence from the Polish Dairy Sector”, World Development, Vol. 32(9), pp.
1525-1544.
Dries, L. and J.F.M. Swinnen (2010), “The Impact of Interfirm Relationships on Investment:
Evidence from the Polish Dairy Sector”, Food Policy, Vol. 35, pp. 121-129.
Euromonitor (2009a), “Beer in Bulgaria”, Market report, Euromonitor International.
“Beer in Czech Republic”, Market report, Euromonitor International.
19
“Beer in Hungary”, Market report, Euromonitor International.
“Beer in Poland”, Market report, Euromonitor International.
“Beer in Romania”, Market report, Euromonitor International.
“Beer in Slovenia”, Market report, Euromonitor International.
“Beer in Slovakia”, Market report, Euromonitor International.
“Beer in Belarus”, Market report, Euromonitor International.
“Beer in the Russia”, Market report, Euromonitor International.
“Beer in the Ukraine”, Market report, Euromonitor International.
Euromonitor (2009b), “Alcoholic drinks in Bulgaria”, Market report, Euromonitor International.
“Alcoholic drinks in Czech Republic”, Market report, Euromonitor
International.
“Alcoholic drinks in Estonia”, Market report, Euromonitor International.
“Alcoholic drinks in Hungary”, Market report, Euromonitor International.
“Alcoholic drinks in Latvia”, Market report, Euromonitor International.
“Alcoholic drinks in Lithuania”, Market report, Euromonitor International.
“Alcoholic drinks in Poland”, Market report, Euromonitor International.
“Alcoholic drinks in Romania”, Market report, Euromonitor International.
“Alcoholic drinks in Slovenia”, Market report, Euromonitor International.
“Alcoholic drinks in Slovakia”, Market report, Euromonitor International.
20
“Alcoholic drinks in Belarus”, Market report, Euromonitor International.
“Alcoholic drinks in Russia”, Market report, Euromonitor International.
“Alcoholic drinks in Ukraine”, Market report, Euromonitor International.
FAO (2009), “Agribusiness Handbook: Barley, Malt and Beer”, FAO Investment Centre
Division, cooperation between FAO and EBRD.
FAOstat (2010), Online Database, Accessed September 2010.
Gits, K. (2006), “Vertical integratie in de Centraal-en Oost-Europese brouwerijsector: Case study
Inbev”, Master Thesis at the Faculty of Business and Economics.
Gorton, M., Buckwell, A., and S. Davidova (2000), “Transfers and distortions along the CEEC
food supply chains”, in Tangermann, S., and M. Banse (eds.), Central and Eastern European
Agriculture in an Expanding European Union, CAB International.
Gow, H.R. and J.F.M. Swinnen (1998), “Up- and Downstream Restructuring, Foreign Direct
Investment, and Hold-Up Problems in Agricultural Transition”, European Review of
Agricultural Economics, Vol. 25(3), pp. 331-350.
Gow, H.R., Streeter, D.H. and J.F.M. Swinnen (2000), “How private contract enforcement
mechanisms can succeed where public institutions fail: the case of Juhocukor a.s.”,
Agricultural Economics, Vol. 23, pp. 253-265.
Hübner (1999), “Impact van buitenlandse investeringen in de bierbrouwerijsector in Centraal – en
Oost Europa. Gevalstudie: Interbrew”, Master Thesis at the Faculty of Bioscience
Engineering.
Larimo, J., Marinov, M. and Marinova (2006), “The central and Eastern European brewing
industry since 1990”, British Food Journal, Vol. 108(5), pp. 371–384.
Macours, K. and J.F.M. Swinnen (2002), “Patterns of Agrarian Transition”, Economic
Development and Cultural Change, Vol. 50(2), pp. 265-294.
21
Marinov, M. and S.T. Marinova (2001), “Foreign Direct Investments in the Emerging Markets of
Central and Eastern Europe: Motives and Marketing Strategies”, Advances in International
Marketing, Vol. 10, pp. 21-52.
Marinov, M.A. and S.T. Marinova (2002), “Internalization of Interbrew in Eastern Europe”, in
Marinov, M.A. (ed.), Internalization in Central and Eastern Europe, Ashgate Publishing,
Alderschot, pp. 204-232.
Noev, N., Dries, L. and J.F.M. Swinnen (2009), “Institutional Change, Contracts and Quality in
Transition Agriculture: Evidence from the Bulgarian Dairy sector”, Eastern European
Economics, Vol. 47(4), pp. 62 - 85.
OECD (1997), “Review of agricultural polices: Slovak Republic”, Centre for co-operation with
economies in transition, Organization for Economic Co-operation and Development, Paris.
Rozelle, S. and J.F.M. Swinnen (2004), “Success and Failure of Reforms: Insights from
Transition Agriculture”, Journal of Economic Literature, Vol. 42(2), pp. 404-456.
World Bank (2006), “Market Linkages in the Slovak Agri-Food Sector”, Working Paper No. 43,
Environmentally and Socially Sustainable Development Unit Europe and Central Asia
Region, World Bank, Washington.
22
8 Tables
Table 1: Beer consumption (in billion liters)
1989 1992 1998 2007
Total Change (%)
1992 - 2007*
Annual Change (%)
1992 - 2007*
CEE n.a. 6,18 6,75 8,23 33% 2,2%
Bulgaria 0,67 0,38 0,37 0,40 5% 0,4%
Czech Republic 1,61 1,54 1,65 1,63 6% 0,4%
Estonia n.a. 0,05 0,071 0,13 160% 10,7%
Hungary 1,07 0,97 0,70 0,74 -24% -1,6%
Latvia n.a. 0,09 0,08 0,16 78% 5,2%
Lithuania n.a. 0,12 0,16 0,30 150% 10,0%
Poland 1,21 1,45 2,11 2,93 102% 6,8%
Romania 1,12 1,00 1,00 1,33 33% 2,2%
Slovakia 0,45 0,44 0,45 0,44 0% 0,0%
Slovenia n.a. 0,15 0,15 0,16 7% 0,4%
FSU n.a. 4,26 4,36 10,61 149% 9,9%
Belarus n.a. 0,28 0,22 0,22 -21% -1,4%
Moldova n.a. 0,04 0,03 0,05 25% 1,7%
Russia n.a. 2,85 3,43 8,41 195% 13,0%
Ukraine n.a. 1,10 0,69 1,93 75% 5,0%
Source: FAOstat (2010)
23
Table 2: Beer production (in billion liters)
1989 1992 1998 2008 Total Change (%)
1992-2008
Annual Change (%)
1992 - 2008*
CEE n.a. 6,32 6,97 9,79 55% 3,4%
Bulgaria 0,67 0,47 0,38 0,55 17% 1,1%
Czech Republic 1,88 1,69 1,83 1,99 18% 1,1%
Estonia n.a. 0,043 0,07 0,14 226% 14,1%
Hungary 0,97 0,92 0,72 0,48 -48% -3,0%
Latvia n.a. 0,09 0,07 0,13 44% 2,8%
Lithuania n.a. 0,12 0,16 0,30 150% 9,4%
Poland 1,21 1,41 2,10 3,55 152% 9,5%
Romania 1,15 1,00 1,00 2,08 108% 6,8%
Slovakia 0,45 0,41 0,45 0,37 -10% -0,6%
Slovenia 0,19 0,18 0,19 0,19 6% 0,3%
FSU n.a. 4,20 4,332 15,025 258% 16,1%
Belarus n.a. 0,27 0,26 0,35 30% 1,9%
Moldova n.a. 0,04 0,03 0,07 75% 4,7%
Russia n.a. 2,79 3,36 11,40 309% 19,3%
Ukraine n.a. 1,10 0,68 3,20 191% 11,9%
Source: FAOstat (2010)
24
Table 3: Beer sales as a percentage in the total volume of alcoholic drinks sales and as a
percentage of total sales of alcoholic drinks in 2008
Share in volume (%) Share in sales (%)
CEE
Bulgaria 85,0 43,6
Czech Republic 85,5 44,7
Estonia 66,9 36,3
Hungary 70,4 42,3
Latvia 74,7 29,0
Lithuania 70,1 24,6
Poland 86,2 54,1
Romania 86,1 58,0
Slovakia 80,7 32,4
Slovenia 64,0 31,6
FSU
Belarus 55,5 28,9
Moldova n.a. n.a.
Russia 75,8 43,7
Ukraine 72,3 34,8
Source: Euromonitor (2009b)
Table 4: Barley production (in ‘000 tons)
1989-
1991
1992-
1994
1995-
1997
1998-
2000
2001-
2003
2004-
2006
2007-
2009
CEE n.a. 12579 12023 10178 10256 11004 11255
Bulgaria 1487 1090 813 682 889 795 719
Czech Republic 2934 2496 2296 1953 1942 2141 2047
Estonia n.a. 372 303 269 258 321 393
Hungary 1421 1473 1220 1082 1052 1226 1183
Latvia n.a. 457 338 278 247 319 308
Lithuania n.a. 1085 1087 902 849 851 947
Poland 4128 2920 3527 3265 3177 3438 3870
Romania 3022 1788 1604 1041 1094 1086 974
Slovakia 998 866 794 665 704 766 742
Slovenia n.a. 32 41 41 44 61 72
FSU n.a. 43124 27519 19453 29720 29606 n.a.
Belarus n.a. 3037 2172 1394 1663 1909 208
Moldova n.a. 404 256 177 170 227 n.a.
Russia n.a. 26962 17502 11493 18759 17003 18863
Ukraine n.a. 12721 7589 6389 9128 10467 10142
Source: FAOstat (2010)
25
Table 5: Market share of the leading breweries in selected countries in 2000 (%)
AB Inbev Carlsberg Heineken SAB Miller Other
CEE
Bulgaria 37 0 23 0 40
Czech Republic 10 0 1 37 52
Estonia 1 50 0 0 49
Hungary 25 0 9 25 41
Latvia 1 28 0 0 71
Lithuania 0 41 0 0 59
Poland 0 8 33 22 37
Romania 13 4 36 12 34
Slovakia 0 0 37 24 39
Slovenia 0 0 1 0 99
FSU
Belarus 0 0 0 0 100
Moldova na na na na na
Russia 9 24 0 0 67
Ukraine 29 23 0 0 52
Source: Euromonitor (2009a)
Table 6: Market share of the leading breweries in selected countries in 2009 (%)
AB Inbev Carlsberg Heineken SAB Miller Other
CEE
Bulgaria 29 24 31 0 16
Czech Republic 12 0 10 44 34
Estonia 1 53 1 0 45
Hungary 22 0 24 24 30
Latvia 2 41 0 0 57
Lithuania 0 41 0 0 59
Poland 0 14 33 41 12
Romania 17 9 29 27 18
Slovakia 0 0 40 37 23
Slovenia 0 2 4 0 94
FSU
Belarus 0 0 0 0 100
Moldova na na na na na
Russia 15 38 13 5 29
Ukraine 37 26 0 4 33
Source: Euromonitor (2009a)
26
Table 7: Elements of assistance programs to supplying farms offered by malt processors and
breweries
Malt
processor 1
Malt
processor 2
Brewery
1
Brewery
2
Brewery
3
Support to production and storage X X X
Support to improving quality X X X X
Support to management X
Credit provision X X X
Advice on investments X
Support on purchase of farm
inputs
X X
Note „X‟ means „yes‟ or „applicable to‟
Source: Survey executed by RIAFE Bratislava (World Bank, 2006)
Table 8: Comparison of average Slovak yield and average yield of primary producers
delivering to Heineken Slovakia
Yields in Slovakia Yields in Heineken
1998 3.51 4.21
1999 3.06 4.13
2000 1.99 2.77
2001 3.49 4.88
2002 3.72 4.58
2003 3.02 3.67
Source: Heineken Slovensko Sladovne (World Bank, 2006)
27
Table 9: Recent evolutions in the farm assistance programs offered by malt processors
Company I Company II Company III
2002 2008 2002 2008 2002 2008
Monetary credit - (short term; variable inputs) X X
Advance payments X X X
Recommendation for a bank loan X
Technical assistance/ agronomic support/field days X X X X X X
Provision of seeds X
Use of a truck during the delivery season X X X X
Premium for quality X X X X X X
Note „X‟ means „yes‟ or „applicable to‟
Source: Own survey results
28
9 Figures
Figure 1: Beer consumption in Eastern Europe, Belgium and Germany in 1989/1992 and 2007 (liter per capita per year)
0
20
40
60
80
100
120
140
160
180
200C
zech
Rep
ubli
c
Est
on
ia
Ro
man
ia
Po
lan
d
Lit
hu
ania
Slo
ven
ia
Slo
vak
ia
Ru
ssia
n F
eder
atio
n
Bu
lgar
ia
Lat
via
Hu
nga
ry
Uk
rain
e
Bel
aru
s
Mo
ldo
va
Bee
r C
on
sum
pti
on
(li
ter
per
ca
pit
a p
er y
ear)
1989/1992
2007
Note: Per capita consumption data of 1989 for Bulgaria, the Czech Republic, Hungary, Poland, Romania and Slovakia. Per capita consumption data of 1992 for
Estonia, Latvia, Lithuania, Slovenia, Belarus, Moldova, Russia and Ukraine.
Source: FAOstat (2010)
29
Figure 2: Evolution of direct payments in Slovakia (in mio SLK)
0
2000
4000
6000
8000
10000
12000
2001 2002 2003 2004 2005 2006 2007 2008
Dir
ect
Pa
ym
ents
(m
io S
LK
)
Source: National statistics
30
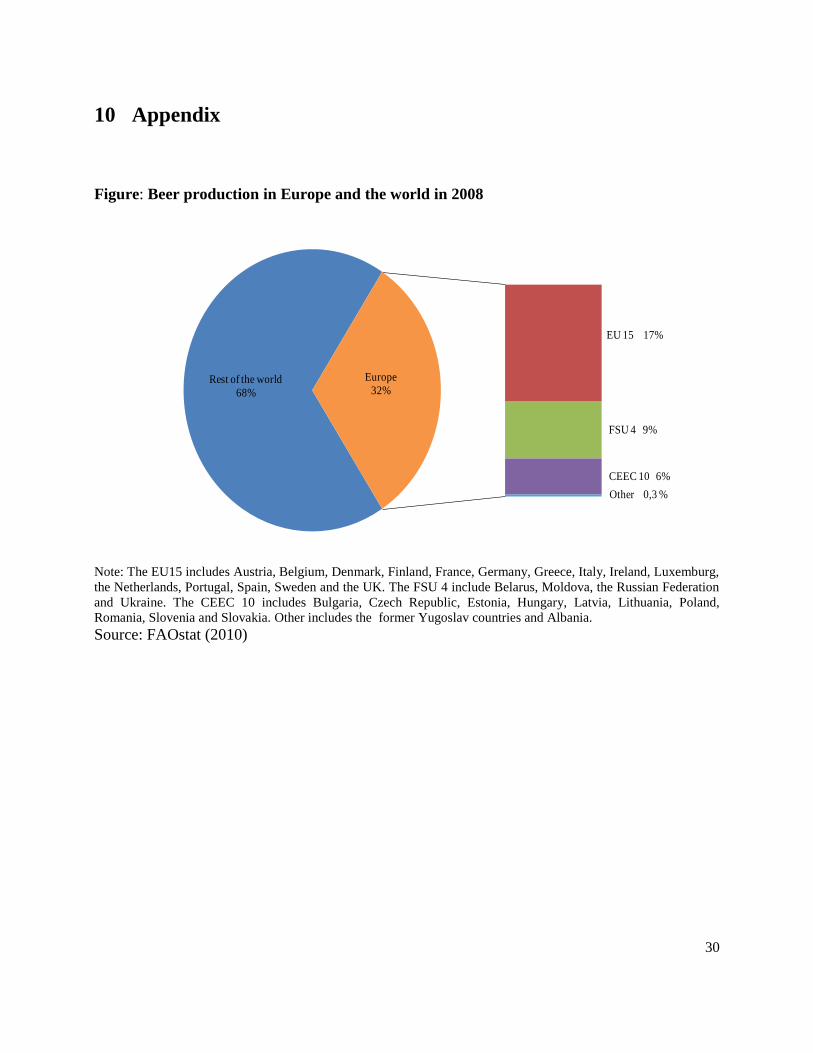
10 Appendix
Figure: Beer production in Europe and the world in 2008
Rest of the world
68%
EU 15 17%
FSU 4 9%
CEEC 10 6%
Other 0,3 %
Europe
32%
Note: The EU15 includes Austria, Belgium, Denmark, Finland, France, Germany, Greece, Italy, Ireland, Luxemburg,
the Netherlands, Portugal, Spain, Sweden and the UK. The FSU 4 include Belarus, Moldova, the Russian Federation
and Ukraine. The CEEC 10 includes Bulgaria, Czech Republic, Estonia, Hungary, Latvia, Lithuania, Poland,
Romania, Slovenia and Slovakia. Other includes the former Yugoslav countries and Albania.
Source: FAOstat (2010)