Embed Size (px)
Citation preview

2012-2013 Licensed Personnel Report
Teacher Licensure and Accreditation
Kansas State Department of Education www.ksde.org
Commonly Used Acronyms
TLA Specific Educator Data Collection System
(EDCS)
Educator Licensure Collection System (ELCS)
Licensed Personnel Report (LPR)
Staff Assignment Report (SAR)
Teacher Licensure and Accreditation (TLA)
Non-TLA Specific
Career and Technical Education (CTE)
Kansas Course Code Management System (KCCMS)
Kansas Individual Data on Students (KIDS) Collection System
Student Course Report (STCO)
Kansas State Department of Education www.ksde.org
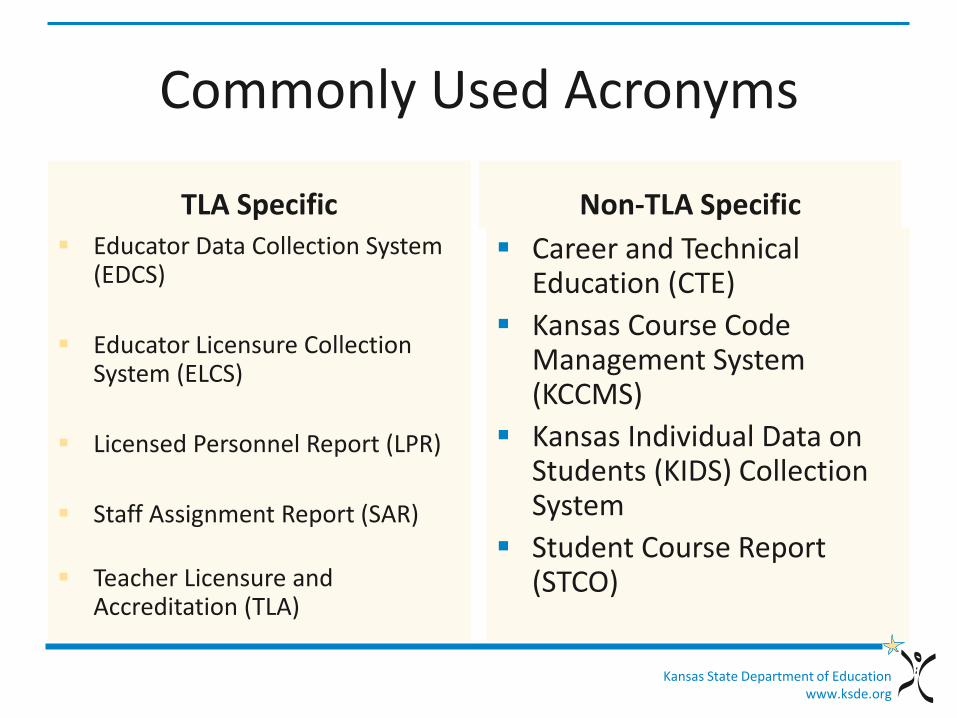
Educator License Data and Assignment Flow
Highly Qualified
Education / License History
Endorsed Info
Effective / Expiration
Date
Educator ID
Populates Educator ID
KCC ID Educator
ID
EDCS ELCS
License Type
Building
Approved
Pathway
Local Course ID
Validates
LPR
SAR
Generates
Kansas State Department of Education www.ksde.org
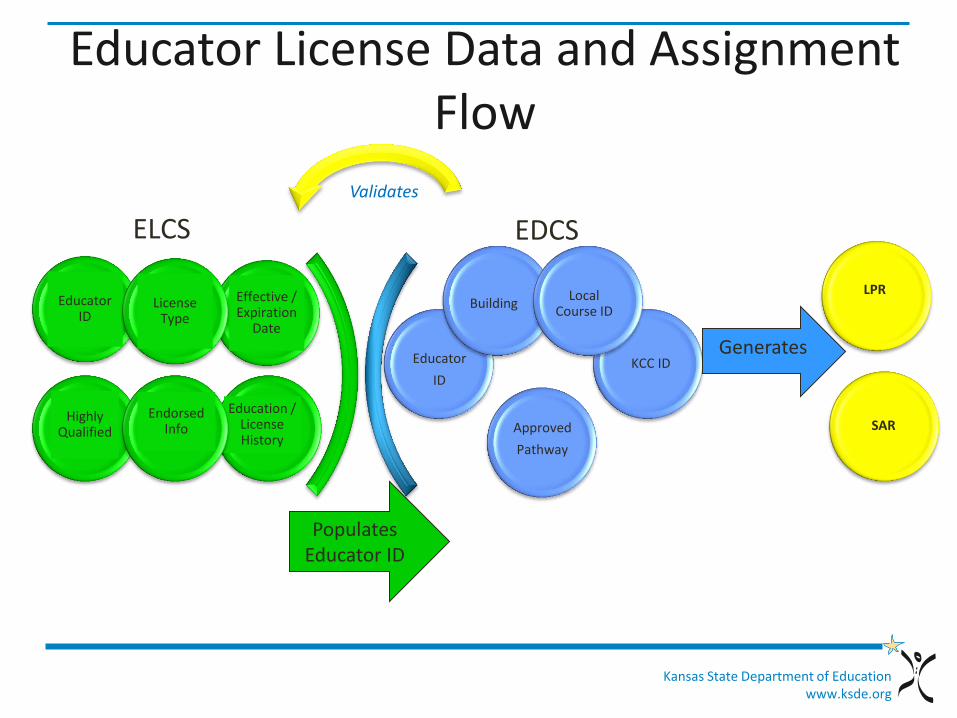
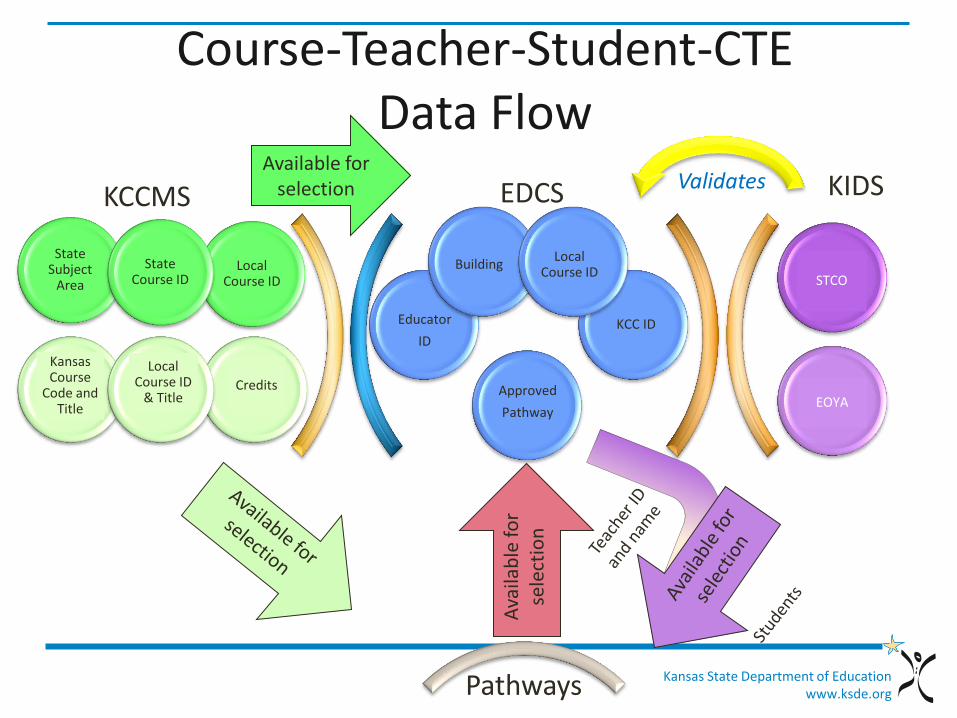
Course-Teacher-Student-CTE Data Flow
Kansas Course
Code and Title
Credits
Local Course ID
& Title
Local Course ID
State Subject
Area
Available for selection
STCO
EOYA
KCCMS KIDS
State Course ID
Validates
Ava
ilab
le fo
r se
lect
ion
Pathways
KCC ID Educator
ID
EDCS
Building
Approved
Pathway
Local Course ID
Kansas State Department of Education www.ksde.org
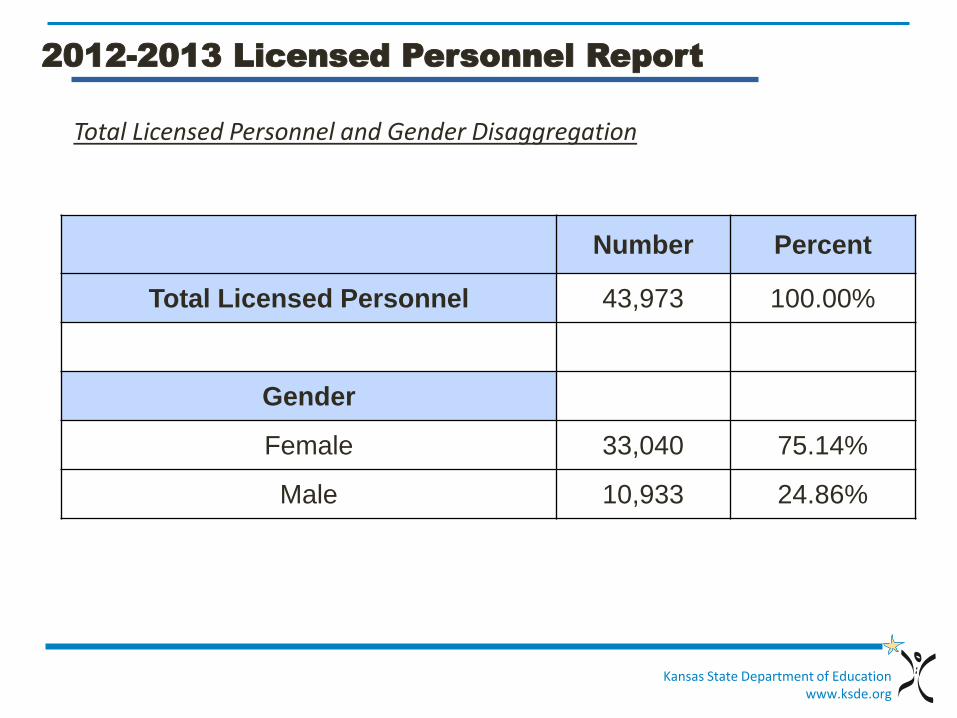
Number Percent
Total Licensed Personnel 43,973 100.00%
Gender
Female 33,040 75.14%
Male 10,933 24.86%
Total Licensed Personnel and Gender Disaggregation
2012-2013 Licensed Personnel Report
Kansas State Department of Education www.ksde.org
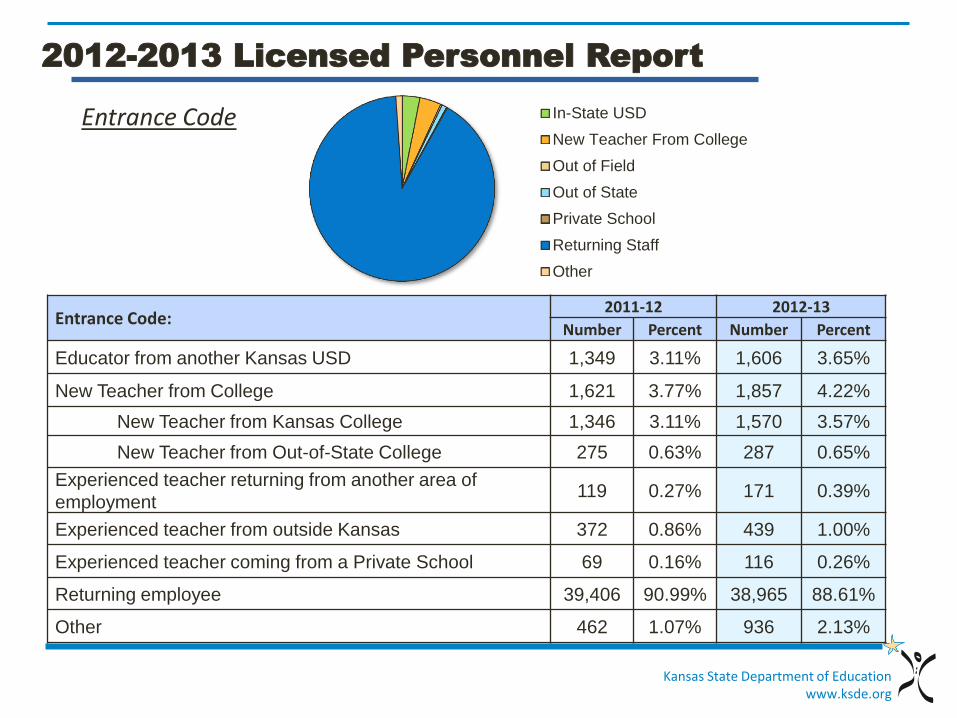
2012-2013 Licensed Personnel Report
Entrance Code In-State USD
New Teacher From College
Out of Field
Out of State
Private School
Returning Staff
Other
Entrance Code: 2011-12 2012-13
Number Percent Number Percent
Educator from another Kansas USD 1,349 3.11% 1,606 3.65%
New Teacher from College 1,621 3.77% 1,857 4.22%
New Teacher from Kansas College 1,346 3.11% 1,570 3.57%
New Teacher from Out-of-State College 275 0.63% 287 0.65%
Experienced teacher returning from another area of
employment 119 0.27% 171 0.39%
Experienced teacher from outside Kansas 372 0.86% 439 1.00%
Experienced teacher coming from a Private School 69 0.16% 116 0.26%
Returning employee 39,406 90.99% 38,965 88.61%
Other 462 1.07% 936 2.13%
Kansas State Department of Education www.ksde.org
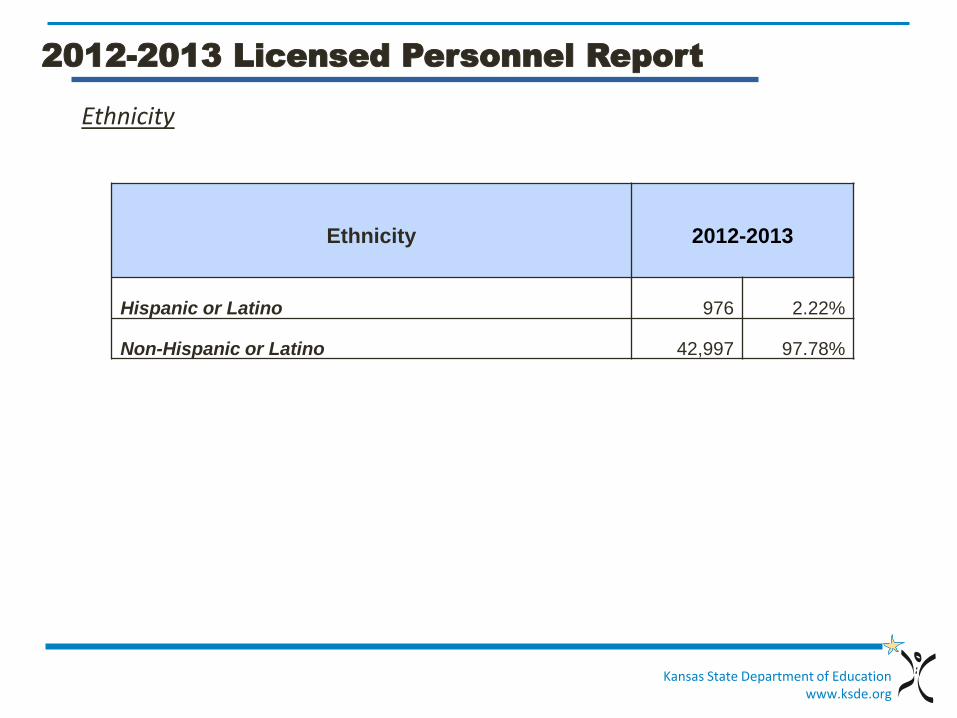
Ethnicity
2012-2013 Licensed Personnel Report
Ethnicity 2012-2013
Hispanic or Latino 976 2.22%
Non-Hispanic or Latino 42,997 97.78%
Kansas State Department of Education www.ksde.org
2012-2013 Licensed Personnel Report
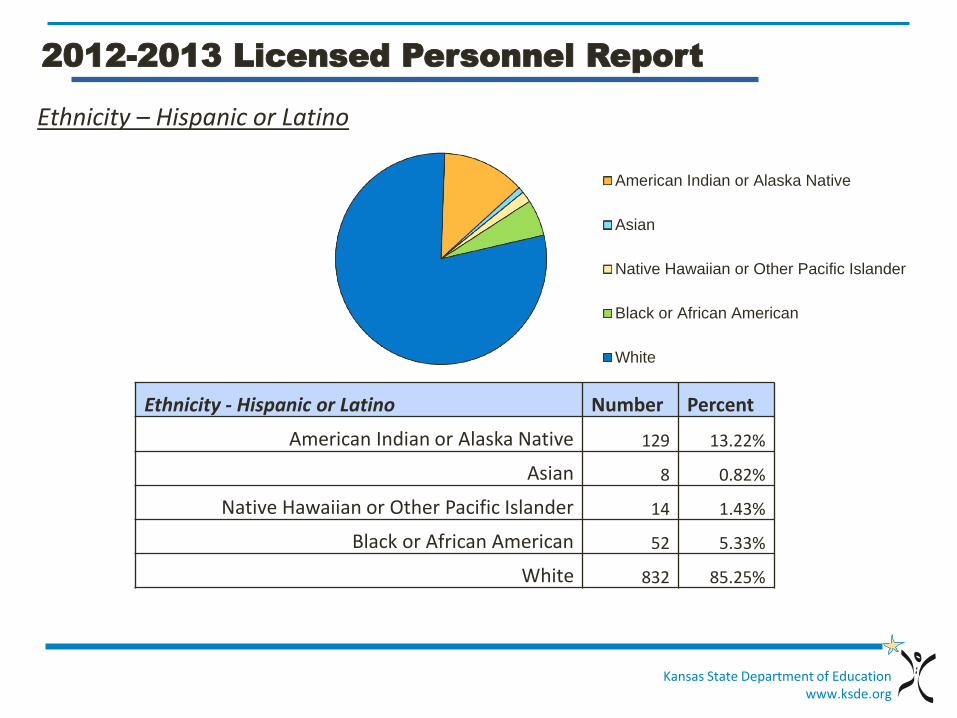
Ethnicity – Hispanic or Latino
American Indian or Alaska Native
Asian
Native Hawaiian or Other Pacific Islander
Black or African American
White
Ethnicity - Hispanic or Latino Number Percent
American Indian or Alaska Native 129 13.22%
Asian 8 0.82%
Native Hawaiian or Other Pacific Islander 14 1.43%
Black or African American 52 5.33%
White 832 85.25%
Kansas State Department of Education www.ksde.org
2012-2013 Licensed Personnel Report
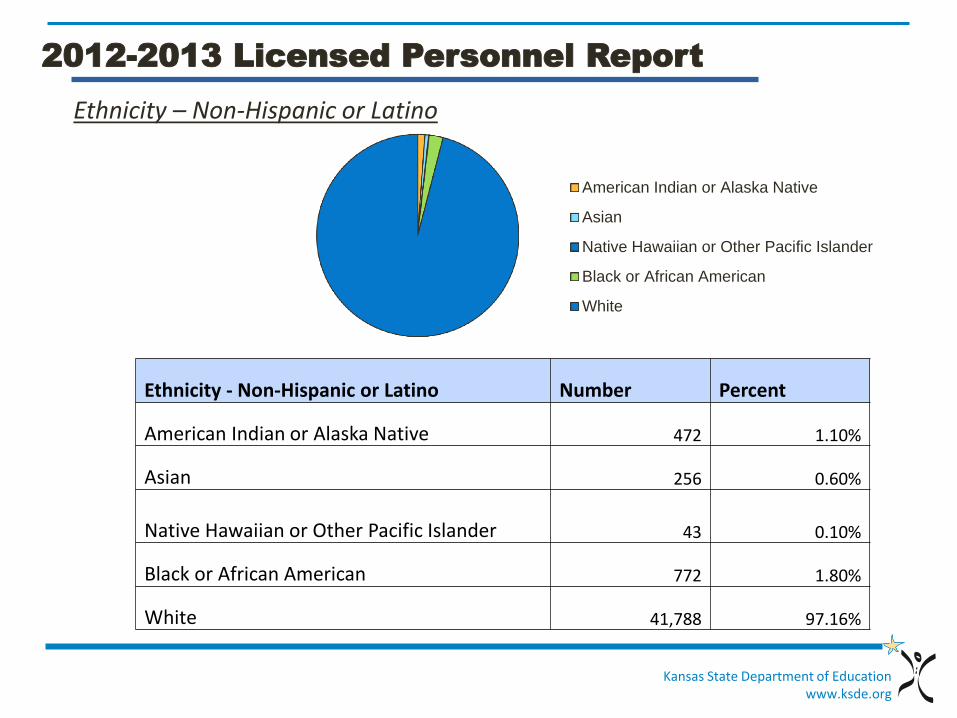
Ethnicity – Non-Hispanic or Latino
American Indian or Alaska Native
Asian
Native Hawaiian or Other Pacific Islander
Black or African American
White
Ethnicity - Non-Hispanic or Latino Number Percent
American Indian or Alaska Native 472 1.10%
Asian 256 0.60%
Native Hawaiian or Other Pacific Islander
43 0.10%
Black or African American 772 1.80%
White 41,788 97.16%
Kansas State Department of Education www.ksde.org
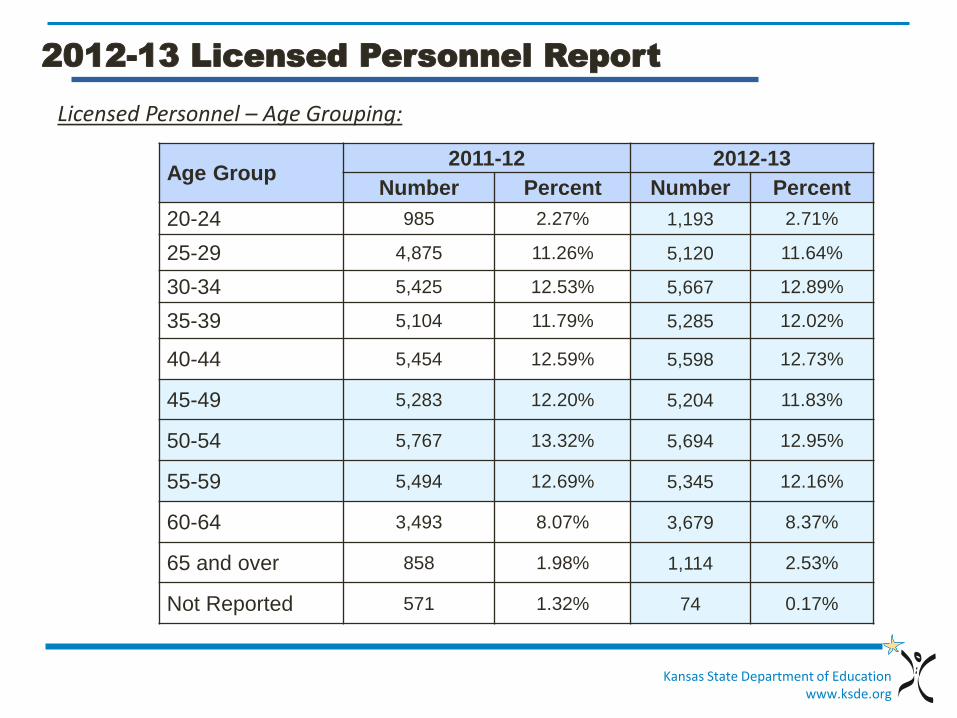
Age Group 2011-12 2012-13
Number Percent Number Percent
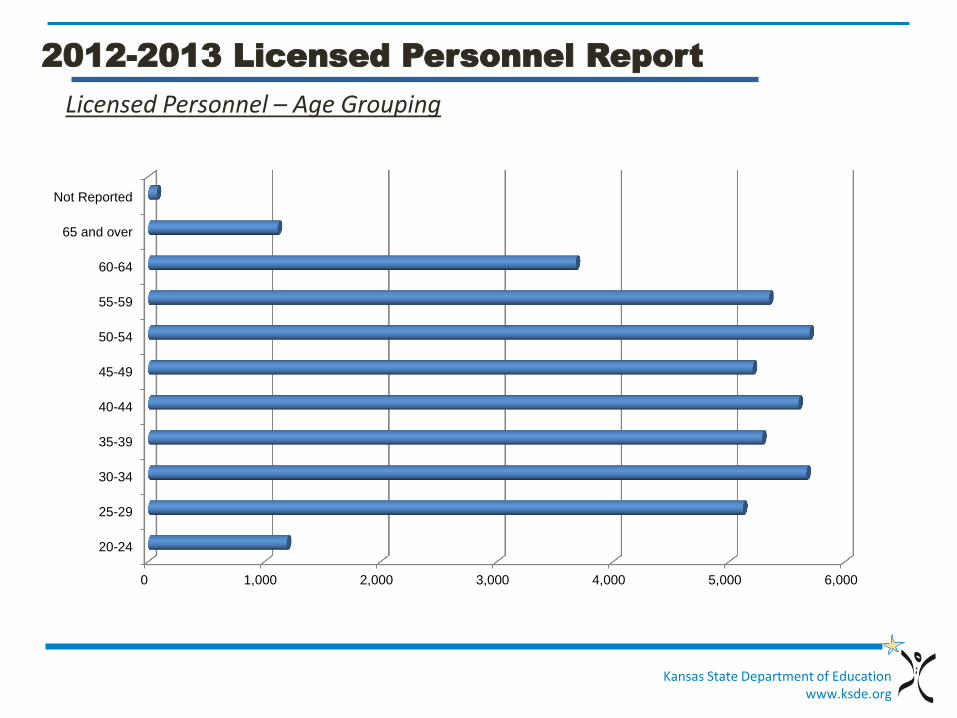
20-24 985 2.27% 1,193 2.71%
25-29 4,875 11.26% 5,120 11.64%
30-34 5,425 12.53% 5,667 12.89%
35-39 5,104 11.79% 5,285 12.02%
40-44 5,454 12.59% 5,598 12.73%
45-49 5,283 12.20% 5,204 11.83%
50-54 5,767 13.32% 5,694 12.95%
55-59 5,494 12.69% 5,345 12.16%
60-64 3,493 8.07% 3,679 8.37%
65 and over 858 1.98% 1,114 2.53%
Not Reported 571 1.32% 74 0.17%
2012-13 Licensed Personnel Report
Licensed Personnel – Age Grouping:
Kansas State Department of Education www.ksde.org
Licensed Personnel – Age Grouping
2012-2013 Licensed Personnel Report
0 1,000 2,000 3,000 4,000 5,000 6,000
20-24
25-29
30-34
35-39
40-44
45-49
50-54
55-59
60-64
65 and over
Not Reported
Kansas State Department of Education www.ksde.org
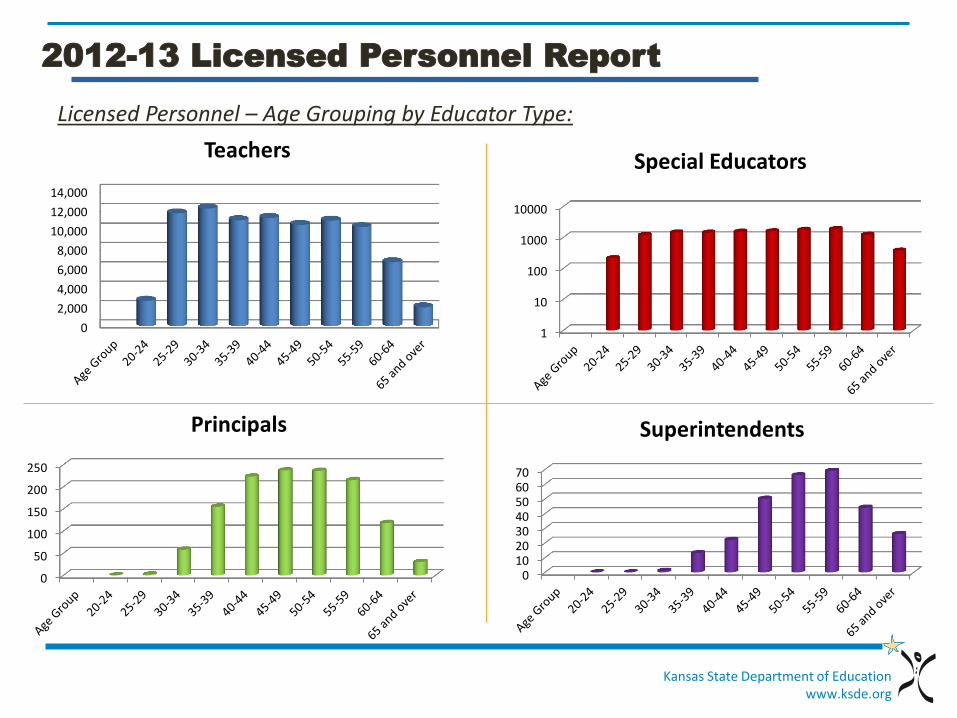
2012-13 Licensed Personnel Report
Licensed Personnel – Age Grouping by Educator Type:
0
2,000
4,000
6,000
8,000
10,000
12,000
14,000
Teachers
1
10
100
1000
10000
Special Educators
0
50
100
150
200
250
Principals
010203040506070
Superintendents
Kansas State Department of Education www.ksde.org
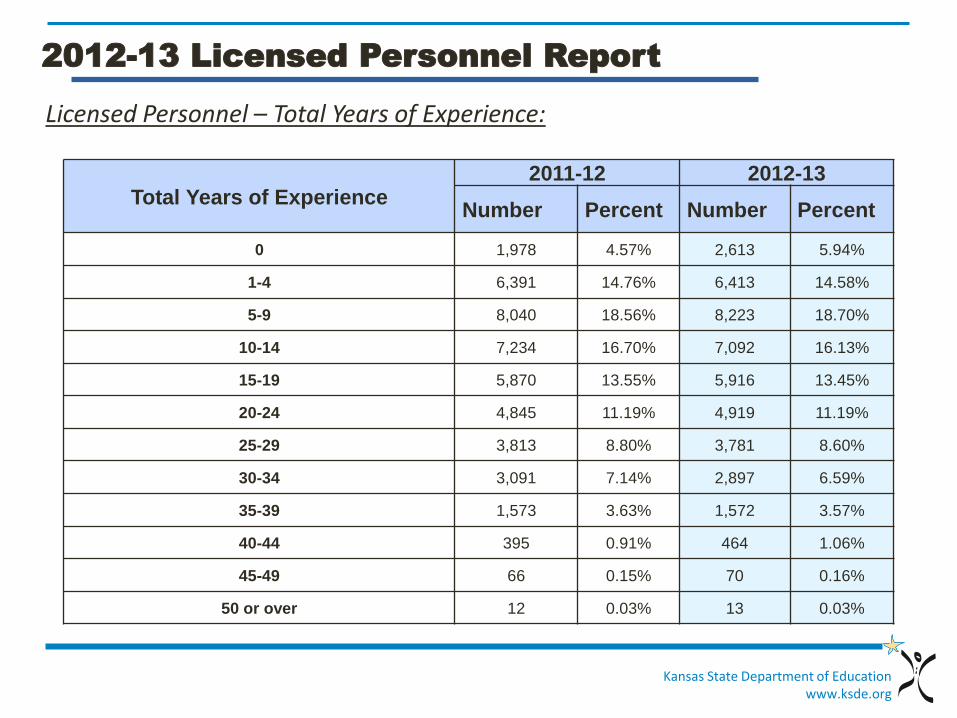
2012-13 Licensed Personnel Report
Total Years of Experience 2011-12 2012-13
Number Percent Number Percent
0 1,978 4.57% 2,613 5.94%
1-4 6,391 14.76% 6,413 14.58%
5-9 8,040 18.56% 8,223 18.70%
10-14 7,234 16.70% 7,092 16.13%
15-19 5,870 13.55% 5,916 13.45%
20-24 4,845 11.19% 4,919 11.19%
25-29 3,813 8.80% 3,781 8.60%
30-34 3,091 7.14% 2,897 6.59%
35-39 1,573 3.63% 1,572 3.57%
40-44 395 0.91% 464 1.06%
45-49 66 0.15% 70 0.16%
50 or over 12 0.03% 13 0.03%
Licensed Personnel – Total Years of Experience:
Kansas State Department of Education www.ksde.org
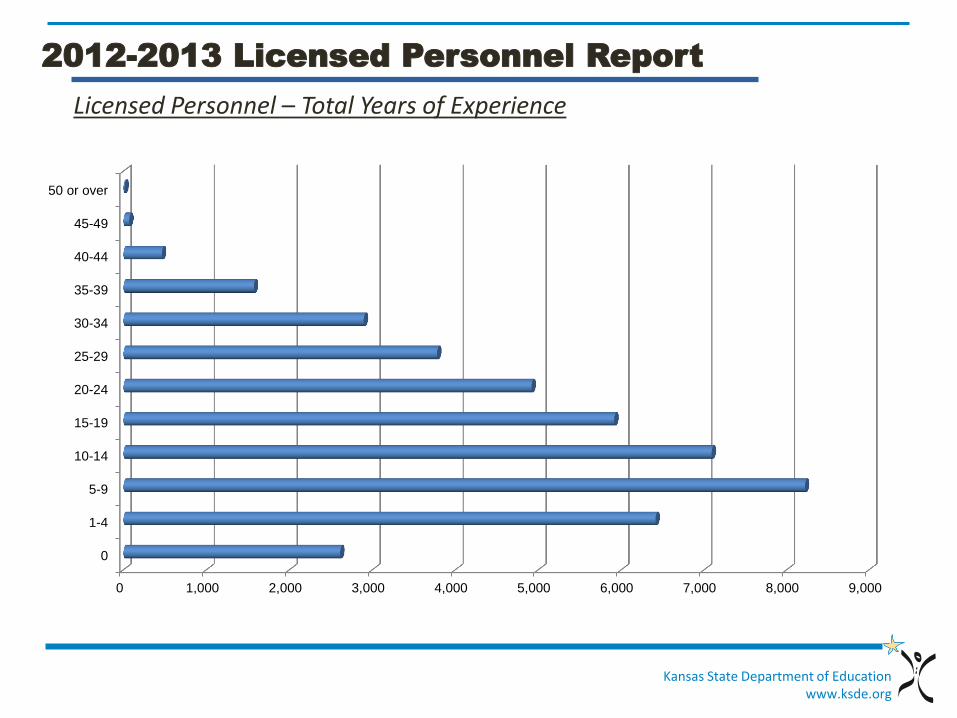
Licensed Personnel – Total Years of Experience
2012-2013 Licensed Personnel Report
0 1,000 2,000 3,000 4,000 5,000 6,000 7,000 8,000 9,000
0
1-4
5-9
10-14
15-19
20-24
25-29
30-34
35-39
40-44
45-49
50 or over
Kansas State Department of Education www.ksde.org
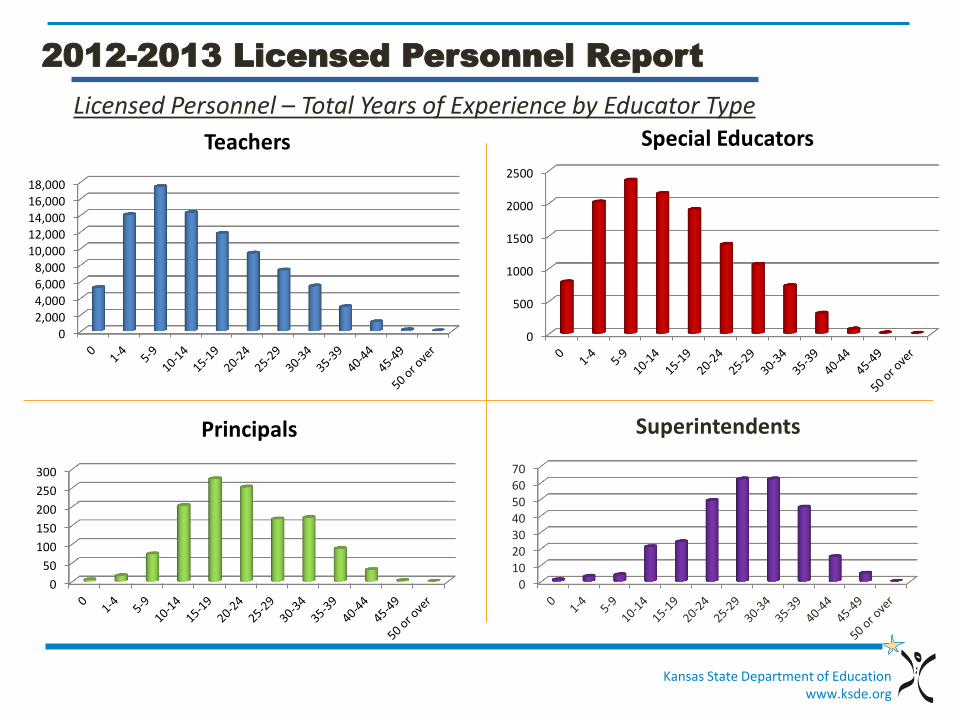
Licensed Personnel – Total Years of Experience by Educator Type
2012-2013 Licensed Personnel Report
0
2,000
4,000
6,000
8,000
10,000
12,000
14,000
16,000
18,000
Teachers
0
500
1000
1500
2000
2500
Special Educators
010203040506070
Superintendents
0
50
100
150
200
250
300
Principals
Kansas State Department of Education www.ksde.org
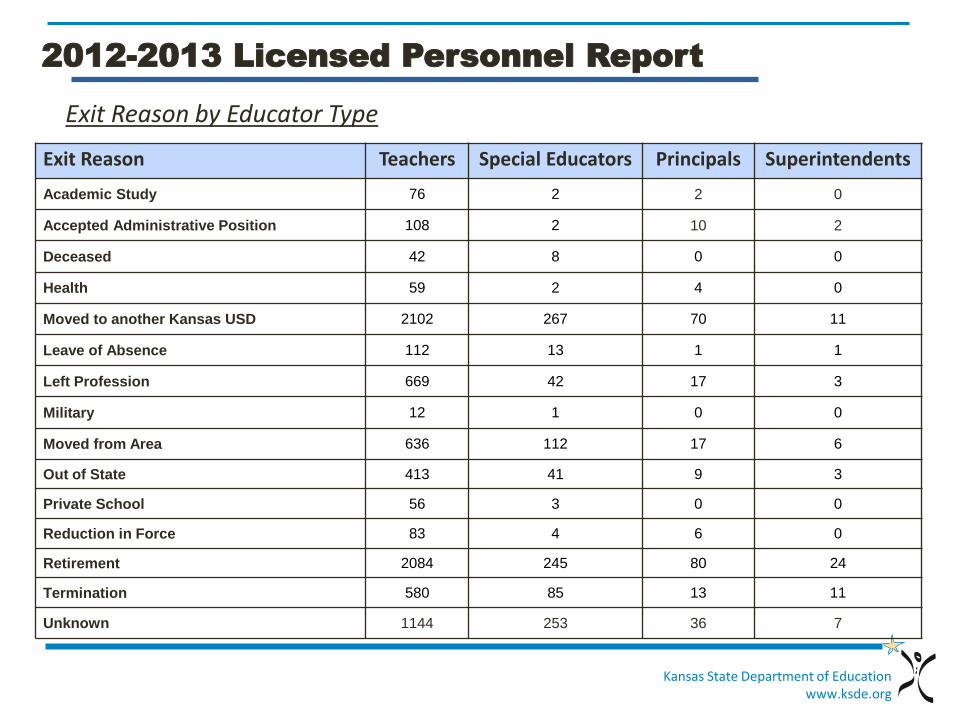
Exit Reason by Educator Type
2012-2013 Licensed Personnel Report
Exit Reason Teachers Special Educators Principals Superintendents
Academic Study 76 2 2 0
Accepted Administrative Position 108 2 10 2
Deceased 42 8 0 0
Health 59 2 4 0
Moved to another Kansas USD 2102 267 70 11
Leave of Absence 112 13 1 1
Left Profession 669 42 17 3
Military 12 1 0 0
Moved from Area 636 112 17 6
Out of State 413 41 9 3
Private School 56 3 0 0
Reduction in Force 83 4 6 0
Retirement 2084 245 80 24
Termination 580 85 13 11
Unknown 1144 253 36 7
Kansas State Department of Education www.ksde.org
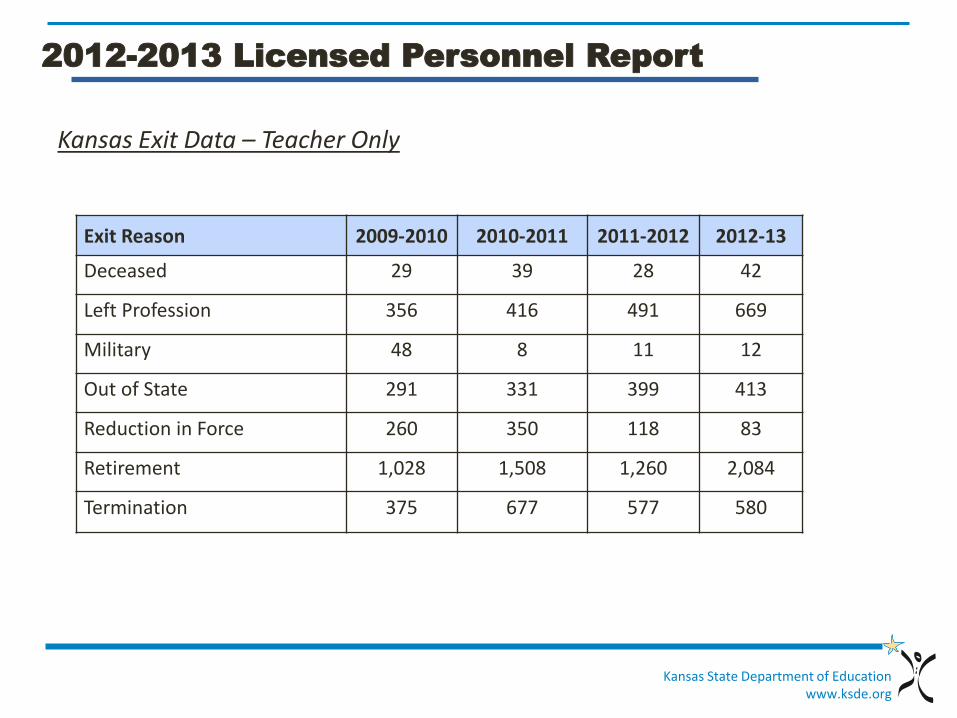
Kansas Exit Data – Teacher Only
2012-2013 Licensed Personnel Report
Exit Reason 2009-2010 2010-2011 2011-2012 2012-13
Deceased 29 39 28 42
Left Profession 356 416 491 669
Military 48 8 11 12
Out of State 291 331 399 413
Reduction in Force 260 350 118 83
Retirement 1,028 1,508 1,260 2,084
Termination 375 677 577 580
Kansas State Department of Education www.ksde.org
2012-2013 Licensed Personnel Report
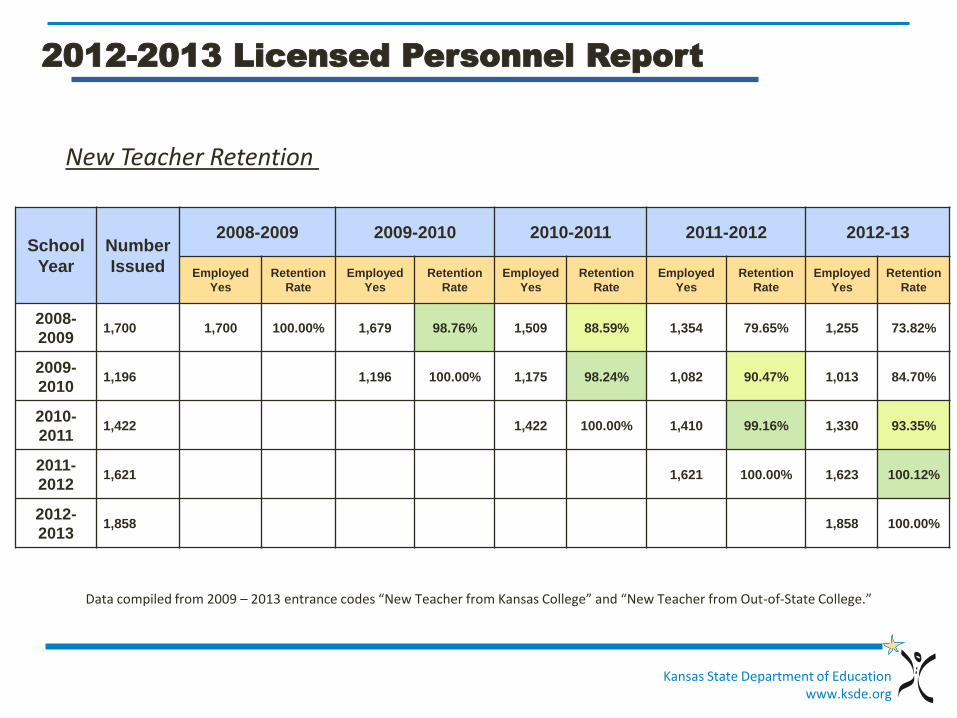
Data compiled from 2009 – 2013 entrance codes “New Teacher from Kansas College” and “New Teacher from Out-of-State College.”
New Teacher Retention
School
Year
Number
Issued
2008-2009 2009-2010 2010-2011 2011-2012 2012-13
Employed
Yes
Retention
Rate
Employed
Yes
Retention
Rate
Employed
Yes
Retention
Rate
Employed
Yes
Retention
Rate
Employed
Yes
Retention
Rate
2008-
2009 1,700 1,700 100.00% 1,679 98.76% 1,509 88.59% 1,354 79.65% 1,255 73.82%
2009-
2010 1,196 1,196 100.00% 1,175 98.24% 1,082 90.47% 1,013 84.70%
2010-
2011 1,422 1,422 100.00% 1,410 99.16% 1,330 93.35%
2011-
2012 1,621 1,621 100.00% 1,623 100.12%
2012-
2013 1,858 1,858 100.00%
Kansas State Department of Education www.ksde.org
2012-2013 Licensed Personnel Report
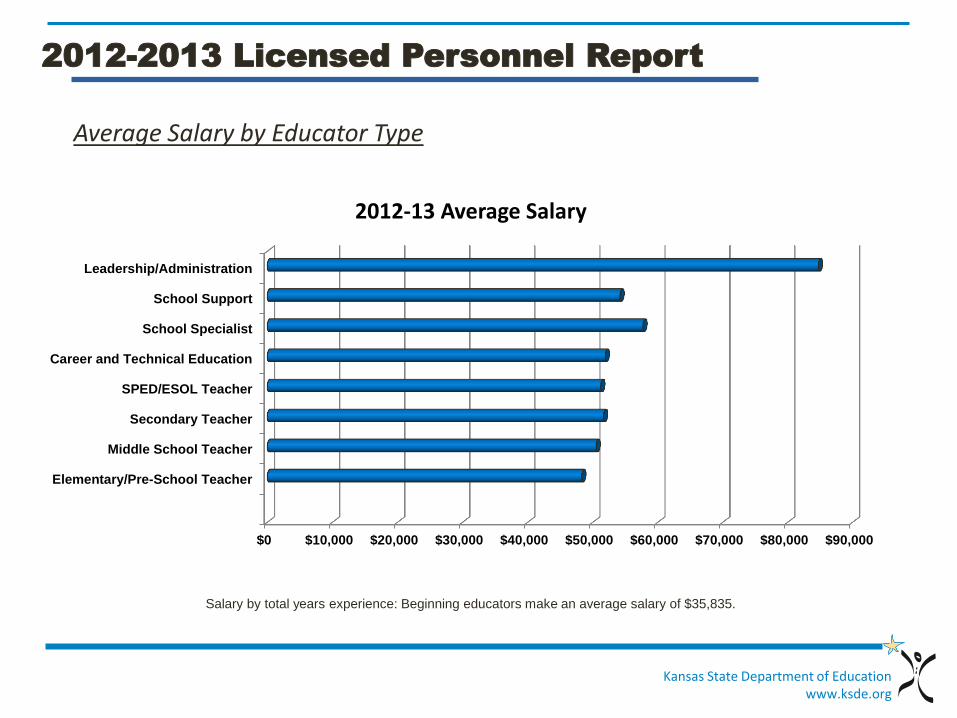
Average Salary by Educator Type
Salary by total years experience: Beginning educators make an average salary of $35,835.
$0 $10,000 $20,000 $30,000 $40,000 $50,000 $60,000 $70,000 $80,000 $90,000
Elementary/Pre-School Teacher
Middle School Teacher
Secondary Teacher
SPED/ESOL Teacher
Career and Technical Education
School Specialist
School Support
Leadership/Administration
2012-13 Average Salary
Kansas State Department of Education www.ksde.org
2012-2013 Licensed Personnel Report
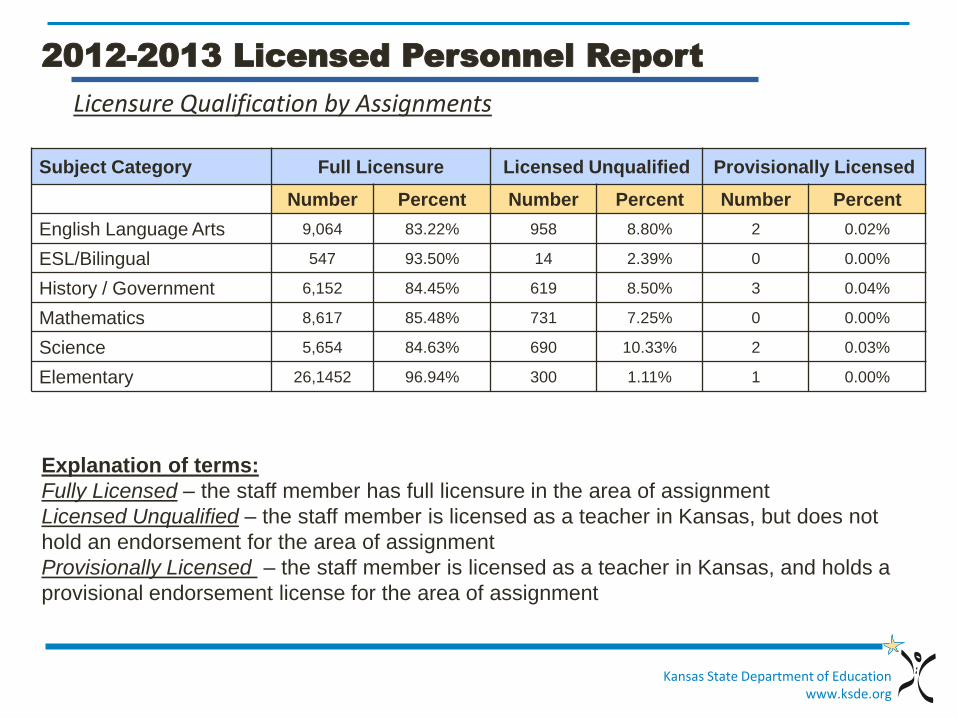
Licensure Qualification by Assignments
Subject Category Full Licensure Licensed Unqualified Provisionally Licensed
Number Percent Number Percent Number Percent
English Language Arts 9,064 83.22% 958 8.80% 2 0.02%
ESL/Bilingual 547 93.50% 14 2.39% 0 0.00%
History / Government 6,152 84.45% 619 8.50% 3 0.04%
Mathematics 8,617 85.48% 731 7.25% 0 0.00%
Science 5,654 84.63% 690 10.33% 2 0.03%
Elementary 26,1452 96.94% 300 1.11% 1 0.00%
Explanation of terms:
Fully Licensed – the staff member has full licensure in the area of assignment
Licensed Unqualified – the staff member is licensed as a teacher in Kansas, but does not
hold an endorsement for the area of assignment
Provisionally Licensed – the staff member is licensed as a teacher in Kansas, and holds a
provisional endorsement license for the area of assignment
Kansas State Department of Education www.ksde.org
2012-2013 Licensed Personnel Report
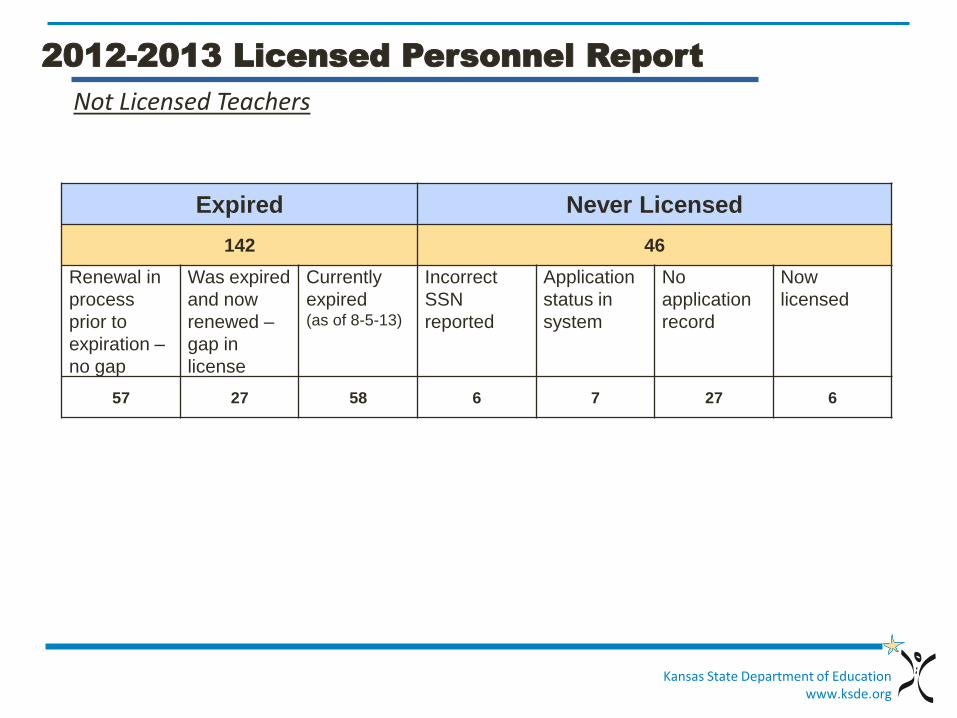
Not Licensed Teachers
Expired Never Licensed
142 46
Renewal in
process
prior to
expiration –
no gap
Was expired
and now
renewed –
gap in
license
Currently
expired (as of 8-5-13)
Incorrect
SSN
reported
Application
status in
system
No
application
record
Now
licensed
57 27 58 6 7 27 6
Kansas State Department of Education www.ksde.org
2012-2013 Licensed Personnel Report
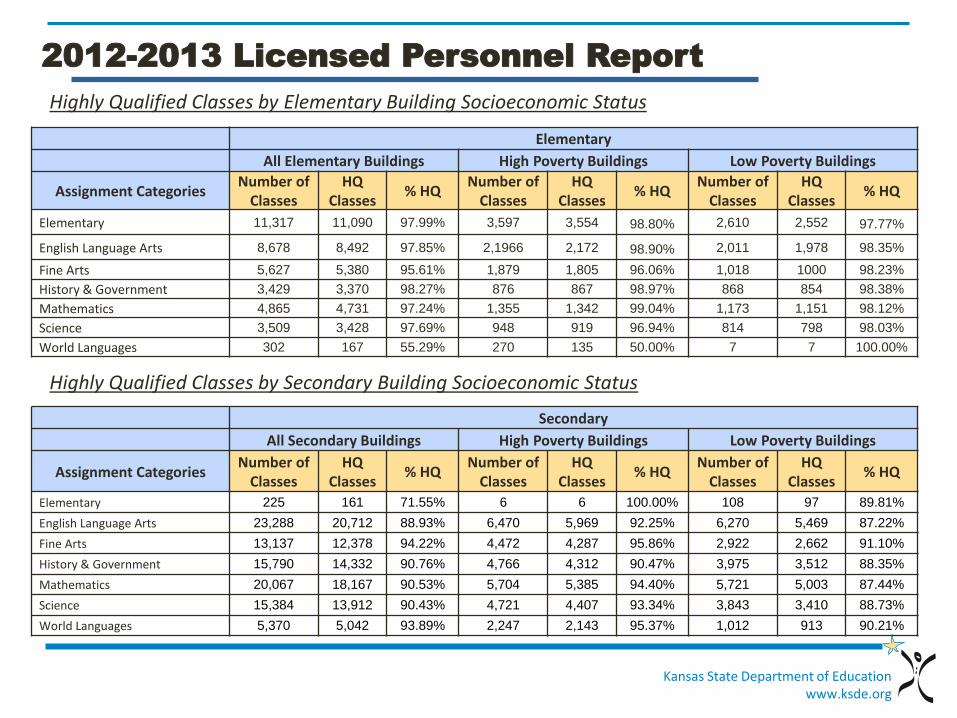
Highly Qualified Classes by Elementary Building Socioeconomic Status
Highly Qualified Classes by Secondary Building Socioeconomic Status
Elementary
All Elementary Buildings High Poverty Buildings Low Poverty Buildings
Assignment Categories Number of
Classes HQ
Classes % HQ
Number of Classes
HQ Classes
% HQ Number of
Classes HQ
Classes % HQ
Elementary 11,317 11,090 97.99% 3,597 3,554 98.80% 2,610 2,552 97.77%
English Language Arts 8,678 8,492 97.85% 2,1966 2,172 98.90% 2,011 1,978 98.35%
Fine Arts 5,627 5,380 95.61% 1,879 1,805 96.06% 1,018 1000 98.23%
History & Government 3,429 3,370 98.27% 876 867 98.97% 868 854 98.38%
Mathematics 4,865 4,731 97.24% 1,355 1,342 99.04% 1,173 1,151 98.12%
Science 3,509 3,428 97.69% 948 919 96.94% 814 798 98.03%
World Languages 302 167 55.29% 270 135 50.00% 7 7 100.00%
Secondary
All Secondary Buildings High Poverty Buildings Low Poverty Buildings
Assignment Categories Number of
Classes HQ
Classes % HQ
Number of Classes
HQ Classes
% HQ Number of
Classes HQ
Classes % HQ
Elementary 225 161 71.55% 6 6 100.00% 108 97 89.81%
English Language Arts 23,288 20,712 88.93% 6,470 5,969 92.25% 6,270 5,469 87.22%
Fine Arts 13,137 12,378 94.22% 4,472 4,287 95.86% 2,922 2,662 91.10%
History & Government 15,790 14,332 90.76% 4,766 4,312 90.47% 3,975 3,512 88.35%
Mathematics 20,067 18,167 90.53% 5,704 5,385 94.40% 5,721 5,003 87.44%
Science 15,384 13,912 90.43% 4,721 4,407 93.34% 3,843 3,410 88.73%
World Languages 5,370 5,042 93.89% 2,247 2,143 95.37% 1,012 913 90.21%
Kansas State Department of Education www.ksde.org
2012-2013 Licensed Personnel Report
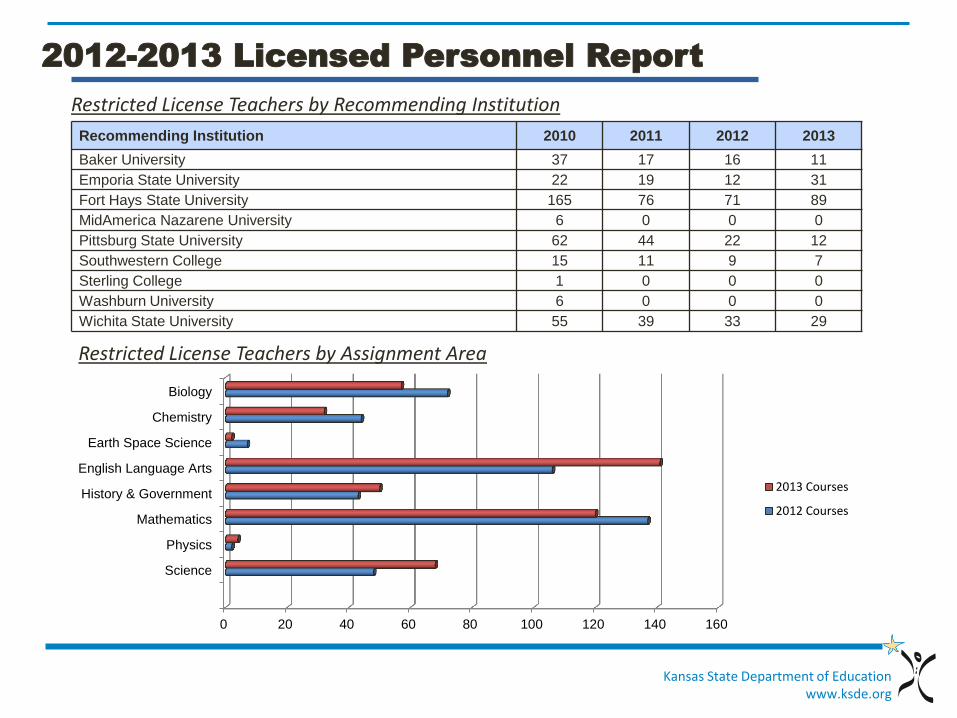
Restricted License Teachers by Recommending Institution
Restricted License Teachers by Assignment Area
Recommending Institution 2010 2011 2012 2013
Baker University 37 17 16 11
Emporia State University 22 19 12 31
Fort Hays State University 165 76 71 89
MidAmerica Nazarene University 6 0 0 0
Pittsburg State University 62 44 22 12
Southwestern College 15 11 9 7
Sterling College 1 0 0 0
Washburn University 6 0 0 0
Wichita State University 55 39 33 29
0 20 40 60 80 100 120 140 160
Science
Physics
Mathematics
History & Government
English Language Arts
Earth Space Science
Chemistry
Biology
2013 Courses
2012 Courses
Kansas State Department of Education www.ksde.org
2012-2013 Licensed Personnel Report
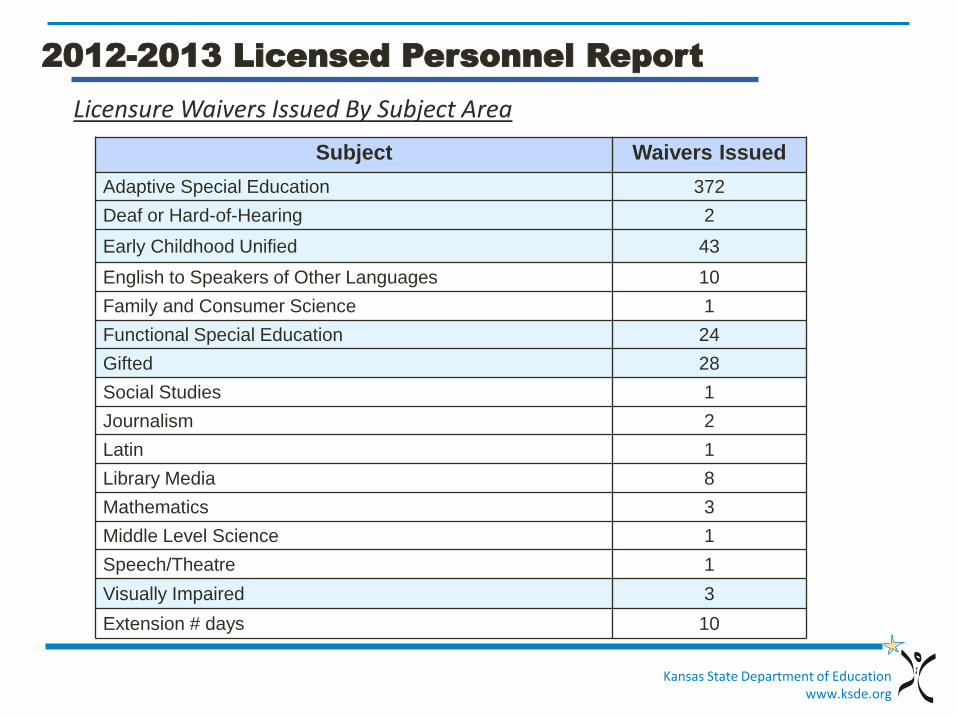
Licensure Waivers Issued By Subject Area
Subject Waivers Issued
Adaptive Special Education 372
Deaf or Hard-of-Hearing 2
Early Childhood Unified 43
English to Speakers of Other Languages 10
Family and Consumer Science 1
Functional Special Education 24
Gifted 28
Social Studies 1
Journalism 2
Latin 1
Library Media 8
Mathematics 3
Middle Level Science 1
Speech/Theatre 1
Visually Impaired 3
Extension # days 10
Kansas State Department of Education www.ksde.org
2012-2013 Licensed Personnel Report
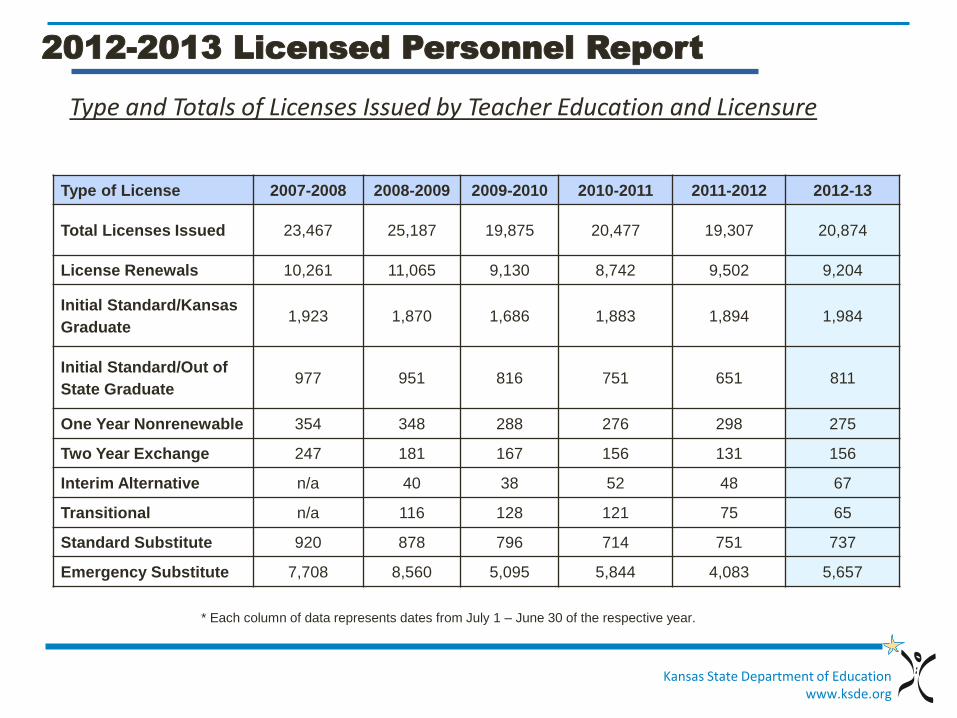
Type and Totals of Licenses Issued by Teacher Education and Licensure
* Each column of data represents dates from July 1 – June 30 of the respective year.
Type of License 2007-2008 2008-2009 2009-2010 2010-2011 2011-2012 2012-13
Total Licenses Issued 23,467 25,187 19,875 20,477 19,307 20,874
License Renewals 10,261 11,065 9,130 8,742 9,502 9,204
Initial Standard/Kansas
Graduate 1,923 1,870 1,686 1,883 1,894 1,984
Initial Standard/Out of
State Graduate 977 951 816 751 651 811
One Year Nonrenewable 354 348 288 276 298 275
Two Year Exchange 247 181 167 156 131 156
Interim Alternative n/a 40 38 52 48 67
Transitional n/a 116 128 121 75 65
Standard Substitute 920 878 796 714 751 737
Emergency Substitute 7,708 8,560 5,095 5,844 4,083 5,657